Effective Pavement Marking Practices for Sealcoat and Hot-Mix
106
Technical Report Documentation Page 1. Report No. FHWA/TX-03/0-4150-4 2. Government Accession No. 3. Recipient's Catalog No. 5. Report Date August 2003 4. Title and Subtitle EFFECTIVE PAVEMENT MARKING PRACTICES FOR SEALCOAT AND HOT-MIX ASPHALT PAVEMENTS 6. Performing Organization Code 7. Author(s) Timothy J. Gates, H. Gene Hawkins, Jr., and Elisabeth R. Rose 8. Performing Organization Report No. Report 0-4150-4 10. Work Unit No. (TRAIS) 9. Performing Organization Name and Address Texas Transportation Institute The Texas A&M University System College Station, Texas 77843-3135 11. Contract or Grant No. Project No. 0-4150 13. Type of Report and Period Covered Research: September 2000 – August 2003 12. Sponsoring Agency Name and Address Texas Department of Transportation Research and Technology Implementation Office P. O. Box 5080 Austin, Texas 78763-5080 14. Sponsoring Agency Code 15. Supplementary Notes Research performed in cooperation with the Texas Department of Transportation and the U.S. Department of Transportation, Federal Highway Administration. Research Project Title: Evaluation of Pavement Marking Effectiveness 16. Abstract This report describes the tasks of research conducted to identify effective pavement marking practices for sealcoat and hot-mix asphalt (HMAC) pavements in Texas. The researchers reviewed literature, determined current Texas Department of Transportation (TxDOT) and alternative pavement marking practices, and evaluated various pavement marking treatments in the field. The researchers identified few shortcomings related to pavement marking practices on HMAC pavement surfaces. However, for sealcoat pavement surfaces, numerous opportunities for improving pavement marking quality were identified. Based on the research findings, numerous recommendations were developed, which pertain to thermoplastic application on sealcoat and HMAC, waterbased paint application on sealcoat, sealcoat aggregates, surface glass beads, and field inspection. The recommendations include: • Apply thermoplastic at a minimum thickness of 100 mil for all longitudinal pavement markings on new sealcoat when no other durable marking exists. • Apply thermoplastic at a maximum thickness of 90 mil for all longitudinal pavement markings on HMAC when no other durable marking exists. • Waterbased paint may be used on a new sealcoat surface in either of the following situations: o as temporary pavement marking for up to six months, or o as surface primer prior to thermoplastic application. 17. Key Words Pavement Marking, Thermoplastic, Sealcoat, HMAC, Retroreflectivity, Glass Bead 18. Distribution Statement No restrictions. This document is available to the public through NTIS: National Technical Information Service 5285 Port Royal Road Springfield, Virginia 22161 19. Security Classif.(of this report) Unclassified 20. Security Classif.(of this page) Unclassified 21. No. of Pages 106 22. Price Form DOT F 1700.7 (8-72) Reproduction of completed page authorized
Transcript of Effective Pavement Marking Practices for Sealcoat and Hot-Mix

Technical Report Documentation Page 1. Report No. FHWA/TX-03/0-4150-4
2. Government Accession No.
3. Recipient's Catalog No. 5. Report Date August 2003
4. Title and Subtitle EFFECTIVE PAVEMENT MARKING PRACTICES FOR SEALCOAT AND HOT-MIX ASPHALT PAVEMENTS
6. Performing Organization Code
7. Author(s) Timothy J. Gates, H. Gene Hawkins, Jr., and Elisabeth R. Rose
8. Performing Organization Report No. Report 0-4150-4
10. Work Unit No. (TRAIS)
9. Performing Organization Name and Address Texas Transportation Institute The Texas A&M University System College Station, Texas 77843-3135
11. Contract or Grant No. Project No. 0-4150 13. Type of Report and Period Covered Research: September 2000 – August 2003
12. Sponsoring Agency Name and Address Texas Department of Transportation Research and Technology Implementation Office P. O. Box 5080 Austin, Texas 78763-5080
14. Sponsoring Agency Code
15. Supplementary Notes Research performed in cooperation with the Texas Department of Transportation and the U.S. Department of Transportation, Federal Highway Administration. Research Project Title: Evaluation of Pavement Marking Effectiveness 16. Abstract This report describes the tasks of research conducted to identify effective pavement marking practices for sealcoat and hot-mix asphalt (HMAC) pavements in Texas. The researchers reviewed literature, determined current Texas Department of Transportation (TxDOT) and alternative pavement marking practices, and evaluated various pavement marking treatments in the field. The researchers identified few shortcomings related to pavement marking practices on HMAC pavement surfaces. However, for sealcoat pavement surfaces, numerous opportunities for improving pavement marking quality were identified. Based on the research findings, numerous recommendations were developed, which pertain to thermoplastic application on sealcoat and HMAC, waterbased paint application on sealcoat, sealcoat aggregates, surface glass beads, and field inspection. The recommendations include: • Apply thermoplastic at a minimum thickness of 100 mil for all longitudinal pavement markings on new
sealcoat when no other durable marking exists. • Apply thermoplastic at a maximum thickness of 90 mil for all longitudinal pavement markings on HMAC
when no other durable marking exists. • Waterbased paint may be used on a new sealcoat surface in either of the following situations:
o as temporary pavement marking for up to six months, or o as surface primer prior to thermoplastic application.
17. Key Words Pavement Marking, Thermoplastic, Sealcoat, HMAC, Retroreflectivity, Glass Bead
18. Distribution Statement No restrictions. This document is available to the public through NTIS: National Technical Information Service 5285 Port Royal Road Springfield, Virginia 22161
19. Security Classif.(of this report) Unclassified
20. Security Classif.(of this page) Unclassified
21. No. of Pages 106
22. Price
Form DOT F 1700.7 (8-72) Reproduction of completed page authorized

EFFECTIVE PAVEMENT MARKING PRACTICES FOR SEALCOAT
AND HOT-MIX ASPHALT PAVEMENTS
by
Timothy J. Gates Associate Transportation Researcher
Texas Transportation Institute
H. Gene Hawkins, Jr., Ph.D., P.E. Division Head
Texas Transportation Institute
and
Elisabeth R. Rose Assistant Transportation Researcher
Texas Transportation Institute
Report 0-4150-4 Project Number 0-4150
Research Project Title: Evaluation of Pavement Marking Effectiveness
Sponsored by the Texas Department of Transportation
In Cooperation with the U.S. Department of Transportation Federal Highway Administration
August 2003
TEXAS TRANSPORTATION INSTITUTE The Texas A&M University System College Station, Texas 77843-3135


v
DISCLAIMER
The contents of this report reflect the views of the authors, who are responsible for the
facts and the accuracy of the data presented herein. The contents do not necessarily reflect the
official view or policies of the Federal Highway Administration (FHWA) or the Texas
Department of Transportation (TxDOT). The United States Government and the State of Texas
do not endorse products or manufacturers. Trade or manufacturers’ names may appear herein
solely because they are considered essential to the object of this report. This report does not
constitute a standard, specification, or regulation. The engineer in charge was H. Gene Hawkins,
Jr., P.E. #61509.

vi
ACKNOWLEDGMENTS
This project was conducted in cooperation with TxDOT and the FHWA. The authors
would like to thank the project director, Greg Brinkmeyer of the TxDOT Traffic Operations
Division, for providing guidance and expertise on this project. Special recognition is also
extended to Norman Hogue, a graduate assistant at the Texas Transportation Institute (TTI),
whose countless hours of data collection provided a majority of the data reported herein.
Numerous other individuals also deserve recognition for their efforts, including:
• Brian Stanford, TxDOT Traffic Operations Division;
• Herb Smart, TxDOT Construction Division – Materials Section;
• Jerry Howell, TxDOT Construction Division – Materials Section;
• Larry Colclasure, TxDOT Waco District;
• Kirk Barnes, TxDOT Bryan District;
• Tommy Moehlman, TxDOT Bryan District;
• Kim Soucek, TxDOT Hearne Area Office;
• Peter Eng, TxDOT Tyler District;
• Larry White, TxDOT Tyler District;
• Kevin Goforth, Potters Industries;
• David Hernsberger, TxDOT Beaumont District;
• Dan Walker, TTI Operations and Design Division; and
• Michael Maresh, TTI Operations and Design Division.

vii
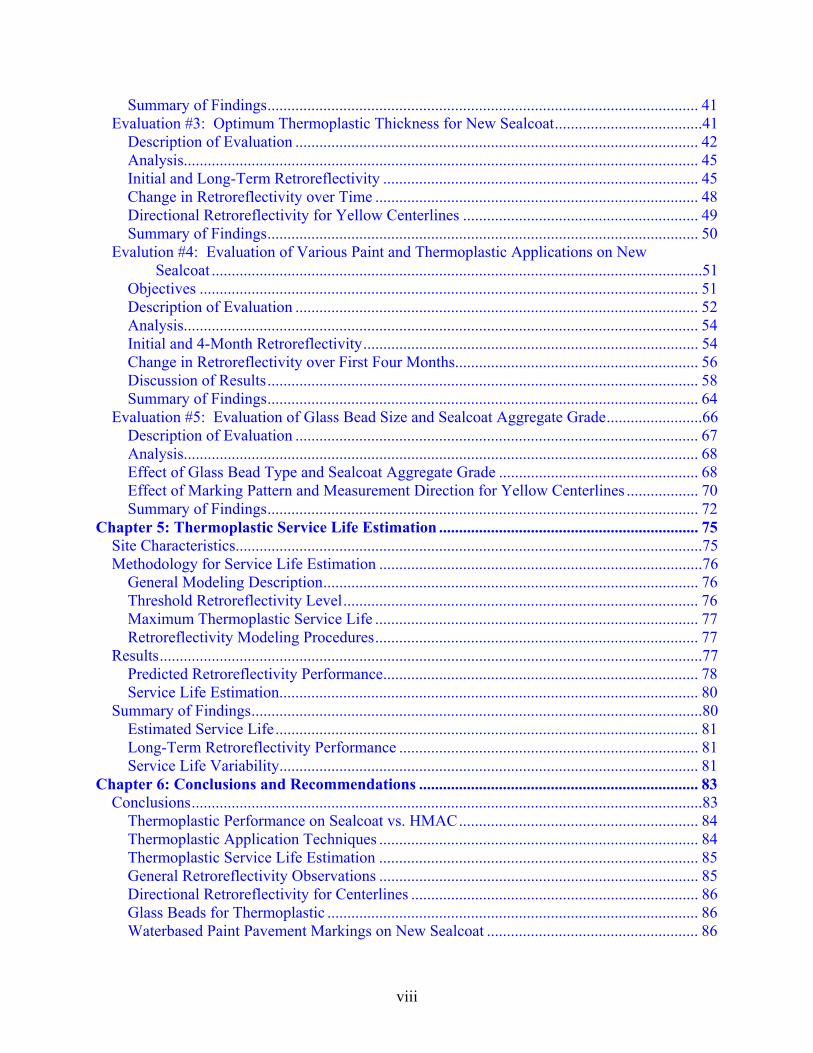
TABLE OF CONTENTS
Page List of Figures................................................................................................................................ x List of Tables ............................................................................................................................... xii Chapter 1: Introduction ............................................................................................................... 1
Texas Thermoplastic....................................................................................................................2 Problem Statement .......................................................................................................................3 Objective and Tasks.....................................................................................................................4
Chapter 2: Literature Review...................................................................................................... 7 Visibility Needs of Drivers ..........................................................................................................7
Minimum Necessary Driver Preview Time ............................................................................ 8 Pavement Marking Visibility.......................................................................................................8 Pavement Marking Retroreflectivity............................................................................................9
Properties ................................................................................................................................ 9 Retroreflectivity Measurement ............................................................................................. 10 Standard Measurement Geometry......................................................................................... 10 Human Factors Research ...................................................................................................... 11 Minimum In-Service Retroreflectivity Guidelines ............................................................... 12
Pavement Marking Performance................................................................................................13 Sealcoated Pavement Surface Characteristics ...................................................................... 13 Expected Service Life of Thermoplastic Pavement Markings ............................................. 14
Literature Summary ...................................................................................................................15 Chapter 3: Identification of Major Issues ................................................................................ 17
Survey of TxDOT Districts........................................................................................................17 Survey Results ...................................................................................................................... 17
Preliminary Pavement Marking Investigations..........................................................................20 Pavement Marking Conferences ................................................................................................22 Summary of Issues.....................................................................................................................23
Issues Related to Sealcoat Surface Texture .......................................................................... 23 Issues Related to Asphalt Binder Materials for Sealcoat...................................................... 27
Chapter 4: Field Evaluation of Pavement Marking Applications.......................................... 31 Evaluation Methodology............................................................................................................31 Evaluation #1: Pavement Surface Texture Investigations ........................................................32
Description of Evaluation ..................................................................................................... 32 Analysis................................................................................................................................. 33 Results................................................................................................................................... 34 Summary of Findings............................................................................................................ 35
Evaluation #2: Effect of Pavement Surface Texture on Thermoplastic Retroreflectivity ..............................................................................................................35
Description of Evaluation ..................................................................................................... 35 Analysis................................................................................................................................. 37 Initial and Long-Term Retroreflectivity ............................................................................... 37 Percent Change in Retroreflectivity...................................................................................... 39 Discussion of Results............................................................................................................ 39
viii
Summary of Findings............................................................................................................ 41 Evaluation #3: Optimum Thermoplastic Thickness for New Sealcoat.....................................41
Description of Evaluation ..................................................................................................... 42 Analysis................................................................................................................................. 45 Initial and Long-Term Retroreflectivity ............................................................................... 45 Change in Retroreflectivity over Time ................................................................................. 48 Directional Retroreflectivity for Yellow Centerlines ........................................................... 49 Summary of Findings............................................................................................................ 50
Evalution #4: Evaluation of Various Paint and Thermoplastic Applications on New Sealcoat ...........................................................................................................................51
Objectives ............................................................................................................................. 51 Description of Evaluation ..................................................................................................... 52 Analysis................................................................................................................................. 54 Initial and 4-Month Retroreflectivity.................................................................................... 54 Change in Retroreflectivity over First Four Months............................................................. 56 Discussion of Results............................................................................................................ 58 Summary of Findings............................................................................................................ 64
Evaluation #5: Evaluation of Glass Bead Size and Sealcoat Aggregate Grade........................66 Description of Evaluation ..................................................................................................... 67 Analysis................................................................................................................................. 68 Effect of Glass Bead Type and Sealcoat Aggregate Grade .................................................. 68 Effect of Marking Pattern and Measurement Direction for Yellow Centerlines .................. 70 Summary of Findings............................................................................................................ 72
Chapter 5: Thermoplastic Service Life Estimation ................................................................. 75 Site Characteristics.....................................................................................................................75 Methodology for Service Life Estimation .................................................................................76
General Modeling Description.............................................................................................. 76 Threshold Retroreflectivity Level......................................................................................... 76 Maximum Thermoplastic Service Life ................................................................................. 77 Retroreflectivity Modeling Procedures................................................................................. 77
Results........................................................................................................................................77 Predicted Retroreflectivity Performance............................................................................... 78 Service Life Estimation......................................................................................................... 80
Summary of Findings.................................................................................................................80 Estimated Service Life.......................................................................................................... 81 Long-Term Retroreflectivity Performance ........................................................................... 81 Service Life Variability......................................................................................................... 81
Chapter 6: Conclusions and Recommendations ...................................................................... 83 Conclusions................................................................................................................................83
Thermoplastic Performance on Sealcoat vs. HMAC............................................................ 84 Thermoplastic Application Techniques ................................................................................ 84 Thermoplastic Service Life Estimation ................................................................................ 85 General Retroreflectivity Observations ................................................................................ 85 Directional Retroreflectivity for Centerlines ........................................................................ 86 Glass Beads for Thermoplastic ............................................................................................. 86 Waterbased Paint Pavement Markings on New Sealcoat ..................................................... 86
ix
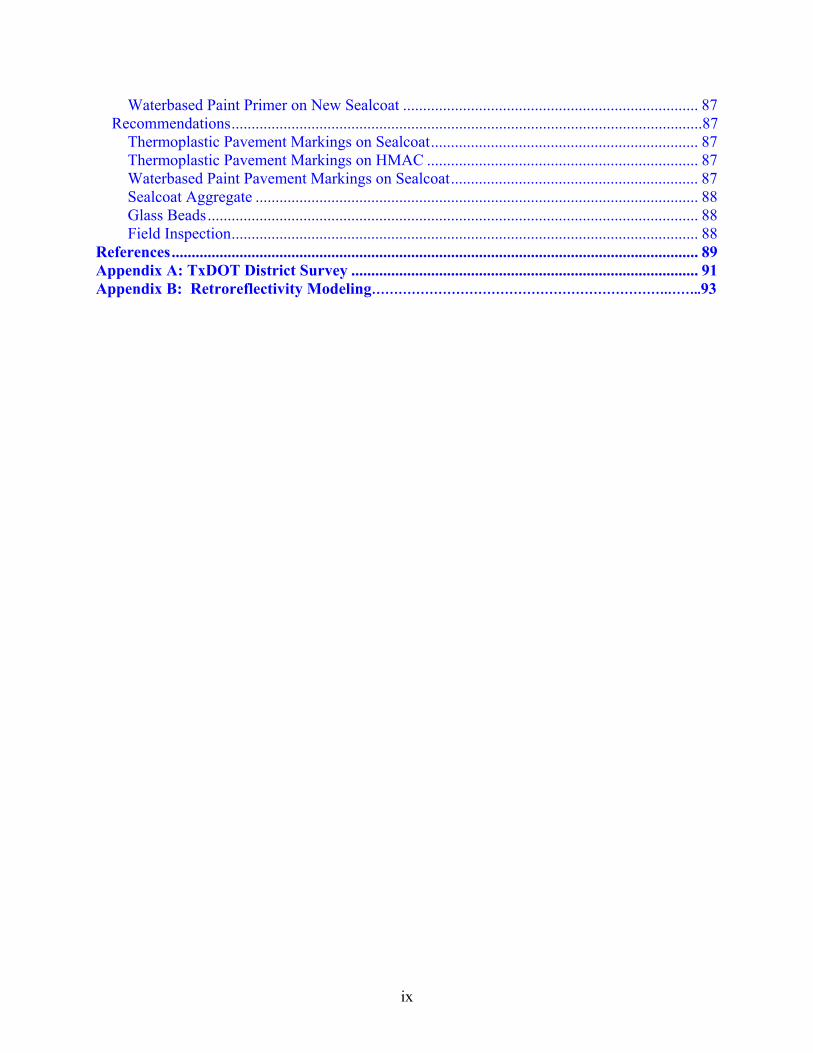
Waterbased Paint Primer on New Sealcoat .......................................................................... 87 Recommendations......................................................................................................................87
Thermoplastic Pavement Markings on Sealcoat................................................................... 87 Thermoplastic Pavement Markings on HMAC .................................................................... 87 Waterbased Paint Pavement Markings on Sealcoat.............................................................. 87 Sealcoat Aggregate ............................................................................................................... 88 Glass Beads........................................................................................................................... 88 Field Inspection..................................................................................................................... 88
References.................................................................................................................................... 89 Appendix A: TxDOT District Survey ....................................................................................... 91 Appendix B: Retroreflectivity Modeling………………………………………………………….……..93
x
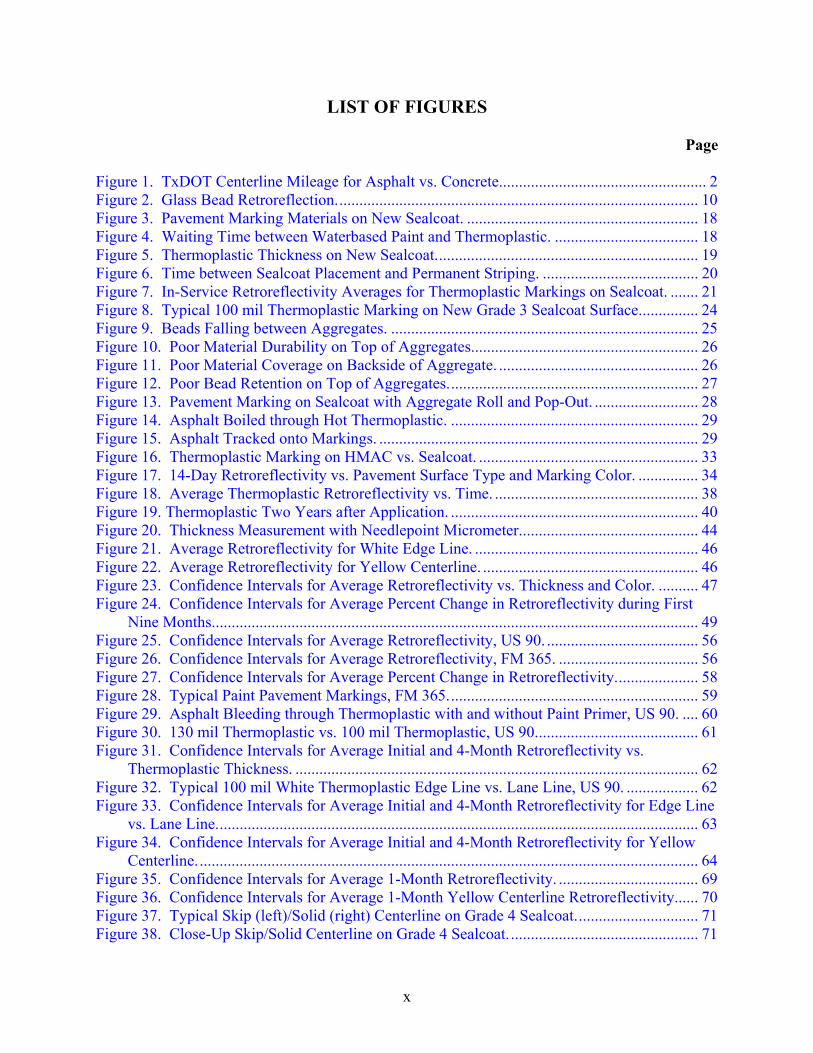
LIST OF FIGURES Page Figure 1. TxDOT Centerline Mileage for Asphalt vs. Concrete.................................................... 2 Figure 2. Glass Bead Retroreflection........................................................................................... 10 Figure 3. Pavement Marking Materials on New Sealcoat. .......................................................... 18 Figure 4. Waiting Time between Waterbased Paint and Thermoplastic. .................................... 18 Figure 5. Thermoplastic Thickness on New Sealcoat.................................................................. 19 Figure 6. Time between Sealcoat Placement and Permanent Striping. ....................................... 20 Figure 7. In-Service Retroreflectivity Averages for Thermoplastic Markings on Sealcoat. ....... 21 Figure 8. Typical 100 mil Thermoplastic Marking on New Grade 3 Sealcoat Surface............... 24 Figure 9. Beads Falling between Aggregates. ............................................................................. 25 Figure 10. Poor Material Durability on Top of Aggregates......................................................... 26 Figure 11. Poor Material Coverage on Backside of Aggregate. .................................................. 26 Figure 12. Poor Bead Retention on Top of Aggregates............................................................... 27 Figure 13. Pavement Marking on Sealcoat with Aggregate Roll and Pop-Out. .......................... 28 Figure 14. Asphalt Boiled through Hot Thermoplastic. .............................................................. 29 Figure 15. Asphalt Tracked onto Markings. ................................................................................ 29 Figure 16. Thermoplastic Marking on HMAC vs. Sealcoat. ....................................................... 33 Figure 17. 14-Day Retroreflectivity vs. Pavement Surface Type and Marking Color. ............... 34 Figure 18. Average Thermoplastic Retroreflectivity vs. Time. ................................................... 38 Figure 19. Thermoplastic Two Years after Application. .............................................................. 40 Figure 20. Thickness Measurement with Needlepoint Micrometer............................................. 44 Figure 21. Average Retroreflectivity for White Edge Line. ........................................................ 46 Figure 22. Average Retroreflectivity for Yellow Centerline. ...................................................... 46 Figure 23. Confidence Intervals for Average Retroreflectivity vs. Thickness and Color. .......... 47 Figure 24. Confidence Intervals for Average Percent Change in Retroreflectivity during First
Nine Months.......................................................................................................................... 49 Figure 25. Confidence Intervals for Average Retroreflectivity, US 90. ...................................... 56 Figure 26. Confidence Intervals for Average Retroreflectivity, FM 365. ................................... 56 Figure 27. Confidence Intervals for Average Percent Change in Retroreflectivity..................... 58 Figure 28. Typical Paint Pavement Markings, FM 365............................................................... 59 Figure 29. Asphalt Bleeding through Thermoplastic with and without Paint Primer, US 90. .... 60 Figure 30. 130 mil Thermoplastic vs. 100 mil Thermoplastic, US 90......................................... 61 Figure 31. Confidence Intervals for Average Initial and 4-Month Retroreflectivity vs.
Thermoplastic Thickness. ..................................................................................................... 62 Figure 32. Typical 100 mil White Thermoplastic Edge Line vs. Lane Line, US 90. .................. 62 Figure 33. Confidence Intervals for Average Initial and 4-Month Retroreflectivity for Edge Line
vs. Lane Line......................................................................................................................... 63 Figure 34. Confidence Intervals for Average Initial and 4-Month Retroreflectivity for Yellow
Centerline.............................................................................................................................. 64 Figure 35. Confidence Intervals for Average 1-Month Retroreflectivity. ................................... 69 Figure 36. Confidence Intervals for Average 1-Month Yellow Centerline Retroreflectivity...... 70 Figure 37. Typical Skip (left)/Solid (right) Centerline on Grade 4 Sealcoat............................... 71 Figure 38. Close-Up Skip/Solid Centerline on Grade 4 Sealcoat................................................ 71
xi
Figure 39. Retroreflectivity Modeling for White Thermoplastic on HMAC............................... 78 Figure 40. Retroreflectivity Modeling for White Thermoplastic on PCC. .................................. 79 Figure 41. Retroreflectivity Modeling for White Thermoplastic on Sealcoat. ............................ 79 Figure B1. Retroreflectivity Modeling for Yellow Thermoplastic on HMAC............................ 93 Figure B2. Retroreflectivity Modeling for Yellow Thermoplastic on Sealcoat…………………….93
xii
LIST OF TABLES Page Table 1. TxDOT Centerline Mileage by Roadway Class and Surface Type. ................................ 2 Table 2. Characteristics of TxDOT Alkyd Thermoplastic for Sealcoat Application. .................... 3 Table 3. Pavement Marking Issues Related to Sealcoat Surface Texture.................................... 25 Table 4. Pavement Marking Issues Related to Sealcoat Binder Material.................................... 28 Table 5. Overview of Pavement Marking Field Evaluations....................................................... 31 Table 6. Attributes of Evaluation #1............................................................................................ 33 Table 7. Retroreflectivity Findings for Evaluation #1. ................................................................ 34 Table 8. Attributes of Evaluation #2............................................................................................ 36 Table 9. Site Characteristics. ....................................................................................................... 37 Table 10. Average and Standard Deviation for Retroreflectivity. ............................................... 38 Table 11. Cumulative Percent Change in Retroreflectivity. ........................................................ 39 Table 12. Attributes of Evaluation #3.......................................................................................... 42 Table 13. Characteristics of Striping Treatment Sections. .......................................................... 43 Table 14. Average Retroreflectivity for White Edge Line. ......................................................... 45 Table 15. Average Retroreflectivity for Yellow Centerline. ....................................................... 45 Table 16. Average Change in Retroreflectivity for White Edge Line. ........................................ 48 Table 17. Average Change in Retroreflectivity for Yellow Centerline. ...................................... 48 Table 18. Attributes of Evaluation #4.......................................................................................... 52 Table 19. Characteristics of Striping Treatment Sections. .......................................................... 53 Table 20. Characteristics of Retroreflectivity Evaluation............................................................ 54 Table 21. Average Initial and 4-Month Retroreflectivity, US 90. ............................................... 55 Table 22. Average Initial and 4-Month Retroreflectivity, FM 365. ............................................ 55 Table 23. Average Change in Retroreflectivity over First Four Months, US 90......................... 57 Table 24. Average Change in Retroreflectivity over First Four Months, FM 365. ..................... 57 Table 25. Attributes of Evaluation #5.......................................................................................... 67 Table 26. Characteristics of Striping Treatment Sections. .......................................................... 67 Table 27. Average 1-Month Retroreflectivity for 100 mil Thermoplastic. ................................. 69 Table 28. Site Characteristics for Thermoplastic Retroreflectivity Monitoring. ......................... 75 Table 29. Estimated Thermoplastic Service Life Based on Pavement Surface and Color. .......... 80 Table B1. Retroreflectivity Modeling and Service Life Prediction………..…………………….……94
1
CHAPTER 1: INTRODUCTION
In September 2000, the Texas Transportation Institute (TTI) began a three-year research
project sponsored by the Texas Department of Transportation to evaluate pavement markings.
The goal of Project 0-4150, Evaluation of Pavement Marking Effectiveness, was to improve the
performance and cost-effectiveness of pavement markings used on Texas highways. This report
will focus on the performance of pavement markings on asphalt-based pavements1, particularly
pavement surface treatments (e.g., sealcoat, chipseal).
The performance of long-line pavement markings on surface treated roadway surfaces
(herein referred to as sealcoat) has been a major issue for TxDOT. Sealcoated pavement surfaces
are the most economical pavement surface to construct and do not require removal of the
underlying roadway surface. They are, however, only designed for a seven-year service life2.
Because of the relatively low cost per mile of sealcoat construction, the surface is commonly
used for low to medium traffic volume highways in rural areas. In Texas, most rural farm-to-
market highways (FM) and some rural state and U.S. highways are maintained with sealcoat
surfaces. Sealcoated surfaces are uncommon in urban areas where high traffic volumes, high
speeds, and high truck volumes warrant smoother and longer lasting surfaces, such as Portland
cement concrete (PCC) or hot-mix asphalt concrete (HMAC).
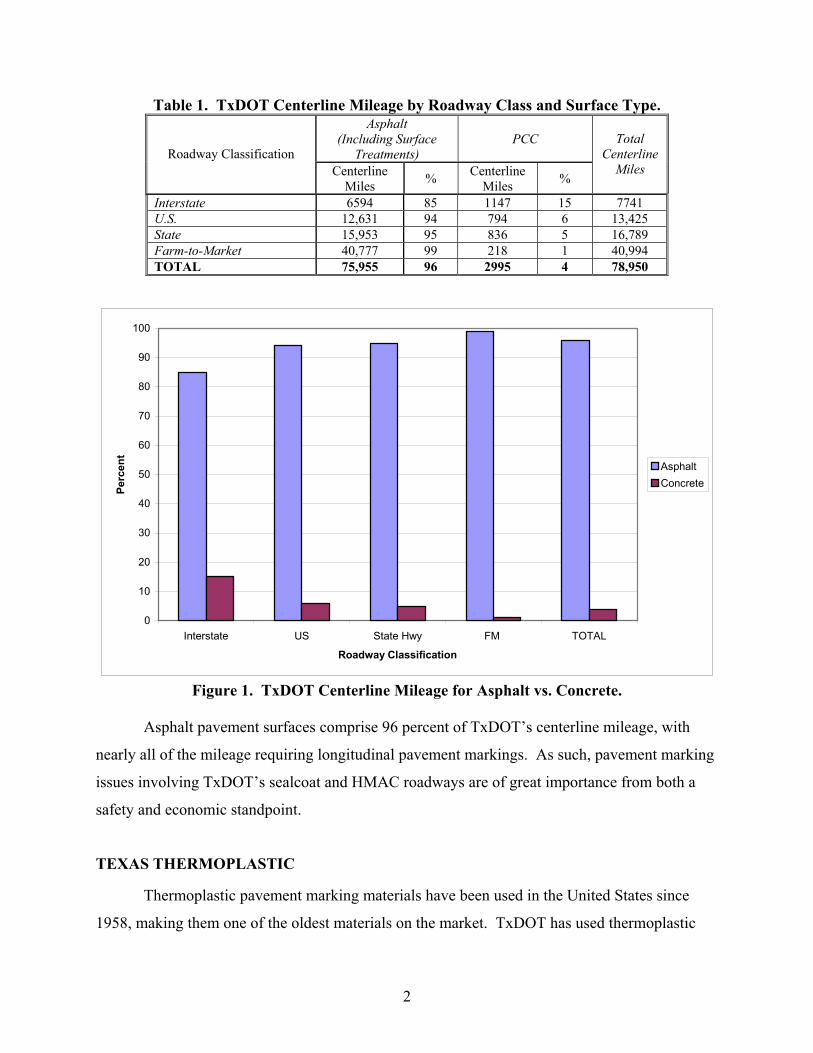
Table 1 and Figure 1 display TxDOT centerline mileage and percentages by pavement
surface type and roadway classification (1). Please note that sealcoat surfaces are included in the
“asphalt” category.
1 TTI research pertaining to pavement markings on Portland cement concrete surfaces has been documented in TTI report number FHWA/TX-03/4150-2, entitled Effective Pavement Marking Materials and Applications for Portland Cement Concrete Roadways. 2 Source: Telephone conversation with TxDOT Construction Division personnel.
2
Table 1. TxDOT Centerline Mileage by Roadway Class and Surface Type. Asphalt
(Including Surface Treatments)
PCC Roadway Classification
Centerline Miles % Centerline
Miles %
Total Centerline
Miles
Interstate 6594 85 1147 15 7741 U.S. 12,631 94 794 6 13,425 State 15,953 95 836 5 16,789 Farm-to-Market 40,777 99 218 1 40,994 TOTAL 75,955 96 2995 4 78,950
0
10
20
30
40
50
60
70
80
90
100
Interstate US State Hwy FM TOTAL
Roadway Classification
Perc
ent
AsphaltConcrete
Figure 1. TxDOT Centerline Mileage for Asphalt vs. Concrete.
Asphalt pavement surfaces comprise 96 percent of TxDOT’s centerline mileage, with
nearly all of the mileage requiring longitudinal pavement markings. As such, pavement marking
issues involving TxDOT’s sealcoat and HMAC roadways are of great importance from both a
safety and economic standpoint.
TEXAS THERMOPLASTIC
Thermoplastic pavement marking materials have been used in the United States since
1958, making them one of the oldest materials on the market. TxDOT has used thermoplastic
3
pavement markings on all types of pavement surfaces for many years. Use of thermoplastic has
increased over the past 10 years, likely attributed to recent TxDOT initiatives calling for a
reduction in the use of paint and ceramic buttons. Consequently, most of the longitudinal
pavement markings on TxDOT roadways are thermoplastic.
Thermoplastic pavement markings are the most heavily used pavement marking materials
in Texas for a number of reasons, including:
• material availability,
• contractor availability,
• reasonable cost, and
• good performance.
Thermoplastic pavement marking materials generally show superior performance on
HMAC roadways, although issues have been raised with the durability of thermoplastic
pavement markings on both sealcoat and concrete surfaces in Texas.
TxDOT classifies thermoplastic materials as a Type I pavement marking material.
TxDOT currently uses a “recipe” alkyd thermoplastic specification (DMS 8220) for standard
sprayed thermoplastic applications. Although other thermoplastic formulations and application
processes are allowed and are sometimes used by TxDOT districts through special provision or
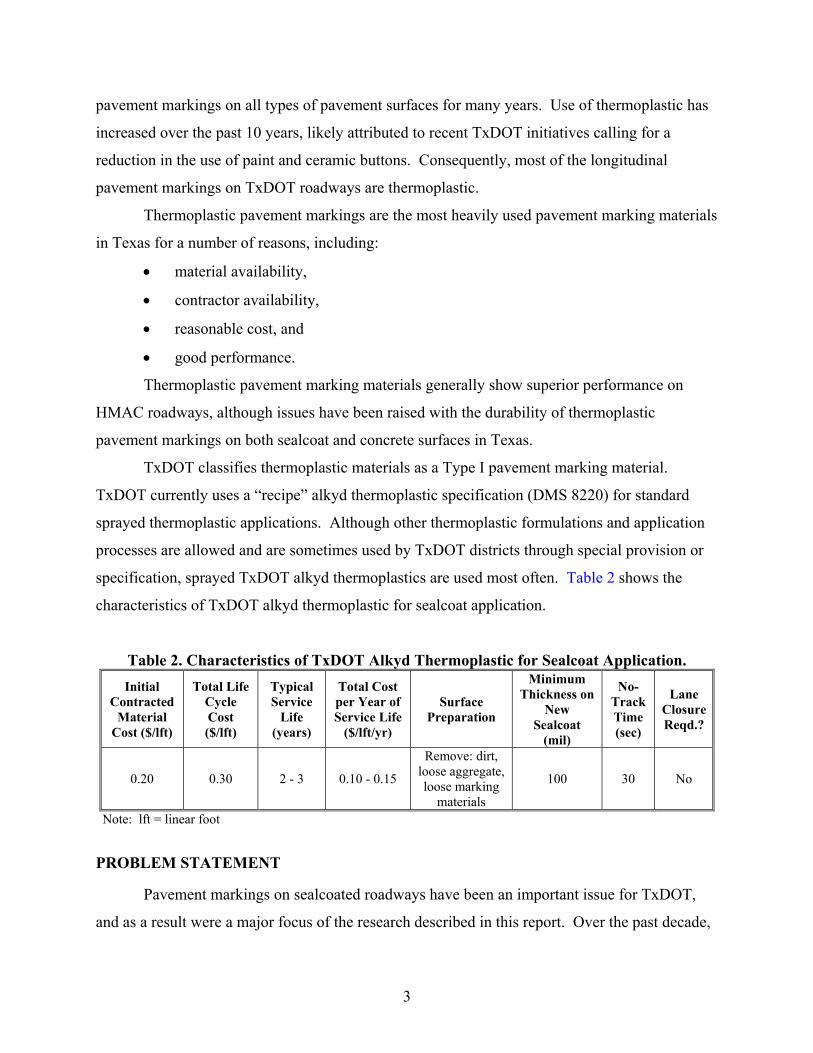
specification, sprayed TxDOT alkyd thermoplastics are used most often. Table 2 shows the
characteristics of TxDOT alkyd thermoplastic for sealcoat application.
Table 2. Characteristics of TxDOT Alkyd Thermoplastic for Sealcoat Application. Initial
Contracted Material
Cost ($/lft)
Total Life Cycle Cost ($/lft)
Typical Service
Life (years)
Total Cost per Year of Service Life
($/lft/yr)
Surface Preparation
Minimum Thickness on
New Sealcoat
(mil)
No-Track Time (sec)
Lane Closure Reqd.?
0.20 0.30 2 - 3 0.10 - 0.15
Remove: dirt, loose aggregate, loose marking
materials
100 30 No
Note: lft = linear foot
PROBLEM STATEMENT
Pavement markings on sealcoated roadways have been an important issue for TxDOT,
and as a result were a major focus of the research described in this report. Over the past decade,

4
most TxDOT districts have experienced various problems with the retroreflectivity and
durability of pavement marking materials on newly sealcoated roadway surfaces. A major issue
is that longline thermoplastic pavement markings placed on newly sealcoated roadways often do
not maintain suitable levels of retroreflectivity throughout their intended service lives. Multiple
in-service retroreflectivity investigations for thermoplastic on various sealcoats support this
claim.
OBJECTIVE AND TASKS
The focus of the research performed and described herein involved identification of the
problems with pavement markings on new sealcoats and HMAC surfaces, causes of these
problems, and determination of feasible solutions. Early in this project, it became evident to TTI
researchers that a majority of the research effort would focus solely on sealcoat pavement
marking issues, which is therefore reflected in this report.
Prior to the start of this research project, most pavement marking evaluations performed
in Texas were purely subjective, with little scientific evaluation. TTI researchers conducted
several tasks to help TxDOT identify the pavement marking material applications that are best
suited for sealcoated and HMAC roadways. These tasks are listed below and are described in
more detail in the following section:
• Review the available literature.
• Survey TxDOT districts to determine common pavement marking issues and
practices.
• Identify performance of in-service pavement markings.
• Facilitate open-dialogue meetings between TxDOT staff, contractors, and industry
personnel to identify issues and corresponding solutions related to pavement
markings in Texas.
• Perform field evaluations of various pavement marking applications on sealcoat and
HMAC pavements.
• Develop service life estimations for thermoplastic applications on sealcoat, HMAC,
and PCC roadways.
This report details the findings resulting from the major tasks. The first four tasks in the
preceding list were important for identification of the pavement marking treatments evaluated in

5
the field and are detailed in Chapters 2 and 3. The final tasks in the list comprised a majority of
the data collection and analyses performed in this project and are described in Chapters 4 and 5.
Conclusions and recommendations for pavement markings on sealcoated and HMAC pavements
in Texas are made in Chapter 6.

7
CHAPTER 2: LITERATURE REVIEW
Researchers performed a review of the literature to identify previous research pertaining
to relevant delineation-related issues, including:
• driver visibility needs,
• pavement marking retroreflectivity,
• recommendations for minimum levels of pavement marking retroreflectivity, and
• performance of various pavement marking materials.
The literature review included reports sponsored and/or published by state and federal
transportation agencies. The researchers were particularly interested in research performed
within the last decade, as pavement marking materials are modified frequently.
VISIBILITY NEEDS OF DRIVERS
Prior to analyzing the performance of various pavement marking applications in the field,
it was necessary to first establish the delineation needs of drivers. In a general sense, the ability
of a driver to safely operate a vehicle is based on the driver’s perception of a situation, level of
alertness, the amount of information available, and the driver’s information assimilation
capabilities (2). Although the transportation profession can do little to control a driver’s level of
alertness or information-processing capabilities, necessary roadway information can be
communicated through traffic control devices, including pavement markings. Pavement
markings are critical for roadway navigation because they provide a simple, continuous stream of
roadway information to the driver’s central vision. To be effective, pavement markings must (2):
• present the appropriate visual clues far enough in advance of a given situation to
allow for suitable reaction time to occur, and
• be visible in the periphery to aid in moment-to-moment lane navigation.
This is especially true at night when the visibility of the roadway and surrounding
features drops dramatically, causing motorists to rely heavily on pavement marking visibility for
delineation cues.

8
Minimum Necessary Driver Preview Time
The nighttime preview time (or distance) provided by a pavement marking is the most
commonly used method of quantifying the visibility performance of pavement markings. For
pavement markings to be effective, the preview distance that they provide must be large enough
to allow most drivers sufficient time to perform all of the necessary delineation-related tasks
including (2):
• detect change in delineation,
• recognize message being conveyed,
• decide appropriate reaction,
• initiate response, and
• complete vehicle maneuver.
Research has suggested that as a minimum, 3 to 3.65 seconds of delineation preview is
necessary to complete these tasks and allow for some margin of driver error and driver comfort.
As a result, researchers have recommended that delineation devices provide a minimum of 3 to
3.65 seconds of preview time for long-range guidance under normal driving conditions (2,3).
PAVEMENT MARKING VISIBILITY
The ability to actually see a pavement marking at night depends on many factors,
including:
• intensity of the light source,
• amount of light actually striking the pavement marking,
• retroreflective characteristics of the pavement marking, and
• visual characteristics of the driver.
Not all drivers require the same amount of light from pavement markings to safely
navigate. For example, older drivers or drivers with visual impairments often need more light to
see the same distance as a younger or non-impaired driver. Cognitive capabilities, which include
attention and information processing, are known to decline with age. Cognitive declines often
result in drivers having longer reaction times and increased driver workload. Declines in motor
skills increase the amount of time needed to react to stimuli and perform a driving maneuver.
9
Similarly, roadway characteristics influence the amount of light needed. The speed of the
vehicle influences the amount of light needed because at higher speeds, a greater distance is
needed to make a maneuver, thereby requiring earlier detection. Roadway lighting and
retroreflective raised pavement markers both aid in the navigation tasks and reduce the amount
of light needed from the pavement markings for safe navigation.
A number of environmental factors can also reduce the visibility of pavement markings,
including inclement weather, moisture on the marking surface, surface glare, and fog.
Considering all factors that influence marking visibility, retroreflectivity is the only factor that
transportation agencies can realistically control.
PAVEMENT MARKING RETROREFLECTIVITY
Pavement markings are designed to reflect a portion of the headlamp illumination back to
the driver’s eyes. This phenomenon is referred to as retroreflection. Both the Texas and Federal
Manuals on Uniform Traffic Control Devices (MUTCD) require that all pavement markings be
retroreflective if they are to be visible at night, unless ambient illumination assures that the
markings are adequately visible (4,5). In addition, both manuals state that all markings on
Interstate highways shall be retroreflective.
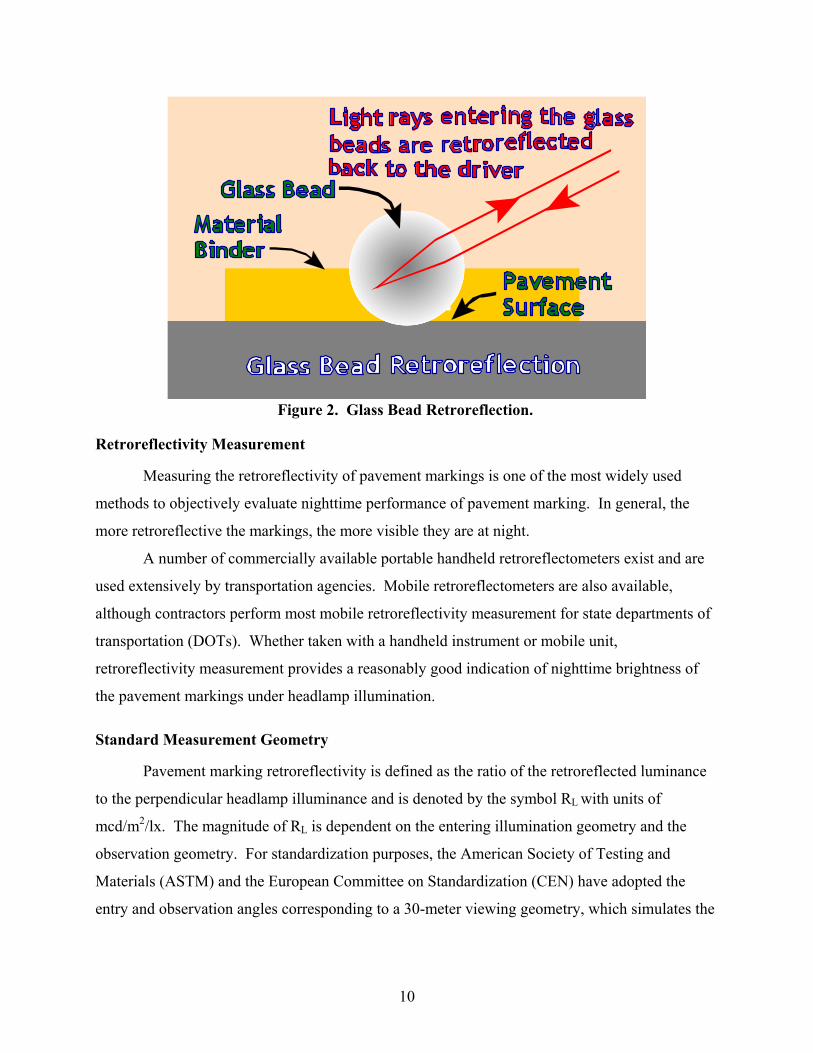
Properties
Retroreflection in pavement markings is provided through the use of glass beads
embedded into the surface of the marking. Without the glass beads providing retroreflection, a
much larger proportion of the light striking the marking would be diffused in all directions. The
effectiveness of the glass beads as retroreflectors depends on:
• depth of bead embedment,
• bead dispersion,
• refractive index of the beads, and
• reflective characteristics of the binder material.
Figure 2 illustrates how retroreflection occurs within a pavement marking structure.
10
Figure 2. Glass Bead Retroreflection.
Retroreflectivity Measurement
Measuring the retroreflectivity of pavement markings is one of the most widely used
methods to objectively evaluate nighttime performance of pavement marking. In general, the
more retroreflective the markings, the more visible they are at night.
A number of commercially available portable handheld retroreflectometers exist and are
used extensively by transportation agencies. Mobile retroreflectometers are also available,
although contractors perform most mobile retroreflectivity measurement for state departments of
transportation (DOTs). Whether taken with a handheld instrument or mobile unit,
retroreflectivity measurement provides a reasonably good indication of nighttime brightness of
the pavement markings under headlamp illumination.
Standard Measurement Geometry
Pavement marking retroreflectivity is defined as the ratio of the retroreflected luminance
to the perpendicular headlamp illuminance and is denoted by the symbol RL with units of
mcd/m2/lx. The magnitude of RL is dependent on the entering illumination geometry and the
observation geometry. For standardization purposes, the American Society of Testing and
Materials (ASTM) and the European Committee on Standardization (CEN) have adopted the
entry and observation angles corresponding to a 30-meter viewing geometry, which simulates the
11
performance of a marking that is located 30 meters (98.4 feet) in front of the vehicle3. Most
common handheld and mobile retroreflectometers simulate this measurement geometry. All
retroreflectivity data collected and reported herein were measured with a 30-meter handheld
retroreflectometer.
Human Factors Research
Numerous research evaluations have investigated the relationship between nighttime
driver visibility needs and the retroreflectivity of pavement markings. While there is a definite
correlation between pavement marking retroreflectivity and the visibility of the markings, the
major issue that each research study has attempted to address is: “How bright is bright enough?”
The findings from many existing literature sources suggest that this issue is difficult to resolve,
as a wide variety of minimum pavement marking retroreflectivity values have been suggested.
The literature search uncovered two main types of retroreflectivity-based human factors
evaluations:
• subjective evaluations and
• detection distance evaluations.
Subjective evaluations generally involved subjects driving or being driven through
various sections of highway at night and rating the quality of the pavement markings in each
section. The subjective evaluations found in the literature have produced recommended
minimum retroreflectivity values ranging from approximately 80 to 120 mcd/m2/lx (6,7,8). One
criticism of subjective evaluations is that they do not necessarily correlate to the preview
distances provided by the marking in question (9). In other words, drivers do not necessarily
know the amount of pavement marking brightness actually needed for safe navigation.
Detection distance evaluations involve subjects driving or being driven through multiple
sections of pavement markings, each with prescribed levels of retroreflectivity. The subjects call
out when they are able to first detect the beginning or end of a given section of marking. The
resulting detection distances and corresponding retroreflectivity levels are then compared to the
minimum necessary detection distances, which are based on the operating speed and minimum
necessary preview time (generally accepted as 3 to 3.65 seconds). Detection distance data have
also been used in the development and calibration of various pavement marking visibility
3 See ASTM E1710-97 and ASTM D6359-98.
12
models. Based on detection distance field studies and modeling efforts, the range of acceptable
levels of pavement marking retroreflectivity is approximately 400 to 515 mcd/m2/lx for older
drivers traveling at 70 mph on dark highways without retroreflective raised pavement markings
RRPMs (10,11). Research has also shown that a fully marked road consisting of both edge lines
and centerlines of similar retroreflectivity, on the average provides end detection distances that
are about twice as long as the end detection distances that can be achieved with a centerline
alone (12). This finding suggests that end detection distances on a fully marked road are
governed by the visibility of the edge lines, thereby supporting their use for roadway visibility
enhancement.
It is also widely recognized that older drivers require higher quality pavement markings
than do younger drivers. Zwahlen and Schnell found that on a fully marked high-speed roadway,
a 62 year old driver requires approximately twice the retroreflectivity as a 22 year old in order to
have the same detection distances (10). Similarly, younger drivers have been shown to possess
detection distances that are on average 55 percent longer than older drivers (11). Additionally, it
also appears that pavement marking visibility for older drivers is affected more by the visual
angle of the markings than by the brightness, suggesting that wider markings may be more
detectible by the elderly.
Minimum In-Service Retroreflectivity Guidelines
Although both the Texas and Federal MUTCDs require that all pavement markings be
retroreflective if they are to be visible at night (4,5), no numerical values are currently associated
with this requirement. FHWA is currently developing minimum retroreflectivity standards, as
directed by the United States Congress.
As a result of the Congressional directive, FHWA has developed draft recommendations
for minimum retroreflectivity values for various roadway scenarios. These draft
recommendations are largely based on the previously mentioned research studies. FHWA-
recommended retroreflectivity levels for high-speed roadways without RRPMs or continuous
roadway lighting are 150 mcd/m2/lx for white and 100 mcd/m2/lx for yellow (13). Where
additional roadway visibility is provided at night by retroreflective raised pavement markings or
continuous roadway lighting, lower retroreflectivity levels may be acceptable. These draft
recommendations currently do not constitute a standard and exist for purposes of providing

13
guidance to agency personnel. It is not yet known when nationwide compliance with federal
minimum retroreflectivity standards will go into effect, although many state transportation
agencies have already begun monitoring the retroreflectivity of their pavement markings.
Extensive European research has resulted in a similar recommended minimum in-service
retroreflectivity level of 100 mcd/m2/lx (14).
PAVEMENT MARKING PERFORMANCE
Many materials are available for use as pavement markings. However, the service life
and cost of materials vary greatly. As with other traffic control devices, maintaining pavement
markings that are highly visible and long lasting presents a major challenge to transportation
agencies.
In general, pavement marking performance is judged by two criteria: durability and
visibility (2):
• Durability refers to the amount of material remaining on the pavement surface over
time. Durability performance is often measured either by determining the
percentage of material remaining on the surface or by directly testing the bond
strength of a material to the surface.
• Visibility relates to the brightness of the material. Much of the research concerning
marking visibility uses retroreflectivity as a proxy measure for visibility
performance.
It is important to recognize that most pavement marking materials do not provide equal
durability and visibility under every roadway situation. Performance for a specific material may
vary widely based on many factors, including roadway surface type, traffic volume, and
environment/weather. Each of these factors must be considered when selecting the optimum
pavement marking material for a given set of roadway, traffic, and environmental circumstances.
Sealcoated Pavement Surface Characteristics
Prior to addressing the problems associated with pavement markings on sealcoated
pavement surfaces, one must first address the issues involving the sealcoats themselves.
Sealcoated surfaces are classified as an improved pavement surface, although are generally
considered as a lower quality surface when compared to hot-mix asphalt concrete or Portland

14
cement concrete surfaces due to the lower structural capacity and rougher ride quality that
sealcoats provide. Sealcoated surfaces usually have a higher degree of surface texture and
variability when compared to other types of pavement surfaces.
The greater surface variability can be attributed to sealcoats being field-constructed rather
than premixed like HMAC or PCC surfaces. The coarser surface texture is a result of the
aggregates being dropped on to the asphalt binder material rather than intermixed like an HMAC
or PCC surface. The lack of intermixing of sealcoat materials creates much larger surface voids
on the sealcoat than are observed with the riding surfaces of HMAC and PCC pavements.
Although the fresh sealcoat surface is rolled during construction, traffic loads are relied upon to
further embed the aggregates into the binder as it cures. This process leads to a much higher
likelihood of aggregates “popping out” of a fresh sealcoat surface than the premixed surfaces,
although pop-outs tend to decrease as the sealcoat surface cures. Fresh sealcoats are also
susceptible to bleeding and tracking of the asphalt binder material across the pavement surface
and onto the markings.
Expected Service Life of Thermoplastic Pavement Markings
The service life of a pavement marking can be defined as the time or number of traffic
passages required for its retroreflectivity to decrease from its initial value to a minimum
threshold value that indicates that the marking needs to be refurbished or replaced (15). The
literature has shown that determining an expected service life (or design life) for thermoplastic
pavement markings is not necessarily an easy task due to the sensitivity and variability of
thermoplastic materials.
A comprehensive study by Migletz, et al. explored the service lives of a variety of
durable pavement markings (15). Various durable pavement markings were placed in 19 states
at 85 study sites, and the retroreflectivity of the markings was monitored approximately every six
months for nearly four years. Expected service lives were predicted by modeling the
retroreflectivity data as a function of time or cumulative traffic passages. End-of-service life
thresholds were set at the FHWA recommended minimums (13). This study found large site-to-
site variations in the retroreflectivity data for identical materials and line types. Because of these
variations, the modeling was performed separately for each individual pavement marking line at
each study site. The large site-to-site variability in the retroreflectivity data for identical
15
materials and line types suggests that the retroreflectivity of marking materials is affected by a
number of roadway, weather, and application related variables that are difficult to quantify.
However, the study did find that both white and yellow thermoplastic pavement markings could
be expected to last two years on freeways and three years on non-freeways when the FHWA
recommended threshold retroreflectivity levels were used. The study found maximum service
life for thermoplastic to be approximately four years. Unfortunately, no mention was made
pertaining to the pavement surfaces included in the evaluations, which may also help to explain
the site-to-site variability.
TxDOT district and division personnel have indicated that an expected service life of two
to three years is reasonable for thermoplastic markings placed on new sealcoat surfaces.
Therefore, based on the findings of Migletz, et al. (15) and observations by TxDOT personnel,
an expected service life of two to three years with a maximum of four years is reasonable for
thermoplastic pavement markings placed on TxDOT sealcoat roadways.
LITERATURE SUMMARY
The literature review provided important information pertaining to pavement markings,
which aided the researchers in other research tasks. The following information was obtained
from the literature:
• To be effective, pavement markings must:
− present the appropriate visual clues far enough in advance of a given situation to
allow for suitable reaction time to occur, and
− be visible in the periphery to aid in moment-to-moment lane navigation.
• Providing 3 to 3.65 seconds of delineation preview gives drivers sufficient time to
complete standard driving tasks and allows for some margin of driver error and
driver comfort.
• Measuring the retroreflectivity of pavement markings is one of the most widely used
methods to objectively evaluate nighttime performance of pavement markings.
• For standardization of pavement marking retroreflectivity measurement, ASTM and
CEN have adopted the entry and observation angles corresponding to a 30-meter
viewing geometry.

16
• Most drivers will classify pavement markings with minimum retroreflectivity values
ranging from approximately 80 to 120 mcd/m2/lx to be acceptable.
• The FHWA-recommended retroreflectivity levels for high-speed roadways without
RRPMs or continuous roadway lighting are 150 mcd/m2/lx for white and 100
mcd/m2/lx for yellow.
• Thermoplastic pavement markings are expected to last two years on freeways and
three years on non-freeways, with a maximum of four years.

17
CHAPTER 3: IDENTIFICATION OF MAJOR ISSUES
Prior to conducting comprehensive pavement marking field evaluations, TTI researchers
first identified many of the major problems, issues, and challenges involved with pavement
markings on sealcoats on TxDOT roadways. Identification of these items was accomplished
through a series of tasks that included:
• surveying TxDOT districts,
• performing preliminary field studies of in-service marking performance, and
• facilitating two major pavement marking conferences for pavement marking
stakeholders in Texas.
SURVEY OF TXDOT DISTRICTS
One of the first project tasks was to determine the sealcoat pavement marking practices of
TxDOT’s 25 districts. To accomplish this task, the research team developed a survey and sent it
electronically to traffic and maintenance personnel within each district in December 2000. The
survey focused on determining types of pavement marking materials used, thickness of
markings, required cure time for sealcoats prior to applying markings, use of retroreflectivity
performance specifications, grade of sealcoat aggregate, etc. Appendix A contains the survey
questionnaire form. The responses to the survey were useful for:
• gaining knowledge of the current statewide pavement marking practices on new
sealcoats,
• identifying major issues and challenges with pavement markings on sealcoats, and
• developing field evaluations of various pavement marking treatments.
Survey Results
Responses were received from 22 of the 25 TxDOT districts. Responses represent
TxDOT district practices during late 2000/early 2001. The survey results are summarized in
Figures 3-6.
18
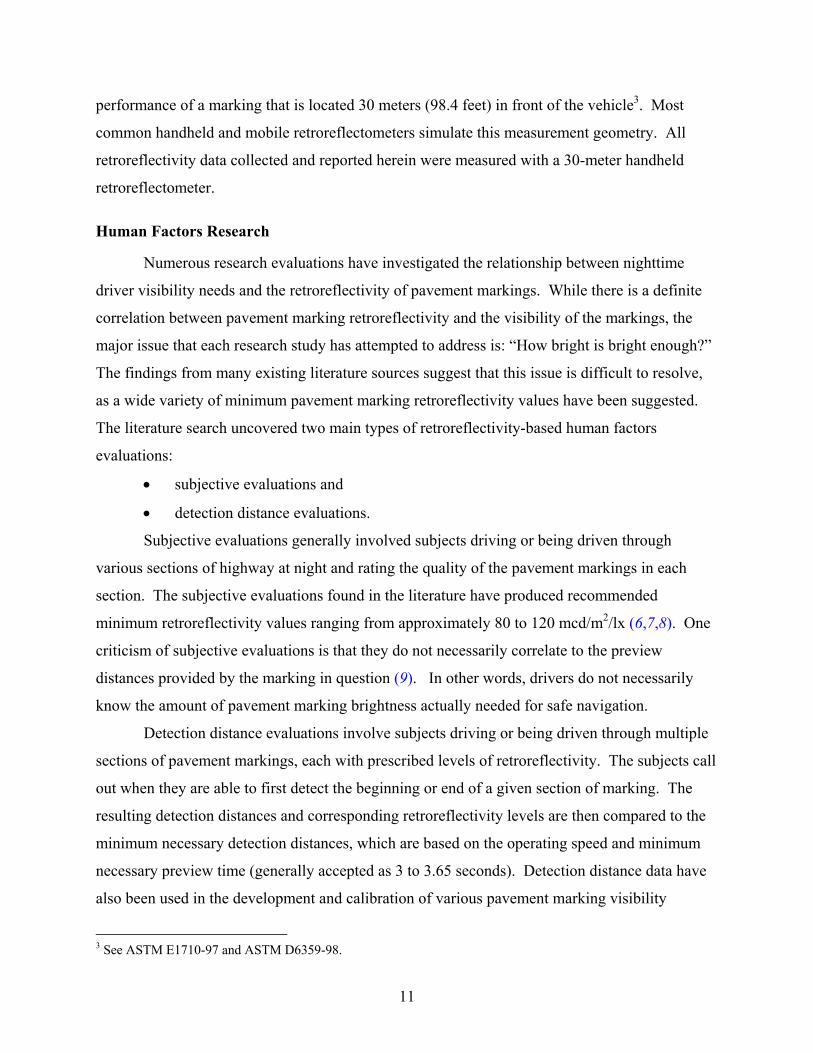
Question: What type of marking material do you currently install on a new sealcoat?
Paint Followed By Thermo
36%Thicker Thermo
Only41%
Standard Thickness Thermo Only
18%
Paint Only5%
Figure 3. Pavement Marking Materials on New Sealcoat.
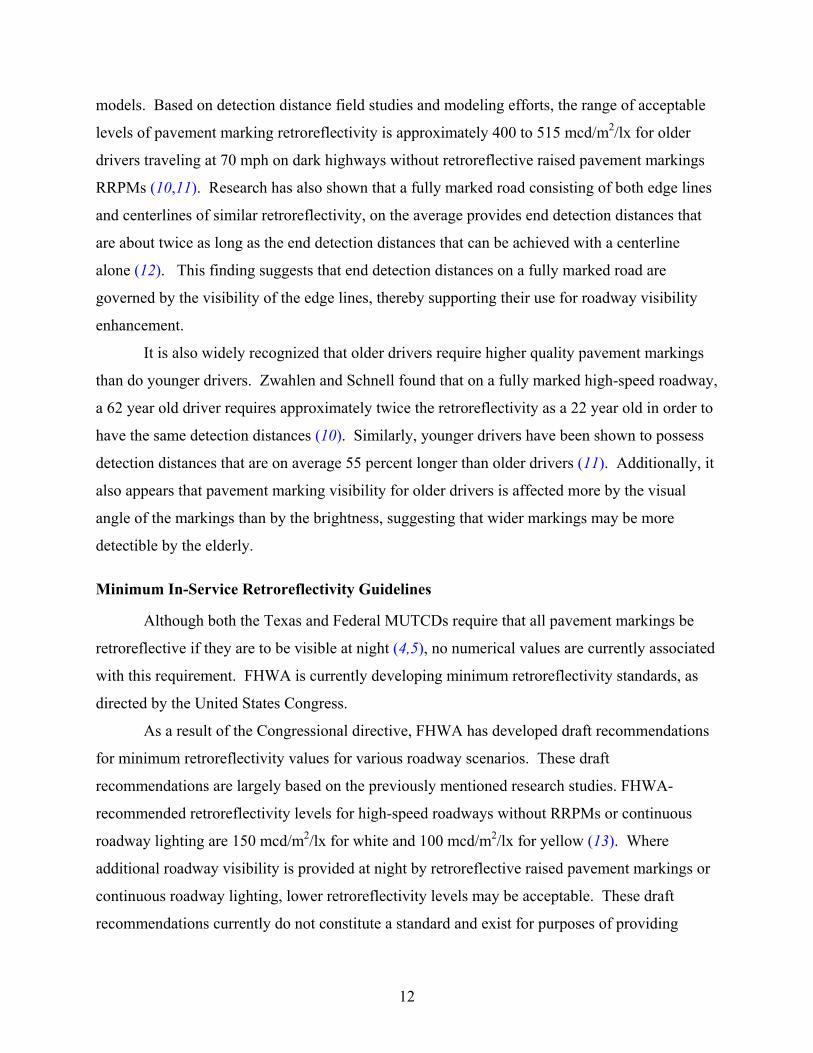
Question: If you initially apply waterbased paint on a new sealcoat, how long do you wait
before applying thermoplastic?
30 days or less45%
30 days to 1 year44%
Greater than 1 year11%
Figure 4. Waiting Time between Waterbased Paint and Thermoplastic.
19
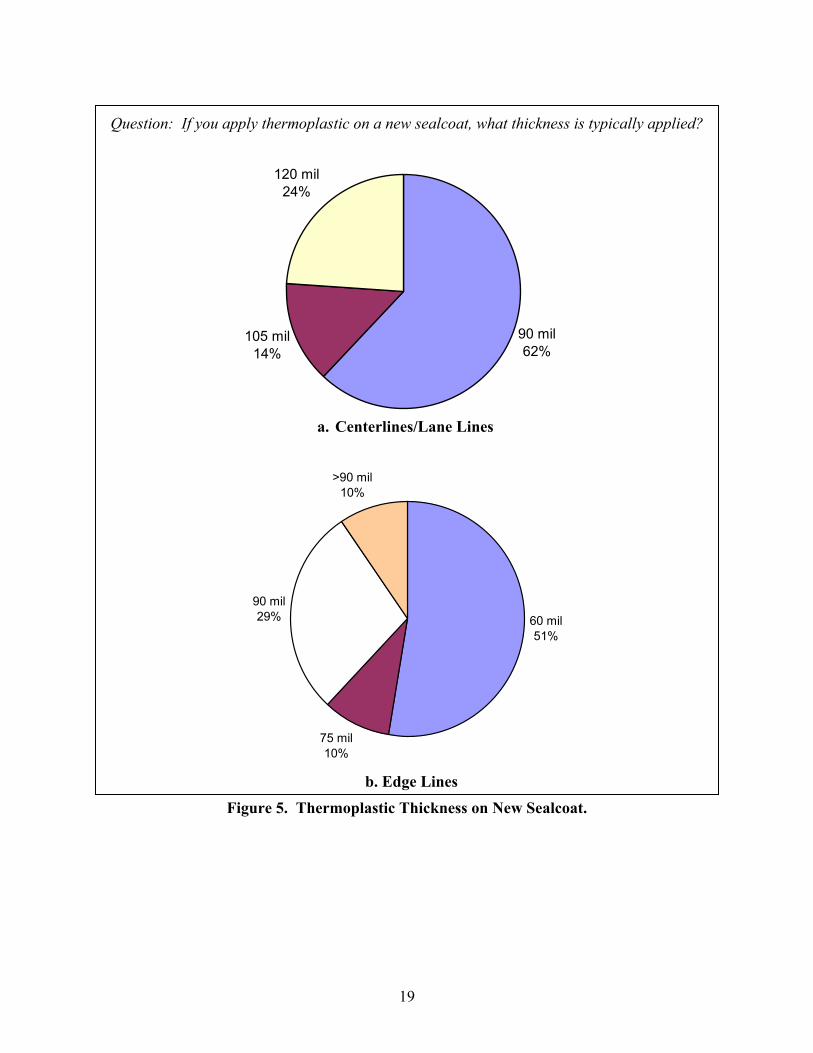
Question: If you apply thermoplastic on a new sealcoat, what thickness is typically applied?
90 mil62%
105 mil14%
120 mil24%
a. Centerlines/Lane Lines
60 mil51%
75 mil10%
90 mil29%
>90 mil10%
b. Edge Lines
Figure 5. Thermoplastic Thickness on New Sealcoat.

20
Question: How much sealcoat cure time do you require before the placement of any type of permanent pavement markings?
0-3 Days
18%
3-14 Days82%
Figure 6. Time between Sealcoat Placement and Permanent Striping.
One of the more useful portions of the survey was respondent lists of problems
experienced with markings on new sealcoats. The following is a sample of the responses:
• rapid deterioration of retroreflectivity for thermoplastic,
• paint often does not last a full year when placed on a new sealcoat,
• unable to cover the entire aggregate surface with thermoplastic sprayed at standard
thickness,
• thermoplastic on tops of the aggregates wears quickly,
• asphalt bleeding to surface and tracked onto new markings,
• aggregates “pop out” of the new sealcoat surface and remove the marking material,
• contractors have difficulty spraying thermoplastic greater than 90 mils, and
• contractors have difficulty applying thermoplastic within the 14-day requirement
after sealcoat is placed.
PRELIMINARY PAVEMENT MARKING INVESTIGATIONS
The first data collection activities involved field investigation of pavement marking
conditions to determine the current state of pavement markings on TxDOT’s sealcoated
21
highways. These field investigations included taking retroreflectivity measurements and making
observations as to the condition of the markings.
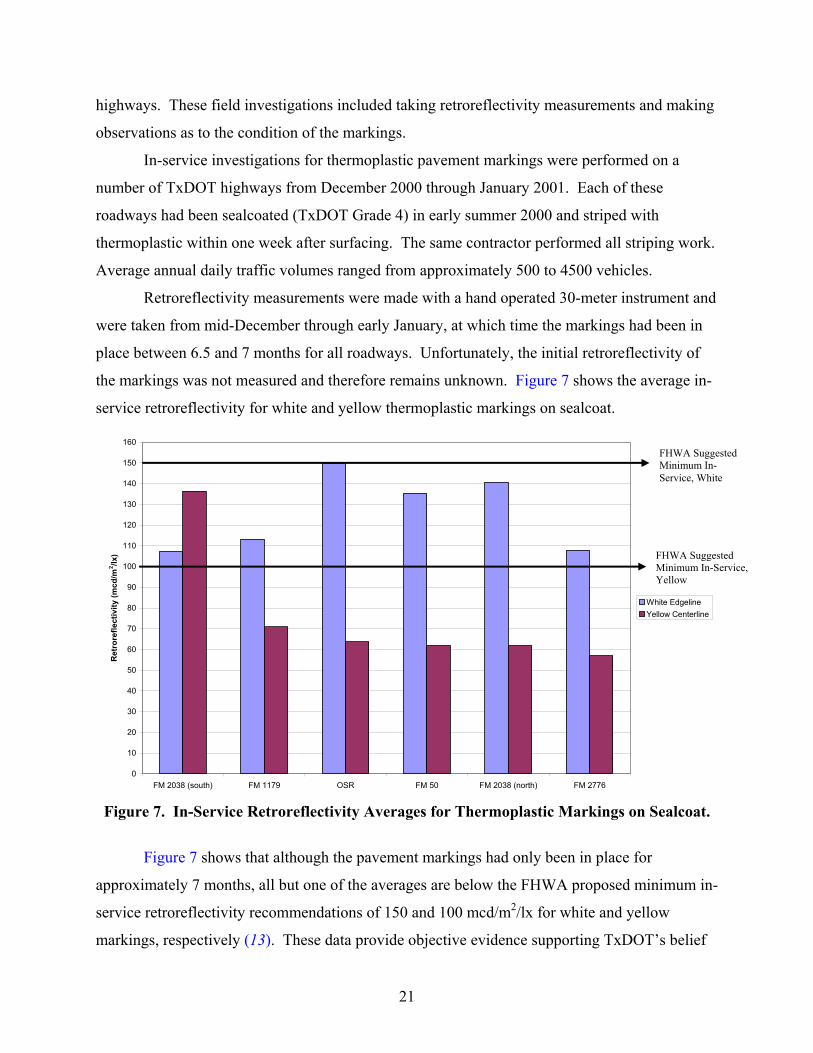
In-service investigations for thermoplastic pavement markings were performed on a
number of TxDOT highways from December 2000 through January 2001. Each of these
roadways had been sealcoated (TxDOT Grade 4) in early summer 2000 and striped with
thermoplastic within one week after surfacing. The same contractor performed all striping work.
Average annual daily traffic volumes ranged from approximately 500 to 4500 vehicles.
Retroreflectivity measurements were made with a hand operated 30-meter instrument and
were taken from mid-December through early January, at which time the markings had been in
place between 6.5 and 7 months for all roadways. Unfortunately, the initial retroreflectivity of
the markings was not measured and therefore remains unknown. Figure 7 shows the average in-
service retroreflectivity for white and yellow thermoplastic markings on sealcoat.
0
10
20
30
40
50
60
70
80
90
100
110
120
130
140
150
160
FM 2038 (south) FM 1179 OSR FM 50 FM 2038 (north) FM 2776
Ret
rore
flect
ivity
(mcd
/m2 /lx
)
White EdgelineYellow Centerline
Figure 7. In-Service Retroreflectivity Averages for Thermoplastic Markings on Sealcoat.
Figure 7 shows that although the pavement markings had only been in place for
approximately 7 months, all but one of the averages are below the FHWA proposed minimum in-
service retroreflectivity recommendations of 150 and 100 mcd/m2/lx for white and yellow
markings, respectively (13). These data provide objective evidence supporting TxDOT’s belief
FHWA Suggested Minimum In-Service, White
FHWA Suggested Minimum In-Service, Yellow

22
that thermoplastic markings on new sealcoats often do not provide sufficient retroreflectivity
throughout their expected service lives of two to three years.
PAVEMENT MARKING CONFERENCES
Shortly after this research project began in September 2000, TTI and TxDOT staff
determined the need for large open-dialogue meetings between many of the pavement marking
stakeholder groups in Texas. As a result, TTI hosted two pavement marking conferences as part
of 2001 research activities. A complete report detailing the proceedings from these conferences
exists in (16).
The goal of the conferences was to identify issues and corresponding solutions related to
pavement markings in Texas. Many key pavement marking stakeholders in Texas attended these
conferences, including TxDOT staff (districts, traffic operations, materials, maintenance),
contractors, industry personnel, and national experts. The purpose of the first conference, held in
April 2001, was to allow stakeholders to present and discuss the various issues involving
pavement markings on TxDOT highways. The second conference included presentations from
representatives of six out-of-state DOTs detailing their respective states’ performance-based
pavement marking program.
One of the main issues discussed at both conferences was the poor performance of
pavement markings on sealcoated roadways. The major issue raised by many TxDOT personnel
was that thermoplastic markings on newly sealcoated roadways were not maintaining suitable
levels of retroreflectivity. Participants proposed many potential solutions, including:
• increase thermoplastic thickness on new sealcoat (minimum 100 mil was suggested),
• apply paint as primer prior to thermoplastic striping,
• allow greater cure time for sealcoat prior to thermoplastic striping by using paint as a
temporary marking, and
• initially apply paint or thin application of thermoplastic and restripe with
thermoplastic the following year as part of the district restripe program.
The suggestions from these meetings aided TTI researchers in identifying research issues and
development of corresponding field evaluations.

23
SUMMARY OF ISSUES
Maintaining pavement markings with suitable levels of retroreflectivity on sealcoats,
both initially and throughout the life of the marking, has been a major challenge for TxDOT.
The quality of pavement markings on sealcoat is likely influenced by certain attributes of the
sealcoat surface itself, including:
• aggregate size,
• surface voids,
• surface texture, and
• length of sealcoat curing time prior to striping.
The following subsections provide a summary of the issues affecting performance of
pavement markings on sealcoats, which are based on observations by researchers, TxDOT
personnel, industry personnel, and pavement marking contractors. It should be noted that the
issues listed here are not intended to be exhaustive, as other phenomena may exist that have not
been identified by the researchers.
Issues Related to Sealcoat Surface Texture
The surface voids and irregularities on a sealcoat surface may have the greatest affect on
pavement marking performance. Preliminary observations have shown that greater sealcoat
surface texture often leads to both poorer retroreflectivity and durability. This poor performance
likely occurs because larger spacing between sealcoat aggregates tends to allow for the pavement
marking materials to fall into these voids where aggregates may shadow the material from
headlamp illumination. Figure 8 shows a typical 100 mil thermoplastic edge line marking on a
new Grade 3 sealcoat surface.
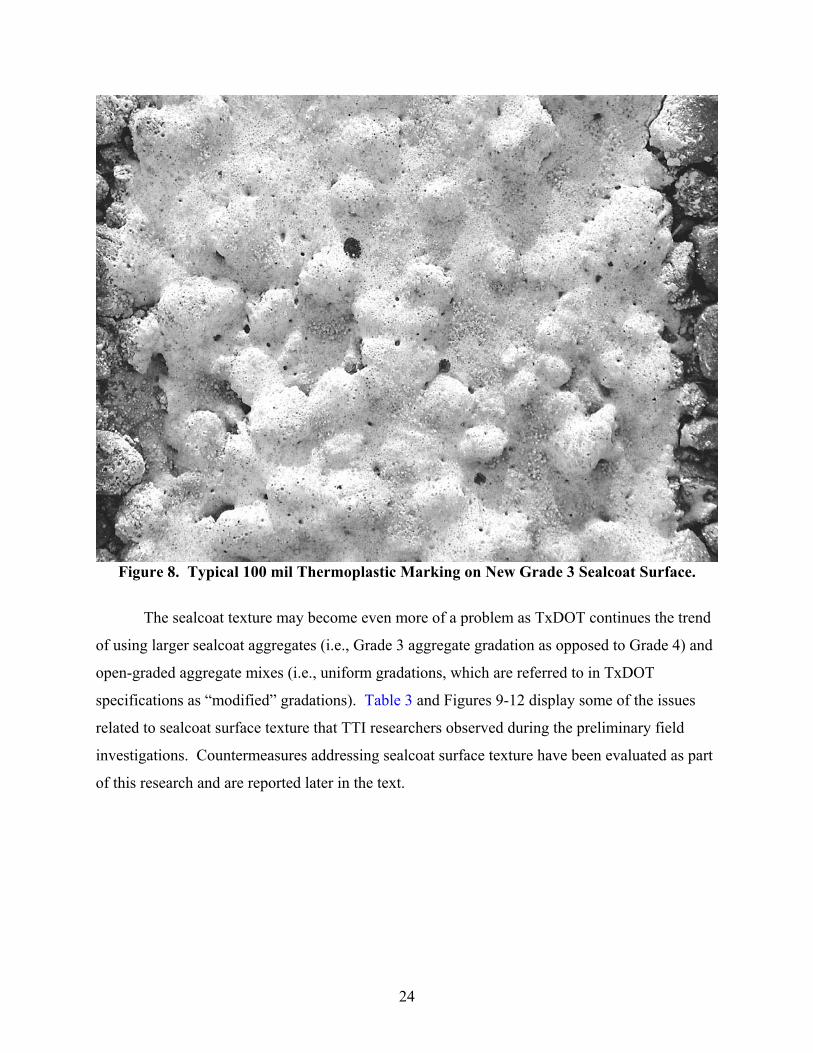
24
Figure 8. Typical 100 mil Thermoplastic Marking on New Grade 3 Sealcoat Surface.
The sealcoat texture may become even more of a problem as TxDOT continues the trend
of using larger sealcoat aggregates (i.e., Grade 3 aggregate gradation as opposed to Grade 4) and
open-graded aggregate mixes (i.e., uniform gradations, which are referred to in TxDOT
specifications as “modified” gradations). Table 3 and Figures 9-12 display some of the issues
related to sealcoat surface texture that TTI researchers observed during the preliminary field
investigations. Countermeasures addressing sealcoat surface texture have been evaluated as part
of this research and are reported later in the text.
25
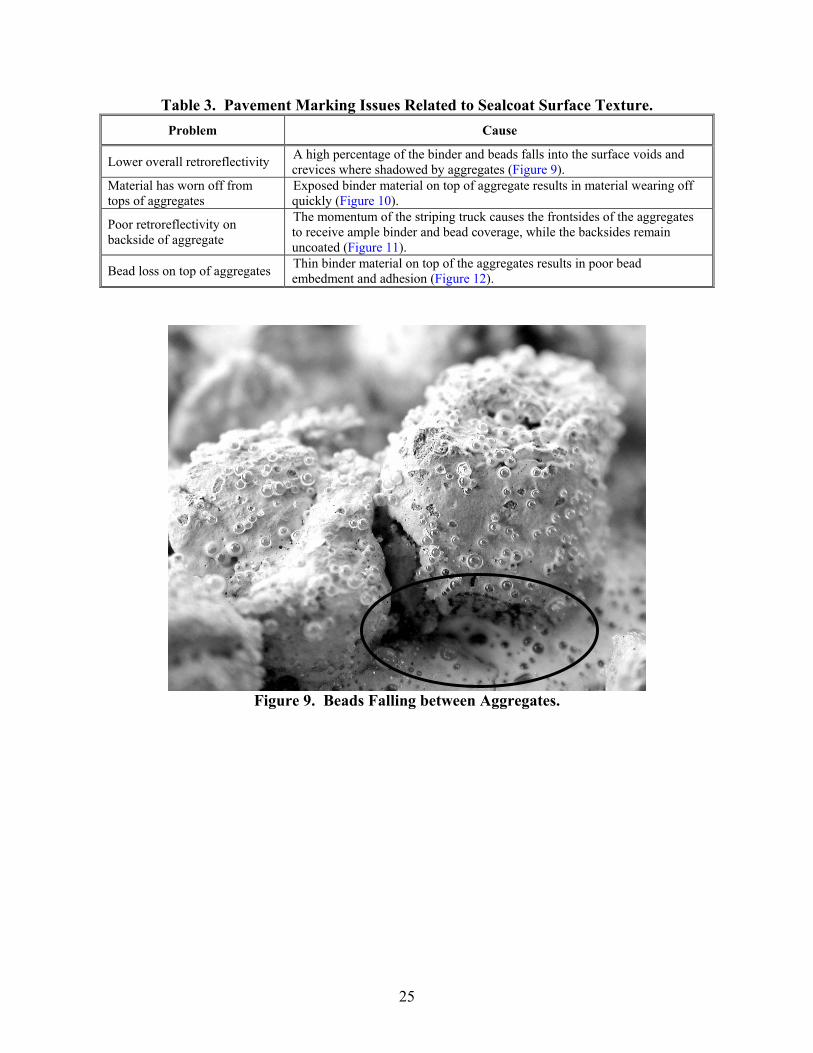
Table 3. Pavement Marking Issues Related to Sealcoat Surface Texture. Problem Cause
Lower overall retroreflectivity A high percentage of the binder and beads falls into the surface voids and crevices where shadowed by aggregates (Figure 9).
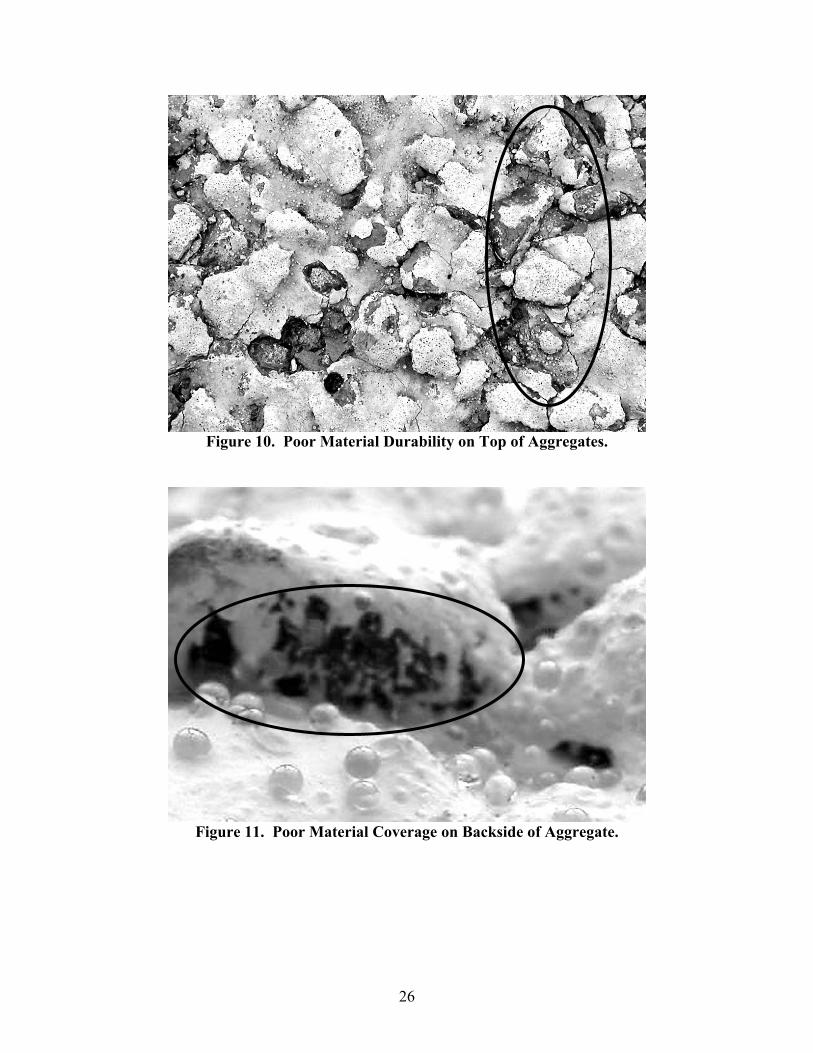
Material has worn off from tops of aggregates
Exposed binder material on top of aggregate results in material wearing off quickly (Figure 10).
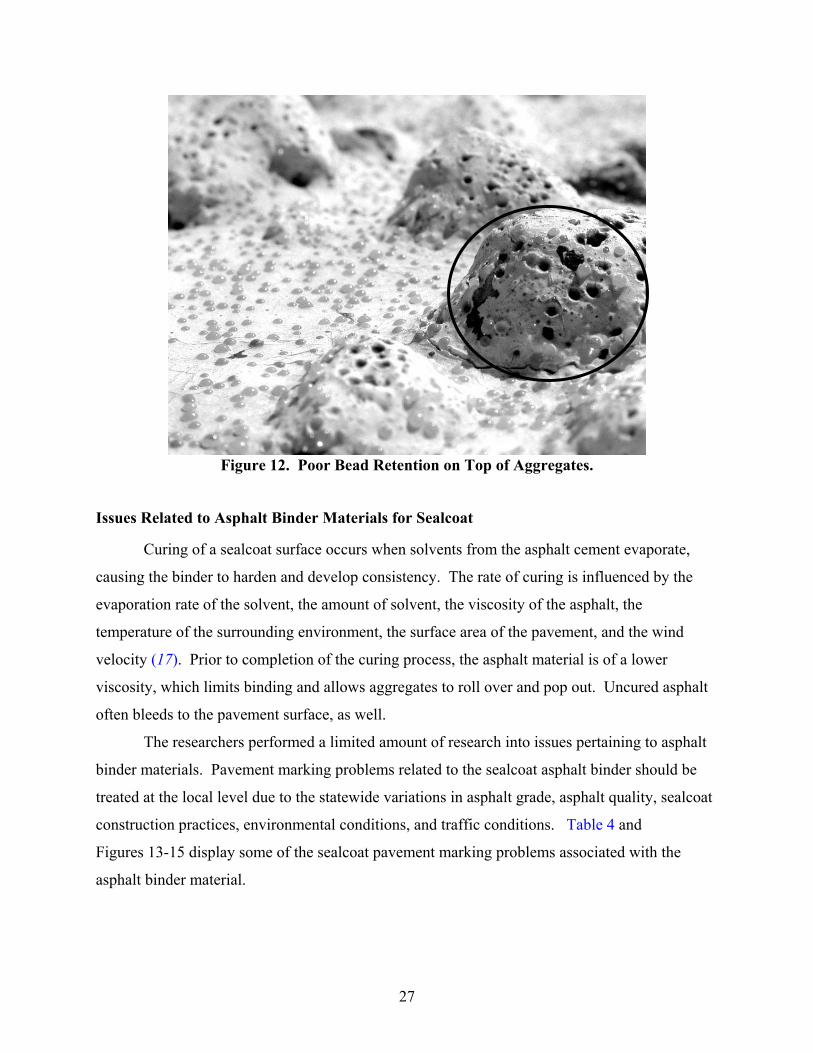
Poor retroreflectivity on backside of aggregate
The momentum of the striping truck causes the frontsides of the aggregates to receive ample binder and bead coverage, while the backsides remain uncoated (Figure 11).
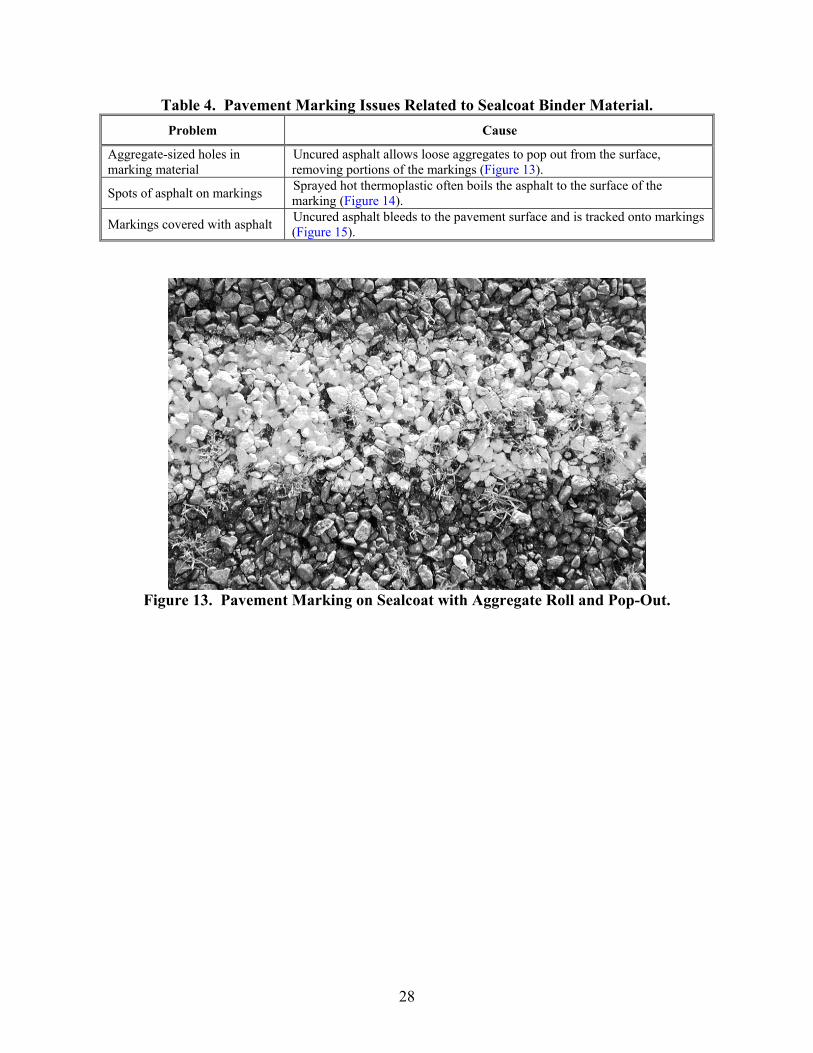
Bead loss on top of aggregates Thin binder material on top of the aggregates results in poor bead embedment and adhesion (Figure 12).
Figure 9. Beads Falling between Aggregates.
26
Figure 10. Poor Material Durability on Top of Aggregates.
Figure 11. Poor Material Coverage on Backside of Aggregate.
27
Figure 12. Poor Bead Retention on Top of Aggregates.
Issues Related to Asphalt Binder Materials for Sealcoat
Curing of a sealcoat surface occurs when solvents from the asphalt cement evaporate,
causing the binder to harden and develop consistency. The rate of curing is influenced by the
evaporation rate of the solvent, the amount of solvent, the viscosity of the asphalt, the
temperature of the surrounding environment, the surface area of the pavement, and the wind
velocity (17). Prior to completion of the curing process, the asphalt material is of a lower
viscosity, which limits binding and allows aggregates to roll over and pop out. Uncured asphalt
often bleeds to the pavement surface, as well.
The researchers performed a limited amount of research into issues pertaining to asphalt
binder materials. Pavement marking problems related to the sealcoat asphalt binder should be
treated at the local level due to the statewide variations in asphalt grade, asphalt quality, sealcoat
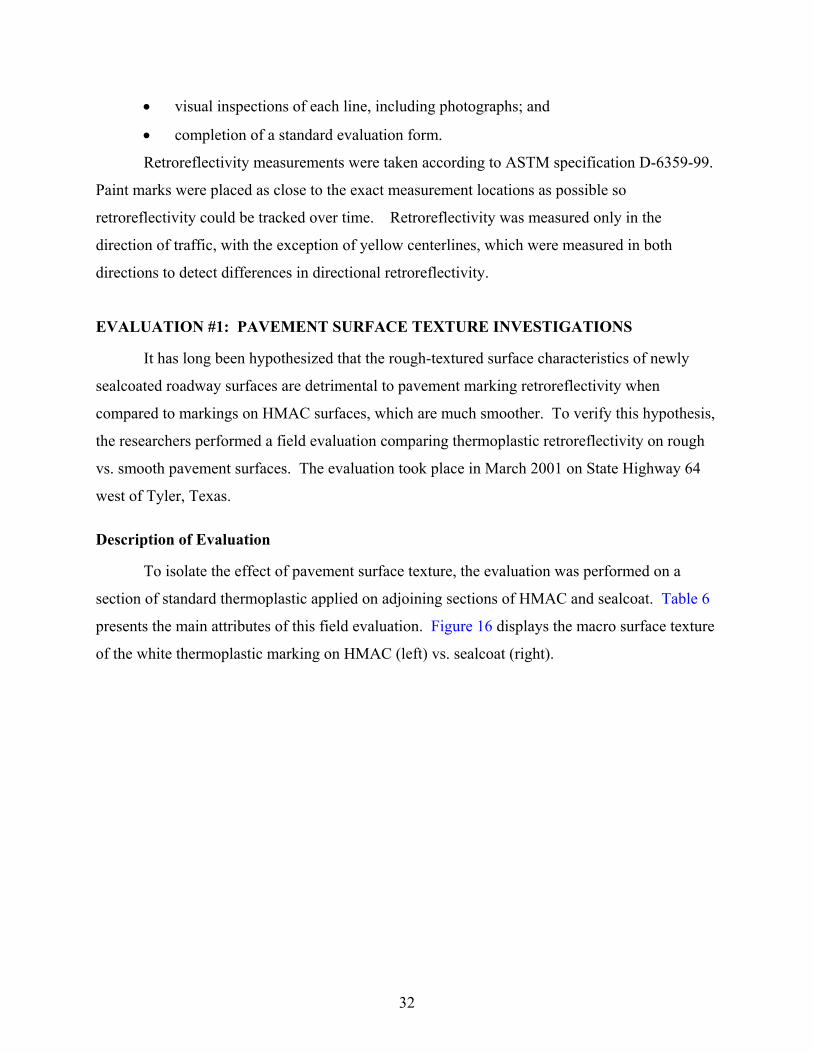
construction practices, environmental conditions, and traffic conditions. Table 4 and
Figures 13-15 display some of the sealcoat pavement marking problems associated with the
asphalt binder material.
28
Table 4. Pavement Marking Issues Related to Sealcoat Binder Material. Problem Cause
Aggregate-sized holes in marking material
Uncured asphalt allows loose aggregates to pop out from the surface, removing portions of the markings (Figure 13).
Spots of asphalt on markings Sprayed hot thermoplastic often boils the asphalt to the surface of the marking (Figure 14).
Markings covered with asphalt Uncured asphalt bleeds to the pavement surface and is tracked onto markings (Figure 15).
Figure 13. Pavement Marking on Sealcoat with Aggregate Roll and Pop-Out.

29
Figure 14. Asphalt Boiled through Hot Thermoplastic.
Figure 15. Asphalt Tracked onto Markings.


31
CHAPTER 4: FIELD EVALUATION OF PAVEMENT MARKING APPLICATIONS
The researchers used the information obtained from the literature review, district survey,
stakeholder meetings, and preliminary investigations of in-service pavement markings to develop
field evaluations of various pavement marking treatments. Table 5 lists the characteristics of the
field evaluations that were performed within this research project.
Table 5. Overview of Pavement Marking Field Evaluations. Evaluation
Number Purpose Location
1 Evaluate effect of pavement surface texture on thermoplastic initial retroreflectivity (restripe) SH 64 near Tyler
2 Evaluate effect of pavement surface texture on thermoplastic retroreflectivity over time
FM 159 and FM 1179 near Bryan
3 Determine optimum thermoplastic thickness on new sealcoat US 79 near Franklin
4
1.) Compare the performance of 100 mil thermoplastic vs. HD-21 acrylic resin paint on new sealcoat 2.) Determine the effects of using HD-21 paint as a surface primer prior to 100 mil thermoplastic on new sealcoat 3.) Compare retroreflectivity of 100 mil thermoplastic with larger glass beads vs. TxDOT standard specification beads on new sealcoat
US 90 and FM 365 near Beaumont
5
1.) Compare retroreflectivity of 100 mil thermoplastic with larger glass beads vs. TxDOT standard specification beads on new sealcoat 2.) Determine effect of sealcoat aggregate size on thermoplastic retroreflectivity
Various locations within the Waco District
EVALUATION METHODOLOGY
Retroreflectivity of pavement markings was the primary measure of effectiveness for the
evaluations performed in the research described here. In most of these field evaluations,
researchers measured the retroreflectivity of newly applied pavement markings and monitored
the performance of the markings over time, although multiple site visits were not always
feasible.
Each evaluation included experimental pavement marking treatments. Within each
treatment section, at least one evaluation checkpoint area was selected at random. A typical
pavement marking evaluation at each checkpoint included:
• 20 retroreflectivity measurements per line type (20 in each direction for yellow
centerline);
32
• visual inspections of each line, including photographs; and
• completion of a standard evaluation form.
Retroreflectivity measurements were taken according to ASTM specification D-6359-99.
Paint marks were placed as close to the exact measurement locations as possible so
retroreflectivity could be tracked over time. Retroreflectivity was measured only in the
direction of traffic, with the exception of yellow centerlines, which were measured in both
directions to detect differences in directional retroreflectivity.
EVALUATION #1: PAVEMENT SURFACE TEXTURE INVESTIGATIONS
It has long been hypothesized that the rough-textured surface characteristics of newly
sealcoated roadway surfaces are detrimental to pavement marking retroreflectivity when
compared to markings on HMAC surfaces, which are much smoother. To verify this hypothesis,
the researchers performed a field evaluation comparing thermoplastic retroreflectivity on rough
vs. smooth pavement surfaces. The evaluation took place in March 2001 on State Highway 64
west of Tyler, Texas.
Description of Evaluation
To isolate the effect of pavement surface texture, the evaluation was performed on a
section of standard thermoplastic applied on adjoining sections of HMAC and sealcoat. Table 6
presents the main attributes of this field evaluation. Figure 16 displays the macro surface texture
of the white thermoplastic marking on HMAC (left) vs. sealcoat (right).
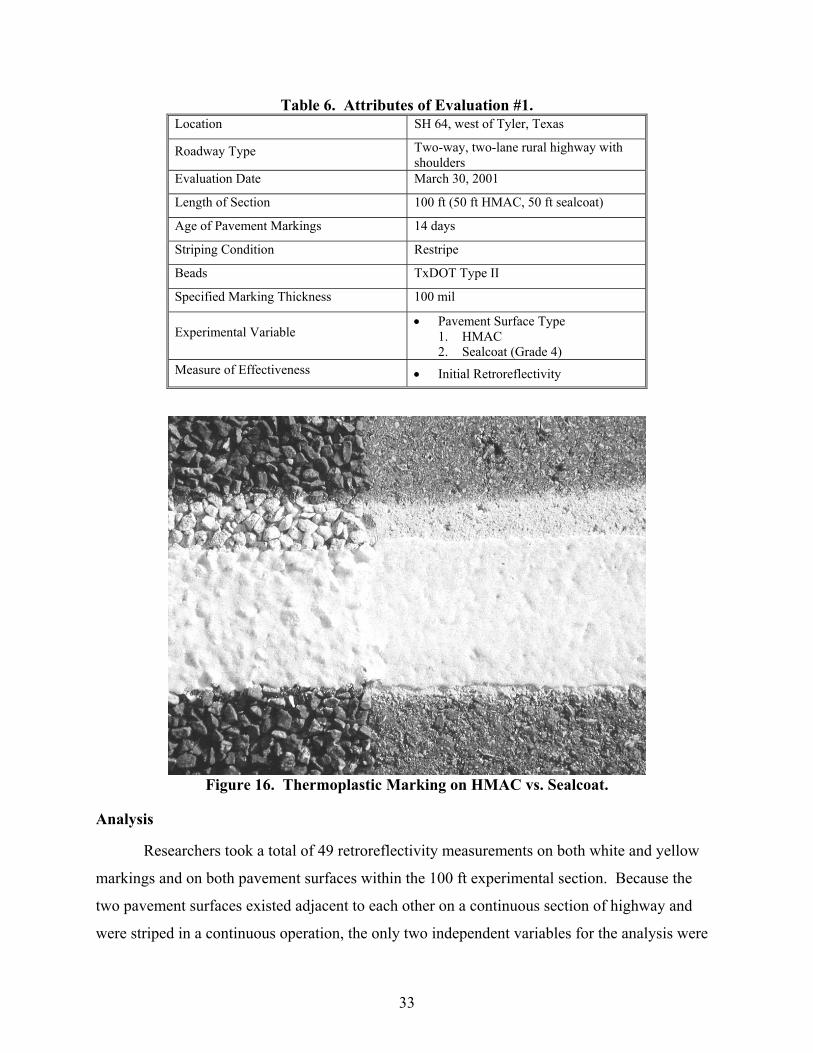
33
Table 6. Attributes of Evaluation #1. Location SH 64, west of Tyler, Texas
Roadway Type Two-way, two-lane rural highway with shoulders
Evaluation Date March 30, 2001
Length of Section 100 ft (50 ft HMAC, 50 ft sealcoat)
Age of Pavement Markings 14 days
Striping Condition Restripe
Beads TxDOT Type II
Specified Marking Thickness 100 mil
Experimental Variable • Pavement Surface Type
1. HMAC 2. Sealcoat (Grade 4)
Measure of Effectiveness • Initial Retroreflectivity
Figure 16. Thermoplastic Marking on HMAC vs. Sealcoat.
Analysis
Researchers took a total of 49 retroreflectivity measurements on both white and yellow
markings and on both pavement surfaces within the 100 ft experimental section. Because the
two pavement surfaces existed adjacent to each other on a continuous section of highway and
were striped in a continuous operation, the only two independent variables for the analysis were
34
marking color/position and pavement surface, each with two levels. The descriptive statistics
from the analysis appear in Table 7.
Table 7. Retroreflectivity Findings for Evaluation #1. Retroreflectivity (mcd/m2/lx) Marking Color Pavement Surface
Mean Std. Deviation N Sealcoat 327.70 51.69 10 White HMAC 425.90 13.06 10 Sealcoat 171.93 50.13 15
Yellow HMAC 276.64 37.04 14
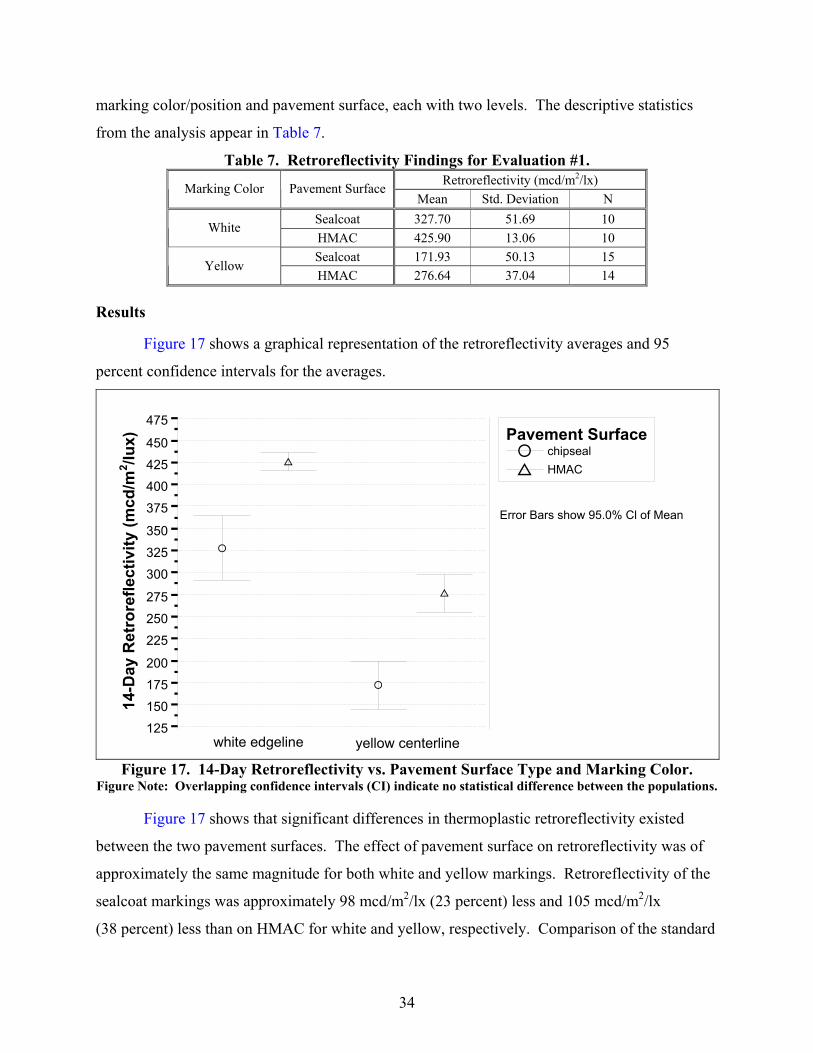
Results
Figure 17 shows a graphical representation of the retroreflectivity averages and 95
percent confidence intervals for the averages.
A chipsealB HMAC
Pavement Surface
Error Bars show 95.0% Cl of Mean
125
150
175
200
225
250
275
300
325
350
375
400
425
450
475
14-D
ay R
etro
refle
ctiv
ity (m
cd/m
2/lx
)
A
B
A
B
white edgeline yellow centerline
Figure 17. 14-Day Retroreflectivity vs. Pavement Surface Type and Marking Color. Figure Note: Overlapping confidence intervals (CI) indicate no statistical difference between the populations.
Figure 17 shows that significant differences in thermoplastic retroreflectivity existed
between the two pavement surfaces. The effect of pavement surface on retroreflectivity was of
approximately the same magnitude for both white and yellow markings. Retroreflectivity of the
sealcoat markings was approximately 98 mcd/m2/lx (23 percent) less and 105 mcd/m2/lx
(38 percent) less than on HMAC for white and yellow, respectively. Comparison of the standard
14-D
ay R
etro
refle
ctiv
ity (m
cd/m
2 /lux)
35
deviations in Table 7 shows that HMAC surfaces also provided more uniform retroreflectivity
than sealcoat.
Summary of Findings
Due to the relatively small sample sizes, the findings resulting from this evaluation
should be used with discretion:
• Thermoplastic pavement markings on HMAC had higher levels of retroreflectivity
after 14 days than the same thermoplastic markings on sealcoat. This variation is
likely attributed to the difference in surface texture between the two pavement
surfaces.
• The effect of pavement surface texture on retroreflectivity was of similar magnitude
for both white and yellow markings.
• Markings on HMAC had greater retroreflective uniformity than markings on
sealcoat.
EVALUATION #2: EFFECT OF PAVEMENT SURFACE TEXTURE ON THERMOPLASTIC RETROREFLECTIVITY
Based on the results of the Tyler surface texture evaluation, a second evaluation was
organized to investigate the long-term effects of pavement surface roughness on thermoplastic
retroreflectivity. Local sites were selected so that retroreflectivity could be monitored
frequently. The evaluation took place between June 2001 and April 2003 on FM 1179 (new
HMAC) in Bryan, Texas, and FM 159 (new Grade 4 sealcoat) in Millican, Texas.
Description of Evaluation
The purpose of the experiment was to compare standard thermoplastic striping on a new
sealcoat surface to standard thermoplastic striping on a new HMAC surface, using identical
materials. Therefore, both roadways were striped according to TxDOT thermoplastic
specifications that were current at the time. Consequently, the thermoplastic thickness on
FM 1179 (HMAC) was 90 mil for all lines, while FM 159 (sealcoat) was striped at 60 mil on the
edge line (EL) and 90 mil on the centerline (CL). Table 8 presents the main attributes of this
field evaluation.
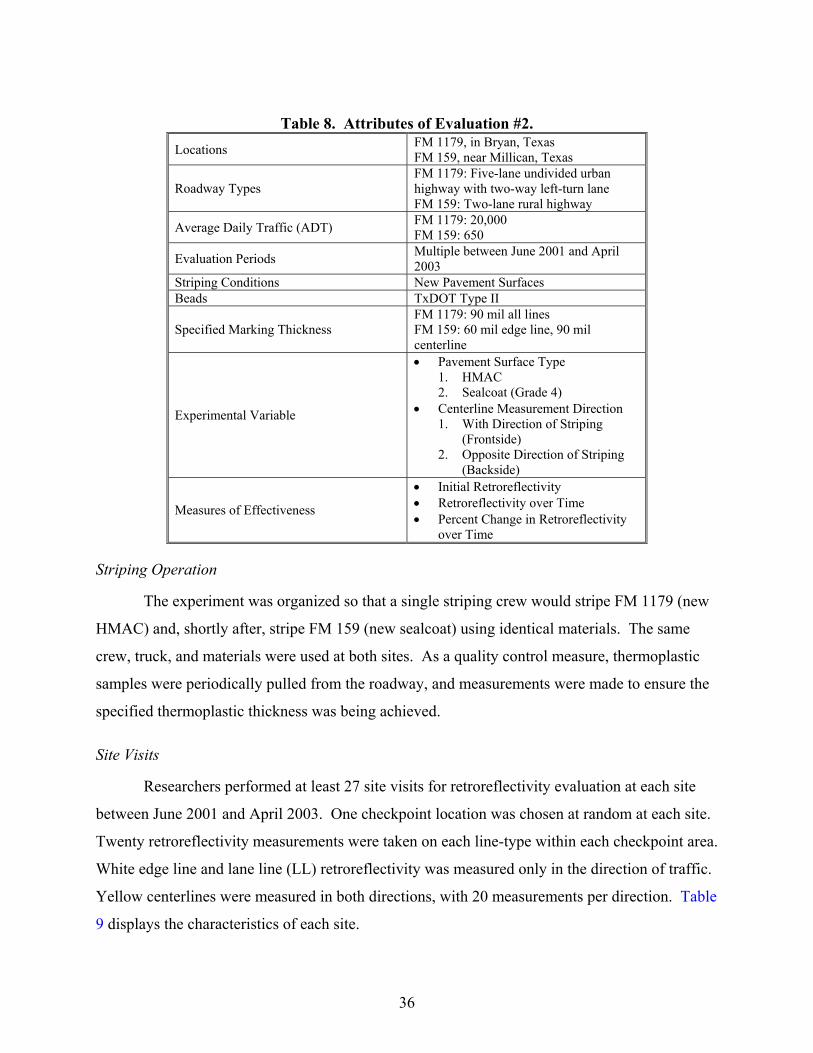
36
Table 8. Attributes of Evaluation #2.
Locations FM 1179, in Bryan, Texas FM 159, near Millican, Texas
Roadway Types FM 1179: Five-lane undivided urban highway with two-way left-turn lane FM 159: Two-lane rural highway
Average Daily Traffic (ADT) FM 1179: 20,000 FM 159: 650
Evaluation Periods Multiple between June 2001 and April 2003
Striping Conditions New Pavement Surfaces Beads TxDOT Type II
Specified Marking Thickness FM 1179: 90 mil all lines FM 159: 60 mil edge line, 90 mil centerline
Experimental Variable
• Pavement Surface Type 1. HMAC 2. Sealcoat (Grade 4)
• Centerline Measurement Direction 1. With Direction of Striping
(Frontside) 2. Opposite Direction of Striping
(Backside)
Measures of Effectiveness
• Initial Retroreflectivity • Retroreflectivity over Time • Percent Change in Retroreflectivity
over Time
Striping Operation
The experiment was organized so that a single striping crew would stripe FM 1179 (new
HMAC) and, shortly after, stripe FM 159 (new sealcoat) using identical materials. The same
crew, truck, and materials were used at both sites. As a quality control measure, thermoplastic
samples were periodically pulled from the roadway, and measurements were made to ensure the
specified thermoplastic thickness was being achieved.
Site Visits
Researchers performed at least 27 site visits for retroreflectivity evaluation at each site
between June 2001 and April 2003. One checkpoint location was chosen at random at each site.
Twenty retroreflectivity measurements were taken on each line-type within each checkpoint area.
White edge line and lane line (LL) retroreflectivity was measured only in the direction of traffic.
Yellow centerlines were measured in both directions, with 20 measurements per direction. Table
9 displays the characteristics of each site.
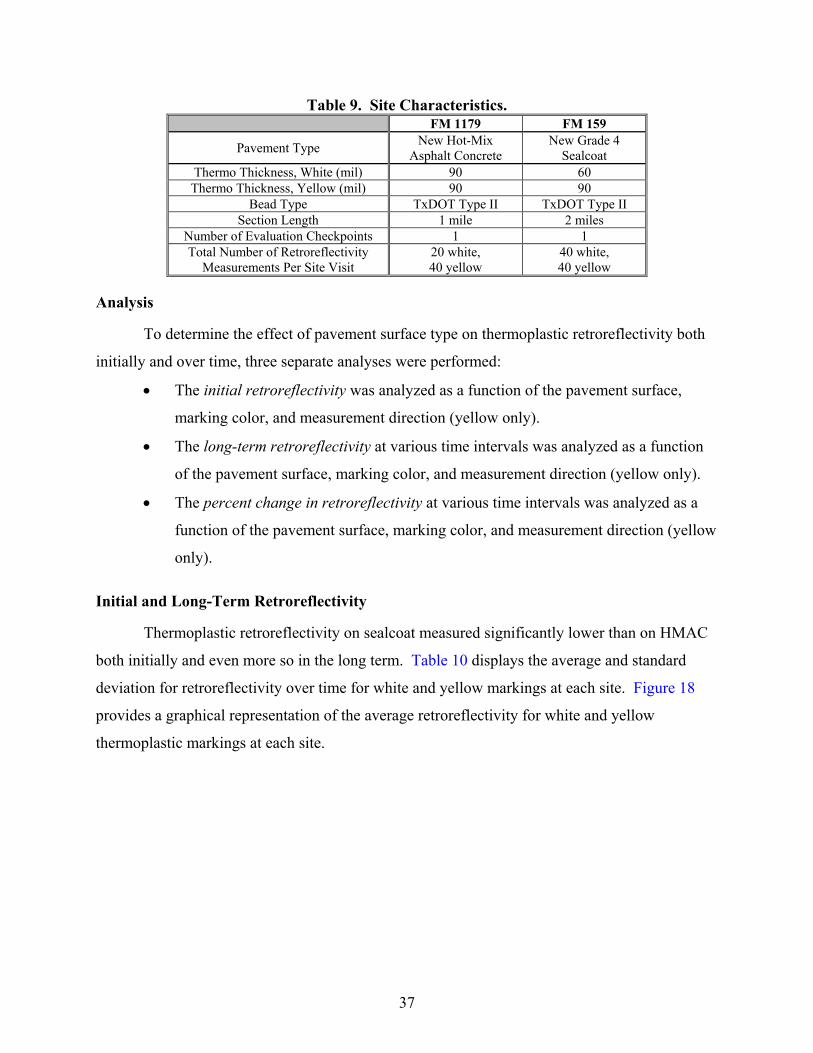
37
Table 9. Site Characteristics. FM 1179 FM 159
Pavement Type New Hot-Mix Asphalt Concrete
New Grade 4 Sealcoat
Thermo Thickness, White (mil) 90 60 Thermo Thickness, Yellow (mil) 90 90
Bead Type TxDOT Type II TxDOT Type II Section Length 1 mile 2 miles
Number of Evaluation Checkpoints 1 1 Total Number of Retroreflectivity
Measurements Per Site Visit 20 white, 40 yellow
40 white, 40 yellow
Analysis
To determine the effect of pavement surface type on thermoplastic retroreflectivity both
initially and over time, three separate analyses were performed:
• The initial retroreflectivity was analyzed as a function of the pavement surface,
marking color, and measurement direction (yellow only).
• The long-term retroreflectivity at various time intervals was analyzed as a function
of the pavement surface, marking color, and measurement direction (yellow only).
• The percent change in retroreflectivity at various time intervals was analyzed as a
function of the pavement surface, marking color, and measurement direction (yellow
only).
Initial and Long-Term Retroreflectivity
Thermoplastic retroreflectivity on sealcoat measured significantly lower than on HMAC
both initially and even more so in the long term. Table 10 displays the average and standard
deviation for retroreflectivity over time for white and yellow markings at each site. Figure 18
provides a graphical representation of the average retroreflectivity for white and yellow
thermoplastic markings at each site.
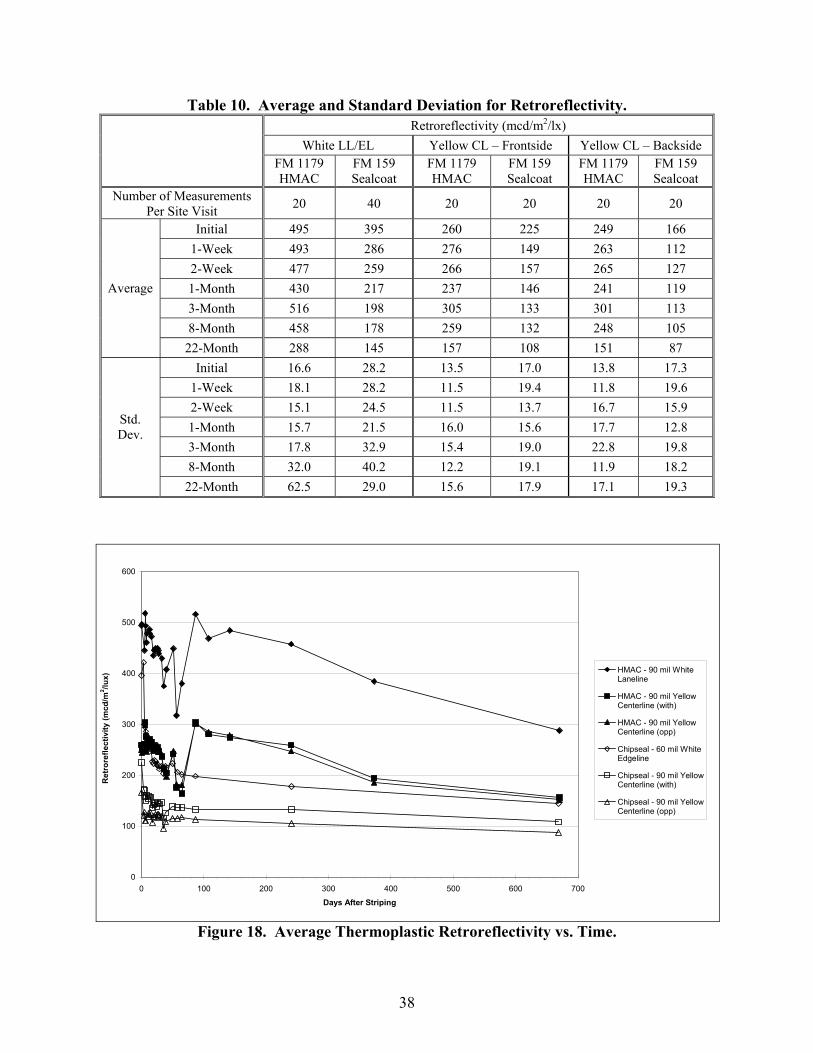
38
Table 10. Average and Standard Deviation for Retroreflectivity. Retroreflectivity (mcd/m2/lx)
White LL/EL Yellow CL – Frontside Yellow CL – Backside FM 1179 HMAC
FM 159 Sealcoat
FM 1179 HMAC
FM 159 Sealcoat
FM 1179 HMAC
FM 159 Sealcoat
Number of Measurements Per Site Visit 20 40 20 20 20 20
Initial 495 395 260 225 249 166 1-Week 493 286 276 149 263 112 2-Week 477 259 266 157 265 127 1-Month 430 217 237 146 241 119 3-Month 516 198 305 133 301 113 8-Month 458 178 259 132 248 105
Average
22-Month 288 145 157 108 151 87 Initial 16.6 28.2 13.5 17.0 13.8 17.3
1-Week 18.1 28.2 11.5 19.4 11.8 19.6 2-Week 15.1 24.5 11.5 13.7 16.7 15.9 1-Month 15.7 21.5 16.0 15.6 17.7 12.8 3-Month 17.8 32.9 15.4 19.0 22.8 19.8 8-Month 32.0 40.2 12.2 19.1 11.9 18.2
Std. Dev.
22-Month 62.5 29.0 15.6 17.9 17.1 19.3
0
100
200
300
400
500
600
0 100 200 300 400 500 600 700
Days After Striping
Ret
rore
flect
ivity
(mcd
/m2 /lx
) HMAC - 90 mil WhiteLaneline
HMAC - 90 mil YellowCenterline (with)
HMAC - 90 mil YellowCenterline (opp)
Chipseal - 60 mil WhiteEdgeline
Chipseal - 90 mil YellowCenterline (with)
Chipseal - 90 mil YellowCenterline (opp)
Figure 18. Average Thermoplastic Retroreflectivity vs. Time.
Ret
rore
flect
ivity
(mcd
/m2 /lu
x)
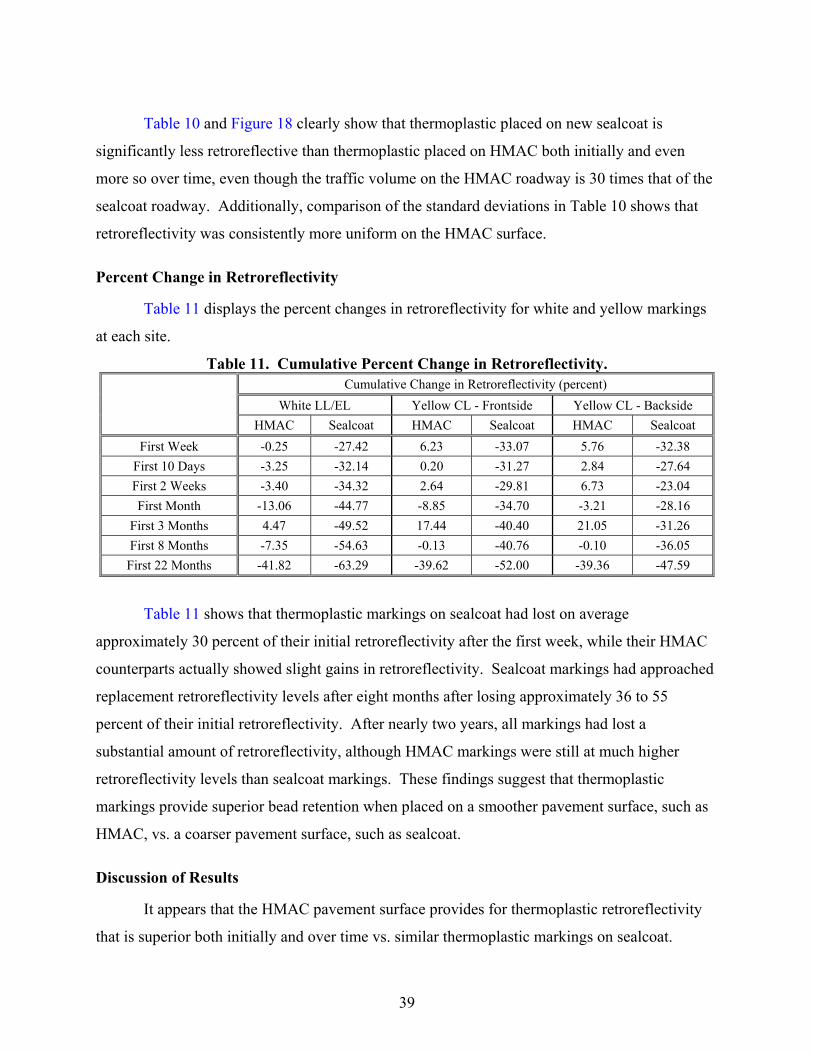
39
Table 10 and Figure 18 clearly show that thermoplastic placed on new sealcoat is
significantly less retroreflective than thermoplastic placed on HMAC both initially and even
more so over time, even though the traffic volume on the HMAC roadway is 30 times that of the
sealcoat roadway. Additionally, comparison of the standard deviations in Table 10 shows that
retroreflectivity was consistently more uniform on the HMAC surface.
Percent Change in Retroreflectivity
Table 11 displays the percent changes in retroreflectivity for white and yellow markings
at each site.
Table 11. Cumulative Percent Change in Retroreflectivity. Cumulative Change in Retroreflectivity (percent)
White LL/EL Yellow CL - Frontside Yellow CL - Backside HMAC Sealcoat HMAC Sealcoat HMAC Sealcoat
First Week -0.25 -27.42 6.23 -33.07 5.76 -32.38 First 10 Days -3.25 -32.14 0.20 -31.27 2.84 -27.64 First 2 Weeks -3.40 -34.32 2.64 -29.81 6.73 -23.04 First Month -13.06 -44.77 -8.85 -34.70 -3.21 -28.16
First 3 Months 4.47 -49.52 17.44 -40.40 21.05 -31.26 First 8 Months -7.35 -54.63 -0.13 -40.76 -0.10 -36.05 First 22 Months -41.82 -63.29 -39.62 -52.00 -39.36 -47.59
Table 11 shows that thermoplastic markings on sealcoat had lost on average
approximately 30 percent of their initial retroreflectivity after the first week, while their HMAC
counterparts actually showed slight gains in retroreflectivity. Sealcoat markings had approached
replacement retroreflectivity levels after eight months after losing approximately 36 to 55
percent of their initial retroreflectivity. After nearly two years, all markings had lost a
substantial amount of retroreflectivity, although HMAC markings were still at much higher
retroreflectivity levels than sealcoat markings. These findings suggest that thermoplastic
markings provide superior bead retention when placed on a smoother pavement surface, such as
HMAC, vs. a coarser pavement surface, such as sealcoat.
Discussion of Results
It appears that the HMAC pavement surface provides for thermoplastic retroreflectivity
that is superior both initially and over time vs. similar thermoplastic markings on sealcoat.
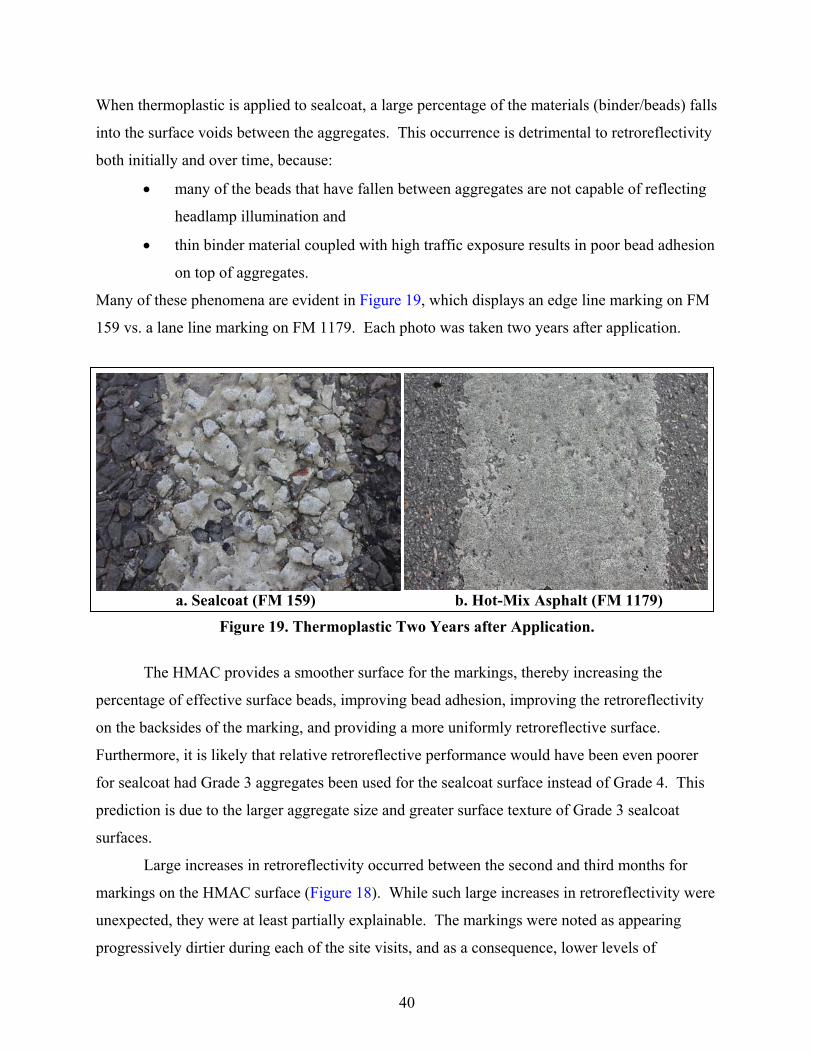
40
When thermoplastic is applied to sealcoat, a large percentage of the materials (binder/beads) falls
into the surface voids between the aggregates. This occurrence is detrimental to retroreflectivity
both initially and over time, because:
• many of the beads that have fallen between aggregates are not capable of reflecting
headlamp illumination and
• thin binder material coupled with high traffic exposure results in poor bead adhesion
on top of aggregates.
Many of these phenomena are evident in Figure 19, which displays an edge line marking on FM
159 vs. a lane line marking on FM 1179. Each photo was taken two years after application.
a. Sealcoat (FM 159) b. Hot-Mix Asphalt (FM 1179)
Figure 19. Thermoplastic Two Years after Application.
The HMAC provides a smoother surface for the markings, thereby increasing the
percentage of effective surface beads, improving bead adhesion, improving the retroreflectivity
on the backsides of the marking, and providing a more uniformly retroreflective surface.
Furthermore, it is likely that relative retroreflective performance would have been even poorer
for sealcoat had Grade 3 aggregates been used for the sealcoat surface instead of Grade 4. This
prediction is due to the larger aggregate size and greater surface texture of Grade 3 sealcoat
surfaces.
Large increases in retroreflectivity occurred between the second and third months for
markings on the HMAC surface (Figure 18). While such large increases in retroreflectivity were
unexpected, they were at least partially explainable. The markings were noted as appearing
progressively dirtier during each of the site visits, and as a consequence, lower levels of

41
retroreflectivity were observed. During the third month, many days of heavy rain occurred,
resulting in cleaner markings and consequently, large increases in retroreflectivity.
Summary of Findings
• Thermoplastic pavement markings on sealcoat had lower levels of retroreflectivity
both initially and in the long term vs. similar thermoplastic markings on HMAC.
− After one week:
► Sealcoat thermoplastic had lost approximately 30 percent of initial
retroreflectivity levels.
► HMAC thermoplastic had gained approximately 3 percent of initial
retroreflectivity levels.
− After eight months:
► Sealcoat thermoplastic retroreflectivity had degraded to replacement levels
after losing approximately 36 to 55 percent of initial retroreflectivity.
► HMAC thermoplastic had lost only 0 to 7 percent of initial retroreflectivity
levels.
• Heavy rain provided a significant cleaning effect on HMAC markings, contributing
to gains in retroreflectivity that were on average 120 to 140 mcd/m2/lx. Similar
findings were not observed on sealcoat.
• Differences in directional retroreflectivity for yellow centerline markings were
significantly less on HMAC vs. sealcoat, indicating better binder/bead coverage for
markings on HMAC pavement surfaces.
• Markings on HMAC had greater retroreflective uniformity than markings on
sealcoat.
EVALUATION #3: OPTIMUM THERMOPLASTIC THICKNESS FOR NEW SEALCOAT
The results of the HMAC/sealcoat thermoplastic comparisons performed in Evaluations
#1 and #2 showed poor relative performance for retroreflectivity of standard thermoplastic
markings on new sealcoat vs. new HMAC. Researchers hypothesized that retroreflective
performance for thermoplastic on new sealcoat would improve by applying thermoplastic at
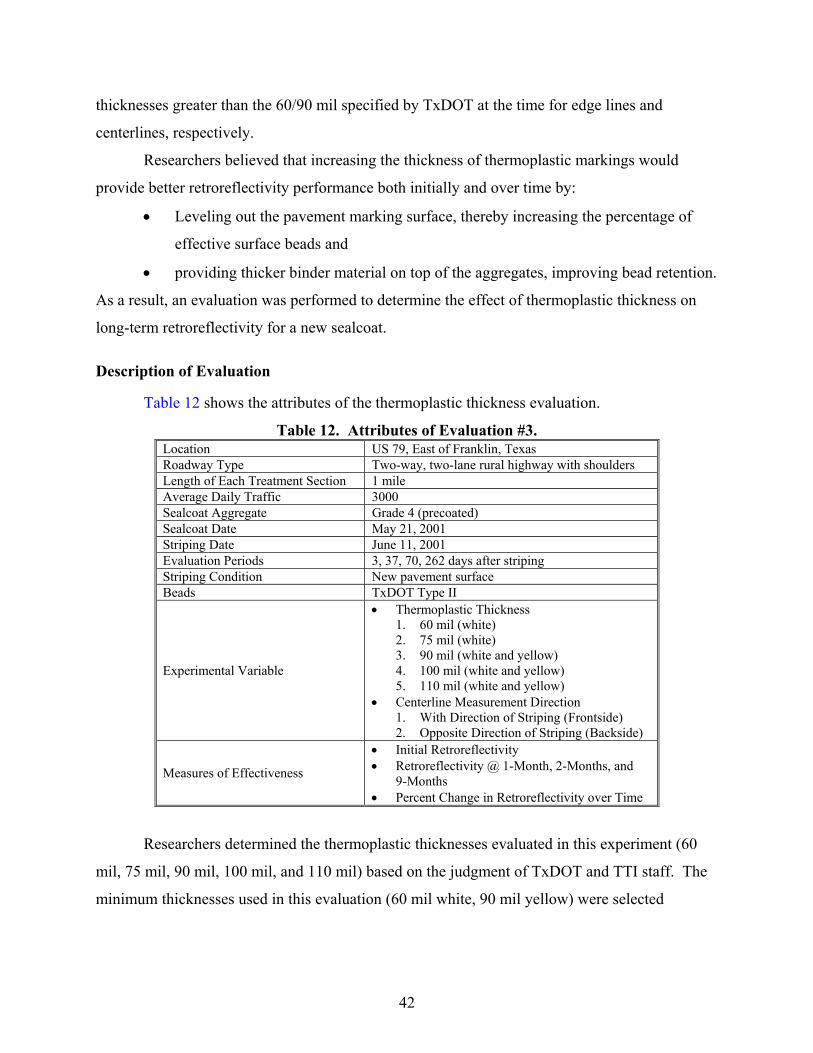
42
thicknesses greater than the 60/90 mil specified by TxDOT at the time for edge lines and
centerlines, respectively.
Researchers believed that increasing the thickness of thermoplastic markings would
provide better retroreflectivity performance both initially and over time by:
• Leveling out the pavement marking surface, thereby increasing the percentage of
effective surface beads and
• providing thicker binder material on top of the aggregates, improving bead retention.
As a result, an evaluation was performed to determine the effect of thermoplastic thickness on
long-term retroreflectivity for a new sealcoat.
Description of Evaluation
Table 12 shows the attributes of the thermoplastic thickness evaluation.
Table 12. Attributes of Evaluation #3. Location US 79, East of Franklin, Texas Roadway Type Two-way, two-lane rural highway with shoulders Length of Each Treatment Section 1 mile Average Daily Traffic 3000 Sealcoat Aggregate Grade 4 (precoated) Sealcoat Date May 21, 2001 Striping Date June 11, 2001 Evaluation Periods 3, 37, 70, 262 days after striping Striping Condition New pavement surface Beads TxDOT Type II
Experimental Variable
• Thermoplastic Thickness 1. 60 mil (white) 2. 75 mil (white) 3. 90 mil (white and yellow) 4. 100 mil (white and yellow) 5. 110 mil (white and yellow)
• Centerline Measurement Direction 1. With Direction of Striping (Frontside) 2. Opposite Direction of Striping (Backside)
Measures of Effectiveness
• Initial Retroreflectivity • Retroreflectivity @ 1-Month, 2-Months, and
9-Months • Percent Change in Retroreflectivity over Time
Researchers determined the thermoplastic thicknesses evaluated in this experiment (60
mil, 75 mil, 90 mil, 100 mil, and 110 mil) based on the judgment of TxDOT and TTI staff. The
minimum thicknesses used in this evaluation (60 mil white, 90 mil yellow) were selected
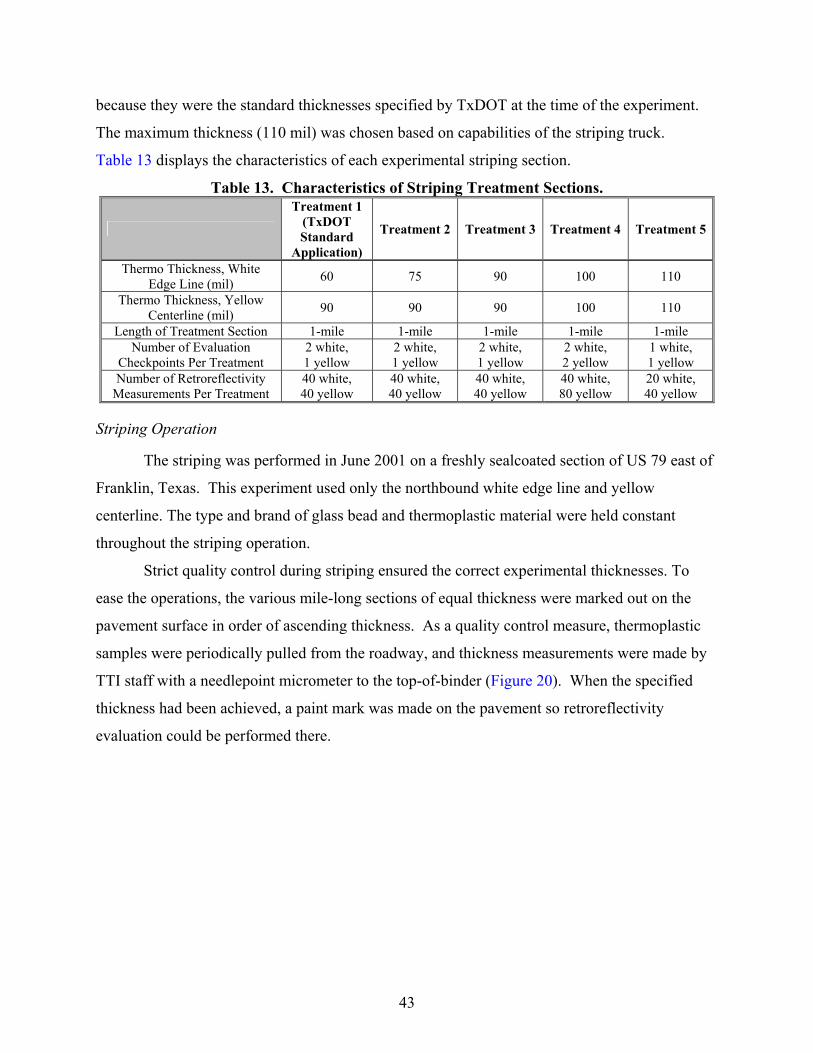
43
because they were the standard thicknesses specified by TxDOT at the time of the experiment.
The maximum thickness (110 mil) was chosen based on capabilities of the striping truck.
Table 13 displays the characteristics of each experimental striping section.
Table 13. Characteristics of Striping Treatment Sections.
Treatment 1 (TxDOT Standard
Application)
Treatment 2 Treatment 3 Treatment 4 Treatment 5
Thermo Thickness, White Edge Line (mil) 60 75 90 100 110
Thermo Thickness, Yellow Centerline (mil) 90 90 90 100 110
Length of Treatment Section 1-mile 1-mile 1-mile 1-mile 1-mile Number of Evaluation
Checkpoints Per Treatment 2 white, 1 yellow
2 white, 1 yellow
2 white, 1 yellow
2 white, 2 yellow
1 white, 1 yellow
Number of Retroreflectivity Measurements Per Treatment
40 white, 40 yellow
40 white, 40 yellow
40 white, 40 yellow
40 white, 80 yellow
20 white, 40 yellow
Striping Operation
The striping was performed in June 2001 on a freshly sealcoated section of US 79 east of
Franklin, Texas. This experiment used only the northbound white edge line and yellow
centerline. The type and brand of glass bead and thermoplastic material were held constant
throughout the striping operation.
Strict quality control during striping ensured the correct experimental thicknesses. To
ease the operations, the various mile-long sections of equal thickness were marked out on the
pavement surface in order of ascending thickness. As a quality control measure, thermoplastic
samples were periodically pulled from the roadway, and thickness measurements were made by
TTI staff with a needlepoint micrometer to the top-of-binder (Figure 20). When the specified
thickness had been achieved, a paint mark was made on the pavement so retroreflectivity
evaluation could be performed there.
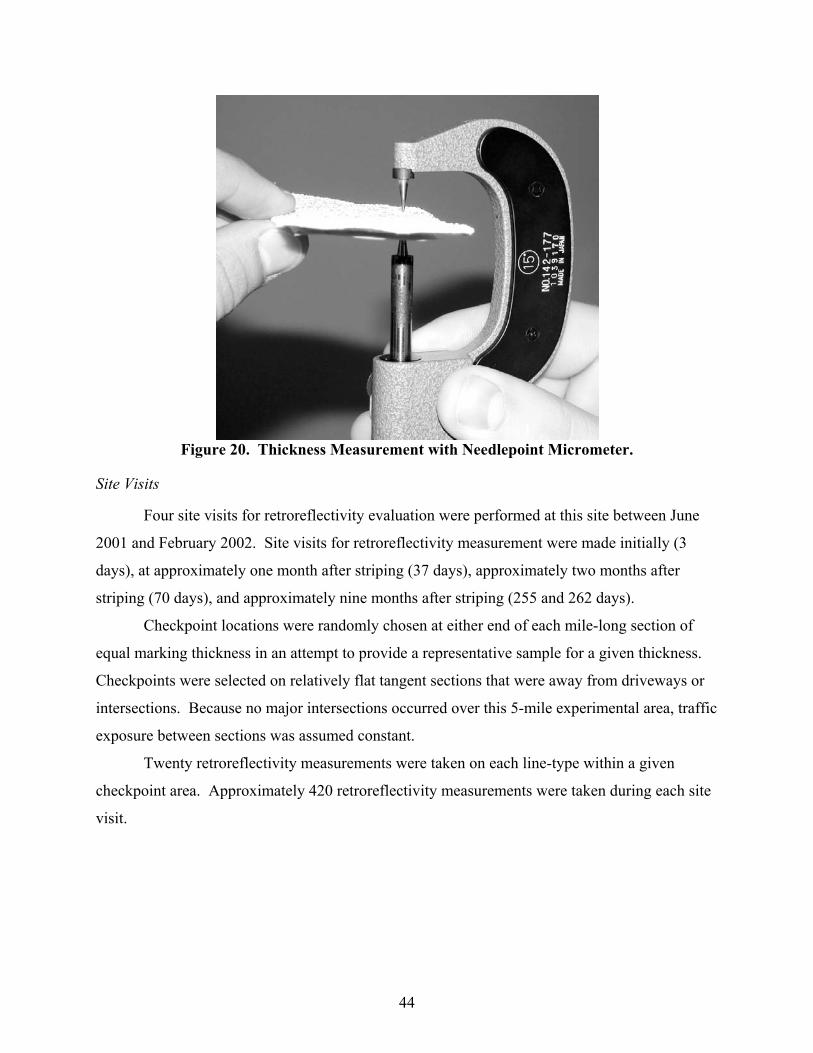
44
Figure 20. Thickness Measurement with Needlepoint Micrometer.
Site Visits
Four site visits for retroreflectivity evaluation were performed at this site between June
2001 and February 2002. Site visits for retroreflectivity measurement were made initially (3
days), at approximately one month after striping (37 days), approximately two months after
striping (70 days), and approximately nine months after striping (255 and 262 days).
Checkpoint locations were randomly chosen at either end of each mile-long section of
equal marking thickness in an attempt to provide a representative sample for a given thickness.
Checkpoints were selected on relatively flat tangent sections that were away from driveways or
intersections. Because no major intersections occurred over this 5-mile experimental area, traffic
exposure between sections was assumed constant.
Twenty retroreflectivity measurements were taken on each line-type within a given
checkpoint area. Approximately 420 retroreflectivity measurements were taken during each site
visit.

45
Analysis
To determine the effect of marking thicknesses on thermoplastic retroreflectivity both
initially and over time, many separate analyses were performed:
• The initial (3-day) retroreflectivity, one-month retroreflectivity, two-month
retroreflectivity, and nine-month retroreflectivity were analyzed as a function of the
nominal marking thickness and marking color.
• The percent change in retroreflectivity over time was analyzed as a function of the
nominal marking thickness, time, and marking color.
• The directional retroreflectivity characteristics of the yellow markings were
analyzed as a function of measurement direction and nominal marking thickness.
Initial and Long-Term Retroreflectivity
Thermoplastic thickness showed a significant effect on retroreflectivity, especially in the
long-term. Table 14 and Figure 21 display the average initial and long-term retroreflectivity for
each thickness for white edge line markings. Table 15 and Figure 22 display the average
retroreflectivity over time for each thickness for yellow centerline markings.
Table 14. Average Retroreflectivity for White Edge Line.
Thermoplastic Thickness (mils)
Number of Measurements
Per Section Per Site Visit
Average Initial Retro.
(mcd/m2/lx)
Average One Month Retro. (mcd/m2/lx)
Average Two-Month Retro. (mcd/m2/lx)
Average Nine-Month Retro. (mcd/m2/lx)
60 40 233 172 171 132 75 40 263 201 202 209 90 40 265 216 224 244 100 40 245 223 243 238 110 20 246 208 223 244
Table 15. Average Retroreflectivity for Yellow Centerline. Thermo.
Thickness (mils)
Meas. Direction
Number of Measurements
Per Section Per Site Visit
Average Initial Retro.
(mcd/m2/lx)
Average One Month Retro. (mcd/m2/lx)
Average Two-Month Retro. (mcd/m2/lx)
Average Nine-Month Retro. (mcd/m2/lx)
Frontside 60 157 134 123 161 90 Backside 60 131 117 111 134 Frontside 40 149 142 138 162 100 Backside 40 142 139 138 151 Frontside 20 164 150 146 169 110 Backside 20 155 141 140 158

46
120
140
160
180
200
220
240
260
280
0 25 50 75 100 125 150 175 200 225 250 275
Days After Striping
Ave
rage
Ret
rore
flect
ivity
(mcd
/m2 /lx
)
60 mil75 mil90 mil100 mil110 mil
Figure 21. Average Retroreflectivity for White Edge Line.
100
110
120
130
140
150
160
170
180
0 25 50 75 100 125 150 175 200 225 250 275Days After Striping
Ave
rage
Ret
rore
flect
ivity
(mcd
/m2 /lx
)
90 mil - withstriping direction
90 mil - oppositestriping direction
100 mil - withstriping direction
100 mil -opposite stripingdirection
110 mil - withstriping direction
110 mil -opposite stripingdirection
Figure 22. Average Retroreflectivity for Yellow Centerline.
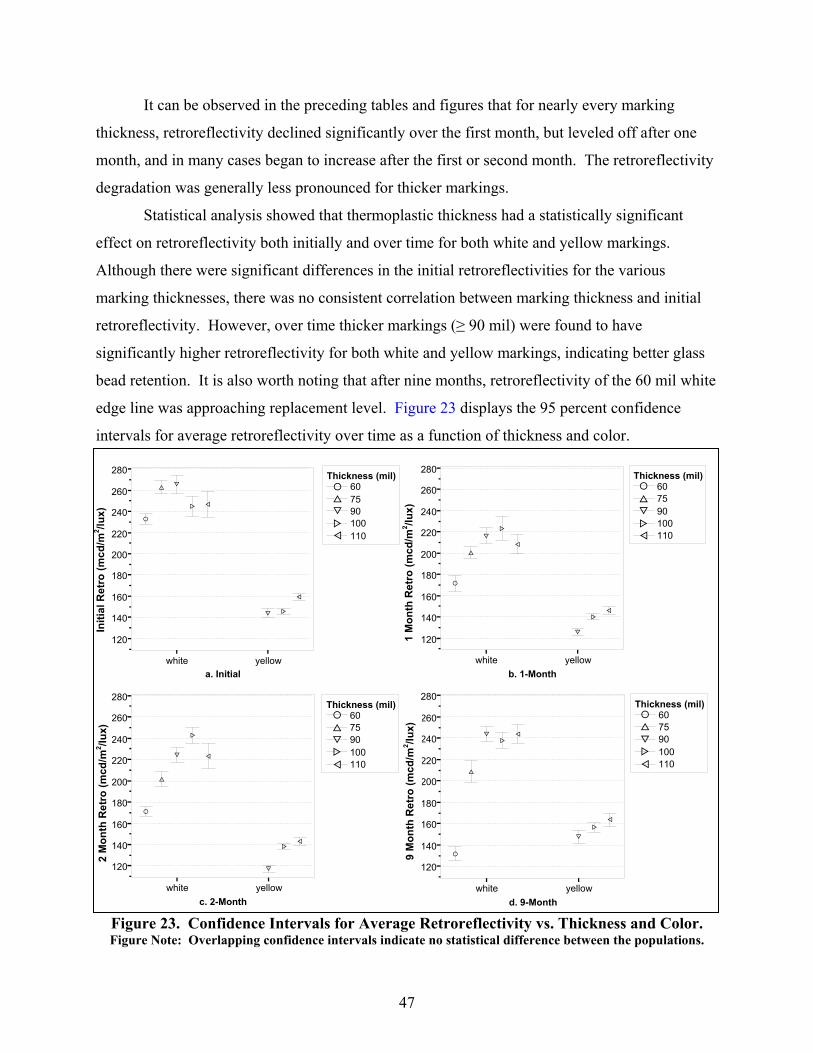
47
It can be observed in the preceding tables and figures that for nearly every marking
thickness, retroreflectivity declined significantly over the first month, but leveled off after one
month, and in many cases began to increase after the first or second month. The retroreflectivity
degradation was generally less pronounced for thicker markings.
Statistical analysis showed that thermoplastic thickness had a statistically significant
effect on retroreflectivity both initially and over time for both white and yellow markings.
Although there were significant differences in the initial retroreflectivities for the various
marking thicknesses, there was no consistent correlation between marking thickness and initial
retroreflectivity. However, over time thicker markings (≥ 90 mil) were found to have
significantly higher retroreflectivity for both white and yellow markings, indicating better glass
bead retention. It is also worth noting that after nine months, retroreflectivity of the 60 mil white
edge line was approaching replacement level. Figure 23 displays the 95 percent confidence
intervals for average retroreflectivity over time as a function of thickness and color.
A 60B 75C 90D 100E 110
Thickness (mil)
white yellowa. Initial
120
140
160
180
200
220
240
260
280
Initi
al R
etro
(mcd
/m2/
lx)
A
B C
D E
C D
E
A 60B 75C 90D 100E 110
Thickness (mil)
white yellowb. 1-Month
120
140
160
180
200
220
240
260
280
1 M
onth
Ret
ro (m
cd/m
2/lx
)
A
B
CD
E
C
DE
A 60B 75C 90D 100E 110
Thickness (mil)
white yellowc. 2-Month
120
140
160
180
200
220
240
260
280
2 M
onth
Ret
ro (m
cd/m
2/lx
)
A
B
C
D
E
C
DE
A 60B 75C 90D 100E 110
Thickness (mil)
white yellowd. 9-Month
120
140
160
180
200
220
240
260
280
9 M
onth
Ret
ro (m
cd/m
2/lx
)
A
B
CD
E
C
DE
Figure 23. Confidence Intervals for Average Retroreflectivity vs. Thickness and Color. Figure Note: Overlapping confidence intervals indicate no statistical difference between the populations.
Initi
al R
etro
(mcd
/m2 /lu
x)
1 M
onth
Ret
ro (m
cd/m
2 /lux)
2 M
onth
Ret
ro (m
cd/m
2 /lux)
9 M
onth
Ret
ro (m
cd/m
2 /lux)

48
Figure 23 shows that although there is no correlation between thermoplastic thickness
and initial retroreflectivity, sections with thicknesses equal to or greater than 90 mil maintain
greater levels of retroreflectivity in the long-term.
Change in Retroreflectivity over Time
Thermoplastic thickness was also found to have a significant effect on the rate of change
in retroreflectivity, especially in the long-term. Tables 16 and 17 display the average changes in
retroreflectivity as functions of thickness, time, and measurement direction (yellow only) for
white and yellow markings, respectively.
Table 16. Average Change in Retroreflectivity for White Edge Line. Average Retro. Change during
First Month Average Overall Retro. Change from
Initial to Ninth Month Thermo. Thickness (mils)
percent mcd/m2/lx/day percent mcd/m2/lx/day 60 -26.2 -1.77 -43.0 -0.40 75 -23.6 -1.78 -20.2 -0.21 90 -18.4 -1.41 -7.2 -0.09
100 -8.4 -0.64 -1.6 -0.03 110 -15.1 -1.12 0.02 -0.01
Table 17. Average Change in Retroreflectivity for Yellow Centerline.
Average Retro. Change during First Month
Average Overall Retro. Change from Initial to
Ninth Month
Thermo. Thickness
(mils)
Meas. Direction
percent mcd/m2/lx/day percent mcd/m2/lx/day Frontside -14.7 -0.66 3.2 0.01 90 Backside -9.9 -0.38 2.7 0.01 Frontside -5.1 -0.23 9.0 0.06 100 Backside -1.8 -0.10 6.7 0.03 Frontside -8.4 -0.40 3.3 0.02 110 Backside -8.7 -0.40 2.0 0.01
It can be observed from the preceding tables that thermoplastic thickness had a
significant effect on the change in retroreflectivity over time, but only for markings equal to or
greater than 90 mil. Figure 24 shows that markings with thicknesses equal to or greater than
90 mil retained initial levels of retroreflectivity during the first nine months significantly better
than marking sections that were thinner than 90 mil.
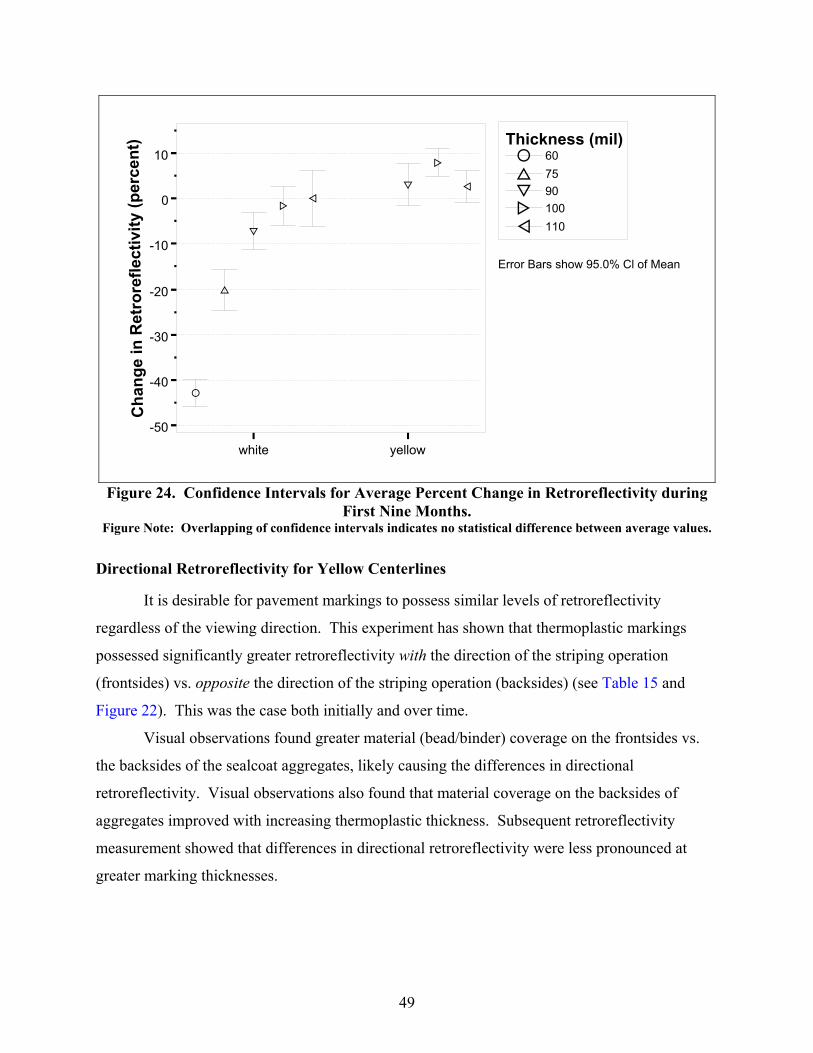
49
A 60B 75C 90D 100E 110
Thickness (mil)
Error Bars show 95.0% Cl of Mean
white yellow
-50
-40
-30
-20
-10
0
10C
hang
e in
Ret
rore
flect
ivity
(per
cent
)
A
B
C
DE
C
D
E
Figure 24. Confidence Intervals for Average Percent Change in Retroreflectivity during
First Nine Months. Figure Note: Overlapping of confidence intervals indicates no statistical difference between average values.
Directional Retroreflectivity for Yellow Centerlines
It is desirable for pavement markings to possess similar levels of retroreflectivity
regardless of the viewing direction. This experiment has shown that thermoplastic markings
possessed significantly greater retroreflectivity with the direction of the striping operation
(frontsides) vs. opposite the direction of the striping operation (backsides) (see Table 15 and
Figure 22). This was the case both initially and over time.
Visual observations found greater material (bead/binder) coverage on the frontsides vs.
the backsides of the sealcoat aggregates, likely causing the differences in directional
retroreflectivity. Visual observations also found that material coverage on the backsides of
aggregates improved with increasing thermoplastic thickness. Subsequent retroreflectivity
measurement showed that differences in directional retroreflectivity were less pronounced at
greater marking thicknesses.
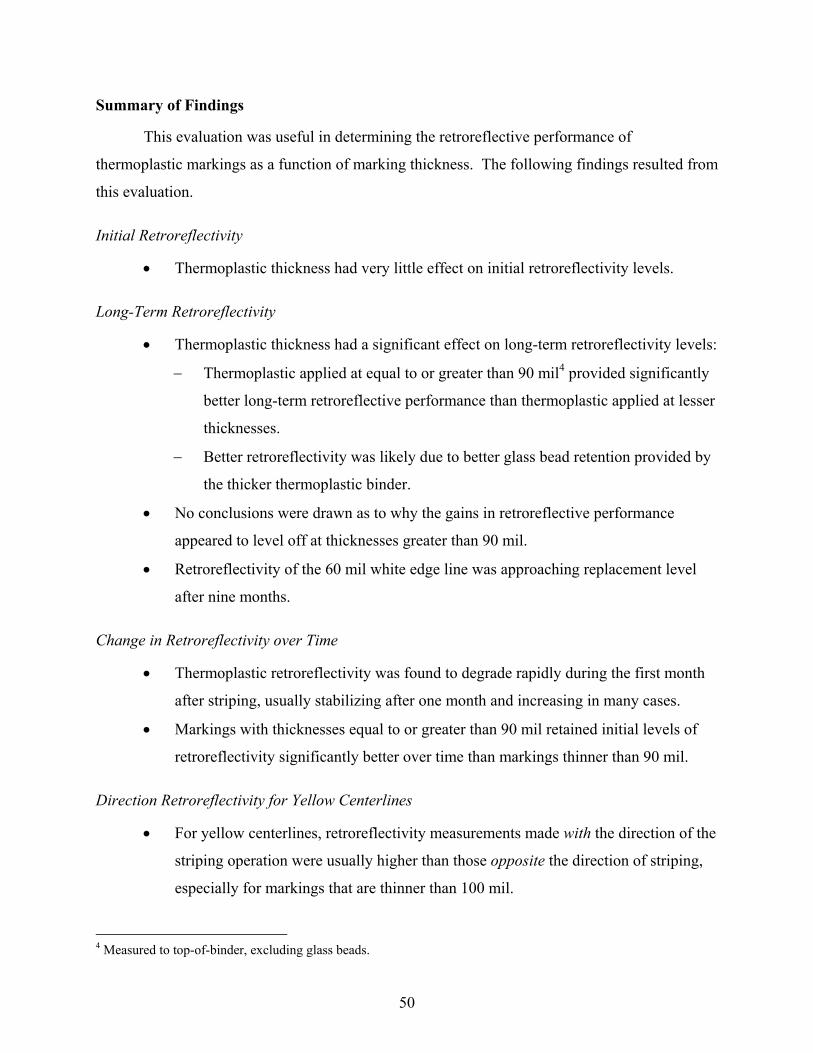
50
Summary of Findings
This evaluation was useful in determining the retroreflective performance of
thermoplastic markings as a function of marking thickness. The following findings resulted from
this evaluation.
Initial Retroreflectivity
• Thermoplastic thickness had very little effect on initial retroreflectivity levels.
Long-Term Retroreflectivity
• Thermoplastic thickness had a significant effect on long-term retroreflectivity levels:
− Thermoplastic applied at equal to or greater than 90 mil4 provided significantly
better long-term retroreflective performance than thermoplastic applied at lesser
thicknesses.
− Better retroreflectivity was likely due to better glass bead retention provided by
the thicker thermoplastic binder.
• No conclusions were drawn as to why the gains in retroreflective performance
appeared to level off at thicknesses greater than 90 mil.
• Retroreflectivity of the 60 mil white edge line was approaching replacement level
after nine months.
Change in Retroreflectivity over Time
• Thermoplastic retroreflectivity was found to degrade rapidly during the first month
after striping, usually stabilizing after one month and increasing in many cases.
• Markings with thicknesses equal to or greater than 90 mil retained initial levels of
retroreflectivity significantly better over time than markings thinner than 90 mil.
Direction Retroreflectivity for Yellow Centerlines
• For yellow centerlines, retroreflectivity measurements made with the direction of the
striping operation were usually higher than those opposite the direction of striping,
especially for markings that are thinner than 100 mil.
4 Measured to top-of-binder, excluding glass beads.

51
− Visual observations showed that that the frontsides of the aggregate receive
better applications of material than the backsides.
− Differences in directional retroreflectivity were less pronounced at greater
marking thicknesses.
EVALUTION #4: EVALUATION OF VARIOUS PAINT AND THERMOPLASTIC APPLICATIONS ON NEW SEALCOAT
To address issues involving sealcoat curing, a pavement marking experiment determined
the effectiveness of standard waterbased paint used in either of the following ways:
• as a surface primer prior to thermoplastic application or
• as a temporary pavement marking.
Researchers hypothesized that using paint as a primer on a new sealcoat would provide
the following advantages:
• level out the voids and gaps in the sealcoat surface, improving thermoplastic
retroreflectivity;
• reduce the occurrence of asphalt boiling through thermoplastic on application; and
• provide a less costly alternative to other primer materials.
Additionally, if paint was found to provide suitable retroreflectivity for several months as
a temporary pavement marking, thermoplastic could be placed at a much later date, well after the
sealcoat surface had fully cured. Lengthening the time between sealcoat and thermoplastic
applications would greatly reduce pavement marking problems associated with the sealcoat
asphalt binder and might provide lower overall striping costs.
Objectives
The objectives of the experiment were as follows:
• determine the performance of 100 mil thermoplastic new sealcoat with large
aggregates (TxDOT Grade 3),
• determine the effects of using HD-21 waterbased paint as a primer prior to
thermoplastic application on new sealcoat,
• compare the long-term performance of HD-21 waterbased paint pavement markings
to that of 100 mil thermoplastic pavement markings on new sealcoat,

52
• determine the difference in retroreflective performance of large glass beads (TxDOT
Type III) vs. standard glass beads (TxDOT Type II) for 100 mil thermoplastic on
new sealcoat, and
• compare the long-term performance of 130 mil thermoplastic (double application)
vs. 100 mil thermoplastic (single application) on new sealcoat.
Description of Evaluation
The attributes of this experiment are found in Table 18.
Table 18. Attributes of Evaluation #4. Location US 90, West of Beaumont, Texas
FM 365, South of Beaumont, Texas
Roadway Type
US 90: Four-lane divided rural highway without shoulders FM 365: Two-way, two-lane rural highway with shoulders
Length of Each Striping Section 2 miles
Average Daily Traffic US 90: 14,000 FM 365: 4000
Sealcoat Aggregate Grade 3 (precoated clay shale) Striping Dates May 8-12, 2001 Evaluation Periods Initial and 130 days Striping Condition New Sealcoat Surface
Pavement Marking Thickness Thermo: 100 mil Paint: 25 mil Paint used as primer: 25 mil
Beads TxDOT Type II or TxDOT Type III
Experimental Variables
• Marking Type 1. 100 mil Thermo – Unprimed Surface 2. 100 mil Thermo – Primed Surface 3. 25 mil Paint
• Thermoplastic Application 1. Single 2. Double
• Marking Position 1. Edge Line 2. Lane Line
• Glass Bead Type 1. TxDOT Type II 2. TxDOT Type III (unprimed thermo only)
• Centerline Measurement Direction 1. With Direction of Striping (Frontside) 2. Opposite Direction of Striping (Backside)
Measures of Effectiveness • Initial Retroreflectivity • Four-Month Retroreflectivity • Percent Change in Retroreflectivity over Time

53
Roadway Characteristics
The evaluation occurred on two different freshly sealcoated roadways, (FM 365 and
US 90) in the Beaumont, Texas, area. FM 365 was a two-lane rural highway with wide
shoulders and an ADT of 4000. US 90 was a four-lane divided highway with no shoulders and a
directional ADT of 14,000. The two roadways were selected primarily due to their different
levels of traffic.
Pavement Marking Treatments
Four different pavement marking treatment sections were applied to each roadway. The
same materials and application properties were used for all lines within a given section. In
addition, the striping materials and properties for a given section were identical between the two
roadways. Each treatment section was approximately 2 miles in length. Table 19 displays the
material and application characteristics of the pavement markings for each of the experimental
striping sections on both highways.
Table 19. Characteristics of Striping Treatment Sections. Treatment 1 Treatment 2 Treatment 3 Treatment 4
Marking Waterbased Paint
Thermo (Paint Primer)
Thermo (Unprimed)
Thermo (Unprimed)
Marking Thickness (mil) 25 100 100 100
Beads TxDOT Type II
TxDOT Type II
TxDOT Type II
TxDOT Type III
Site Visits
Site visits were made initially and after four months to evaluate the various pavement
marking treatments. Two checkpoint locations were randomly chosen at either end of each
treatment section in an attempt to provide a representative sample for a given treatment. Twenty
retroreflectivity measurements were taken on each line type within a given checkpoint area.
Table 20 describes the evaluation characteristics for each site.

54
Table 20. Characteristics of Retroreflectivity Evaluation. US 90 FM 365
Markings Included in Evaluation WB White Edge Line, WB White Lane Line, WB Yellow Edge Line
EB White Edge Line, WB White Edge Line, Yellow Centerline
(both directions) Number of Checkpoints per Section 2 2
Number of Retroreflectivity Measurements per Line Type per Section
40 40
Analysis
To determine the effect of the various pavement marking treatments on retroreflectivity
both initially and over time, many analyses were performed.
• The initial retroreflectivity and 4-month retroreflectivity were analyzed as a function
of the site, material type, color, position on roadway, marking thickness, glass bead
size, and primer.
• The percent change in retroreflectivity was analyzed as a function of the site,
material type, color, position on roadway, marking thickness, glass bead size, and
primer.
Initial and 4-Month Retroreflectivity
Tables 21 and 22 display the average retroreflectivity for white and yellow markings for
US 90 and FM 365, respectively.

55
Table 21. Average Initial and 4-Month Retroreflectivity, US 90.
White Edge Line White Lane Line Yellow Edge Line
Sec. No. Treatment Average
Initial Retro.
(mcd/m2/lx)
Average Four-Month Retro.
(mcd/m2/lx)
Average Initial Retro.
(mcd/m2/lx)
Average Four-Month Retro.
(mcd/m2/lx)
Average Initial Retro.
(mcd/m2/lx)
Average Four-Month
Retro. (mcd/m2/lx)
1
25 mil Waterbased Paint w/ Std.
Beads
233 200 304 233 123 90
2
100 mil Thermo w/
Std. Beads & Paint Primer
346 203 292 304 225 179
3
100 mil Themo w/
Std. Beads & No Primer
321 248 311 312 234 201
4
100 mil Thermo w/ Large Glass Beads & No
Primer
293 180 368 296 202 153
Table 22. Average Initial and 4-Month Retroreflectivity, FM 365.
White Edge Line Yellow Centerline – Frontside
Yellow Centerline – Backside
Sec. No. Treatment Average
Initial Retro.
(mcd/m2/lx)
Average Four-Month Retro.
(mcd/m2/lx)
Average Initial Retro.
(mcd/m2/lx)
Average Four-Month Retro.
(mcd/m2/lx)
Average Initial Retro.
(mcd/m2/lx)
Average Four-Month
Retro. (mcd/m2/lx)
1
25 mil Waterbased
Paint w/ Std. Beads
238 171 104 80 72 57
2
100 mil Thermo w/ Std. Beads
& Paint Primer
394 408 206 227 199 211
3
100 mil Themo w/ Std. Beads
& No Primer
381 404 213 229 221 225
4
100 mil Thermo w/ Large Glass Beads & No
Primer
333 378 267 249 217 196
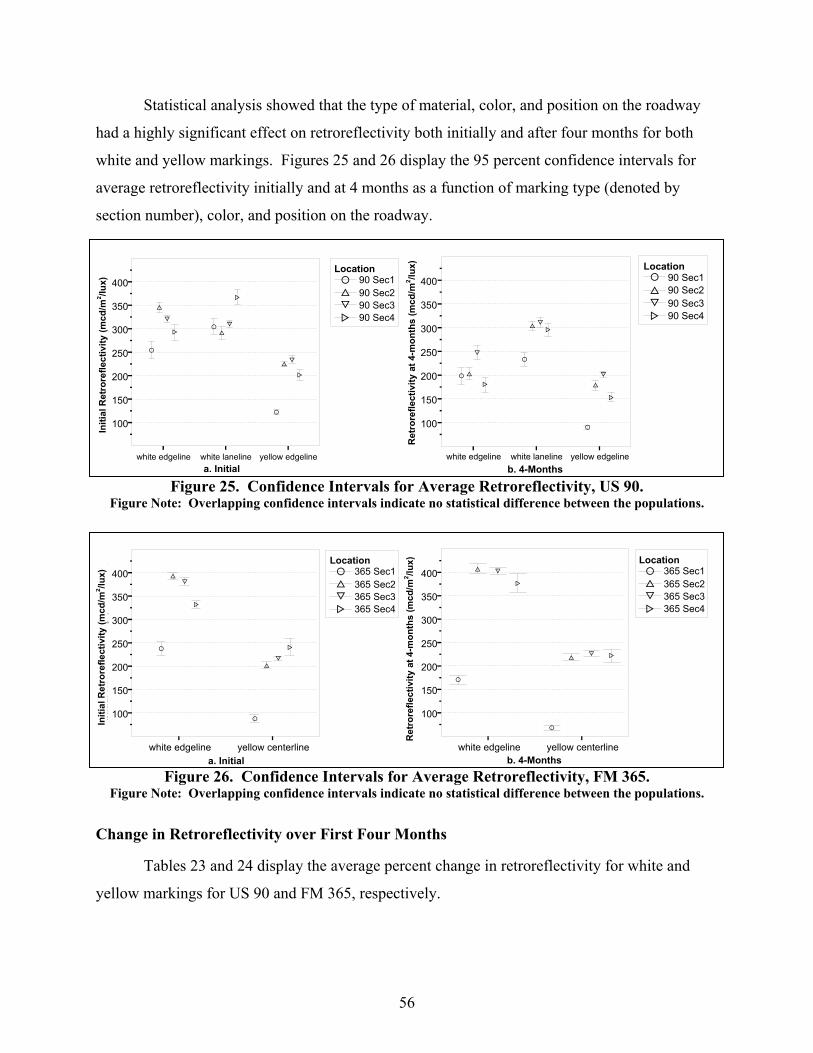
56
Statistical analysis showed that the type of material, color, and position on the roadway
had a highly significant effect on retroreflectivity both initially and after four months for both
white and yellow markings. Figures 25 and 26 display the 95 percent confidence intervals for
average retroreflectivity initially and at 4 months as a function of marking type (denoted by
section number), color, and position on the roadway.
A 90 Sec1B 90 Sec2C 90 Sec3D 90 Sec4
Location
a. Initialwhite edgeline white laneline yellow edgeline
100
150
200
250
300
350
400
Initi
al R
etro
refle
ctiv
ity (m
cd/m
2/lx
)
A
B
C
DABC
D
A
BC
D
A 90 Sec1B 90 Sec2C 90 Sec3D 90 Sec4
Location
b. 4-Monthswhite edgeline white laneline yellow edgeline
100
150
200
250
300
350
400
Ret
rore
flect
ivity
at 4
-mon
ths
(mcd
/m2/
lx)
A B
C
D
A
B CD
A
B
C
D
Figure 25. Confidence Intervals for Average Retroreflectivity, US 90.
Figure Note: Overlapping confidence intervals indicate no statistical difference between the populations.
A 365 Sec1B 365 Sec2C 365 Sec3D 365 Sec4
Location
white edgeline yellow centerlinea. Initial
100
150
200
250
300
350
400
Initi
al R
etro
refle
ctiv
ity (m
cd/m
2/lx
)
A
BC
D
A
BC
D
A 365 Sec1B 365 Sec2C 365 Sec3D 365 Sec4
Location
b. 4-Monthswhite edgeline yellow centerline
100
150
200
250
300
350
400
Ret
rore
flect
ivity
at 4
-mon
ths
(mcd
/m2/
lx)
A
B C
D
A
BC D
Figure 26. Confidence Intervals for Average Retroreflectivity, FM 365.
Figure Note: Overlapping confidence intervals indicate no statistical difference between the populations.
Change in Retroreflectivity over First Four Months
Tables 23 and 24 display the average percent change in retroreflectivity for white and
yellow markings for US 90 and FM 365, respectively.
Initi
al R
etro
refle
ctiv
ity (m
cd/m
2 /lux)
Ret
rore
flect
ivity
at 4
-mon
ths
(mcd
/m2 /lu
x)
Ret
rore
flect
ivity
at 4
-mon
ths
(mcd
/m2 /lu
x)
Initi
al R
etro
refle
ctiv
ity (m
cd/m
2 /lux)

57
Table 23. Average Change in Retroreflectivity over First Four Months, US 90.
White Edge Line White Lane Line Yellow Edge Line Sec. No. Treatment Average
Change (percent)
Average Rate of Change
(mcd/m2/lx/day)
Average Change
(percent)
Average Rate of Change
(mcd/m2/lx/day)
Average Change
(percent)
Average Rate of Change
(mcd/m2/lx/day)
1
25 mil Waterbased
Paint w/ Std. Beads
-21.4 -0.42 -23.1 -0.53 -26.6 -0.26
2
100 mil Thermo w/ Std. Beads
& Paint Primer
-41.4 -1.07 5.7 0.09 -20.6 -0.36
3
100 mil Themo w/ Std. Beads
& No Primer
-22.8 -0.57 0.43 0.01 -12.3 -0.26
4
100 mil Thermo w/ Large Glass Beads & No
Primer
-38.1 -0.87 -19.1 -0.55 -21.8 -0.38
Table 24. Average Change in Retroreflectivity over First Four Months, FM 365.
White Edge Line Yellow Centerline – Frontside
Yellow Centerline – Backside Sec.
No. Treatment Average Change
(percent)
Average Rate of Change
(mcd/m2/lx/day)
Average Change
(percent)
Average Rate of Change
(mcd/m2/lx/day)
Average Change
(percent)
Average Rate of Change
(mcd/m2/lx/day)
1
25 mil Waterbased
Paint w/ Std. Beads
-27.6 -0.52 -20.3 -0.19 -19.3 -0.12
2
100 mil Thermo w/ Std. Beads
& Paint Primer
3.9 0.11 10.6 0.16 6.6 0.09
3
100 mil Themo w/ Std. Beads
& No Primer
6.5 0.18 7.9 0.12 2.1 0.03
4
100 mil Thermo w/ Large Glass
Beads & No Primer
13.8 0.33 -4.1 -0.14 -5.1 -0.16
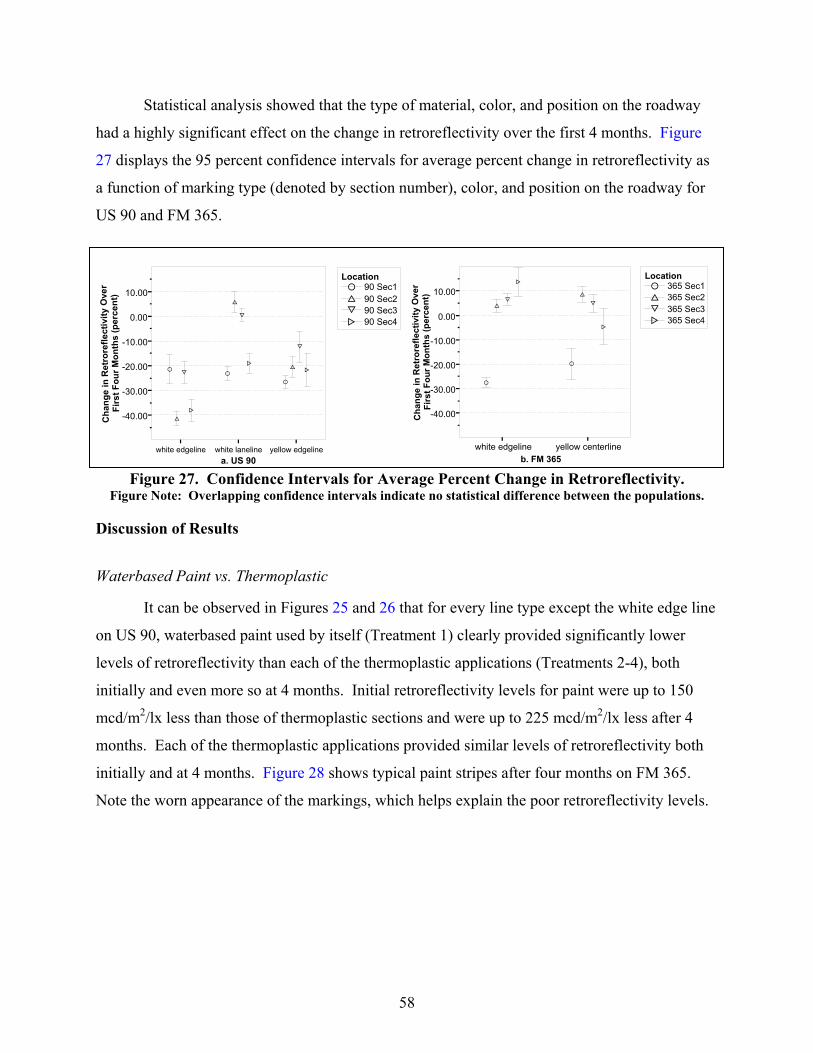
58
Statistical analysis showed that the type of material, color, and position on the roadway
had a highly significant effect on the change in retroreflectivity over the first 4 months. Figure
27 displays the 95 percent confidence intervals for average percent change in retroreflectivity as
a function of marking type (denoted by section number), color, and position on the roadway for
US 90 and FM 365.
A 90 Sec1B 90 Sec2C 90 Sec3D 90 Sec4
Location
a. US 90white edgeline white laneline yellow edgeline
-40.00
-30.00
-20.00
-10.00
0.00
10.00
Cha
nge
in R
etro
refle
ctiv
ity O
ver
Firs
t Fou
r Mon
ths
(per
cent
)
A
B
C
D
A
B
C
D
A
B
C
D
A 365 Sec1B 365 Sec2C 365 Sec3D 365 Sec4
Location
b. FM 365white edgeline yellow centerline
-40.00
-30.00
-20.00
-10.00
0.00
10.00
Cha
nge
in R
etro
refle
ctiv
ity O
ver
Firs
t Fou
r Mon
ths
(per
cent
)
A
BC
D
A
B
C
D
Figure 27. Confidence Intervals for Average Percent Change in Retroreflectivity.
Figure Note: Overlapping confidence intervals indicate no statistical difference between the populations.
Discussion of Results
Waterbased Paint vs. Thermoplastic
It can be observed in Figures 25 and 26 that for every line type except the white edge line
on US 90, waterbased paint used by itself (Treatment 1) clearly provided significantly lower
levels of retroreflectivity than each of the thermoplastic applications (Treatments 2-4), both
initially and even more so at 4 months. Initial retroreflectivity levels for paint were up to 150
mcd/m2/lx less than those of thermoplastic sections and were up to 225 mcd/m2/lx less after 4
months. Each of the thermoplastic applications provided similar levels of retroreflectivity both
initially and at 4 months. Figure 28 shows typical paint stripes after four months on FM 365.
Note the worn appearance of the markings, which helps explain the poor retroreflectivity levels.
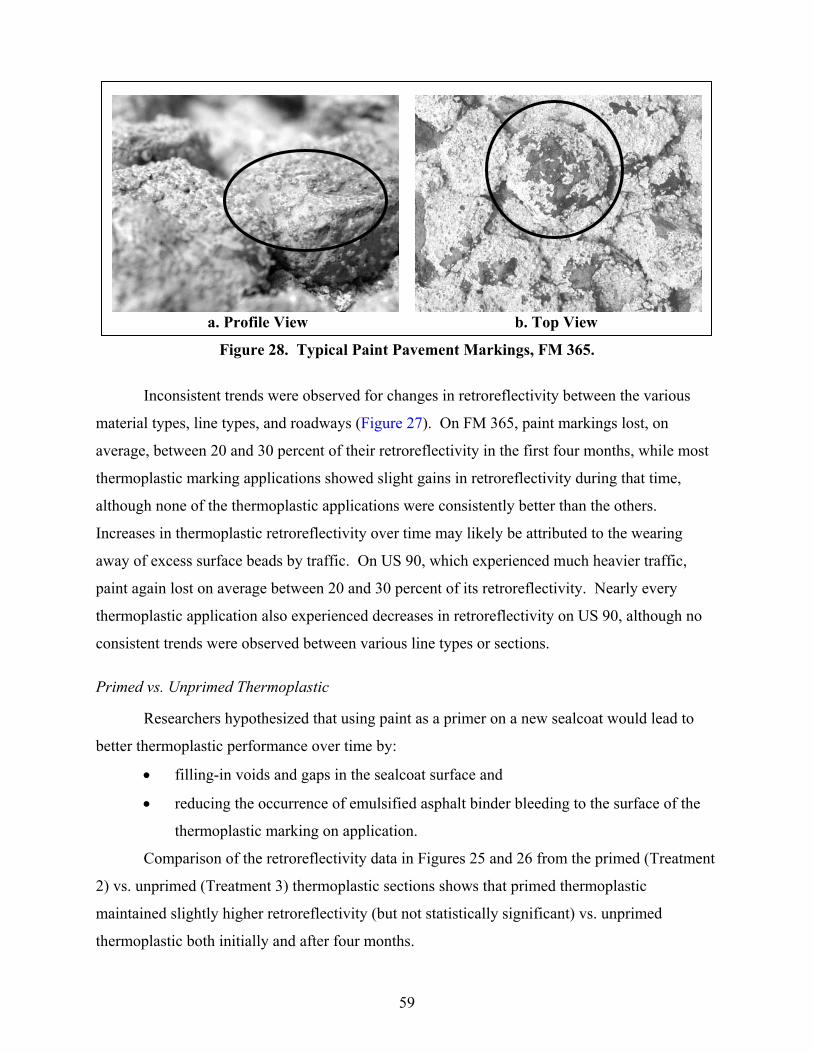
59
a. Profile View b. Top View
Figure 28. Typical Paint Pavement Markings, FM 365.
Inconsistent trends were observed for changes in retroreflectivity between the various
material types, line types, and roadways (Figure 27). On FM 365, paint markings lost, on
average, between 20 and 30 percent of their retroreflectivity in the first four months, while most
thermoplastic marking applications showed slight gains in retroreflectivity during that time,
although none of the thermoplastic applications were consistently better than the others.
Increases in thermoplastic retroreflectivity over time may likely be attributed to the wearing
away of excess surface beads by traffic. On US 90, which experienced much heavier traffic,
paint again lost on average between 20 and 30 percent of its retroreflectivity. Nearly every
thermoplastic application also experienced decreases in retroreflectivity on US 90, although no
consistent trends were observed between various line types or sections.
Primed vs. Unprimed Thermoplastic
Researchers hypothesized that using paint as a primer on a new sealcoat would lead to
better thermoplastic performance over time by:
• filling-in voids and gaps in the sealcoat surface and
• reducing the occurrence of emulsified asphalt binder bleeding to the surface of the
thermoplastic marking on application.
Comparison of the retroreflectivity data in Figures 25 and 26 from the primed (Treatment
2) vs. unprimed (Treatment 3) thermoplastic sections shows that primed thermoplastic
maintained slightly higher retroreflectivity (but not statistically significant) vs. unprimed
thermoplastic both initially and after four months.
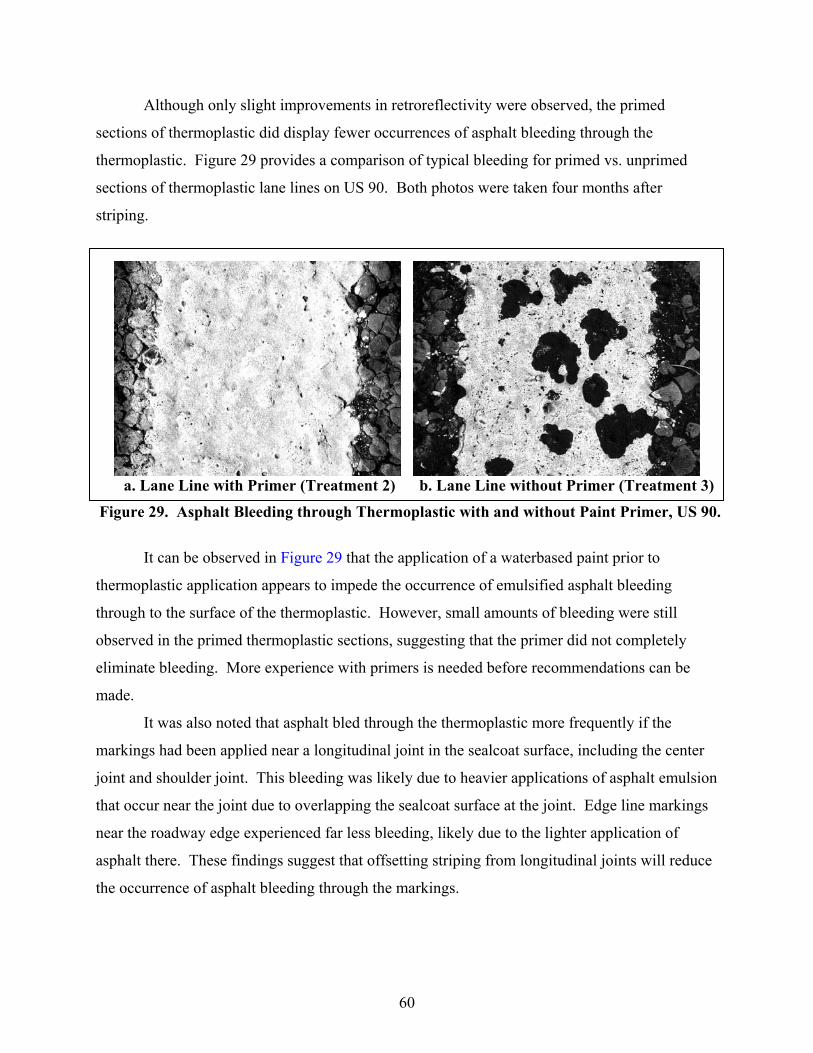
60
Although only slight improvements in retroreflectivity were observed, the primed
sections of thermoplastic did display fewer occurrences of asphalt bleeding through the
thermoplastic. Figure 29 provides a comparison of typical bleeding for primed vs. unprimed
sections of thermoplastic lane lines on US 90. Both photos were taken four months after
striping.
a. Lane Line with Primer (Treatment 2) b. Lane Line without Primer (Treatment 3)
Figure 29. Asphalt Bleeding through Thermoplastic with and without Paint Primer, US 90.
It can be observed in Figure 29 that the application of a waterbased paint prior to
thermoplastic application appears to impede the occurrence of emulsified asphalt bleeding
through to the surface of the thermoplastic. However, small amounts of bleeding were still
observed in the primed thermoplastic sections, suggesting that the primer did not completely
eliminate bleeding. More experience with primers is needed before recommendations can be
made.
It was also noted that asphalt bled through the thermoplastic more frequently if the
markings had been applied near a longitudinal joint in the sealcoat surface, including the center
joint and shoulder joint. This bleeding was likely due to heavier applications of asphalt emulsion
that occur near the joint due to overlapping the sealcoat surface at the joint. Edge line markings
near the roadway edge experienced far less bleeding, likely due to the lighter application of
asphalt there. These findings suggest that offsetting striping from longitudinal joints will reduce
the occurrence of asphalt bleeding through the markings.
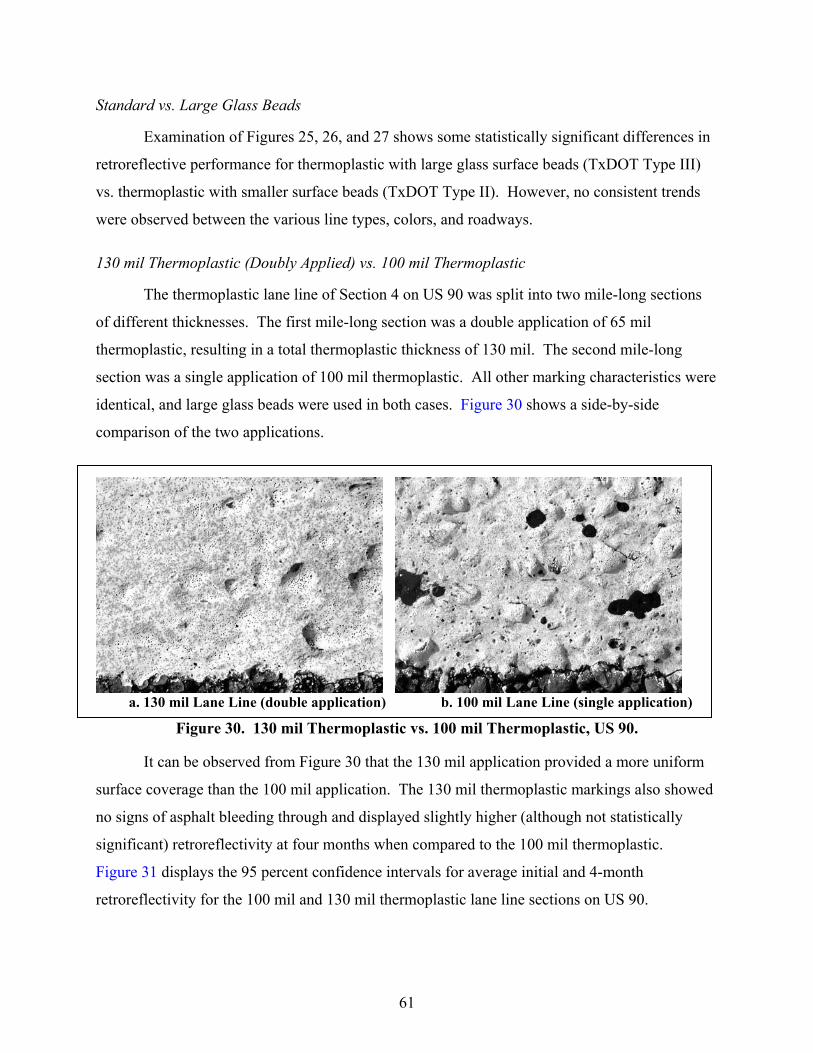
61
Standard vs. Large Glass Beads
Examination of Figures 25, 26, and 27 shows some statistically significant differences in
retroreflective performance for thermoplastic with large glass surface beads (TxDOT Type III)
vs. thermoplastic with smaller surface beads (TxDOT Type II). However, no consistent trends
were observed between the various line types, colors, and roadways.
130 mil Thermoplastic (Doubly Applied) vs. 100 mil Thermoplastic
The thermoplastic lane line of Section 4 on US 90 was split into two mile-long sections
of different thicknesses. The first mile-long section was a double application of 65 mil
thermoplastic, resulting in a total thermoplastic thickness of 130 mil. The second mile-long
section was a single application of 100 mil thermoplastic. All other marking characteristics were
identical, and large glass beads were used in both cases. Figure 30 shows a side-by-side
comparison of the two applications.
a. 130 mil Lane Line (double application) b. 100 mil Lane Line (single application)
Figure 30. 130 mil Thermoplastic vs. 100 mil Thermoplastic, US 90.
It can be observed from Figure 30 that the 130 mil application provided a more uniform
surface coverage than the 100 mil application. The 130 mil thermoplastic markings also showed
no signs of asphalt bleeding through and displayed slightly higher (although not statistically
significant) retroreflectivity at four months when compared to the 100 mil thermoplastic.
Figure 31 displays the 95 percent confidence intervals for average initial and 4-month
retroreflectivity for the 100 mil and 130 mil thermoplastic lane line sections on US 90.

62
A 100B 130
Thickness
Error Bars show 95.0% Cl of Mean
Initial 4-Month
275
300
325
350
375
400
425
450
Ret
rore
flect
ivity
(mcd
/m2/
lx)
A
B
A
B
Figure 31. Confidence Intervals for Average Initial and 4-Month Retroreflectivity vs.
Thermoplastic Thickness. Figure Note: Overlapping confidence intervals indicate no statistical difference between the populations.
Sealcoat Aggregate Density
During the site visits, TTI research staff noted inconsistencies in the dispersion of
aggregates laterally across the sealcoat surface. For example, sealcoat aggregates were more
closely spaced near the center of the roadway when compared to the edge of the roadway,
creating a smoother surface for striping. Figure 32 displays a comparison of a typical white
thermoplastic edge line vs. lane line on the primed thermoplastic section of US 90.
a. Edge Line - Sparse Aggregate Coverage b. Lane Line - Dense Aggregate Coverage
Figure 32. Typical 100 mil White Thermoplastic Edge Line vs. Lane Line, US 90.
Ret
rore
flect
ivity
(mcd
/m2 /lu
x)
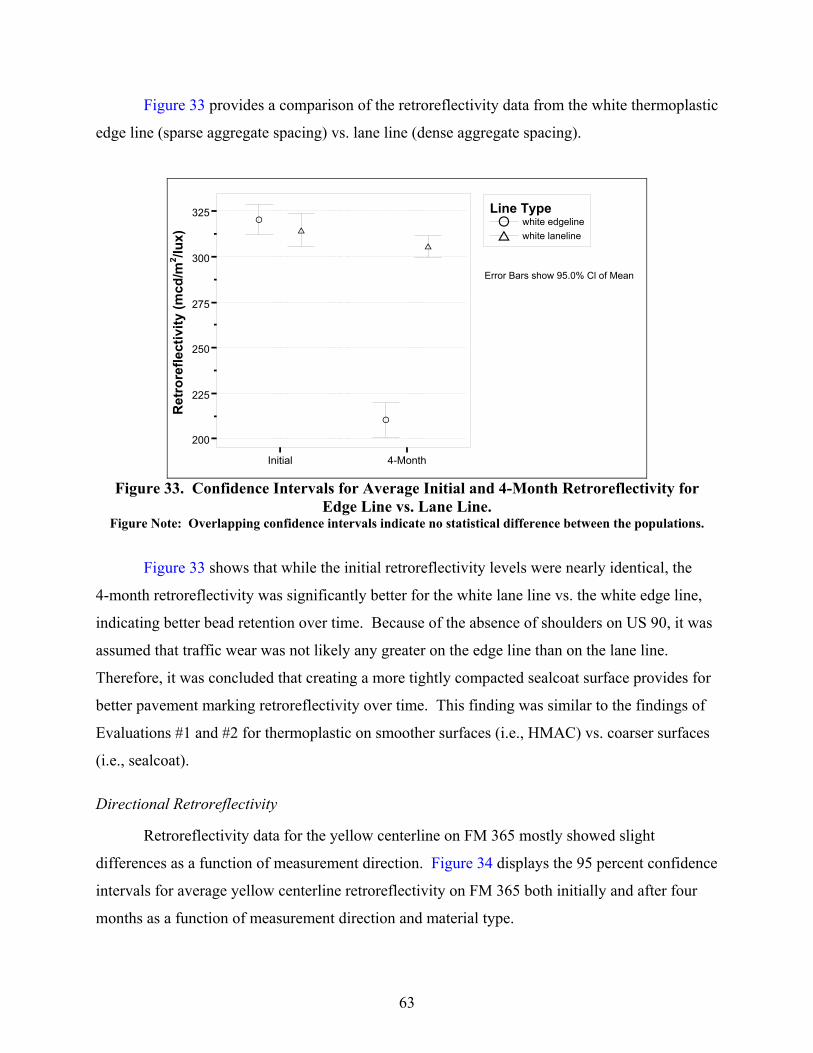
63
Figure 33 provides a comparison of the retroreflectivity data from the white thermoplastic
edge line (sparse aggregate spacing) vs. lane line (dense aggregate spacing).
A white edgelineB white laneline
Line Type
Error Bars show 95.0% Cl of Mean
Initial 4-Month
200
225
250
275
300
325
Ret
rore
flect
ivity
(mcd
/m2/
lx)
AB
A
B
Figure 33. Confidence Intervals for Average Initial and 4-Month Retroreflectivity for
Edge Line vs. Lane Line. Figure Note: Overlapping confidence intervals indicate no statistical difference between the populations.
Figure 33 shows that while the initial retroreflectivity levels were nearly identical, the
4-month retroreflectivity was significantly better for the white lane line vs. the white edge line,
indicating better bead retention over time. Because of the absence of shoulders on US 90, it was
assumed that traffic wear was not likely any greater on the edge line than on the lane line.
Therefore, it was concluded that creating a more tightly compacted sealcoat surface provides for
better pavement marking retroreflectivity over time. This finding was similar to the findings of
Evaluations #1 and #2 for thermoplastic on smoother surfaces (i.e., HMAC) vs. coarser surfaces
(i.e., sealcoat).
Directional Retroreflectivity
Retroreflectivity data for the yellow centerline on FM 365 mostly showed slight
differences as a function of measurement direction. Figure 34 displays the 95 percent confidence
intervals for average yellow centerline retroreflectivity on FM 365 both initially and after four
months as a function of measurement direction and material type.
Ret
rore
flect
ivity
(mcd
/m2 /lu
x)

64
A 365 Sec1B 365 Sec2C 365 Sec3D 365 Sec4
Location
with oppositea. Initial
50
75
100
125
150
175
200
225
250
275In
itial
Ret
rore
flect
ivity
(mcd
/m2/
lx)
A
BC
D
A
B
C D
A 365 Sec1B 365 Sec2C 365 Sec3D 365 Sec4
Location
with oppositeb. 4-Month
50
75
100
125
150
175
200
225
250
275
Ret
rore
flect
ivity
at 4
-mon
ths
(mcd
/m2/
lx)
A
B C
D
A
BC
D
Figure 34. Confidence Intervals for Average Initial and 4-Month Retroreflectivity for
Yellow Centerline. Figure Note: Overlapping confidence intervals indicate no statistical difference between the populations.
In nearly every case, yellow centerlines had slightly higher levels of retroreflectivity both
initially and after four months when measured with the direction of the striping operation
(frontside) vs. opposite the direction of striping operation (backside). However, these
differences were statistically significant only for paint and thermoplastic with large glass beads.
The differences in yellow centerline retroreflectivity as a function of measurement direction were
far less pronounced in this experiment than in the thermoplastic thickness experiment
(Evaluation #3).
Summary of Findings
Thermoplastic Performance
• All sections of thermoplastic displayed adequate retroreflectivity after four months:
− average white: 200 to 400 mcd/m2/lx
− average yellow: 150 to 225 mcd/m2/lx.
• Thermoplastic retroreflectivity was, in many cases, found to increase over the first
four months.
• Double thermoplastic applications displayed slightly higher (but not statistically
significant) retroreflectivity at four months when compared to single applications of
similar thickness.
Initi
al R
etro
refle
ctiv
ity (m
cd/m
2 /lux)
Ret
rore
flect
ivity
at 4
-mon
ths
(mcd
/m2 /lu
x)
65
Waterbased Paint Performance
• White paint maintained reasonable levels of retroreflectivity after four months,
averaging 170 – 230 mcd/m2/lx.
• Nearly all yellow paint sections were approaching replacement levels after four
months, averaging below 100 mcd/m2/lx.
Waterbased Paint vs. Thermoplastic
• Waterbased paint pavement markings provided significantly lower levels of
retroreflectivity than all thermoplastic applications both initially and after 4 months.
− Initial retroreflectivity:
► up to 150 mcd/m2/lx less than thermoplastic.
− Four-month retroreflectivity:
► up to 225 mcd/m2/lx less than thermoplastic.
Waterbased Paint as a Primer
• Thermoplastic applied over waterbased paint primer maintained slightly higher
levels of retroreflectivity (but not statistically significant) vs. unprimed
thermoplastic both initially and after four months.
• Use of waterbased paint primer under thermoplastic reduced considerably the
occurrence of emulsified asphalt bleeding up through the thermoplastic when
compared to unprimed thermoplastic sections.
− Bleeding on the unprimed sections was not severe enough to significantly affect
retroreflectivity. Nighttime visibility comparisons support this finding.
Sealcoat Characteristics
• Asphalt bleeding through the thermoplastic occurred more frequently if markings
were placed near a longitudinal joint, such as the center joint or shoulder joint.
• Thermoplastic pavement markings placed on sections with densely spaced
aggregates displayed better retroreflective performance over time vs. those placed on
sections with sparsely spaced aggregates.
66
Glass Bead Performance
• No considerable differences in retroreflectivity were found between thermoplastic
with large glass beads (TxDOT Type III) vs. small glass beads (TxDOT Type II).
Directional Retroreflectivity
• Yellow centerlines had slightly higher levels of retroreflectivity both initially and
after four months when measured with the direction of the striping operation
(frontside) vs. opposite the direction of striping operation (backside).
EVALUATION #5: EVALUATION OF GLASS BEAD SIZE AND SEALCOAT AGGREGATE GRADE
Over the past five years, TxDOT experienced an increase in both the use of large glass
surface beads for striping and the use of larger aggregate for sealcoats. Many TxDOT personnel
perceive large glass beads (now designated by TxDOT as Type III) as providing increased
retroreflectivity over the smaller Type II glass beads that had been TxDOT’s standard for many
years. Although Evaluation #4 showed no considerable differences in retroreflectivity between
100 mil thermoplastic with large vs. small glass beads, further evaluation of glass bead size was
deemed necessary.
Sealcoat aggregate size recently became an important issue as TxDOT districts have
begun to specify Grade 3 aggregates, which are larger than the commonly used Grade 4
aggregates. The resulting Grade 3 sealcoats are often coarser than Grade 4 sealcoats, creating a
more textured surface for pavement markings and possibly reducing retroreflective performance.
Researchers decided that a formal field evaluation would be helpful to quantify differences in
performance for thermoplastic on Grade 3 vs. Grade 4 sealcoat.
The objectives of this evaluation were as follows:
• determine the difference in retroreflective performance of large glass beads (TxDOT
Type III) vs. small glass beads (TxDOT Type II) for 100 mil thermoplastic on new
sealcoat and
• determine the difference in retroreflective performance of 100-mil thermoplastic
placed on new Grade 3 sealcoat vs. new Grade 4 sealcoat.

67
Description of Evaluation
Table 25 displays the attributes of this evaluation.
Table 25. Attributes of Evaluation #5. Locations FM 2838, FM 1365, FM 2117, Loop 265, FM
1512 (all Waco District) Roadway Types Two-way, two-lane rural highway with shoulders Average Daily Traffic 500 - 1500 Striping Date First two weeks of September 2003 Thermoplastic Thickness 100 mil Evaluation Period 1-month after striping Striping Condition New sealcoat surfaces
Experimental Variables
• Sealcoat Aggregate Grade 1. Grade 3 (Larger) 2. Grade 4 (Smaller)
• Bead Size 1. TxDOT Type II (Small) 2. TxDOT Type III (Large)
• Centerline Pattern 1. Skip 2. Solid
• Centerline Measurement Direction 1. With Direction of Striping (Frontside) 2. Opposite Direction of Striping (Backside)
Measure of Effectiveness • Retroreflectivity after one month
The striping sections on each the five roadways were between 2 and 5 miles in length.
Unlike other evaluations that have been described in this report, each roadway received a single
marking treatment over the entire length. TTI researchers were not present during the striping
operation, and no initial retroreflectivity measurements were taken. Table 26 displays the
characteristics of each striping treatment section.
Table 26. Characteristics of Striping Treatment Sections. FM 2838 FM 1365 FM 2117 LP 265 FM 1512
Thermoplastic Thickness (mil) 100 100 100 100 100
Sealcoat Aggregate (TxDOT) Grade 4 Grade 4 Grade 4 Grade 4 Grade 3
Glass Bead (TxDOT) Type III Type III Type II Type II Type III Length of Striping
Section 3 miles 6 miles 5 miles 2 miles 4 miles
Number of Evaluation Checkpoints Per
Roadway
2 white, 2 yellow
2 white, 2 yellow
2 white, 2 yellow
2 white, 2 yellow
2 white, 2 yellow
Number of Retroreflectivity
Measurements Per Roadway
80 white, 80 yellow
80 white, 80 yellow
80 white, 80 yellow
80 white, 80 yellow
80 white, 160 yellow

68
Site Visit
Field evaluation of each striping section measured characteristics after the markings had
been in place for approximately one month. Two pavement marking evaluation checkpoint areas
were defined within each treatment section. Checkpoint locations randomly chosen at either end
of each section provided a representative sample for a given treatment. Twenty retroreflectivity
measurements were taken on each line-type within a given checkpoint area. White edge line
retroreflectivity was measured only in the direction of traffic, while yellow centerlines were
measured in both directions.
Every checkpoint included a section of passing/no passing zone with skip and solid
yellow markings side-by-side. Both skip and solid yellow centerlines were measured side-by-
side in both directions, with 10 measurements per direction per line type.
Analysis
To determine the effect of the various glass bead/sealcoat aggregate combinations on
retroreflectivity, many separate analyses were performed.
• The 1-month retroreflectivity was analyzed as a function of the glass bead type and
marking color.
• The 1-month retroreflectivity was analyzed as a function of the sealcoat aggregate
grade and marking color.
• The 1-month retroreflectivity for yellow centerline markings was analyzed as a
function measurement direction and marking pattern (skip vs. solid).
Effect of Glass Bead Type and Sealcoat Aggregate Grade
Table 27 displays the average 1-month retroreflectivity for white and yellow markings at
each site.
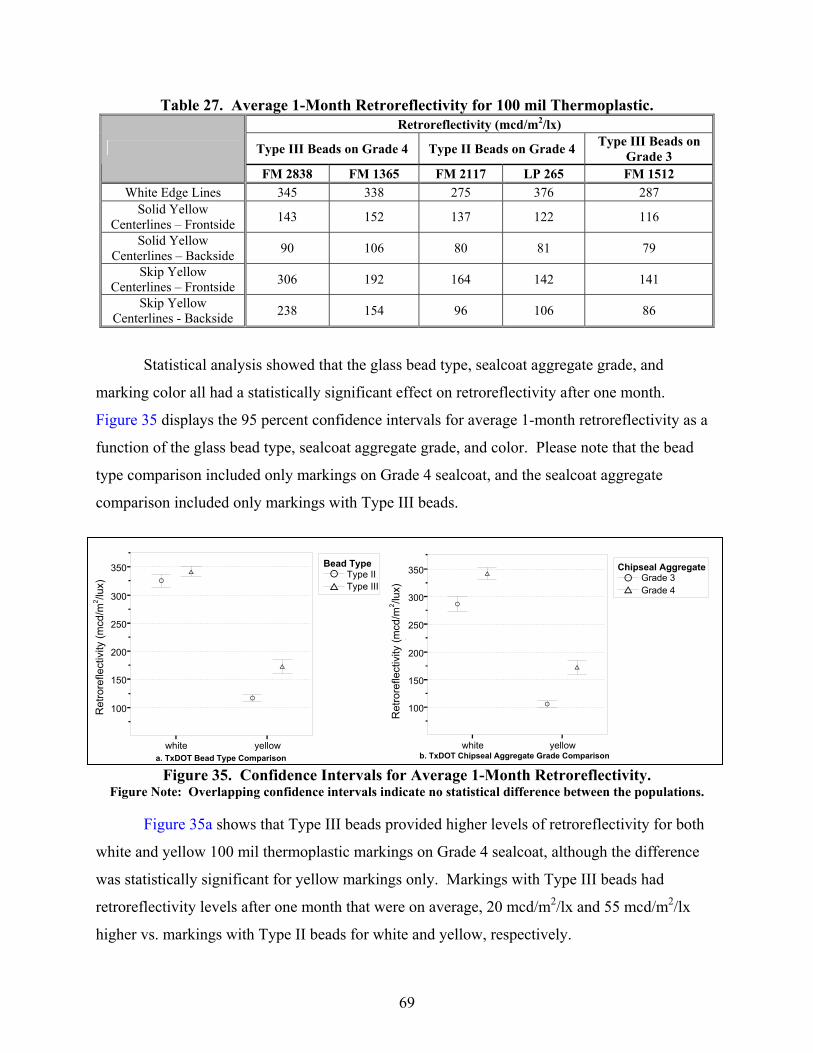
69
Table 27. Average 1-Month Retroreflectivity for 100 mil Thermoplastic. Retroreflectivity (mcd/m2/lx)
Type III Beads on Grade 4 Type II Beads on Grade 4 Type III Beads on Grade 3
FM 2838 FM 1365 FM 2117 LP 265 FM 1512 White Edge Lines 345 338 275 376 287
Solid Yellow Centerlines – Frontside 143 152 137 122 116
Solid Yellow Centerlines – Backside 90 106 80 81 79
Skip Yellow Centerlines – Frontside 306 192 164 142 141
Skip Yellow Centerlines - Backside 238 154 96 106 86
Statistical analysis showed that the glass bead type, sealcoat aggregate grade, and
marking color all had a statistically significant effect on retroreflectivity after one month.
Figure 35 displays the 95 percent confidence intervals for average 1-month retroreflectivity as a
function of the glass bead type, sealcoat aggregate grade, and color. Please note that the bead
type comparison included only markings on Grade 4 sealcoat, and the sealcoat aggregate
comparison included only markings with Type III beads.
A Type IIB Type III
Bead Type
a. TxDOT Bead Type Comparisonwhite yellow
100
150
200
250
300
350
Ret
rore
flect
ivity
(mcd
/m2/
lx) A
B
A
B
A Grade 3B Grade 4
Chipseal Aggregate
b. TxDOT Chipseal Aggregate Grade Comparisonwhite yellow
100
150
200
250
300
350
Ret
rore
flect
ivity
(mcd
/m2/
lx)
A
B
A
B
Figure 35. Confidence Intervals for Average 1-Month Retroreflectivity.
Figure Note: Overlapping confidence intervals indicate no statistical difference between the populations.
Figure 35a shows that Type III beads provided higher levels of retroreflectivity for both
white and yellow 100 mil thermoplastic markings on Grade 4 sealcoat, although the difference
was statistically significant for yellow markings only. Markings with Type III beads had
retroreflectivity levels after one month that were on average, 20 mcd/m2/lx and 55 mcd/m2/lx
higher vs. markings with Type II beads for white and yellow, respectively.
Ret
rore
flect
ivity
(mcd
/m2 /lu
x)
Ret
rore
flect
ivity
(mcd
/m2 /lu
x)
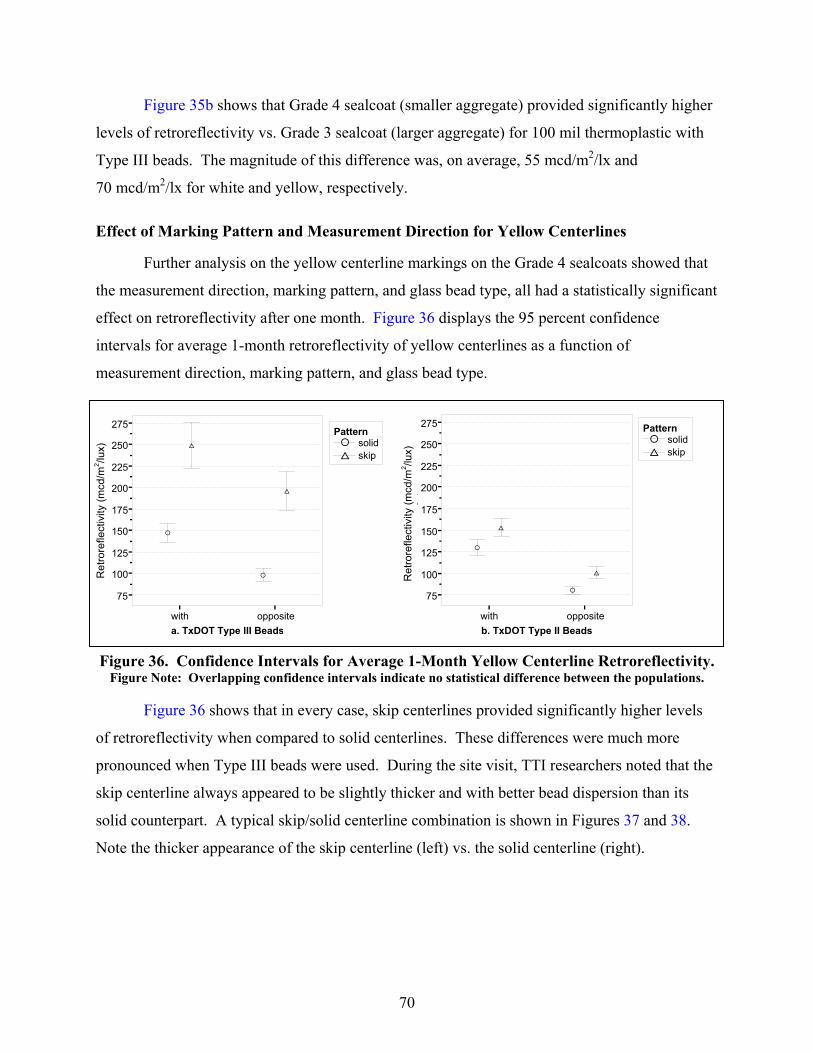
70
Figure 35b shows that Grade 4 sealcoat (smaller aggregate) provided significantly higher
levels of retroreflectivity vs. Grade 3 sealcoat (larger aggregate) for 100 mil thermoplastic with
Type III beads. The magnitude of this difference was, on average, 55 mcd/m2/lx and
70 mcd/m2/lx for white and yellow, respectively.
Effect of Marking Pattern and Measurement Direction for Yellow Centerlines
Further analysis on the yellow centerline markings on the Grade 4 sealcoats showed that
the measurement direction, marking pattern, and glass bead type, all had a statistically significant
effect on retroreflectivity after one month. Figure 36 displays the 95 percent confidence
intervals for average 1-month retroreflectivity of yellow centerlines as a function of
measurement direction, marking pattern, and glass bead type.
A solidB skip
Pattern
with oppositea. TxDOT Type III Beads
75
100
125
150
175
200
225
250
275
Ret
rore
flect
ivity
(mcd
/m2/
lx)
A
B
A
B
A solidB skip
Pattern
with oppositeb. TxDOT Type II Beads
75
100
125
150
175
200
225
250
275R
etro
refle
ctiv
ity (m
cd/m
2/lx
)
A
B
A
B
Figure 36. Confidence Intervals for Average 1-Month Yellow Centerline Retroreflectivity. Figure Note: Overlapping confidence intervals indicate no statistical difference between the populations.
Figure 36 shows that in every case, skip centerlines provided significantly higher levels
of retroreflectivity when compared to solid centerlines. These differences were much more
pronounced when Type III beads were used. During the site visit, TTI researchers noted that the
skip centerline always appeared to be slightly thicker and with better bead dispersion than its
solid counterpart. A typical skip/solid centerline combination is shown in Figures 37 and 38.
Note the thicker appearance of the skip centerline (left) vs. the solid centerline (right).
Ret
rore
flect
ivity
(mcd
/m2 /lu
x)
Ret
rore
flect
ivity
(mcd
/m2 /lu
x)

71
Figure 37. Typical Skip (left)/Solid (right) Centerline on Grade 4 Sealcoat.
a. Skip Centerline b. Solid Centerline
Figure 38. Close-Up Skip/Solid Centerline on Grade 4 Sealcoat.
A contractor explanation for this phenomenon is that the thermoplastic striping truck
cannot supply the necessary quantities of striping material to produce two 100 mil stripes
simultaneously. Therefore, one of the two stripes consistently receives less material. For this
evaluation, the skip centerlines always appeared to receive greater material quantities compared
to the solid centerline.
72
Similar to the findings from other field evaluations cited in this report, for all cases,
yellow centerline retroreflectivity measured with the direction of the striping operation was
significantly higher than retroreflectivity measurements taken in the opposite direction of the
striping operation. Again, this indicates that the frontsides of the aggregates received better
bead/binder coverage than the backsides.
Summary of Findings
Effect of Glass Bead Size
• Type III beads provided higher levels of thermoplastic retroreflectivity vs. Type II
beads:
− average white edge line: 20 mcd/m2/lx higher with Type III beads vs. Type II
and
− average yellow centerline: 55 mcd/m2/lx higher with Type III beads vs. Type II.
• Retroreflectivity differences were only statistically significant for yellow markings.
Effect of Chipseal Aggregate Size
• Grade 4 sealcoat provided significantly higher levels of thermoplastic
retroreflectivity vs. Grade 3 sealcoat:
− average white edge line: 55 mcd/m2/lx higher for Grade 4 vs. Grade 3 and
− average yellow centerline: 70 mcd/m2/lx higher for Grade 4 vs. Grade 3.
Application of Double Centerlines
• Thermoplastic double centerlines (solid/solid line or solid/broken line) were applied
inconsistently due to limitations in the capabilities of the striping truck:
− One of the two lines was consistently thinner and had fewer glass beads than the
other, causing significant differences in retroreflectivity.
− Retroreflectivity differences were much more pronounced with Type III beads.
Directional Retroreflectivity for Yellow Centerlines
• Similar to the findings from other field evaluations cited in this report, yellow
centerline retroreflectivity measured with the direction of the striping operation was

73
significantly higher than retroreflectivity measurements taken opposite the direction
of the striping operation.

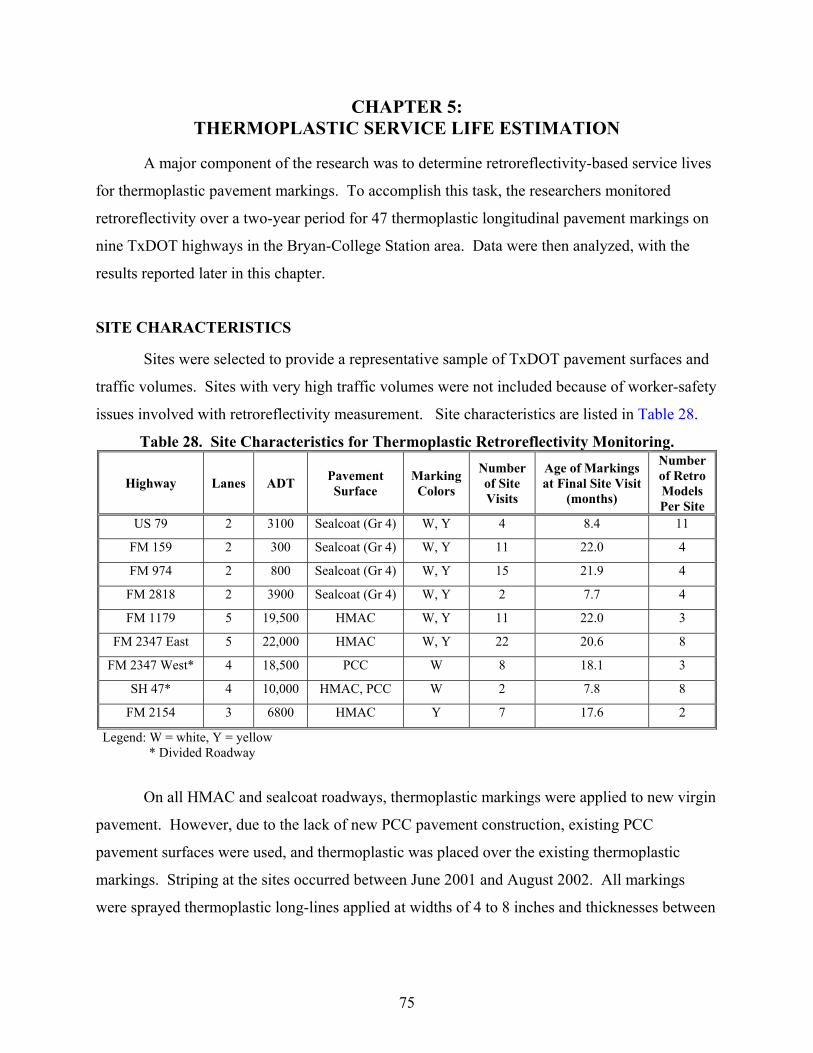
75
CHAPTER 5: THERMOPLASTIC SERVICE LIFE ESTIMATION
A major component of the research was to determine retroreflectivity-based service lives
for thermoplastic pavement markings. To accomplish this task, the researchers monitored
retroreflectivity over a two-year period for 47 thermoplastic longitudinal pavement markings on
nine TxDOT highways in the Bryan-College Station area. Data were then analyzed, with the
results reported later in this chapter.
SITE CHARACTERISTICS
Sites were selected to provide a representative sample of TxDOT pavement surfaces and
traffic volumes. Sites with very high traffic volumes were not included because of worker-safety
issues involved with retroreflectivity measurement. Site characteristics are listed in Table 28.
Table 28. Site Characteristics for Thermoplastic Retroreflectivity Monitoring.
Highway Lanes ADT Pavement Surface
Marking Colors
Number of Site Visits
Age of Markings at Final Site Visit
(months)
Number of Retro Models Per Site
US 79 2 3100 Sealcoat (Gr 4) W, Y 4 8.4 11
FM 159 2 300 Sealcoat (Gr 4) W, Y 11 22.0 4
FM 974 2 800 Sealcoat (Gr 4) W, Y 15 21.9 4
FM 2818 2 3900 Sealcoat (Gr 4) W, Y 2 7.7 4
FM 1179 5 19,500 HMAC W, Y 11 22.0 3
FM 2347 East 5 22,000 HMAC W, Y 22 20.6 8
FM 2347 West* 4 18,500 PCC W 8 18.1 3
SH 47* 4 10,000 HMAC, PCC W 2 7.8 8
FM 2154 3 6800 HMAC Y 7 17.6 2
Legend: W = white, Y = yellow * Divided Roadway
On all HMAC and sealcoat roadways, thermoplastic markings were applied to new virgin
pavement. However, due to the lack of new PCC pavement construction, existing PCC
pavement surfaces were used, and thermoplastic was placed over the existing thermoplastic
markings. Striping at the sites occurred between June 2001 and August 2002. All markings
were sprayed thermoplastic long-lines applied at widths of 4 to 8 inches and thicknesses between
76
60 and 110 mils. The markings were applied by a variety of contractors using TxDOT standard
thermoplastic materials (DMS 8220) and either Type II or Type III glass surface beads.
At a minimum, the markings were measured both initially and at least 7 months after
striping, although most sites were visited on numerous occasions. TTI researchers made all
retroreflectivity measurements using the same 30-meter geometry handheld retroreflectometer.
In total, approximately 5900 retroreflectivity measurements were made over a two-year period.
METHODOLOGY FOR SERVICE LIFE ESTIMATION
The objective of the analysis was to determine, based on the data collected at these sites,
reasonable expectations for thermoplastic service life as a function of pavement surface and
marking color.
General Modeling Description
Researchers used statistical modeling of the retroreflectivity data vs. time to estimate
service lives of the markings. Large variations in the retroreflectivity data existed from site-to-
site and line-to-line. As a result, models were developed for each line at each site with two
separate models created for each yellow centerline based on measurement direction.
Approximately 5900 retroreflectivity measurements made at the nine sites generated 47
retroreflectivity models. The modeling procedures were similar to those used by Migletz, et al.
in a pavement marking service-life study for FHWA (15).
Threshold Retroreflectivity Level
No criteria currently exist for establishing retroreflectivity levels that define the end-of-
service-life for pavement markings. However, based on suggestions from numerous literature
sources (6,7,8) and FHWA retroreflectivity guidelines (13), the researchers selected
100 mcd/m2/lx for the retroreflectivity service-life threshold for all markings included in this
analysis. Therefore, the service life for an individual marking was defined as the amount of time
between marking placement and when marking retroreflectivity had degraded to 100 mcd/m2/lx
based on the regression model. Please note that the 100 mcd/m2/lx retroreflectivity threshold
was selected for analysis purposes only and does not constitute a standard or establish a
minimum level.
77
Maximum Thermoplastic Service Life
In many cases, retroreflectivity was found to increase over the life of the marking,
causing subsequent service life estimations to approach infinity. In these cases, it was necessary
to assign an assumed maximum service life value. The FHWA service-life study by Migletz et
al. (15) and observations by TxDOT personnel suggested four years as a reasonable maximum
service life for thermoplastic. Therefore, for the analyses performed here, the researchers
assumed a maximum thermoplastic service life of four years.
Retroreflectivity Modeling Procedures
Two modeling approaches were used to determine service lives of the markings:
• Modeling Approach #1: Linear, exponential, and logarithmic regression models
have been shown in previous research to provide a good representation of changes in
pavement marking retroreflectivity over time (15). The first, and preferred, method
for quantifying retroreflectivity vs. time was by fitting linear, exponential, and
logarithmic regression models to the data for each pavement marking at each site.
The model with the highest R2 was generally selected as the preferred model for that
line, assuming that the model was significant (based on the F-statistic) and R2 was
greater than 0.15. For pavement markings that were measured only on two
occasions, only linear regression was performed.
• Modeling Approach #2: For cases where none of the regression models were
significant or all R2 were less than 0.15, a more primitive modeling approach was
considered in which a straight line was passed through the average initial and
average final retroreflectivity measurements. The slope and intercept of this line
determined a linear model.
RESULTS
A total of 47 models were generated, which accounted for all measured lines at all sites.
For yellow centerlines, separate models were generated for each retroreflectivity measurement
direction (with the direction of striping vs. opposite the direction of striping). The outcome of
the modeling procedure was as follows:

78
Service Life Threshold
• 14 linear regression (30 percent),
• 10 logarithmic regression (21 percent),
• 6 exponential regression (13 percent), and
• 17 cases in which no model could be fit to the data (36 percent) and therefore
Modeling Approach #2 (endpoint model) was employed.
The R2 values for the regression models were summarized as follows:
• Average: 0.52
• 25th percentile: 0.39
• 75th percentile: 0.70
Predicted Retroreflectivity Performance
Figures 39 – 41 display the results of the retroreflectivity modeling procedures for white
thermoplastic on HMAC, PCC and sealcoat, respectively. Similar results were found for yellow
markings, which can be found in Appendix B. Complete results of the modeling procedures and
service life estimations can also be found in Appendix B.
100
150
200
250
300
350
400
450
500
550
600
0 5 10 15 20 25 30 35 40 45 50
Time After Striping (months)
Ret
rore
flect
ivity
(mcd
/m2 /lx
)
Model 1 - FM 1179 LL 1Model 2 - FM 2347 EL1Model 3 - FM 2347 LL1Model 4 - FM 2347 EL2Model 5 - FM 2347 LL2Model 6 - SH 47 EL1Model 7 - SH 47 EL2Model 8 - SH 47 LL1Model 9 - SH 47 LL2
Figure 39. Retroreflectivity Modeling for White Thermoplastic on HMAC.
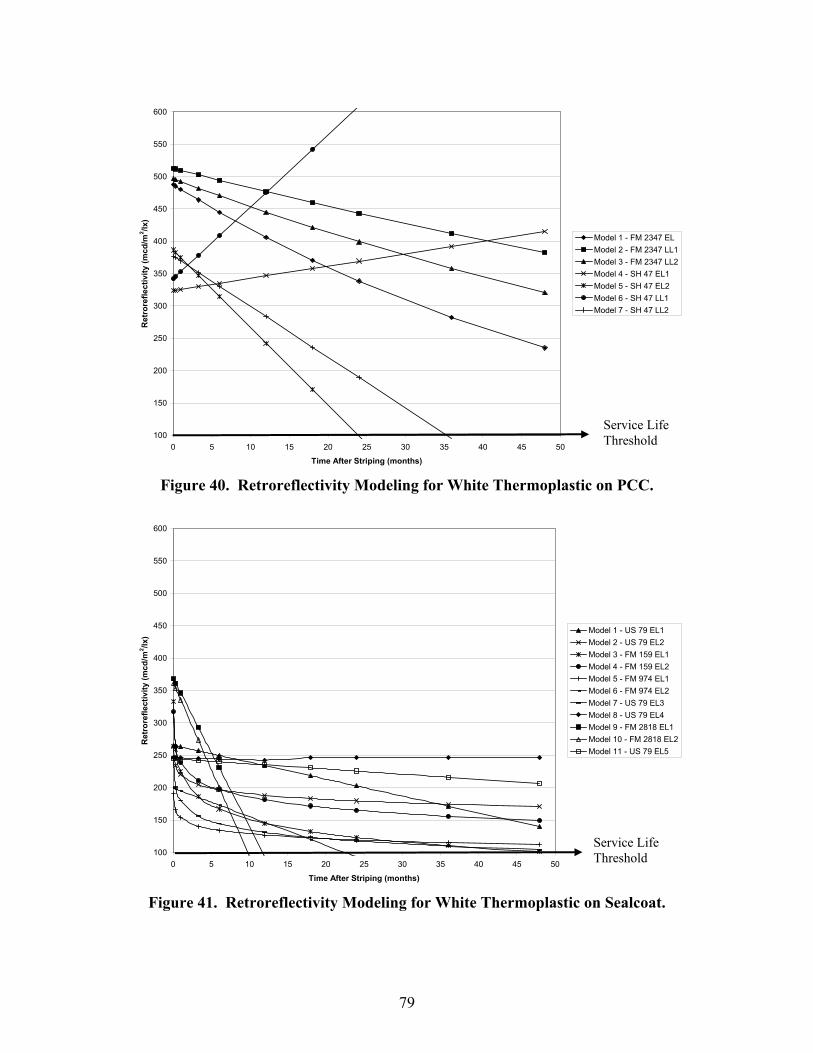
79
100
150
200
250
300
350
400
450
500
550
600
0 5 10 15 20 25 30 35 40 45 50
Time After Striping (months)
Ret
rore
flect
ivity
(mcd
/m2 /lx
)
Model 1 - FM 2347 ELModel 2 - FM 2347 LL1Model 3 - FM 2347 LL2Model 4 - SH 47 EL1Model 5 - SH 47 EL2Model 6 - SH 47 LL1Model 7 - SH 47 LL2
Figure 40. Retroreflectivity Modeling for White Thermoplastic on PCC.
100
150
200
250
300
350
400
450
500
550
600
0 5 10 15 20 25 30 35 40 45 50
Time After Striping (months)
Ret
rore
flect
ivity
(mcd
/m2 /lx
)
Model 1 - US 79 EL1Model 2 - US 79 EL2Model 3 - FM 159 EL1Model 4 - FM 159 EL2Model 5 - FM 974 EL1Model 6 - FM 974 EL2Model 7 - US 79 EL3Model 8 - US 79 EL4Model 9 - FM 2818 EL1Model 10 - FM 2818 EL2Model 11 - US 79 EL5
Figure 41. Retroreflectivity Modeling for White Thermoplastic on Sealcoat.
Service Life Threshold
Service Life Threshold
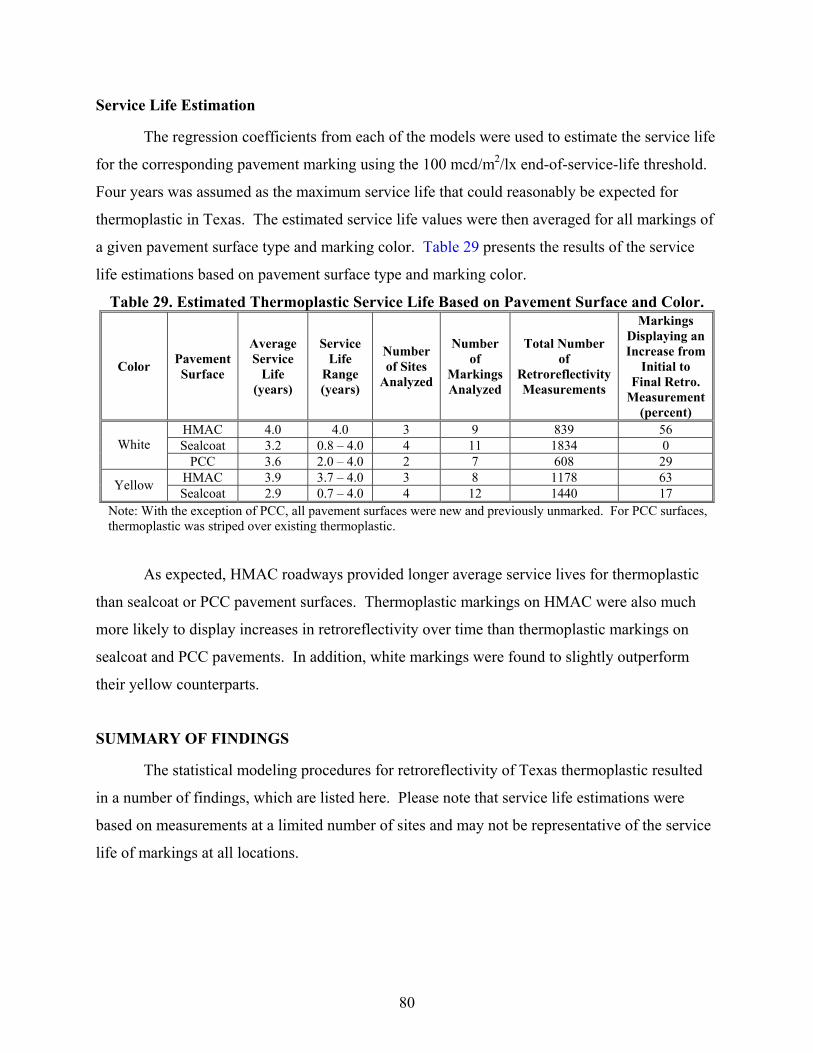
80
Service Life Estimation
The regression coefficients from each of the models were used to estimate the service life
for the corresponding pavement marking using the 100 mcd/m2/lx end-of-service-life threshold.
Four years was assumed as the maximum service life that could reasonably be expected for
thermoplastic in Texas. The estimated service life values were then averaged for all markings of
a given pavement surface type and marking color. Table 29 presents the results of the service
life estimations based on pavement surface type and marking color.
Table 29. Estimated Thermoplastic Service Life Based on Pavement Surface and Color.
Color Pavement Surface
Average Service
Life (years)
Service Life
Range (years)
Number of Sites
Analyzed
Number of
Markings Analyzed
Total Number of
Retroreflectivity Measurements
Markings Displaying an Increase from
Initial to Final Retro.
Measurement (percent)
HMAC 4.0 4.0 3 9 839 56 Sealcoat 3.2 0.8 – 4.0 4 11 1834 0 White
PCC 3.6 2.0 – 4.0 2 7 608 29 HMAC 3.9 3.7 – 4.0 3 8 1178 63 Yellow Sealcoat 2.9 0.7 – 4.0 4 12 1440 17
Note: With the exception of PCC, all pavement surfaces were new and previously unmarked. For PCC surfaces, thermoplastic was striped over existing thermoplastic.
As expected, HMAC roadways provided longer average service lives for thermoplastic
than sealcoat or PCC pavement surfaces. Thermoplastic markings on HMAC were also much
more likely to display increases in retroreflectivity over time than thermoplastic markings on
sealcoat and PCC pavements. In addition, white markings were found to slightly outperform
their yellow counterparts.
SUMMARY OF FINDINGS
The statistical modeling procedures for retroreflectivity of Texas thermoplastic resulted
in a number of findings, which are listed here. Please note that service life estimations were
based on measurements at a limited number of sites and may not be representative of the service
life of markings at all locations.
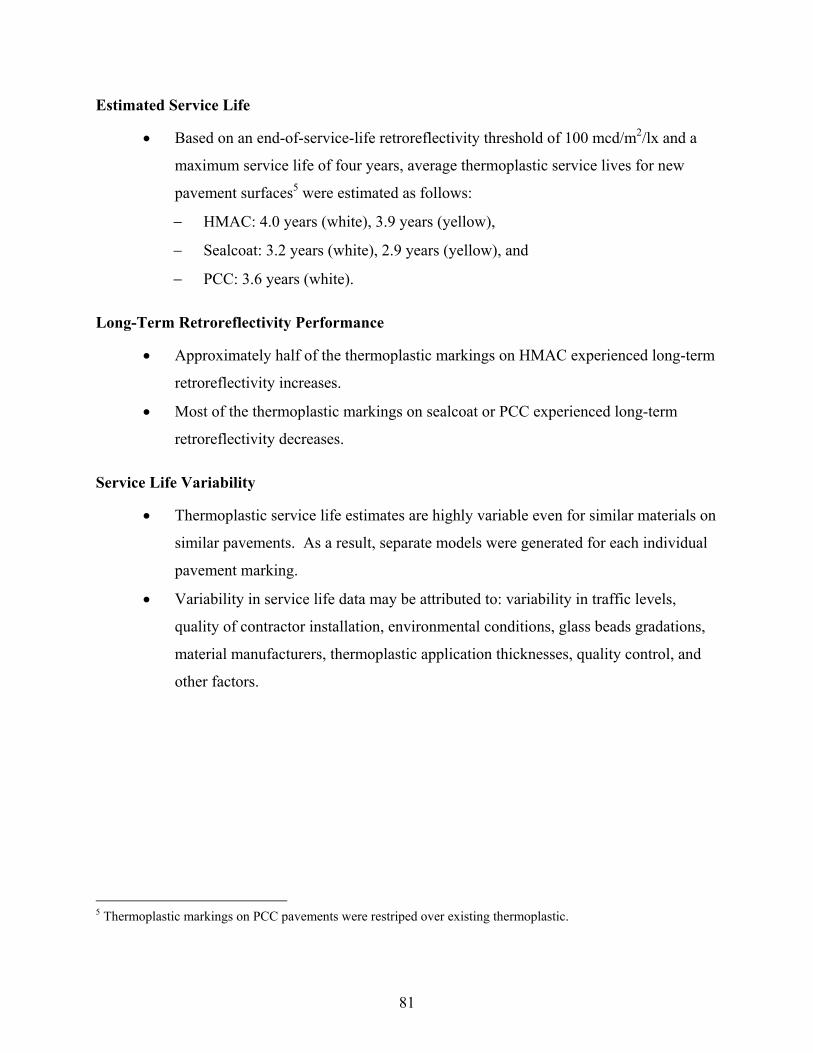
81
Estimated Service Life
• Based on an end-of-service-life retroreflectivity threshold of 100 mcd/m2/lx and a
maximum service life of four years, average thermoplastic service lives for new
pavement surfaces5 were estimated as follows:
− HMAC: 4.0 years (white), 3.9 years (yellow),
− Sealcoat: 3.2 years (white), 2.9 years (yellow), and
− PCC: 3.6 years (white).
Long-Term Retroreflectivity Performance
• Approximately half of the thermoplastic markings on HMAC experienced long-term
retroreflectivity increases.
• Most of the thermoplastic markings on sealcoat or PCC experienced long-term
retroreflectivity decreases.
Service Life Variability
• Thermoplastic service life estimates are highly variable even for similar materials on
similar pavements. As a result, separate models were generated for each individual
pavement marking.
• Variability in service life data may be attributed to: variability in traffic levels,
quality of contractor installation, environmental conditions, glass beads gradations,
material manufacturers, thermoplastic application thicknesses, quality control, and
other factors.
5 Thermoplastic markings on PCC pavements were restriped over existing thermoplastic.

83
CHAPTER 6: CONCLUSIONS AND RECOMMENDATIONS
The research described within this report focused upon identifying pavement marking
problems on sealcoat and HMAC surfaces, the causes of these problems, and a determination of
feasible potential solutions. Activities that identified major issues included: a literature review, a
survey of TxDOT districts, preliminary field investigations, and meetings with stakeholders.
The researchers then addressed these issues through field evaluations of various pavement
marking applications. The evaluations included:
• performance of thermoplastic on sealcoat vs. hot-mix asphalt,
• effect of thermoplastic thickness on performance,
• performance of large vs. small glass beads for thermoplastic,
• effect of sealcoat aggregate size on thermoplastic performance,
• expected service life of thermoplastic markings on various pavement surfaces,
• performance of waterbased paint as permanent marking on new sealcoat,
• effect of waterbased paint as a primer prior to thermoplastic on new sealcoat, and
• effect of double application for thermoplastic.
In most of these field evaluations, researchers measured the retroreflectivity of newly
applied pavement markings and monitored the performance of the markings over time. In total,
researchers made over 9000 retroreflectivity measurements at 18 different sites.
CONCLUSIONS
Based on the results of the field evaluations, the researchers identified few shortcomings
related to pavement marking practices on HMAC pavement surfaces. However, for sealcoat
pavement surfaces, numerous opportunities for improving pavement marking quality were
identified. Consequently, the conclusions presented primarily address pavement markings on
sealcoats.

84
Thermoplastic Performance on Sealcoat vs. HMAC
• On new sealcoat, thermoplastic applied at a minimum of 90 mil (to top of binder)
generally provides the best retroreflective performance over time.
• On new HMAC, thermoplastic applied between 60 and 90 mil generally provides the
best retroreflective performance over time.
• Thermoplastic performance is usually poorer on sealcoat than HMAC, largely due to
greater pavement surface texture for sealcoat:
− Thermoplastic markings on sealcoat often possess lower levels of
retroreflectivity both initially and over time compared to the same markings on
HMAC.
− Thermoplastic pavement markings on sealcoat lose retroreflectivity more
rapidly over time than thermoplastic markings on HMAC.
− Sealcoat markings often have higher retroreflective variability when compared
to HMAC markings.
− Thermoplastic retroreflectivity is much more likely to increase over time on
HMAC vs. sealcoat.
• Sealcoat with smaller aggregate (TxDOT Grade 4) provides significantly higher
levels of retroreflectivity vs. sealcoat with larger aggregate (TxDOT Grade 3) for
100 mil thermoplastic.
Thermoplastic Application Techniques
• Double application of thermoplastic on new sealcoat surface (each application
applied at approximately half the final thickness) provides only slightly higher
retroreflectivity over time when compared to single thermoplastic application.
• Asphalt bleeding through thermoplastic occurs more frequently if markings are
placed where asphalt binder is applied thicker, such as near the center joint or
shoulder joint.
• Thermoplastic pavement markings placed on sealcoat with densely spaced
aggregates display better retroreflective performance vs. thermoplastic placed on
sealcoat with sparsely spaced aggregates.
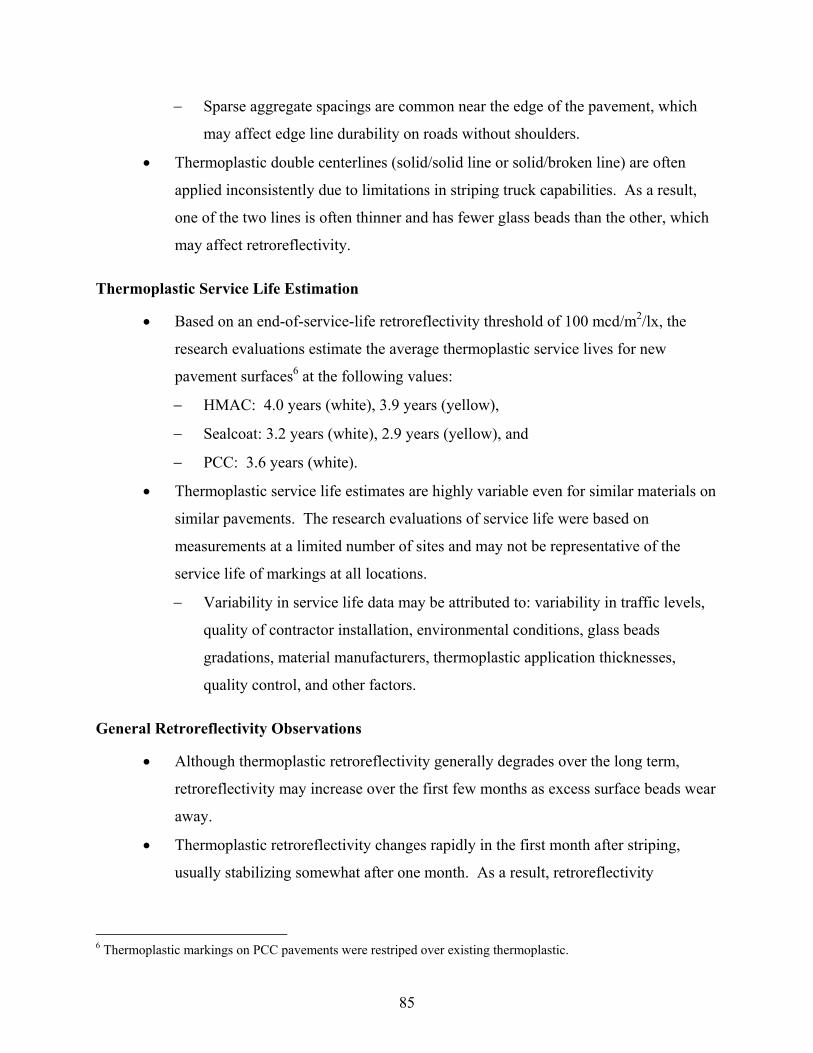
85
− Sparse aggregate spacings are common near the edge of the pavement, which
may affect edge line durability on roads without shoulders.
• Thermoplastic double centerlines (solid/solid line or solid/broken line) are often
applied inconsistently due to limitations in striping truck capabilities. As a result,
one of the two lines is often thinner and has fewer glass beads than the other, which
may affect retroreflectivity.
Thermoplastic Service Life Estimation
• Based on an end-of-service-life retroreflectivity threshold of 100 mcd/m2/lx, the
research evaluations estimate the average thermoplastic service lives for new
pavement surfaces6 at the following values:
− HMAC: 4.0 years (white), 3.9 years (yellow),
− Sealcoat: 3.2 years (white), 2.9 years (yellow), and
− PCC: 3.6 years (white).
• Thermoplastic service life estimates are highly variable even for similar materials on
similar pavements. The research evaluations of service life were based on
measurements at a limited number of sites and may not be representative of the
service life of markings at all locations.
− Variability in service life data may be attributed to: variability in traffic levels,
quality of contractor installation, environmental conditions, glass beads
gradations, material manufacturers, thermoplastic application thicknesses,
quality control, and other factors.
General Retroreflectivity Observations
• Although thermoplastic retroreflectivity generally degrades over the long term,
retroreflectivity may increase over the first few months as excess surface beads wear
away.
• Thermoplastic retroreflectivity changes rapidly in the first month after striping,
usually stabilizing somewhat after one month. As a result, retroreflectivity
6 Thermoplastic markings on PCC pavements were restriped over existing thermoplastic.

86
measurements taken within the first month after striping may not be representative
of the long-term retroreflective performance of markings.
• Heavy rain often has a significant cleaning effect on dirty thermoplastic markings,
consequently improving retroreflectivity.
Directional Retroreflectivity for Centerlines
• Regardless of marking material, retroreflectivity measurements made with the
direction of the striping operation (frontside) are usually higher than those made
opposite the direction of striping (backside).
• Differences in directional retroreflectivity indicate differences in bead/binder
coverage on opposite sides of the aggregate.
• Directional retroreflectivity differences are a greater problem on sealcoat than
HMAC due to the greater surface texture for sealcoat.
• Thermoplastic markings that are thinner than 100 mil on sealcoat are especially
susceptible to differences in directional retroreflectivity.
Glass Beads for Thermoplastic
• For thermoplastic, no consistent or considerable differences in dry-weather
retroreflective performance exist between larger diameter glass surface beads
(TxDOT Type III) vs. smaller diameter glass surface beads (TxDOT Type II).
• Although not evaluated in the research performed here, it is widely accepted that
large surface beads provide a wet-weather visibility benefit when compared to small
surface beads.
Waterbased Paint Pavement Markings on New Sealcoat
• Waterbased paint used as a permanent marking on a new sealcoat provides
significantly lower levels of retroreflectivity than thermoplastic both initially and
over time.
• White paint generally maintains acceptable levels of retroreflectivity over time.
• Yellow paint often drops below 100 mcd/m2/lx during the first few months after
application.

87
Waterbased Paint Primer on New Sealcoat
• New sealcoat primed with waterbased paint prior to thermoplastic application
provides only slightly higher levels of retroreflectivity for the thermoplastic vs.
unprimed sealcoat.
• Priming new sealcoat with paint prior to thermoplastic application reduces the
occurrence of asphalt bleeding through the thermoplastic when compared to
unprimed sealcoat. However, the bleeding on the unprimed sealcoat is generally not
severe enough to significantly affect retroreflectivity.
RECOMMENDATIONS
Based on the research findings, the researchers developed the following list of
recommendations for TxDOT to consider.
Thermoplastic Pavement Markings on Sealcoat
• Apply thermoplastic at a minimum thickness of 100 mil for all longitudinal
pavement markings on new sealcoat when no other durable marking exists.
• Thinner applications may be used for restripe, but should not be less than 60 mil.
• Double applications of thermoplastic may be used to achieve necessary thickness on
coarse sealcoats. However, the retroreflectivity benefits of double applications are
marginal, and there may be retracing challenges that reduce the overall effectiveness
of the marking.
• Thermoplastic should not be placed directly on longitudinal sealcoat joints.
Thermoplastic Pavement Markings on HMAC
• Apply thermoplastic at a maximum thickness of 90 mil for all longitudinal pavement
markings on HMAC when no other durable marking exists.
• Thinner applications may be used for restripe, but should not be less than 60 mil.
Waterbased Paint Pavement Markings on Sealcoat
• Do not use waterbased paint as permanent pavement marking on new sealcoat
surfaces.

88
• Waterbased paint may be used on a new sealcoat surface in either of the following
situations:
− as temporary pavement marking for up to six months, or
− as surface primer prior to thermoplastic application.
Sealcoat Aggregate
• For better retroreflective performance of pavement markings on sealcoat, TxDOT
Grade 4 sealcoat aggregate (smaller diameter) is recommended over TxDOT Grade
3 sealcoat aggregate (larger diameter).
• Increasing the density of sealcoat aggregates per unit of surface area near the
roadway edge will likely provide better retroreflective performance for edge line
pavement markings on roadways without shoulders.
Glass Beads
• For any pavement surface, use either TxDOT Type III (larger diameter) or TxDOT
Type II (smaller diameter) glass surface beads with thermoplastic to achieve suitable
levels of dry-weather retroreflective performance.
Field Inspection
• To obtain an accurate representation of long-term pavement marking performance,
measure retroreflectivity at least one month after striping.
• To ensure adequate retroreflectivity for both directions of traffic, measure
retroreflectivity for centerlines of undivided two-way roadways in both directions.
• Application of double centerlines should be closely inspected to ensure that both
lines are receiving adequate applications of material (binder and beads).
89
REFERENCES 1. Transportation Planning Division, Texas Department of Transportation, Austin, Texas. Data
Acquisition Date 12/31/00. 2. Migletz, J., J.K. Fish, and J.L. Graham. Roadway Delineation Practices Handbook, FHWA-
SA-93-001. Federal Highway Administration, Washington, D.C., 1994. 3. Schnell, T. and H.T. Zwahlen. Driver Preview Distances at Night Based on Driver Eye
Scanning Recordings as a Function of Pavement Marking Retroreflectivities. In Transportation Research Record 1692. Transportation Research Board, National Research Council, Washington, D.C., 1999. pp. 129-141.
4. Manual on Uniform Traffic Control Devices for Streets and Highways. Federal Highway
Administration, Washington, D.C., 2001. 5. Texas Manual on Uniform Traffic Control Devices for Streets and Highways. Texas
Department of Transportation, Austin, Texas, 2002. 6. Loetterle, F.E., R.A. Beck and J. Carlson. Public Perception of Pavement-Marking
Brightness. In Transportation Research Record 1715. Transportation Research Board, National Research Council, Washington, D.C., 2000. pp. 51-59.
7. Graham, J.R. and L.E. King. Retroreflectivity Requirements for Pavement Markings. In
Transportation Research Record 1316. Transportation Research Board, National Research Council, Washington, D.C., 1991. pp. 18-23.
8. Ethen, J.L. and H.L. Woltman. Minimum Retroreflectance for Nighttime Visibility of
Pavement Markings. In Transportation Research Record 1093. Transportation Research Board, National Research Council, Washington, D.C., 1986. pp. 49-57.
9. Ohme, P.J. Enhancing Nighttime Pavement Marking Visibility for Older Drivers. Masters
Thesis. Advisor: T. Schnell. Department of Industrial Engineering, University of Iowa, Iowa City, Iowa, 2001.
10. Zwahlen, H.T. and T. Schnell. Minimum In-Service Retroreflectivity of Pavement
Markings. In Transportation Research Record 1715, Transportation Research Board, National Research Council, Washington, D.C. 2000. pp. 60-69.
11. Zwahlen, H.T. and T. Schnell. Visibility of Road Markings as a Function of Age,
Retroreflectivity Under Low-Beam and High-Beam Illumination at Night. In Transportation Research Record 1692, Transportation Research Board, National Research Council, Washington D.C., 1999. pp. 152-162.
90
12. Zwahlen, H.T. and T. Schnell. Visibility of New Centerline and Edge Line Pavement
Markings. Paper Presented at the Transportation Research Board 76th Annual Meeting, January 1997. Available on Meeting Preprint CD-ROM.
13. Opeila, K.O. Development of Minimum Requirements for Pavement Marking
Retroreflectivity, Federal Highway Administration, Washington, D.C., Unpublished White Paper, April 2001.
14. COST 331—Requirements for Road Marking: State of the Art. European Cooperation in
the Field of Scientific and Technical Research. European Commission Directorate- General for Transport. May 1999.
15. Migletz, J., J.L. Graham, D.W. Harwood, and K.M. Bauer. Service Life of Durable Pavement
Markings. In Transportation Research Record 1749. Transportation Research Board, National Research Council, Washington, D.C., 2001. pp. 13-21.
16. Gates, T.J. and H.G. Hawkins. A Summary of Two Pavement Marking Conferences for the
Texas Department of Transportation. FHWA/TX-03/4150-3. Texas Transportation Institute, College Station, Texas, Publication Pending.
17. Somayaji, S. Civil Engineering Materials. Prentice Hall, Englewood Cliffs, New Jersey,
1995.

91
APPENDIX A: TXDOT DISTRICT SURVEY
To better understand TxDOT district practices regarding pavement marking on sealcoat roadways, a survey was developed by TTI and sent to traffic and maintenance personnel at all 25 TxDOT districts. The survey was sent via email from TxDOT’s Traffic Operations office to district traffic and maintenance personnel in December 2000. Responses were received from 22 of the 25 districts by February 2001. The survey questionnaire is shown below.
1. What type of marking material do you currently install on a new sealcoat?
[ ] Thermoplastic [ ] Waterbased Paint as Primer and Thermoplastic [ ] Other:
2. If you put thermoplastic on a new sealcoat, what thickness is typically applied? 3. How much cure time do you require before the placement of any type of standard pavement markings? 4. If you put waterbased paint on a new sealcoat, how long do you wait before applying thermoplastic? 5. Does your district use a retroreflectivity specification for new markings? If so, what are the minimum retroreflectivity measurements for both white and yellow and when are measurements taken?
[ ] Yes; white min.= yellow min.= When are measurements taken? How did you determine what these numbers should be and when the readings should be taken?
[ ] No 6. What size rock does your district typically use for sealcoat? Does rock size affect the specified thickness of markings? 7. Please comment on any problems your district has had with markings on new sealcoat:


93
APPENDIX B:
RETROREFLECTIVITY MODELING
100
150
200
250
300
350
400
450
500
550
600
0 5 10 15 20 25 30 35 40 45 50
Time After Striping (months)
Ret
rore
flect
ivity
(mcd
/m2 /lx
)
Model 1 - FM 1179 CL BackModel 2 - FM 1179 CL FrontModel 3 - FM 2154 CL BackModel 4 - FM 2154 CL FrontModel 5 - FM 2347 CL1 BackModel 6 - FM 2347 CL2 BackModel 7 - FM 2347 CL1 FrontModel 8 - FM 2347 CL2 Front
Figure B1. Retroreflectivity Modeling for Yellow Thermoplastic on HMAC.
100
150
200
250
300
350
400
450
500
550
600
0 5 10 15 20 25 30 35 40 45 50
Time After Striping (months)
Ret
rore
flect
ivity
(mcd
/m2 /lx
)
Model 1 - FM 159 CL BackModel 2 - FM 159 CL FrontModel 3 - FM 974 CL BackModel 4 - FM 974 CL FrontModel 5 - US 79 CL1 BackModel 6 - US 79 CL1 FrontModel 7 - US 79 CL2 BackModel 8 - US 79 CL2 FrontModel 9 - FM 2818 CL BackModel 10 - FM 2818 CL FrontModel 11 - US 79 CL3 BackModel 12 - US 79 CL3 Front
Figure B2. Retroreflectivity Modeling for Yellow Thermoplastic on Sealcoat.
Service Life Threshold
Service Life Threshold
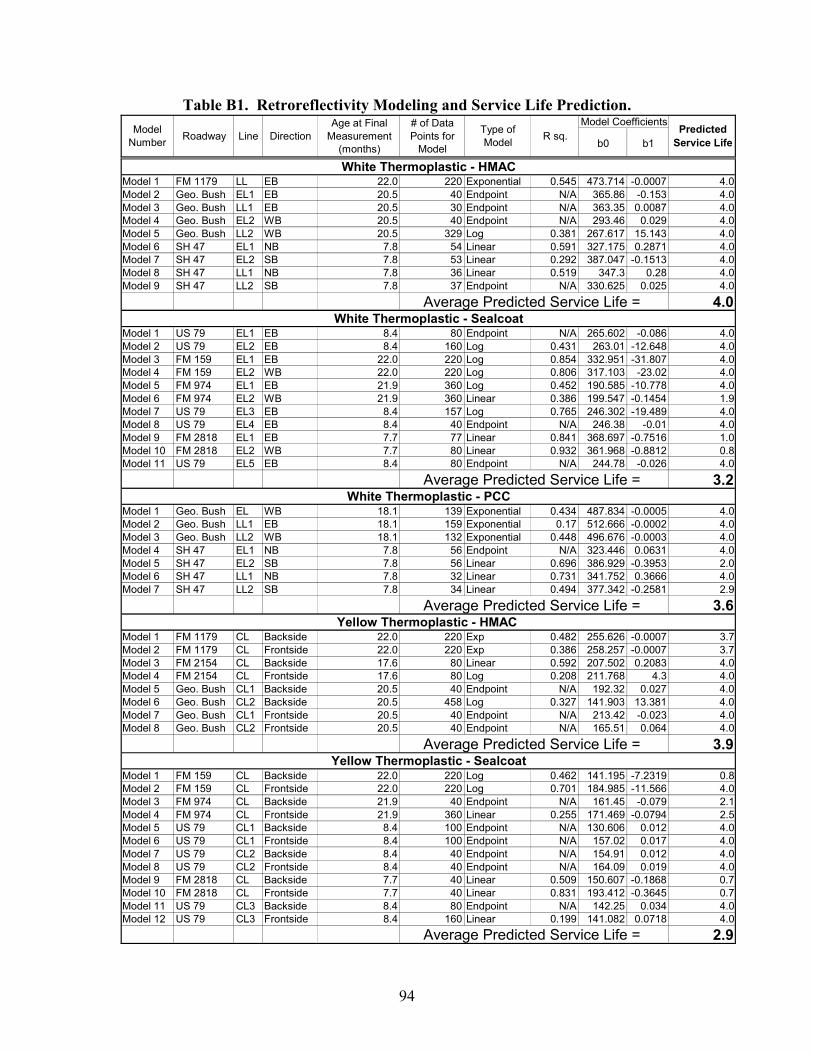
94
Table B1. Retroreflectivity Modeling and Service Life Prediction.
b0 b1
Model 1 FM 1179 LL EB 22.0 220 Exponential 0.545 473.714 -0.0007 4.0Model 2 Geo. Bush EL1 EB 20.5 40 Endpoint N/A 365.86 -0.153 4.0Model 3 Geo. Bush LL1 EB 20.5 30 Endpoint N/A 363.35 0.0087 4.0Model 4 Geo. Bush EL2 WB 20.5 40 Endpoint N/A 293.46 0.029 4.0Model 5 Geo. Bush LL2 WB 20.5 329 Log 0.381 267.617 15.143 4.0Model 6 SH 47 EL1 NB 7.8 54 Linear 0.591 327.175 0.2871 4.0Model 7 SH 47 EL2 SB 7.8 53 Linear 0.292 387.047 -0.1513 4.0Model 8 SH 47 LL1 NB 7.8 36 Linear 0.519 347.3 0.28 4.0Model 9 SH 47 LL2 SB 7.8 37 Endpoint N/A 330.625 0.025 4.0
Average Predicted Service Life = 4.0
Model 1 US 79 EL1 EB 8.4 80 Endpoint N/A 265.602 -0.086 4.0Model 2 US 79 EL2 EB 8.4 160 Log 0.431 263.01 -12.648 4.0Model 3 FM 159 EL1 EB 22.0 220 Log 0.854 332.951 -31.807 4.0Model 4 FM 159 EL2 WB 22.0 220 Log 0.806 317.103 -23.02 4.0Model 5 FM 974 EL1 EB 21.9 360 Log 0.452 190.585 -10.778 4.0Model 6 FM 974 EL2 WB 21.9 360 Linear 0.386 199.547 -0.1454 1.9Model 7 US 79 EL3 EB 8.4 157 Log 0.765 246.302 -19.489 4.0Model 8 US 79 EL4 EB 8.4 40 Endpoint N/A 246.38 -0.01 4.0Model 9 FM 2818 EL1 EB 7.7 77 Linear 0.841 368.697 -0.7516 1.0Model 10 FM 2818 EL2 WB 7.7 80 Linear 0.932 361.968 -0.8812 0.8Model 11 US 79 EL5 EB 8.4 80 Endpoint N/A 244.78 -0.026 4.0
Average Predicted Service Life = 3.2
Model 1 Geo. Bush EL WB 18.1 139 Exponential 0.434 487.834 -0.0005 4.0Model 2 Geo. Bush LL1 EB 18.1 159 Exponential 0.17 512.666 -0.0002 4.0Model 3 Geo. Bush LL2 WB 18.1 132 Exponential 0.448 496.676 -0.0003 4.0Model 4 SH 47 EL1 NB 7.8 56 Endpoint N/A 323.446 0.0631 4.0Model 5 SH 47 EL2 SB 7.8 56 Linear 0.696 386.929 -0.3953 2.0Model 6 SH 47 LL1 NB 7.8 32 Linear 0.731 341.752 0.3666 4.0Model 7 SH 47 LL2 SB 7.8 34 Linear 0.494 377.342 -0.2581 2.9
Average Predicted Service Life = 3.6
Model 1 FM 1179 CL Backside 22.0 220 Exp 0.482 255.626 -0.0007 3.7Model 2 FM 1179 CL Frontside 22.0 220 Exp 0.386 258.257 -0.0007 3.7Model 3 FM 2154 CL Backside 17.6 80 Linear 0.592 207.502 0.2083 4.0Model 4 FM 2154 CL Frontside 17.6 80 Log 0.208 211.768 4.3 4.0Model 5 Geo. Bush CL1 Backside 20.5 40 Endpoint N/A 192.32 0.027 4.0Model 6 Geo. Bush CL2 Backside 20.5 458 Log 0.327 141.903 13.381 4.0Model 7 Geo. Bush CL1 Frontside 20.5 40 Endpoint N/A 213.42 -0.023 4.0Model 8 Geo. Bush CL2 Frontside 20.5 40 Endpoint N/A 165.51 0.064 4.0
Average Predicted Service Life = 3.9
Model 1 FM 159 CL Backside 22.0 220 Log 0.462 141.195 -7.2319 0.8Model 2 FM 159 CL Frontside 22.0 220 Log 0.701 184.985 -11.566 4.0Model 3 FM 974 CL Backside 21.9 40 Endpoint N/A 161.45 -0.079 2.1Model 4 FM 974 CL Frontside 21.9 360 Linear 0.255 171.469 -0.0794 2.5Model 5 US 79 CL1 Backside 8.4 100 Endpoint N/A 130.606 0.012 4.0Model 6 US 79 CL1 Frontside 8.4 100 Endpoint N/A 157.02 0.017 4.0Model 7 US 79 CL2 Backside 8.4 40 Endpoint N/A 154.91 0.012 4.0Model 8 US 79 CL2 Frontside 8.4 40 Endpoint N/A 164.09 0.019 4.0Model 9 FM 2818 CL Backside 7.7 40 Linear 0.509 150.607 -0.1868 0.7Model 10 FM 2818 CL Frontside 7.7 40 Linear 0.831 193.412 -0.3645 0.7Model 11 US 79 CL3 Backside 8.4 80 Endpoint N/A 142.25 0.034 4.0Model 12 US 79 CL3 Frontside 8.4 160 Linear 0.199 141.082 0.0718 4.0
Average Predicted Service Life = 2.9
Predicted Service Life
Yellow Thermoplastic - HMAC
Model CoefficientsModel
Number Roadway Line DirectionAge at Final
Measurement (months)
# of Data Points for
Model
Type of Model R sq.
White Thermoplastic - Sealcoat
Yellow Thermoplastic - Sealcoat
White Thermoplastic - HMAC
White Thermoplastic - PCC