Phycoremediation – a clean technology for water pollution abatement

Effective Air Pollution Abatement Measures: Experience from
Northern and Central Europe
Roy M. Harrison
University of Birmingham
United Kingdom

Diesel vehicles
• Poor real-world NOx emissions. Euro 6 NOx seven times the type approval limit (ICCT, 2014)
• Car NOx emissions not improved for over 20 years
• Some Euro VI buses continue to have high in-use NOx emissions, depending on exhaust temperature (Carslaw et al, 2014)
Source: ICCT, 2014
• EU Diesel market share increased from 36% (2001) to 55% (2013)
0%
10%
20%
30%
40%
50%
60%
70%
80%
Luxem
bourg
Irela
nd
Port
ugal
Spain
Fra
nce
Belg
ium
Sw
eden
Gre
ece
Austr
ia
Italy
UK
Germ
any
Fin
land
Denm
ark
Neth
erl
ands
EU
-27
New Car Market Share
Diesel
Gasoline
Hybrid
Gas
EV

Solutions: Encouraging the use of cleaner cars
• Discouraging diesel cars
• Low Emission Zones (LEZs)
• Encouraging BEVs, HEVs PHEVs and gas vehicles
• Mandatory eco-label

Discouraging Diesel cars
• Car purchase and/or ownership taxes - CO2 based in most MS
• Diesel taxation and pump prices – lower than gasoline in most MS.
• Favours purchase and use of diesel cars
• Gap between type approval and real world CO2 emissions increased 7% (2001) to
23% (2011)
• Diesel Benefits overstated

Banning Diesel Cars
Greece
• 1991 until 2011 – diesel cars banned in Athens and Thessaloniki
• Diesel 20% cheaper than gasoline
• Rapid increase in diesel car sales since ban lifted
0%
10%
20%
30%
40%
50%
60%
70%
2001 2006 2011
New Cars: % Diesel
Greece
EU
London 2014: Attempts to ban diesel cars from London LEZ dropped due to public opposition

France
9th February 2015: Mayor Anne Hidalgo presented plan to Council to
“ban most diesel vehicles from the city by
2020”
This is a LEZ and includes gasoline vehicles
Only current French LEZ:
• Mont Blanc tunnel

Country Number of LEZs Applicable
vehicles
National
Framework/
legislation
Austria 3 HGVs Yes
Czech Republic 1 HGVs -
Denmark 6 Vehicles > 3.5
tonnes Yes
France 1 HGVs No
Germany >70 All except
motorcycles Yes
Hungary 1 HGVs No
Italy >130 Various No
Netherlands 14 HGVs Yes
Portugal 1 Cars & HGVs No
Sweden 8 Vehicles > 3.5
tonne Yes
UK 2 Various No
LEZs
At mid 2014

Efficacy of LEZs
• Difficult to determine
• Confounders e.g. weather, other policy measures, recession
• Little evidence of impact on PM10
and NO2 concentrations outside Germany
• EC/BC reduced
Efficacy of German LEZs
•PM10 <7%↓
•Munich (LEZ + HDV ban) PM10 ca.13%↓
•NO2 <10%↓
•But not all robust studies
•Early phases studied
• LEZs apply to cars as well as HDVs
• Generally more stringent than elsewhere

Electric car market in Norway
0
5000
10000
15000
20000
2006 2008 2010 2012 2014
Norway: New Electric Cars
Sales
Norway 5.8%; Netherlands 5.4%; EU-28 0.4% (2013)
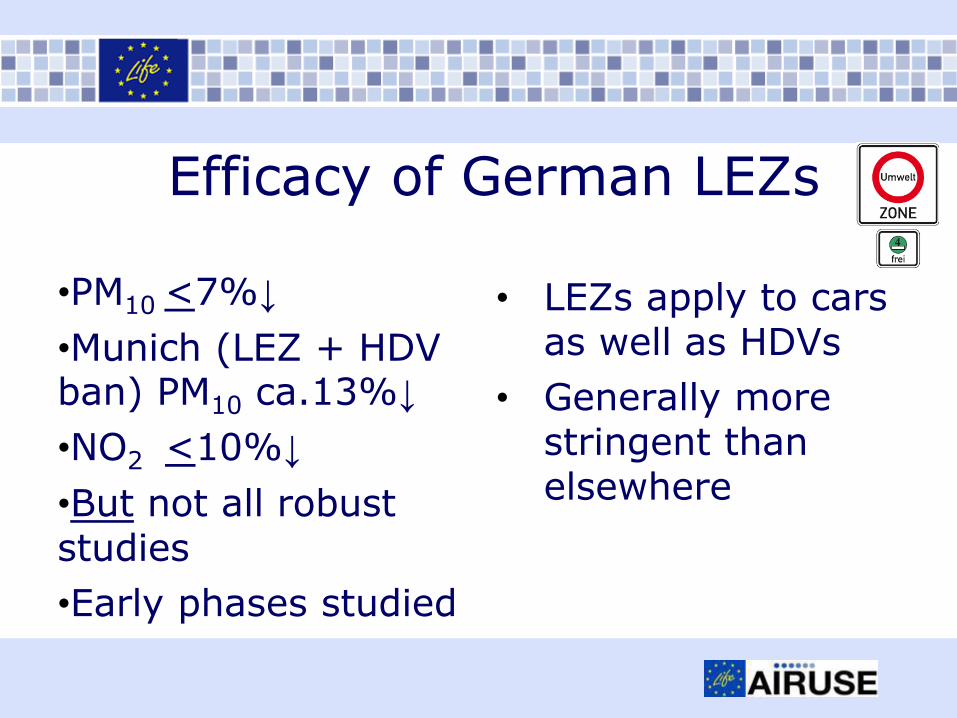
Norway electric car market
• Long term fiscal incentives from 1990s
• Incentives added sequentially until the market responded.
• The price difference between BEV and petrol car can be €1,000.
• Exempt from • vehicle registration tax
• road tolls
• VAT (normally 25%)
• Bus lane access
• BEVs -reduced annual tax
• Reduced rates on the main coastal ferries

Ecolabels
Comparison of the CO2 emission bands (gasoline cars) used in the energy efficiency rating systems
Source: ADAC, 2005
• EU CO2 label applied differently in each MS
• Many use A-F / G classes
• Can rank same car very differently
• Motoring organisations have separate eco-labels include NOx/PM

Vehicle Eco-Label Recommendations
•Mandatory EU wide scheme
•NOx, PM and CO2 emissions, with no weighting
•Apply to new & used vehicles
•To take account of real-world emissions
•‘Well to tank’ to enable ICEs and EVs to be compared
•Based on domestic appliances label (A to G rating) with running costs.
•Updated on annual basis by allocating a fixed percentage of models to each band.
•Long term public education is required to support the eco-label

Conclusions
• Influencing motorists away from diesel unlikely until fiscal incentives change
• Promoting cleaner vehicle technologies requires long term consistent policies
• LEZs need to be stringent and include cars to be effective
• Public information on air quality implications of fuel choice required.
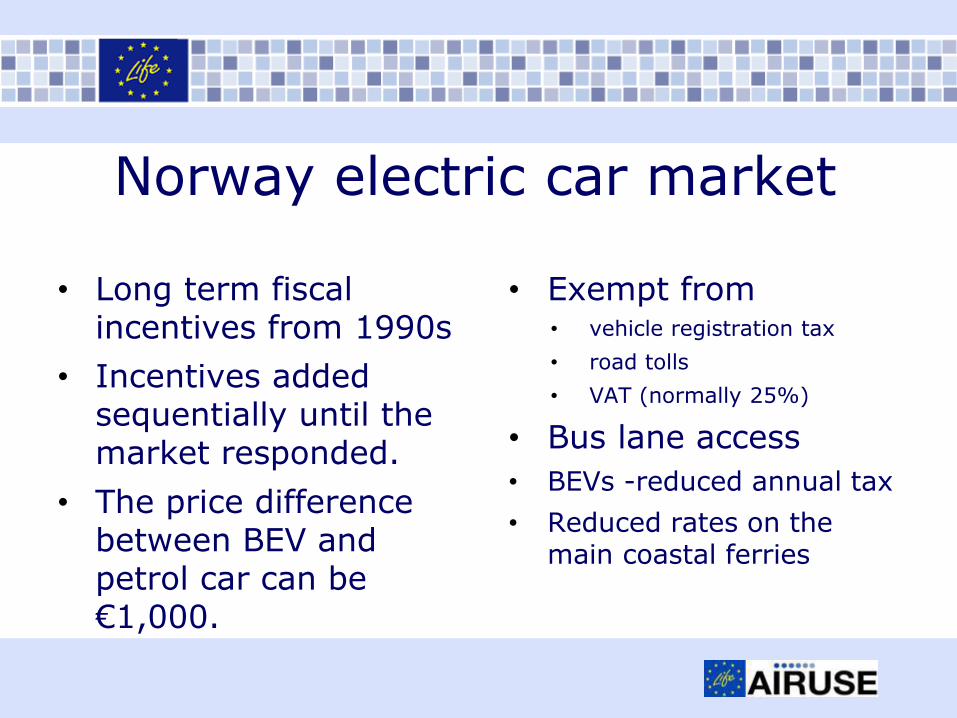
Some Personal Reflections (1) Non-exhaust contribution to PM mass
- from wear of brakes, tyres, road surface
- from resuspension of surface dusts
These will soon exceed exhaust emissions considerably, but
- wear emissions can be influenced by choice of materials
- it may be possible to trap brake dust on the vehicle
- resuspension is influenced by the aerodynamics of the vehicle
There is current research on quantifying these emissions, but none on reducing them.

Some Personal Reflections (2)
Wood smoke contribution to PM mass
- Now substantial in the UK and many other countries and increased as more wood burning appliances are installed.
- Bad for PM and PAH concentrations especially.
- Fiscal incentives to wood burning in small utility boilers and CHP are bad for air quality when natural gas is displaced as a fuel, and benefits for greenhouse gas emissions are probably small (UK imports wood from the United States!).
- May well cause PM2.5 levels to increase in coming years.

Some Personal Reflections (3)
Cooking aerosol
Some measurement methods (generally Aerosol Mass Spectrometry) show an appreciable contribution of cooking aerosol to PM2.5 concentrations.
There is a pressing need for:
- better methods of quantification of cooking particles
- research on mitigation measures

Some Personal Reflections (4)
• National Emissions Ceilings are an important tool, but air quality Limit Values and Exposure Reduction targets are the best protection for human health.
• More research is needed on the differential toxicity of particles of different composition and size distribution, and from different sources.