Choosing Research Designs I Experimental and Quasi-Experimental.

Jorge Hombrados and Hugh Waddington www.3ieimpact.org
Effect Size Calculation for
experimental & quasi-
experimental methods
Jorge Garcia Hombrados
&
Hugh Waddington
Jorge Hombrados and Hugh Waddington www.3ieimpact.org
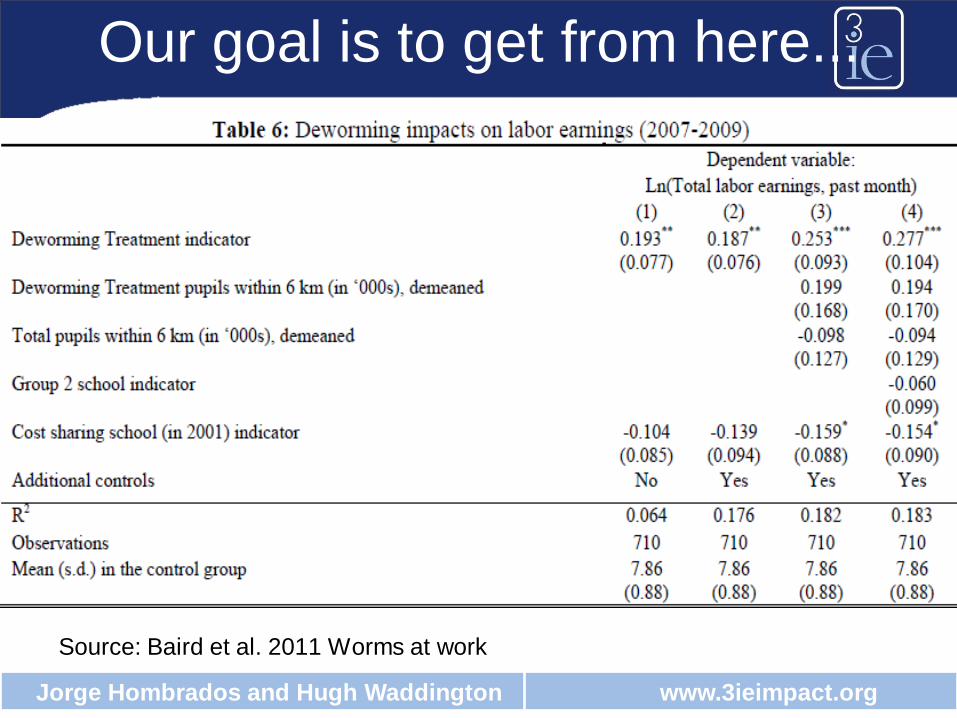
Our goal is to get from here...
Source: Baird et al. 2011 Worms at work

Jorge Hombrados and Hugh Waddington www.3ieimpact.org
... to here
• Source: Petrosino et al. (2012) „Interventions in Developing Nations for
Improving Primary and Secondary School Enrollment of Children: A
Systematic Review‟ Campbell Systematic Reviews
Our goal is to get from here
Jorge Hombrados and Hugh Waddington www.3ieimpact.org
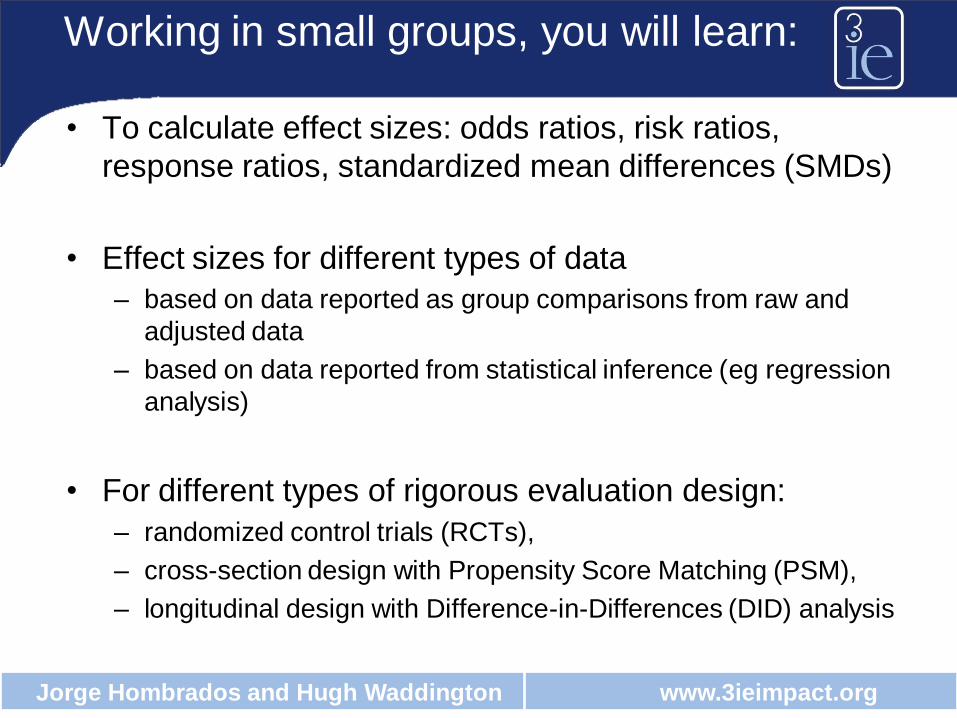
Working in small groups, you will learn:
• To calculate effect sizes: odds ratios, risk ratios,
response ratios, standardized mean differences (SMDs)
• Effect sizes for different types of data
– based on data reported as group comparisons from raw and
adjusted data
– based on data reported from statistical inference (eg regression
analysis)
• For different types of rigorous evaluation design:
– randomized control trials (RCTs),
– cross-section design with Propensity Score Matching (PSM),
– longitudinal design with Difference-in-Differences (DID) analysis

Jorge Hombrados and Hugh Waddington www.3ieimpact.org
Concepts we will use liberally
• Mean
• Standard deviation
• Standard error
• Confidence interval
• Average treatment effect on the treated
(ATET)
Jorge Hombrados and Hugh Waddington www.3ieimpact.org
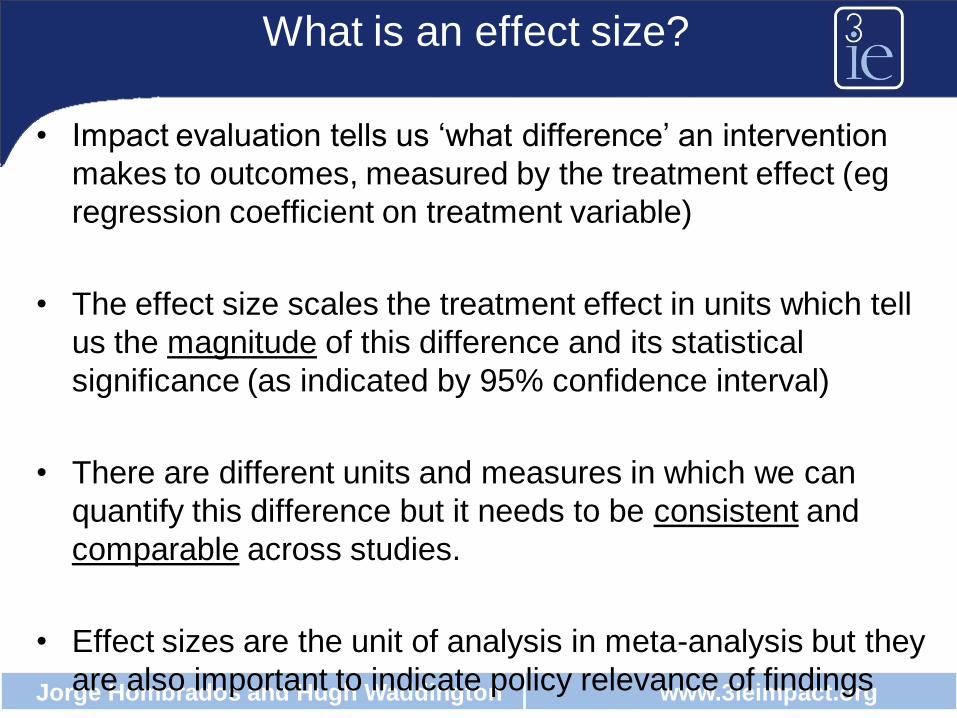
What is an effect size?
• Impact evaluation tells us „what difference‟ an intervention
makes to outcomes, measured by the treatment effect (eg
regression coefficient on treatment variable)
• The effect size scales the treatment effect in units which tell
us the magnitude of this difference and its statistical
significance (as indicated by 95% confidence interval)
• There are different units and measures in which we can
quantify this difference but it needs to be consistent and
comparable across studies.
• Effect sizes are the unit of analysis in meta-analysis but they
are also important to indicate policy relevance of findings

Jorge Hombrados and Hugh Waddington www.3ieimpact.org
Example: Height-for-age
Mean Z-score Percentage
below z=-2
2004 Bangla-DHS -2.0 51%
2011 Bangla-DHS -1.7 41%

Jorge Hombrados and Hugh Waddington www.3ieimpact.org
Examples of different effect sizes
• Standardized mean difference
– Group contrast
– Continuous outcome variable e.g. test scores
• Odds ratio/ risk ratio
– Group contrast
– Dichotomous outcome variable e.g. mortality
• Correlation coefficient (pearson‟s r)
– Association between 2 variables e.g. value of micro-credit loan
and income
• Proportion
– Disease prevalence rates e.g. proportion suffering diarrhoea

Jorge Hombrados and Hugh Waddington www.3ieimpact.org
Effect sizes measures
For continuous outcomes:
– Standardised Mean Differences (SMD)
– Response Ratios (RR) d-based
– Regression coefficients, t-stat effect sizes
– R-based effect sizes (correlation coefficients)
For dichotomous outcomes:
– Odds ratios
– Risk ratios

Jorge Hombrados and Hugh Waddington www.3ieimpact.org
Standardized mean difference
• Uses the pooled standard deviation (some
cases use control group standard deviation)

Jorge Hombrados and Hugh Waddington www.3ieimpact.org
Exercise: calculate absolute and SMD
Income per
capita
Treatment
mean
Comparis
on mean
Treatment
SD
Comparis
on SD
Sample
size t
Sample
size c
Bangladesh 770 500 300 200 50 50
Nepal 550 280 200 150 50 50

Jorge Hombrados and Hugh Waddington www.3ieimpact.org
Odds ratio and risk ratio
Frequencies
Success Failure
Treatment Group a b
Control Group c d
bc
ad
dc
baOR
/
/ Ratio of odds of success in the
treatment group relative to odds
of success in the comparison
)/(
)/(
dcc
baaRR
Ratio of probability of success
in the treatment group relative
to probability of success in the
comparison group
Jorge Hombrados and Hugh Waddington www.3ieimpact.org
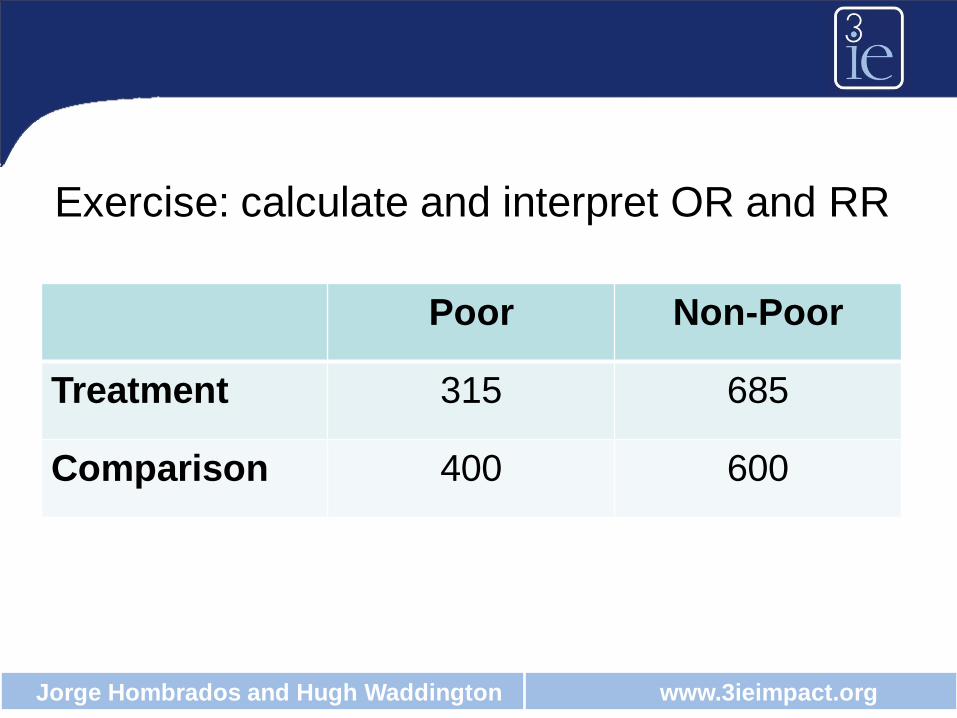
Exercise: calculate and interpret OR and RR
Poor Non-Poor
Treatment 315 685
Comparison 400 600

Jorge Hombrados and Hugh Waddington www.3ieimpact.org
Selecting the effect size measure in practice
• We need to estimate the same effect size measure
across all the included studies pooled in the meta-
analysis
• However, very often not all the studies report enough
information to compute all the effect size measures and
contacting authors does not always work
• The selection of the effect size measure in practice takes
into account:
– Nature of outcome (dichotomous vs continuous)
– Minimising the number of studies lost

Jorge Hombrados and Hugh Waddington www.3ieimpact.org
Option 1: SMD
• Measures the impact of the programme in
standard deviations of the outcome variable
• Can be computed consistently for both
experimental and non-experimental studies
• Is the “less problematic” methodology
• However, its interpretation is not straightforward
and the data required for its computation is not
always available

Jorge Hombrados and Hugh Waddington www.3ieimpact.org
Option 2: Response Ratio
• Measures the impact of the programme in percentage
change
• Based on the Risk Ratio effect size used for
dichotomous outcomes
• Data required for its computation is minimum
• Can be computed consistently for both experimental and
non-experimental studies
• It is appropriate for both continuous and dichotomous
outcomes (risk ratio) providing the outcome measure has
a natural scale unit and natural zero points (but is not
likely to equal zero)
• Synthesis uses logarithmic scales for both RR and
SE(RR)
Jorge Hombrados and Hugh Waddington www.3ieimpact.org
Other measures are problematic
• T-statistics are noisy and when applied to regression has
some important shortcomings (Becker & Wu, 2007)
• Regression coefficients: data on covariance matrix
(hardly reported) are required for appropriate synthesis
• R-based effect sizes do not seem to work properly for
multivariate regression

Jorge Hombrados and Hugh Waddington www.3ieimpact.org
Computation of effect sizes: SMD
• Standardised Mean Difference (SMD):
• How to estimate SMD from different study
designs?
• An easy way of dealing with it is thinking
separately in the numerator and
denominator.
Jorge Hombrados and Hugh Waddington www.3ieimpact.org
Computation of effect size: SMD
• The numerator Yt-Yc represents the
causal raw impact of the programme in the
outcome:
– In a regression analysis is the coefficient of
interest (Beta).
– In a matching-based study this is the causal
impact (ATT) or the difference in outcomes
between groups after matching.

Jorge Hombrados and Hugh Waddington www.3ieimpact.org
Computation of effect size: SMD
• The denominator Sp is a measure of the standard
deviation of the outcome. It makes the effect size
comparable across studies
– In regression studies, we can use the standard deviation of the
regression errors.
– Alternatively, we can use the sample standard deviation or the
treatment and control standard deviation to calculate Sp in
matched-based studies or approximate it in regression based
studies:

Jorge Hombrados and Hugh Waddington www.3ieimpact.org
Computation of effect size: SMD
• Diff-in-Diff models
– In Diff-in-Diff model, the dependent variable is the
change in the dependent variable of reference, or
in semi log models, the growth rate of the variable
of reference.
– In these cases, Sp should measure the pool
standard deviation of the change (or the growth
rate) in the dependent variable of reference.
– Unfortunately, this information is not reported
very often and most of the times the calculation of
SMDs requires assumptions.

Jorge Hombrados and Hugh Waddington www.3ieimpact.org
Computation of effect size: SMD
• Tobit, Logit and Probit models
• Where for:
– Probit models Δ= Φ (xiβ+γ) - Φ(xiβ)
– Censored Tobit models
Δ=((Φ ((xiβ+γ)/σ))*(( xiβ+γ)+ σ φ(xiβ+γ))) - ((Φ
((xiβ)/σ))*(( xiβ)+ σ φ(xiβ))
– Logit models
Jorge Hombrados and Hugh Waddington www.3ieimpact.org
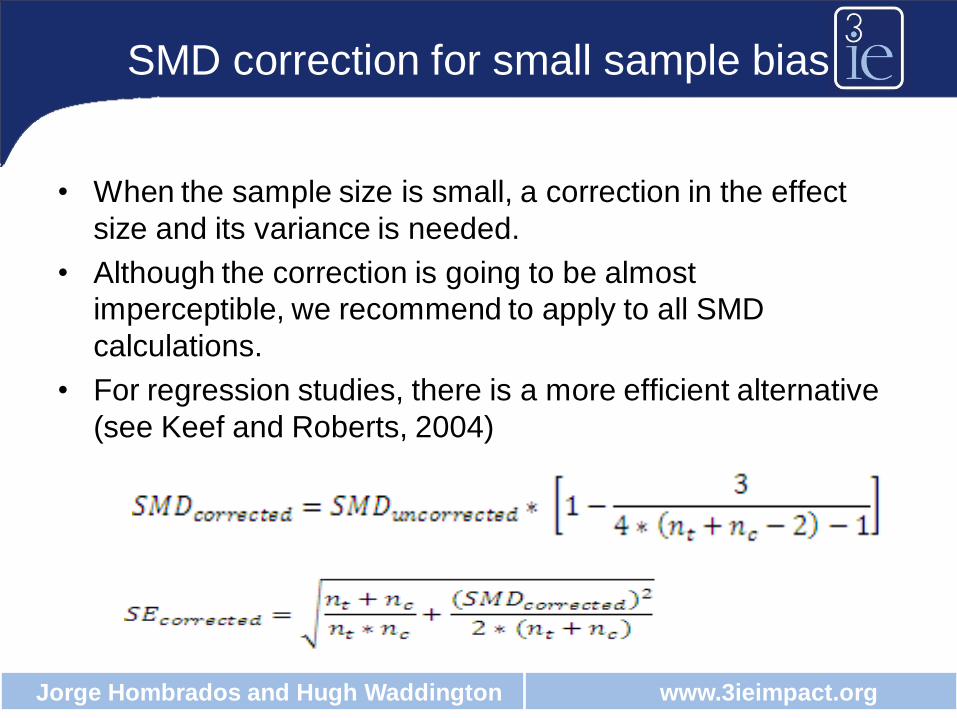
SMD correction for small sample bias
• When the sample size is small, a correction in the effect
size and its variance is needed.
• Although the correction is going to be almost
imperceptible, we recommend to apply to all SMD
calculations.
• For regression studies, there is a more efficient alternative
(see Keef and Roberts, 2004)

Jorge Hombrados and Hugh Waddington www.3ieimpact.org
Computation of effect size: Response Ratios
– For matched-based studies (e.g., PSM), Yc= Yt – ATT where Yt
is the outcome level in the treatment, ATT is the average
treatment effect on the treated and Yc is the outcome level in the
control group after matching.
– For regression-based studies, Yt = Yc+ β where Yc is the
outcome level in the total sample and Yt is the “ceteris paribus”
average predicted outcome if the sample received the treatment.
Jorge Hombrados and Hugh Waddington www.3ieimpact.org
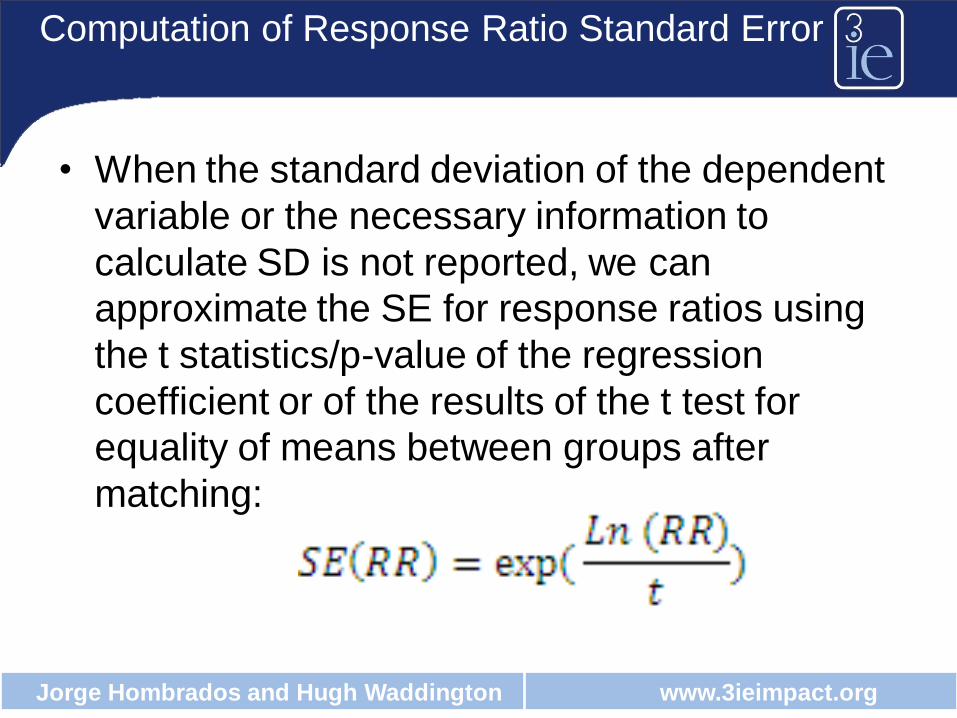
Computation of Response Ratio Standard Error
• When the standard deviation of the dependent
variable or the necessary information to
calculate SD is not reported, we can
approximate the SE for response ratios using
the t statistics/p-value of the regression
coefficient or of the results of the t test for
equality of means between groups after
matching:
Jorge Hombrados and Hugh Waddington www.3ieimpact.org
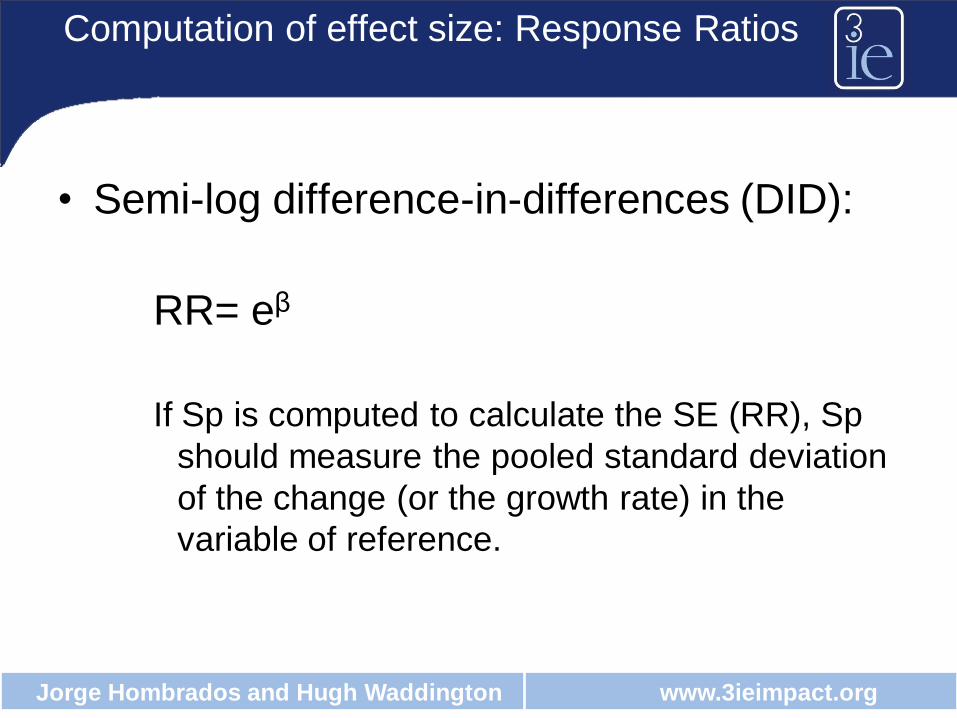
Computation of effect size: Response Ratios
• Semi-log difference-in-differences (DID):
RR= eβ
If Sp is computed to calculate the SE (RR), Sp
should measure the pooled standard deviation
of the change (or the growth rate) in the
variable of reference.
Jorge Hombrados and Hugh Waddington www.3ieimpact.org
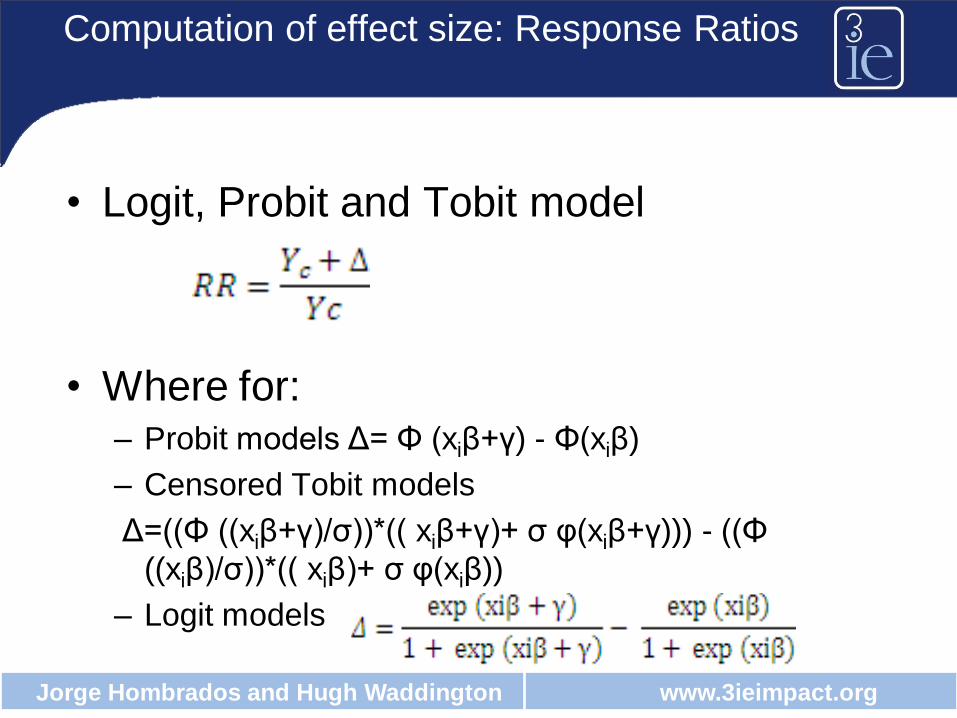
Computation of effect size: Response Ratios
• Logit, Probit and Tobit model
• Where for: – Probit models Δ= Φ (xiβ+γ) - Φ(xiβ)
– Censored Tobit models
Δ=((Φ ((xiβ+γ)/σ))*(( xiβ+γ)+ σ φ(xiβ+γ))) - ((Φ
((xiβ)/σ))*(( xiβ)+ σ φ(xiβ))
– Logit models

Jorge Hombrados and Hugh Waddington www.3ieimpact.org
Computation of effect size: Response Ratios
• For logit model we can also estimate RR as:

Jorge Hombrados and Hugh Waddington www.3ieimpact.org
Unit of analysis error correction
• Unit of analysis error (UoA) arises in impact evaluation studies in which
programme placement and analysis are conducted at a different unit
level and the researcher does not account for this within-cluster
dependency.
• E.g. Programme placement at cluster level and outcomes analysed at
household level.
• The consequences of UoA are false smaller variances and false
narrower confidence intervals.
• If the study conduct analysis and programme placement at different
levels and do not use cluster robust standard errors, we need to apply a
correction to the standard errors to avoid potential Type II error:
• Where m is the cluster size and ICC is the intra-cluster correlation
coefficient.

Jorge Hombrados and Hugh Waddington www.3ieimpact.org
Formulae Table for ES computation
Effect size measure
Formulae for matched-based studies: Information needed to be reported in matched-based
studies:
Formulae for regression-based studies:
Information needed to be reported in
regression-based studies:
Standardizes
Mean Differences
(SMD)
𝑆𝑀𝐷 =𝑌𝑡 −𝑌𝑐𝑆𝑝
𝑆𝐸 𝑆𝑀𝐷 = 𝑛𝑡 + 𝑛𝑐𝑛𝑡 ∗ 𝑛𝑐
+ 𝑆𝑀𝐷2
2 ∗ (𝑛𝑡 + 𝑛𝑐 )
OR
𝑆𝐸 𝑆𝑀𝐷 =𝑆𝑀𝐷
𝑡
𝑆𝑝 = 𝑛𝑡 − 1 ∗ 𝑆𝑡
2 + 𝑛𝑐 − 1 ∗ 𝑆𝑐2
𝑛𝑡 + 𝑛𝑐 − 2
OR
𝑆𝑝 = 𝑆𝐷𝑦
2 ∗ 𝑛𝑡 + 𝑛𝑐 − 1 − 𝛽2 ∗ 𝑛𝑡 ∗ 𝑛𝑐
𝑛𝑡 +𝑛𝑐
𝑛𝑡 + 𝑛𝑐
SMD -Sample mean outcome for the treated and control group after matching
OR -Sample mean outcome for the treatment group AND Average
Treatment Effect on the Treated. -Sample standard deviation for treatment and control group AND
sample size for treatment and control group OR -Sample standard deviation for
the total sample AND sample mean outcome for treatment and control group OR sample mean
outcome for treatment group and ATT AND sample size for treatment and control group.
SE (SMD) -Sample size of the treated and control group OR t statistics of
the treatment effect.
𝑆𝑀𝐷=𝛽
𝑆𝑝
𝑆𝑝 = 𝑆𝐷𝑦
2 ∗ (𝑛𝑡 + 𝑛𝑐 − 1) − 𝛽2 ∗ (𝑛𝑡 ∗ 𝑛𝑐 )𝑛𝑡 + 𝑛𝑐
𝑛𝑡 + 𝑛𝑐
OR 𝑆𝑝 = 𝑆𝐷 𝑜𝑓 𝑡𝑒 𝑟𝑒𝑔𝑟𝑒𝑠𝑠𝑖𝑜𝑛
residuals.
𝑆𝐸 𝑆𝑀𝐷 =𝑆𝑀𝐷
𝑡
OR
𝑆𝐸 𝑆𝑀𝐷 = 𝑆𝑀𝐷2
𝑣 − 2∗
𝑣
𝑡2+ 𝑣 𝑐(𝑣) 2 − 𝑣 + 2
SMD -Regression coefficient -Sample standard
deviation of the dependent variable AND sample size for treatment
and control group OR -Standard deviation of the error term in the
regression. SE(SMD) -t statistics for the
regression coefficient OR t statistics for the regression coefficient AND
Number of covariates AND sample size for the total sample.
Jorge Hombrados and Hugh Waddington www.3ieimpact.org
Formulae Table for ES computation
Effect size measure
Formulae for matched-based studies: Information needed to be reported in matched-based
studies:
Formulae for regression-based studies:
Information needed to be reported in regression-
based studies:
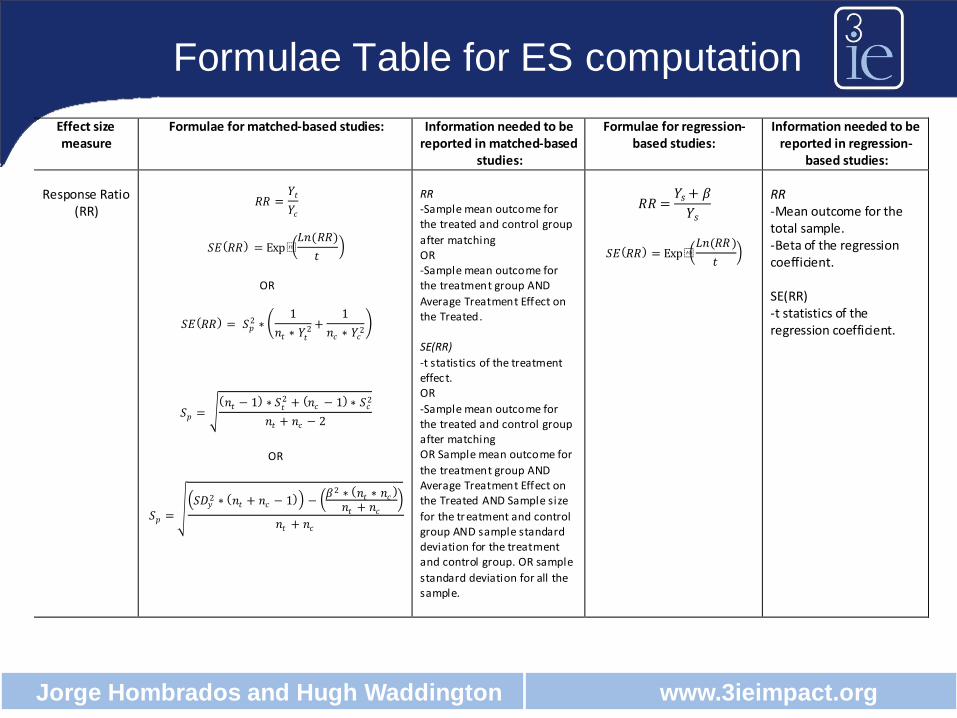
Response Ratio (RR)
𝑅𝑅 =𝑌𝑡
𝑌𝑐
𝑆𝐸 𝑅𝑅 = Exp 𝐿𝑛(𝑅𝑅)
𝑡
OR
𝑆𝐸 𝑅𝑅 = 𝑆𝑝2 ∗
1
𝑛𝑡 ∗ 𝑌𝑡2 +
1
𝑛𝑐 ∗ 𝑌𝑐2
𝑆𝑝 = 𝑛𝑡 − 1 ∗ 𝑆𝑡
2 + 𝑛𝑐 − 1 ∗ 𝑆𝑐2
𝑛𝑡 + 𝑛𝑐 − 2
OR
𝑆𝑝 = 𝑆𝐷𝑦
2 ∗ 𝑛𝑡 + 𝑛𝑐 − 1 − 𝛽2 ∗ 𝑛𝑡 ∗ 𝑛𝑐
𝑛𝑡 + 𝑛𝑐
𝑛𝑡 + 𝑛𝑐
RR -Sample mean outcome for the treated and control group
after matching OR -Sample mean outcome for the treatment group AND
Average Treatment Effect on the Treated. SE(RR)
-t statistics of the treatment effec t. OR
-Sample mean outcome for the treated and control group after matching OR Sample mean outcome for
the treatment group AND Average Treatment Effect on the Treated AND Sample size
for the treatment and control group AND sample standard deviation for the treatment and control group. OR sample
standard deviation for all the sample.
𝑅𝑅 =𝑌𝑠 + 𝛽
𝑌𝑠
𝑆𝐸 𝑅𝑅 = Exp 𝐿𝑛(𝑅𝑅)
𝑡
RR -Mean outcome for the total sample. -Beta of the regression coefficient. SE(RR) -t statistics of the regression coefficient.
Jorge Hombrados and Hugh Waddington www.3ieimpact.org
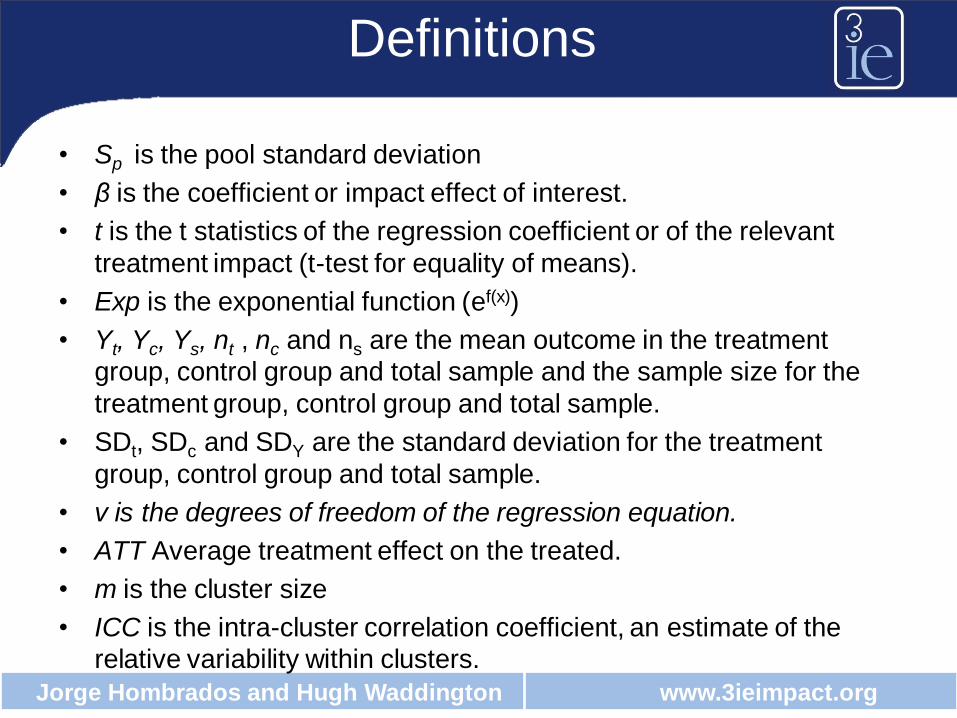
Definitions
• Sp is the pool standard deviation
• β is the coefficient or impact effect of interest.
• t is the t statistics of the regression coefficient or of the relevant
treatment impact (t-test for equality of means).
• Exp is the exponential function (ef(x))
• Yt, Yc, Ys, nt , nc and ns are the mean outcome in the treatment
group, control group and total sample and the sample size for the
treatment group, control group and total sample.
• SDt, SDc and SDY are the standard deviation for the treatment
group, control group and total sample.
• v is the degrees of freedom of the regression equation.
• ATT Average treatment effect on the treated.
• m is the cluster size
• ICC is the intra-cluster correlation coefficient, an estimate of the
relative variability within clusters.
Jorge Hombrados and Hugh Waddington www.3ieimpact.org
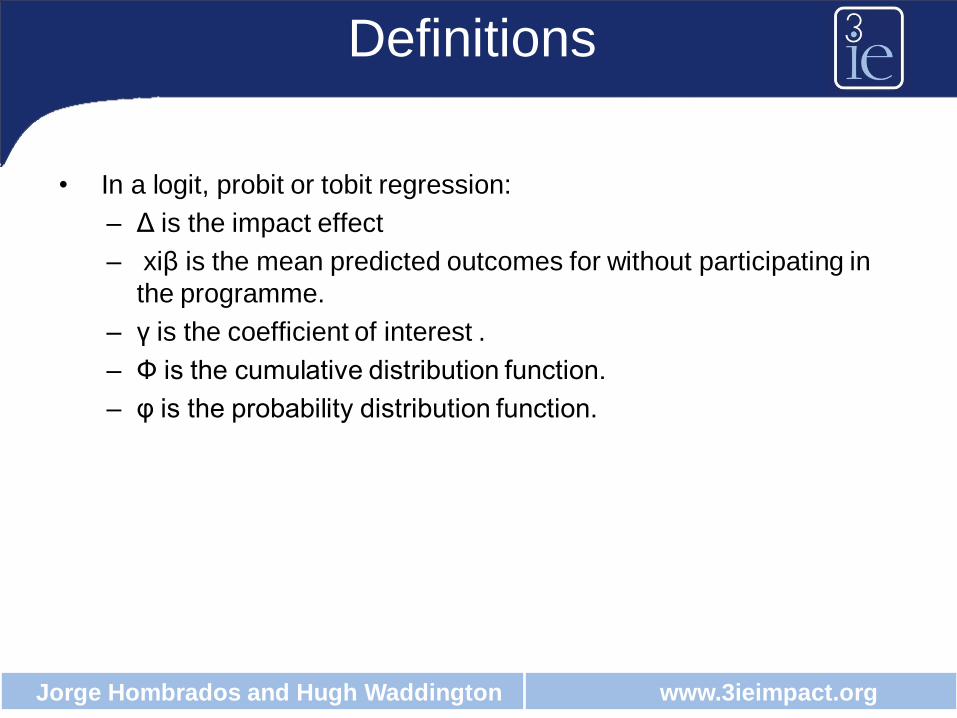
Definitions
• In a logit, probit or tobit regression:
– Δ is the impact effect
– xiβ is the mean predicted outcomes for without participating in
the programme.
– γ is the coefficient of interest .
– Ф is the cumulative distribution function.
– φ is the probability distribution function.

Jorge Hombrados and Hugh Waddington www.3ieimpact.org
Exercises
• Compute effect sizes for the following
studies: – For Banerjee et al. 2009:
• estimate RR and SMD of the impact of microfinance
access on per capita expenditure
• Estimate RR of the impact of microfinance access on
non-food decision making by women
– For Chen et al. 2012, estimate RR and SMD of the
impact of tuition relief on the change in test scores
(use the Diff-in-Diff multivariate regression
specification)

Jorge Hombrados and Hugh Waddington www.3ieimpact.org
Banerjee et al. 2009
• Information coded: In an RCT, at the baseline
and assuming nt=nc:
Ys ≈ Yt ≈ Yc ≈ 1419.229
SDt ≈ SDc ≈ 978.3
Beta= 37.375
SE(Beta)= 978.299
ns= 6821; we assumed nc=
3410 and nt = 3411
RCT with regression
analysis.

Jorge Hombrados and Hugh Waddington www.3ieimpact.org
Banerjee et al. 2009
• Information coded: In an RCT, at the baseline
and assuming nt=nc:
Ys ≈ Yt ≈ Yc ≈ 1419.229
SDt ≈ SDc ≈ 978.3
Beta= 37.375
SE(Beta)= 46.221
ns= 6821; we assumed nc=
3410 and nt = 3411
RCT with regression
analysis
Estimate Standardised Mean
Difference (SMD):
1. Compute t:
2. Compute SDy::
3. Compute Sp:

Jorge Hombrados and Hugh Waddington www.3ieimpact.org
Banerjee et al. 2009
• Information coded: In an RCT, at the baseline and
assuming nt=nc:
Ys ≈ Yt ≈ Yc ≈ 1419.229
SDt ≈ SDc ≈ 978.3
Beta= 37.375
SE(Beta)= 46.221
ns= 6821; we assumed nc= 3410
and nt = 3411
t=0.809
SDy=928.1
Sp=927.8
RCT with regression analysis
Estimate Standardised Mean
Difference (SMD):
4. Compute SMD:
5. Compute SE(SMD):
6. Interpret the results
7. For yourself: correct for sample bias

Jorge Hombrados and Hugh Waddington www.3ieimpact.org
Banerjee et al. 2009
• Information coded: In an RCT, at the baseline and
assuming nt=nc:
Ys ≈ Yt ≈ Yc ≈ 1419.229
SDt ≈ SDc ≈ 978.3
Beta= 37.375
SE(Beta)= 46.221
ns= 6821; we assumed nc= 3410
and nt = 3411
t=0.809
SDy=928.1
Sp=927.8
RCT with regression analysis
Estimate Response Ratio (RR):
1. Compute RR:
2. Compute SE(RR):
3. Interpret the results

Jorge Hombrados and Hugh Waddington www.3ieimpact.org
Banerjee et al. 2009
• Information coded: – In an RCT, at the baseline
and assuming nt=nc:
Ys ≈ Yt ≈ Yc ≈ 0.901
SDt ≈ SDc ≈ 0.299
– Beta= -0.001
– SE(Beta)= 0.014
– ns= 6821; we assumed nc=
3410 and nt = 3411
– t=-0.071
– RCT with regression
analysis
Jorge Hombrados and Hugh Waddington www.3ieimpact.org
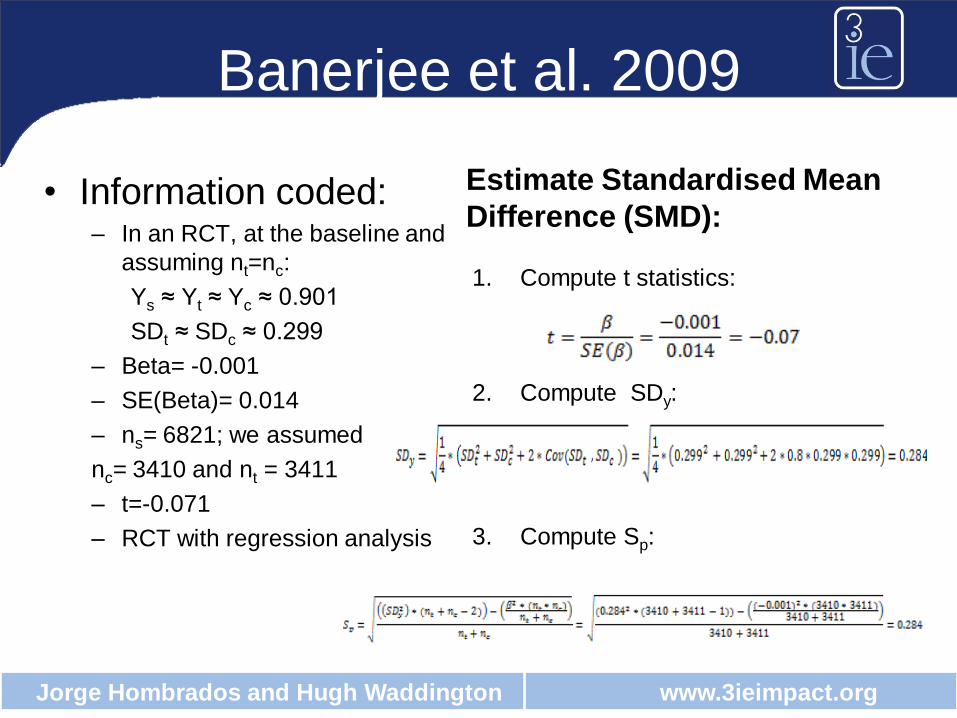
Banerjee et al. 2009
• Information coded: – In an RCT, at the baseline and
assuming nt=nc:
Ys ≈ Yt ≈ Yc ≈ 0.901
SDt ≈ SDc ≈ 0.299
– Beta= -0.001
– SE(Beta)= 0.014
– ns= 6821; we assumed
nc= 3410 and nt = 3411
– t=-0.071
– RCT with regression analysis
Estimate Standardised Mean
Difference (SMD):
1. Compute t statistics:
2. Compute SDy:
3. Compute Sp:

Jorge Hombrados and Hugh Waddington www.3ieimpact.org
Banerjee et al. 2009
• Information coded: – In an RCT, at the baseline and
assuming nt=nc:
Ys ≈ Yt ≈ Yc ≈ 0.901
SDt ≈ SDc ≈ 0.299
– Beta= -0.001
– SE(Beta)= 0.014
– ns= 6821; we assumed
nc= 3410 and nt = 3411
– t=-0.071
– SDy=0.284
– Sp=0.284
– RCT with regression analysis
Estimate Standardised Mean
Difference (SMD):
4. Compute SMD:
5. Compute SE(SMD):
6. Interpret the results:

Jorge Hombrados and Hugh Waddington www.3ieimpact.org
Banerjee et al. 2009
• Information coded: – In an RCT, at the baseline and
assuming nt=nc:
Ys ≈ Yt ≈ Yc ≈ 0.901
SDt ≈ SDc ≈ 0.299
– Beta= -0.001
– SE(Beta)= 0.014
– ns= 6821; we assumed
nc= 3410 and nt = 3411
– t=-0.071
– SMD=-0.004
– SE(SMD)=0.207
– RCT with regression analysis
Estimate Odds ratio (OR):
1. Compute OR:
2. Compute SE(OR):
3. Interpret the results:
Jorge Hombrados and Hugh Waddington www.3ieimpact.org
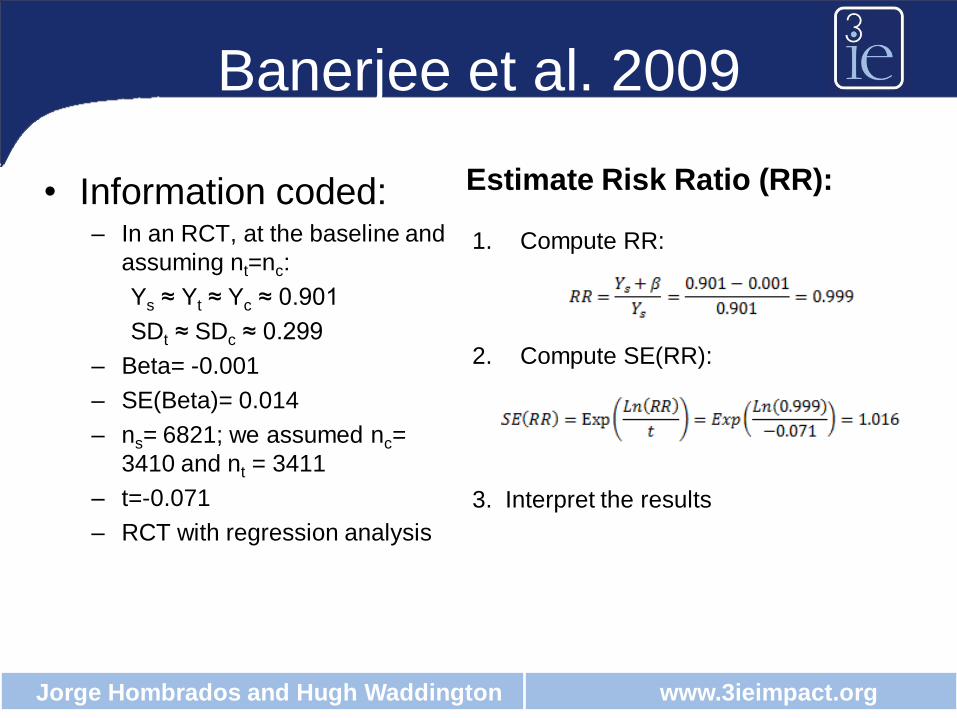
Banerjee et al. 2009
• Information coded: – In an RCT, at the baseline and
assuming nt=nc:
Ys ≈ Yt ≈ Yc ≈ 0.901
SDt ≈ SDc ≈ 0.299
– Beta= -0.001
– SE(Beta)= 0.014
– ns= 6821; we assumed nc=
3410 and nt = 3411
– t=-0.071
– RCT with regression analysis
Estimate Risk Ratio (RR):
1. Compute RR:
2. Compute SE(RR):
3. Interpret the results

Jorge Hombrados and Hugh Waddington www.3ieimpact.org
Chen et al. 2012
• Information coded: Ys= 16.02
Beta=2.85
t= 1.82
nt= 555
nc= 1709
SDy 2010=16.61
SDy 2009=16.85
Diff-in Diff regression study
Jorge Hombrados and Hugh Waddington www.3ieimpact.org
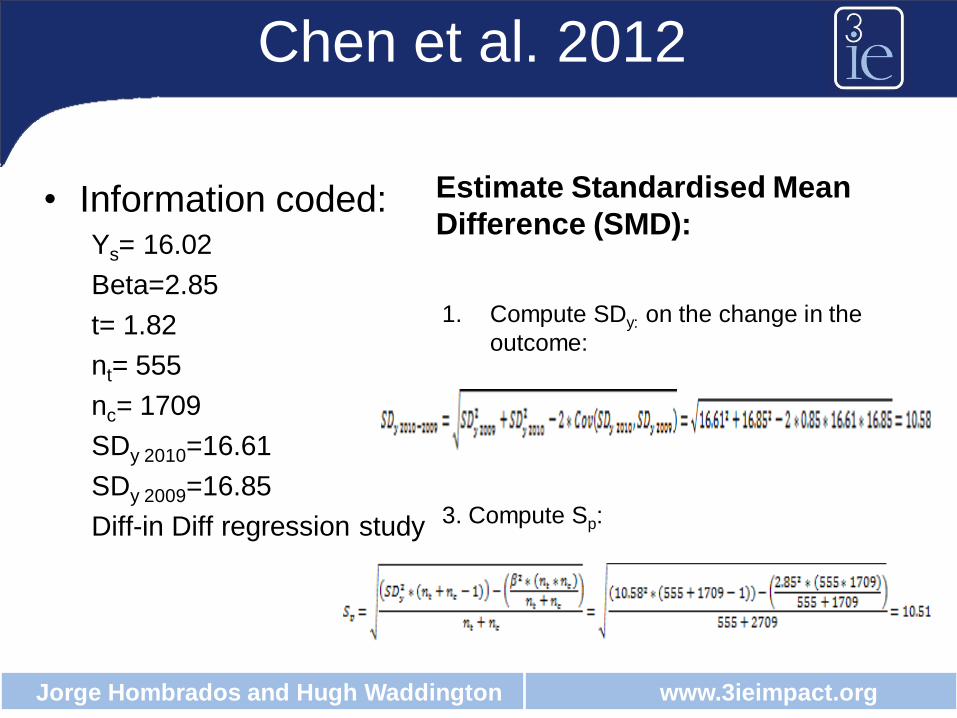
Chen et al. 2012
• Information coded: Ys= 16.02
Beta=2.85
t= 1.82
nt= 555
nc= 1709
SDy 2010=16.61
SDy 2009=16.85
Diff-in Diff regression study
Estimate Standardised Mean
Difference (SMD):
1. Compute SDy: on the change in the
outcome:
3. Compute Sp:

Jorge Hombrados and Hugh Waddington www.3ieimpact.org
Chen et al. 2012
• Information coded: Ys= 16.02
Beta=2.85
SE(Beta)= 1.82
nt= 555
nc= 1709
SDy 2010=16.61
SDy 2009=16.85
SDy=10.58
t=1.82
Sp =10.51
Diff-in Diff regression study
Estimate Standardised Mean
Difference (SMD):
4. Compute SMD:
5. Compute SE(SMD):
6. Interpret the results
7. For yourself: correct for sample bias

Jorge Hombrados and Hugh Waddington www.3ieimpact.org
Chen et al. 2012
• Information coded: Ys= 16.02
Beta=2.85
SE(Beta)= 1.82
nt= 555
nc= 1709
SDy 2010=16.61
SDy 2009=16.85
SDy=10.58
t=1.82
Sp =10.51
Diff-in Diff regression study
Estimate Response Ratios
(RR):
1. Compute RR:
2. Compute SE(RR):
3. Interpret the results

Jorge Hombrados and Hugh Waddington www.3ieimpact.org
Practical tips
• David Wilson effect size calculator available
here:
http://gunston.gmu.edu/cebcp/EffectSizeCalculator
/index.html
but remember to apply corrections for sample bias!
• Code all the relevant information in a spreadsheet for
all relevant studies before starting ES calculations.
Decision on the selection of ES measure would
depend on which ES measure would lead to the
smaller study loss.

Jorge Hombrados and Hugh Waddington www.3ieimpact.org
Main Bibliography Used
• Banerjee, A., Duflo, E., Glennerster, R., Kinnan, C. 2009, “The Miracle of
Microfinance? Evidence from a Randomized Evaluation”, JPAL
• Becker, B. & Wu, M. 2007, “The Synthesis of Regression Slopes in Meta-Analysis”,
Statistical Science, Vol. 22, No 3, 414-429.
• Borenstein, M., Hedges, L., Higgins, J., Rothstein,H. 2009, “Introduction to Meta-
Analysis”. WILEY
• Chen, X., Shi, Y., Yi, H., Zhang, L., Mo, D., Chu, J., Rozelle, S. 2012, “The Impact of
a Senior High School Tuition Relief Program on Poor Junior High School Students in
Rural China”, REAP Working Paper 239, University of Stanford.
• Hansen, H., Klejntrup, N.R., Andersen, O.W. 2011, “A comparison of Model-based
and Design-based Impact Evaluations of Interventions in Developing Countries”, FOI
Working Paper n o.16, University of Copenhagen.
• Hasler, S. Forthcoming, “The Effect of Multi-grade Teaching on Education Quality in
Cameroon. A Propensity Score Matching Model”, Journal of Development Studies.
• Hedges, L.V. 1981, “Distribution Theory for Glass‟s Estimator of Effect Size and
Related Estimators”, Journal of Educational Statistics, vol. 6, pp107-128.
• Keef, S.P. & Roberts, L.A. 2004. “The meta-analysis of partial effect sizes”, British J.
Math. Statist. Psych, Vol 57, pp 97-129.
• Lipsey, M.W. & Wilson, D.B. 2001, “Practical Meta-Analysis”, Applied Social
Research Methods Series, Volume 49. SAGE Publications.

Jorge Hombrados and Hugh Waddington www.3ieimpact.org
Thank you very much
Visit:
www.3ieimpact.org
http://www.campbellcollaboration.org/interna
tional_development/index.php

Jorge Hombrados and Hugh Waddington www.3ieimpact.org
Annex: standard errors and 95% CI for OR / RR
dcbaSEOR
1111
95% confidence interval = exp[ln(OR))±1.96*ln(SEOR)]
dccbaaSERR
1111
95% confidence interval = exp[ln(RR))±1.96*ln(SERR)]