EFFECT ON QUALITY OF LIFE OF SEEMAPURI SLUM ... masters (M.Arch in M.Ekistics) from Jamia Millia...
16
EFFECT ON QUALITY OF LIFE OF SEEMAPURI SLUM DWELLERS UPON RELOCATION Submitted by AASHIMA AGGARWAL source:http://www.chem.info/news/2012/09/trash-energy-plan-worries-ragpickers AUTHOR BIO: Aashima Aggarwal is an Architect, she earned her Bachelor of Architecture degree from Dr. A.P.J Abdul Kalam Technical University,Lucknow in 2016 with merit honours in it. Currently she is pursuing her masters (M.Arch in M.Ekistics) from Jamia Millia Islamia University,Delhi. She likes writing about the topics which are a mix of urban planning and economics. Urbanscapes and informal settlements adds to her list of interest. Previously, she has worked with International Firm, Innowaves Design Services Pvt. Ltd., Noida. ABSTRACT Urbanisation ('push' and 'pull' mechanism) and an ever increasing number of informal settlements are among today's most serious challenges to sustainable urban development. In the developing world, there is a high rate of migration to urban areas which has further worsened the situation. The people who relocate from rural to urban areas in search for better economic opportunities such as employment often choose to settle in informal areas (Tsenkova, 2010) because of high cost of living in the cities. These people are often faced with extreme poverty and social exclusion. The starting point of the development of human communities is the formation of a correct understanding of people’s needs and then the investigation of the achievements of development. Measurement of quality of life offers an appropriate means for achieving such an understanding, for study of quality of life establishes a link between local authorities and citizens for constructive interaction leading to interpretation of and discussion on key issues affecting people’s lives. Seema Puri is a 30-year-old settlement in the capital consisting mostly of slums. This study is a descriptive- analytical inquiry and covers the overview of existing conditions in Seemapuri and study of relocation project of Seemapuri. The relocation should be done in accordance with the needs of the slum residents since "one size does not fit all". The change in quality of life can be achieved only by practical interventions and not going by the book. KEYWORDS: Informal settlements, Quality of life, Urbanisation, Relocation, J.J clusters, Seemapuri slums, Slum dwellers
Transcript of EFFECT ON QUALITY OF LIFE OF SEEMAPURI SLUM ... masters (M.Arch in M.Ekistics) from Jamia Millia...

EFFECT ON QUALITY OF LIFE OF SEEMAPURI SLUM DWELLERS
UPON RELOCATION Submitted by
AASHIMA AGGARWAL
source:http://www.chem.info/news/2012/09/trash-energy-plan-worries-ragpickers
AUTHOR BIO: Aashima Aggarwal is an Architect, she earned her Bachelor of Architecture degree from Dr.
A.P.J Abdul Kalam Technical University,Lucknow in 2016 with merit honours in it. Currently she is pursuing
her masters (M.Arch in M.Ekistics) from Jamia Millia Islamia University,Delhi. She likes writing about the
topics which are a mix of urban planning and economics. Urbanscapes and informal settlements adds to her list
of interest. Previously, she has worked with International Firm, Innowaves Design Services Pvt. Ltd., Noida.
ABSTRACT
Urbanisation ('push' and 'pull' mechanism) and an ever increasing number of informal settlements are among
today's most serious challenges to sustainable urban development. In the developing world, there is a high rate
of migration to urban areas which has further worsened the situation. The people who relocate from rural to
urban areas in search for better economic opportunities such as employment often choose to settle in informal
areas (Tsenkova, 2010) because of high cost of living in the cities. These people are often faced with extreme
poverty and social exclusion. The starting point of the development of human communities is the formation of a
correct understanding of people’s needs and then the investigation of the achievements of development.
Measurement of quality of life offers an appropriate means for achieving such an understanding, for study of
quality of life establishes a link between local authorities and citizens for constructive interaction leading to
interpretation of and discussion on key issues affecting people’s lives. Seema Puri is a 30-year-old settlement in
the capital consisting mostly of slums. This study is a descriptive- analytical inquiry and covers the overview of
existing conditions in Seemapuri and study of relocation project of Seemapuri. The relocation should be done in
accordance with the needs of the slum residents since "one size does not fit all". The change in quality of life
can be achieved only by practical interventions and not going by the book.
KEYWORDS: Informal settlements, Quality of life, Urbanisation, Relocation, J.J clusters, Seemapuri slums,
Slum dwellers

INTRODUCTION:
Urbanisation ('push' and 'pull' mechanism) and an ever increasing number of informal settlements (INSEs) are
among today's most serious challenges to sustainable urban development. While, in the past, urban areas have
been - and still are - places of opportunities, today, they are described as hotspots of crime and numerous
challenges (Wamsler& Brink, 2014). Many countries are facing the problem of regional disparities in the levels
of development. This has resulted in rising poverty, particularly in developing countries. It forces people from
different states to migrate to the capital city in search of employment opportunities and a better quality of life.
This has led to growth of squatter settlements, i.e., slums which come up on public lands, marginal open spaces
and along the road, railway tracks, etc. India is emerging as one of the fastest urbanizing countries in the world
and has reached a staggering urban population of 285 million (2001 census).It is estimated that by the middle of
this century or probably earlier, the country would be more urban than rural. The economic base of the nation
through expanding industries, trade, commerce and services has already shifted to the urban centres. In 2001,
only 1/3 of the country’s population was living in urban areas. Nonetheless, even at such a low level of
urbanization, the total urban population is very large. In 1991, of the 20 largest cities in the world, three
(Mumbai, Kolkata, Delhi) were from India. In 2001, 6 of the 20 largest metropolises in the world were from
India.
Rapid growth of informal settlements in developing countries constitutes one of the most intriguing forms of
urbanization. Current urbanization in developing countries (DCs) is mostly characterized by the proliferation
(rapid increase) of slums and informal settlements. Unfortunately, existing strategies and policies have done
little to mitigate their expansion. The UN-Habitat (2003) reports that 78.2 % of the urban population within
developing cities currently live in informal settlements (IS). Moreover, IS are growing at least twice the rate of
planned settlements (Choguill, 1996).
The starting point of the development of human communities is the formation of a correct understanding of
people’s needs and then the investigation of the achievements of development. Measurement of quality of life
offers an appropriate means for achieving such an understanding, for study of quality of life establishes a link
between local authorities and citizens for constructive interaction leading to interpretation of and discussion on
key issues affecting people’s lives. Results of studies on quality of life can be used to identify again previous
political strategies and to design future planning policies, and, as a result, to achieve the objectives of
development plans (Lee, 2008: 1207; Ahmadvand et al., 2012: 106). Thus, planning for development of quality
of life as a basic principle has always received attention from planer and managers of development (Ghalibaf et
al., 2011: 34).
Moreover, to study of quality of life and to identify factors affecting it can help to identify problematic areas,
causes of people’s dissatisfaction, people’s priorities in their lives, impacts of socio-demographic factors on
quality of life; and to investigate and evaluate the efficiency of policies and strategies with respect to quality of
life. Researchers have pointed out that local social participation in quality of life studies can be a crucial support
for making policies and setting long-term goals (Schmitt, 2002: 4; Santos and Martins, 2007: 413).
Considering the issues discussed and knowledge of the importance of quality of life in the development of
societies, researcher has attempted to investigate the quality of life among the residents of Seemapuri slum
dwellers. Besides shedding light on the general condition of quality of life of the residents of this settlement,
this inquiry also identifies strong and weak points and paves the way for future planning by planers and
authorities so as to enhance quality of life and its indicators in the settlements.
AIM OF THE STUDY:
Evaluate the quality of life in slums pre-relocation as well as post-relocation of slum dwellers of Seemapuri.
The quality of life studies are becoming more relevant for inclusive development of society and country.
OBJECTIVES:

-To discuss the existing living conditions of urban poor in the study area, i.e, SEEMAPURI.
-To study existing policies for slums in Delhi.
-To analyse the relocation process and its effect on life of urban poor.
SCOPE:
To attain the above stated objectives, the present study has the following scopes:
1. The study will cover the quality of the settlement in terms of their housing conditions, demography,
socio-economic aspects (religion, caste, education, occupation, and monthly per capita income), social
infrastructure, water supply, drinking water, sewerage disposal, solid waste disposal, sanitation, toilet facility,
safety.
2. Seemapuri relocation proposal project to be implemented for the slum dwellers.
3. The effect of resettlement on the life of slum dwellers of seemapuri in terms of their quality of life.
4. The quality of life indicators are objective in nature since the relocation project is a proposal to be
implemented in the near future.
LIMITATIONS:
1. The study covers only one settlement colony due to short time span.
2. The quality of life indicators that will not be included in the study are type of ration card holders, type of
media consumption, mode of savings, cleaning of house, ventilation, transportation network, land use, land
ownership, street lighting, government services and responsibilities, fire and police stations, assets.
SITE CONTEXT:
Seema Puri is a 30-year-old settlement in the capital consisting mostly of slums. The living conditions here are
cramped and unhygienic. The inhabitants are mostly migrants from other states who work as daily wage
labourers, drivers, rag-pickers, construction workers or street vendors/shopkeepers.
No. of H.H Population Area(ha) Density
(person/ha)
Average income
(Rs./day)
Delhi 100727646 16787941 147488 113.82 n.a
Seemapuri slums 157 785 0.45 1744.4 200-300
SITE DETAILS:
BLOCK D, NEW SEEMAPURI, J.J CLUSTER SETTLEMENT, EAST DELHI.
location: d-block, New Seema Puri (part-ii)
Households: 157
land owning agency: DUSIB
land area: 4956sq.m.
Parliamentary constituency:
North East Delhi
ward no: 242
revenue district: Shahadara
DIGITISED LAYOUT
SATELLITE
IMAGERY
IMAGE

RELOCATION SITE:
Proposed relocation site has been identified on the city periphery, named PHOOT KURD, adjacent to bawana
industrial estate and bawana village.
100 families of slum in SEEMAPURI will be shifted to flats in Delhi’s PHOOT KURD in response to AAP
government’s push to give respectable housing facilities to the residents of jhuggi jhopris in the city.
The implementation of the new policy started from a Jwalapuri slum cluster and this relocation scheme is likely
to be extended to another 40 clusters across the city.
The AAP government through the DUSIB formulated “Delhi Slum & JJ Rehabilitation and Relocation Policy,
2015” for the resettlement of jhuggi jhopri bastis across the city. The DUSIB is the nodal agency for the
rehabilitation of slums in the city.
The city government’s “Delhi Slum & JJ Rehabilitation and Relocation Policy, 2015” has cleared the roadblock
in the resettlement of the slum clusters by increasing the number of beneficiaries. Only 47% of the total
residents in a slum used to be eligible for the relocation process. But with the new policy the eligibility rate of
beneficiaries has shot up to 90% and above.
The flats to be occupied by the slum dwellers were constructed by the Shila Dixit Government under policy
Jawaharlal Nehru National Urban Renewal Mission (central govt. mission) and made by Delhi Urban Shelter
Improvement Board which was made by Shila Dixit govt in 2010 under Delhi Urban Shelter Improvement
Board Act, 2010 which has been passed by the Legislative Assembly of the National Capital Territory of Delhi
on the 1st April, 2010. These flats were completed 2 years back and were in line to be allotted. The
rehabilitation of the Seemapuri slum cluster is long overdue.
A housing society had moved against the jhughi jhopri cluster as the land it had encroached was meant for the
construction of road. But there was resistance among the dwellers as only a few were eligible for rehabilitation
under the old scheme. The land vacated by the 100 families will be used by the Public Works Department to
construct road.
In all, there were over 157 households in the slum cluster in Seemapuri. Of which, 100 families were found
eligible and allocated flats near Bawana. A slum dweller should possess three proofs to be eligible under the
policy. These include an identity card, name in the electoral roll before January 1 2015, and the aadhar card.
An appellate body has been formed to look into the claims of the ineligible slum dwellers in Seemapuri. Only
the occupant will be the beneficiary as per the policy. If somebody is living as a tenant and possess all the three
proofs, he will be eligible for relocation not the owner of the dwelling. If the rehabilitation of the national
capital’s slum-dwellers has become such a tedious process, the future of pro-poor policies looks extremely
bleak.
ONE COMPLETE UNIT OF EWS HOUSING (Source: http://delhishelterboard.in/main/?page_id=3644)
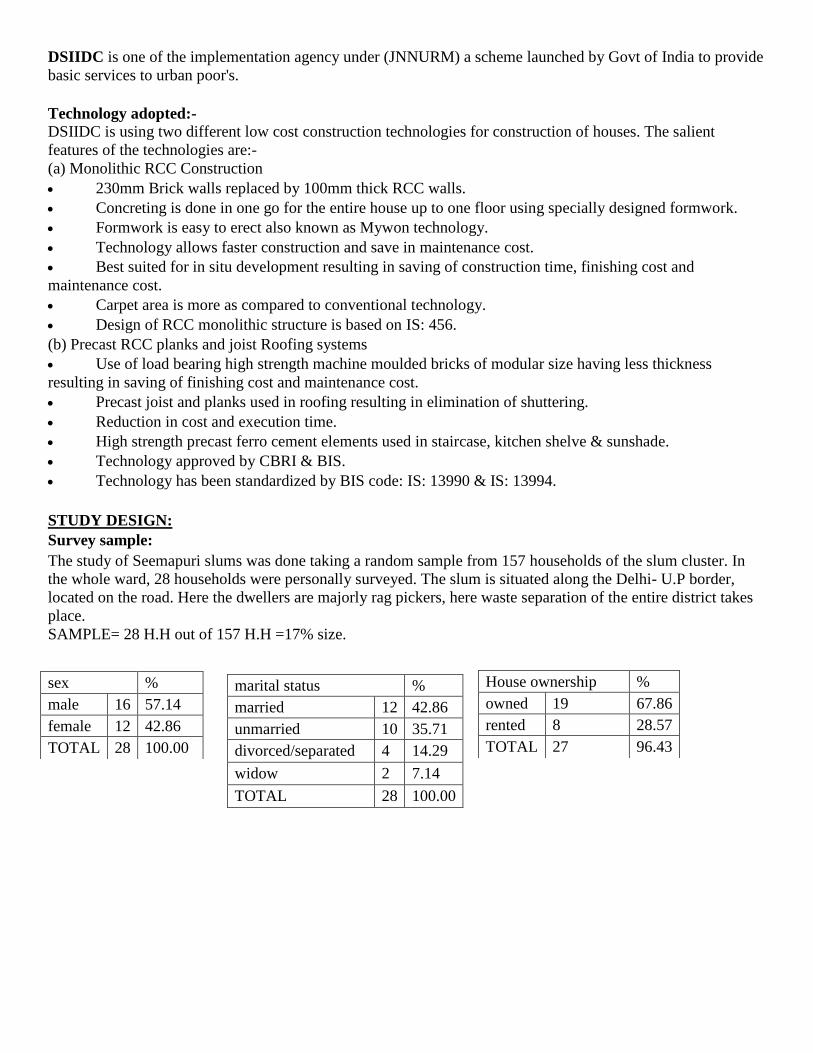
DSIIDC is one of the implementation agency under (JNNURM) a scheme launched by Govt of India to provide
basic services to urban poor's.
Technology adopted:- DSIIDC is using two different low cost construction technologies for construction of houses. The salient
features of the technologies are:-
(a) Monolithic RCC Construction
230mm Brick walls replaced by 100mm thick RCC walls.
Concreting is done in one go for the entire house up to one floor using specially designed formwork.
Formwork is easy to erect also known as Mywon technology.
Technology allows faster construction and save in maintenance cost.
Best suited for in situ development resulting in saving of construction time, finishing cost and
maintenance cost.
Carpet area is more as compared to conventional technology.
Design of RCC monolithic structure is based on IS: 456.
(b) Precast RCC planks and joist Roofing systems
Use of load bearing high strength machine moulded bricks of modular size having less thickness
resulting in saving of finishing cost and maintenance cost.
Precast joist and planks used in roofing resulting in elimination of shuttering.
Reduction in cost and execution time.
High strength precast ferro cement elements used in staircase, kitchen shelve & sunshade.
Technology approved by CBRI & BIS.
Technology has been standardized by BIS code: IS: 13990 & IS: 13994.
STUDY DESIGN:
Survey sample:
The study of Seemapuri slums was done taking a random sample from 157 households of the slum cluster. In
the whole ward, 28 households were personally surveyed. The slum is situated along the Delhi- U.P border,
located on the road. Here the dwellers are majorly rag pickers, here waste separation of the entire district takes
place.
SAMPLE= 28 H.H out of 157 H.H =17% size.
sex %
male 16 57.14
female 12 42.86
TOTAL 28 100.00
marital status %
married 12 42.86
unmarried 10 35.71
divorced/separated 4 14.29
widow 2 7.14
TOTAL 28 100.00
House ownership %
owned 19 67.86
rented 8 28.57
TOTAL 27 96.43
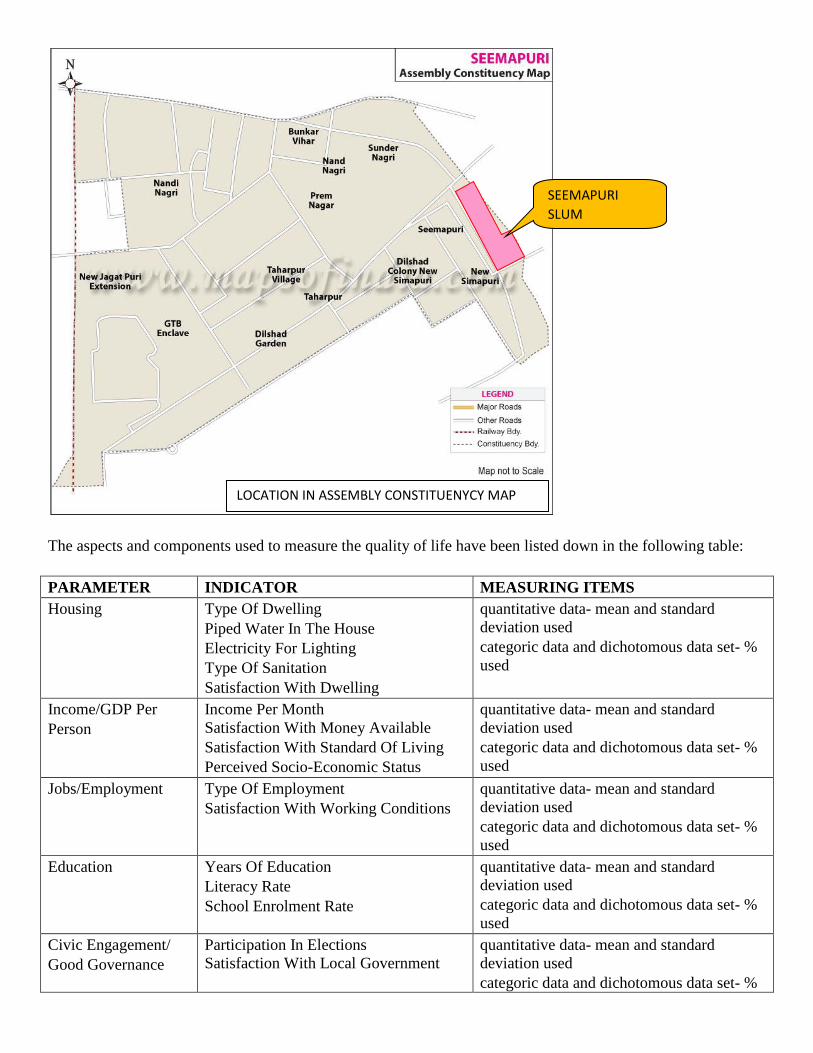
The aspects and components used to measure the quality of life have been listed down in the following table:
PARAMETER INDICATOR MEASURING ITEMS
Housing
Type Of Dwelling
Piped Water In The House
Electricity For Lighting
Type Of Sanitation
Satisfaction With Dwelling
quantitative data- mean and standard
deviation used
categoric data and dichotomous data set- %
used
Income/GDP Per
Person
Income Per Month
Satisfaction With Money Available
Satisfaction With Standard Of Living
Perceived Socio-Economic Status
quantitative data- mean and standard
deviation used
categoric data and dichotomous data set- %
used
Jobs/Employment Type Of Employment
Satisfaction With Working Conditions
quantitative data- mean and standard
deviation used
categoric data and dichotomous data set- %
used
Education Years Of Education
Literacy Rate
School Enrolment Rate
quantitative data- mean and standard
deviation used
categoric data and dichotomous data set- %
used
Civic Engagement/
Good Governance
Participation In Elections
Satisfaction With Local Government
quantitative data- mean and standard
deviation used
categoric data and dichotomous data set- %
LOCATION IN ASSEMBLY CONSTITUENYCY MAP
SEEMAPURI
SLUM

used
Life Satisfaction Perceived Life Satisfaction
Perceived Happiness
Safety Crime Rate quantitative data- mean and standard
deviation used
categoric data and dichotomous data set- %
used
Age, Gender Respondent’s Age
Respondent’s Gender
quantitative data- mean and standard
deviation used
categoric data and dichotomous data set- %
used
histograms, bar charts and pie charts used to represent data graphically.
frequency distribution used to represent the data set.
In statistics, a frequency distribution is a table that displays the frequency of various outcomes in
a sample Each entry in the table contains the frequency or count of the occurrences of values within a particular
group or interval, and in this way, the table summarizes the distribution of values in the sample.
In mathematics and statistics, the arithmetic mean, or simply the mean or average when the context is
clear, is the sum of a collection of numbers divided by the number of numbers in the collection. The collection
is often a set of results of an experiment, or a set of results from a survey. The term "arithmetic mean" is
preferred in some contexts in mathematics and statistics because it helps distinguish it from other means, such
as the geometric mean and the harmonic mean.
In addition to mathematics and statistics, the arithmetic mean is used frequently in fields such as
economics, sociology, and history, and it is used in almost every academic field to some extent. For
example, per capita income is the arithmetic average income of a nation's population.
In statistics, the standard deviation (SD) is a measure that is used to quantify the amount of variation
or dispersion of a set of data values. A low standard deviation indicates that the data points tend to be close to
the mean (also called the expected value) of the set, while a high standard deviation indicates that the data
points are spread out over a wider range of values.
The standard deviation of a random variable, statistical population, data set, or probability distribution is
the square root of its variance. It is algebraically simpler, though in practice less robust, than the average
absolute deviation. A useful property of the standard deviation is that, unlike the variance, it is expressed in the
same units as the data. There are also other measures of deviation from the norm, including mean absolute
deviation, which provide different mathematical properties from standard deviation.
ANALYSIS AND PRESENTATION OF DATA:
Basic amenities available in the urban slum reveal the miserable living conditions of the slum dwellers. It
measured through the availability of toilet, bathroom, drinking water facility, drainage, garbage disposal,
electricity, etc.
PARAMETER- ELECTRICITY:
Electricity is considered as a parameter of measurement of development and quality of life. Regarding this
parameter this is seen that 64% of households in slums used electricity, while rest 36% did not have electricity
access and used some other source of lighting such as kerosene. But it was observed that none had a legal
connection.
Electricity supply %
Yes 18 64.29
No 10 35.71
64%
36%
ELECTRICITY SUPPLY
yes
no

PARAMETER- SOURCE OF DRINKING WATER: Safe and pure drinking water is a basic need for life. The sample survey reveals that 50% of slum residents use
water of water tanker, 39% use boring water for drinking, while only 10% have private taps in their house. The
quality of water of water tankers is not up to the mark. Further, they have to wait for long time in queues for
water. During summer months when there is acute shortfall of water, the slum residents are charged for water so
as to get water through those private water tankers. Poor quality of water lead to illness like diarrhea and other
water borne diseases. Slums are considerably disadvantaged as far as source of drinking water were concerned.
In slums, none of the household use any kind of scientific device for pathogen killing or germs filtration.
Water Supply %
water tanker 14 50.00
Bore hole 11 39.29
private tap 3 10.71
TOTAL 28 100.00
Waiting time water queue
CATEGORY x-
value
FREQUENCY(f) xf x^2f %
0mins-10mins 5.00 5.00 25.00 125.00 17.86
10mins-20mins 15.00 9.00 135.00 2025.00 32.14
20mins-30mins 25.00 11.00 275.00 6875.00 39.29
>30mins 35.00 1.00 35.00 1225.00 3.57
n/a 0.00 2.00 0.00 0.00 7.14
TOTAL 80.00 28.00 470.00 10250.00 100.00
MEAN VARIANCE SD
16.79 349.29 18.69
Total 28 100.00
Pay for Water %
No 13 46.43
yes 11 39.29
don't know 4 14.29
TOTAL 28 100.00
47%
39%
14%
PAY FOR WATER
No
yes
don't know
50%39%
11%
WATER SUPPLY
water tanker
Bore hole
private tap

PARAMETER- SHELTER: House constitutes the most vital aspect of the basic needs of man. Every individual needs to protect his life from
thieves, flood etc. For this purpose proper house is necessary for everyone. On the basis of maternal used in
walls and roofs, we classified all houses in to three categories, Pucca, Semi pucca and Kuccha .A pucca house is
one, which is constructed with cement and concrete roofing. Semi pucca house is constructed with stone with
cement and concrete roofing. A kuccha house is made of mud with thatched and or tin sheet roofing.
The structure conditions and the age of the structure of the slums show the degrading condition of the houses
with majority of structure conditions falling into fair and poor category and only 32% of considerably good
structure condition structure. Age of structure survey shows that almost 40% of recent construction prevails in
the slum area and very much deviation from the average condition suggests the old construction being present
in the area. Dilapidating structures and self- construction is a leading cause of catastrophic disasters since Delhi
lies in seismic zone IV.
5.00
9.00
11.00
1.00 2.000.00
2.00
4.00
6.00
8.00
10.00
12.00
0mins-10mins 10mins-20mins 20mins-30mins >30mins n/a
FREQ
UEN
CY
WATER QUEUE TIME
39%
36%
25%
BUILT STRUCTURE
kuccha pucca semi-pucca
43%
32%
25%
HOUSING CONDITION
good
fair
poor
Building Type %
kuccha 11 39.29
pucca 10 35.71
semi-
pucca
7 25.00
TOTAL 28 100.00
condition %
good 12 32.14
fair 9 42.86
poor 7 25.00
TOTAL 28.00 100.00
Age of house
CATEGORY x- value FREQUENCY(f) xf x^2f %
0-10 yrs 5 2 10 50.00 7.143
11-19yrs 15 11 165 2475.00 39.286

Available field data reveals that around 70 percent
of household had two rooms in the house and 18
percent of houses had only single rooms for
cooking, eating, sleeping and reading without any
toilet and bathrooms. The data reveals that very
few household had three rooms.
PARAMETER- SOLID WASTE DISPOSAL:
Sanitation is not only important for healthy living but also ensuring a non-polluted environment. The majority
of sample households had a poor sewerage disposal facility.
PARAMETER- GARBAGE DISPOSAL:
The risk of human health are compounded in the slums, where garbage collection is non-existent in most cases
and drainage tends to be poor, promoting growth of insects and other diseases (Sundari,2003). There is no
adequate arrangement of garbage disposal, dhalaos are missing from the nearby areas also. The major
occupation of these slum residents is rag-picking so they are the ones who collect all the waste of the city and
segregation is done in this area. They are important people for effective city functioning. The irony prevails that
there is no such garbage disposal and collection method existent for these people.
75%
25%
SANITARY POLLUTION
Yes
No
187 3 0
0
10
20
burn it dump it bury it waste ispicked upFR
EQU
ENC
Y
GARBAGE DISPOSAL
20-49yrs 35 10 350 12250.00 35.714
50-69yrs 60 3 180 10800.00 10.714
> 70yrs 80 2 160 12800.00 7.143
TOTAL 195 28 865 38375.00 100.000
MEAN V SD
30.89285714 1339.643 36.60113
Habitable rooms %
1 5 17.86
2 20 71.43
3 3 10.71
TOTAL 28 100.00
sanitary pollution %
Yes 21 75.00
No 7 25.00
TOTAL 28 100.00
Garbage Disposal %
burn it 18 64.29
dump it 7 25.00
bury it 3 10.71
waste is picked up 0 0.00
TOTAL 28 100.00
Litter %
2
1110
32
0
2
4
6
8
10
12
0-10 yrs 11-19yrs 20-49yrs 50-69yrs > 70yrs
FREQ
UEN
CY
AGE OF HOUSE

PARAMETER- MEDICAL FACILITIES:
Around half the urban population in developing countries is suffering from one or more of diseases associated
with inadequate provision of water and sanitation (DFID,2001). Therefore medical facility is a significant
parameter of measurement of quality of life. The 35% of slum dwellers use clinics, 28% use hospitals and 35%
have access to traditional healers and doctors only.
PARAMETER- SOCIO-ECONOMIC PROFILE:
Socio-economic profile of slum dwellers presents a vivid picture of factors such as caste, religion, education,
occupation and annual income of the family, etc. The variables of caste and religion play equally important role
in patterning and growth of slums. Bangladesh (35%) and Muslims (29%) accounted for a major community.
Indian and Nepali constitute equal share of 17%.
Education status of the head is significant for analysis because education status of the head reflects in the
perception of the health of the household. We observe majority household heads were less educated with
schooling years of about 5-8 years only.
43%
43%
14%
LITTER
high
medium
low
108 7 3
0
5
10
15
Clinic Hospital Traditionalhealer
Doctor
FREQ
UEN
CY
HEALTH SERVICES
108
5 50
5
10
15
bangladeshi muslim indian nepali
FREQ
UEN
CY
ETHNICITY
high 12 42.86
medium 12 42.86
low 4 14.29
TOTAL 28 100.00
type of health services %
Clinic 10 35.71
Hospital 8 28.57
Traditional healer 7 25.00
Doctor 3 10.71
TOTAL 100.00
ETHNICITY %
bangladeshi 10 35.71
muslim 8 28.57
indian 5 17.86
nepali 5 17.86
TOTAL 28 100.00
years of schooling
CLASS X-
VALUE
FREQUENCY
(f)
xf x^2f
0-5 2.50 9.00 22.50 56.25
5- 8 6.50 11.00 71.50 464.75
8- 12 9.50 7.00 66.50 631.75
12-15 13.50 1.00 13.50 182.25

The employment status is a basic indicator of economic soundness of households. Majority of the person
include unskilled work rag picking, security guards, and construction work .It show that number of unemployed
person is very high in females as compared to males. The domination of unskilled work among the marginalized
communities reflects uncertainty of income on their part.
The quality of life is measured directly with the help of the family income. The distribution of household
income shows that around 85 percent of household reported an income of less than Rs 1000 a month. The
remaining 15 percent received between Rs 1000 and 2000. Per-capita Income is an important criteria used for
measuring the standard of living of the people.
income( monthly)
CLASS X-
VALUE
FREQUENCY
(f) xf x^2f %
INR 0-INR 250 125.00 8.00 1000.00 125000.00 28.57
INR 251-INR 500 350.00 8.00 2800.00 980000.00 28.57
INR 501-INR1000 750.00 7.00 5250.00 3937500.00 25.00
INR 1001-INR2000 1500.00 4.00 6000.00 9000000.00 14.29
> INR2000 3500.00 1.00 3500.00 12250000.00 3.57
TOTAL 6225.00 28.00 18550.00 26292500.00 100.00
MEAN V SD
662.50 938355.36 968.69
9.00
11.00
7.00
1.00 0.000.00
2.00
4.00
6.00
8.00
10.00
12.00
0-5 5- 8 8- 12 12-15 >15
FREQ
UEN
CY
SCHOOLING YEARS
0.0010.0020.0030.0040.0050.0060.00
FREQ
UEN
CY
OCCUPATION
>15 16.50 0.00 0.00 0.00
TOTAL 48.50 28.00 174.00 1335.00
MEAN v SD
6.21 41.46 6.44
occupation %
rag picker 16 57.14
security gaurd 4 14.29
casual labour 2 7.14
taxi driver 2 7.14
inactive 1 3.57
landlord/ landlady 1 3.57
shop worker 1 3.57
street vendor 1 3.57
TOTAL 28 100.00

PARAMETER- SANITATION:
Living conditions have a direct impact on health. Availability of toilet is an important indicator of the sanitation.
Toilet is one of the most serious and common problems among all urban poor. The living condition in slums are
usually unhygienic and are an important factor in accelerating transmission of various water borne diseases.
Only 6% slum residents have toilets in their house while the rest are dependent on the community toilets and
neighborhood pit-latrines. Inadequacy of in-house toilets is major cause of health deterioration. Lack of proper
toilet and use of open space by these deprived communities results in the outbreak of communicable illness
during winter season and this account for hike in the morbidity. Most houses had a small area partitioned in
some way that was used for bathing.
PARAMETER- OPINIONS:
Opinions are important vehicle through which one could understand the existing mental attitude of people in
general and groups, and community in particular. Not only the environment or public utility services but also
socio economic problems such as poverty and employment are acute to urban poor. This could be a reason why
urban poor lives in slums despite lack of basic amenities.
29%
29%25%
14%3%
MONTHLY PCI
INR 0-INR 250
INR 251-INR 500
INR 501-INR1000
INR 1001-INR2000
05
101520
FREQ
UEN
CY
TYPE OF TOILET
53
22
111
0 2 4 6
less wages
illiteracy
lack of awareness
less amenities
REASONS FOR POVERTY
Type of toilet %
Govt./community 17 60.71
private 6 21.43
Pit-latrine 3 10.71
don't know 2 7.14
TOTAL 28 100.00
8
8
2
2
0 2 4 6 8 10
BAD
POOR
LESS AMENITIES
SECLUDED
THEIR SITUATION CONCEPTUALISATION

CONCLUSION:
Slums not only seem trapped in a low-human-capital equilibrium, but they also exhibit dysfunctional
institutions, low levels of physical capital, and poor access to developed services. Slums can be thought of as
areas of depressed public and private investment where neither government nor broader society has managed to
organize in a way that provides for widespread provision and maintenance of public goods (and we are defining
“public good” broadly to include clean water, sanitation, garbage collection, a social safety net, and the legal
infrastructure of property rights that allows for an effective market in land and housing).
Without formal land titles, slum dwellers lack the incentives to improve the quality of their homes and
neighbourhoods. Informal settlements have typically emerged on vacant government land, which implies that
the property rights over the land held by individuals living there are highly illiquid, although they may be
enforceable locally.
Quality of life is a multi-dimensional concept that needs to be measured by a composite index that is able to
assess the quality of life in a region. Only once quality of life is measured can trends in quality of life be
monitored and analyzed in order to direct policy decisions.
Widespread governance failures work against the prospects for the urban poor to find creative solutions to
upgrade the quality of their neighbourhoods (as envisioned in Turner and Fichter 1972). A large amount of
anecdotal evidence suggests that allocation mechanisms in slums are inefficient and that private actors or
bureaucratic entrepreneurs first the governance space, as opposed to legitimate local governments or community
representatives. For example, land and housing markets are often controlled by a handful of powerful or well-
connected individuals: landlords, local bureaucrats, or gang members.
In India, slum populations were comprehensively enumerated for the first time in 2001, but discrepancies in the
state-level definitions of slums and the refusal of some states to validate the slum statistics resulted in “gross
under-estimation/under-coverage of slum populations in the country” (Government of India 2011). Lack of
representation can have dramatic consequences when issues of eviction are at stake.
DISCUSSION OF RESULTS:
3
2
1
1
0 1 2 3 4
nothing
work
education
skill development
IMPROVING SITUATION
2
2
1
0 0.5 1 1.5 2 2.5
government help
security
subsidies
ASPIRATIONS FOR HELP

The study shows various indicators of quality of life of the area and the comparison can be done to assess the
change the slum dwellers will be impacted upon by after the resettlement. The relocation site and the present
site have some contrasting characteristics:
PARAMETER SEEMAPURI SLUM SITE PHOOTKURD RELOCATION SITE
Housing
Dwelling- semi-pucca
Piped Water- no
Electricity- illegal
Sanitation- no
Satisfaction With Dwelling
Dwelling- pucca
Piped Water-yes
Electricity-legal
Sanitation- toilet and bath in each unit
Satisfaction With Dwelling
Income/GDP Per
Person
Income Per Month-low
Satisfaction With Money Available-no
Satisfaction With Standard Of Living-no
Perceived Socio-Economic Status-poor
Income Per Month-assumed to be better
Satisfaction With Money Available-yes
Satisfaction With Standard Of Living-yes
Perceived Socio-Economic Status-better
Jobs/Employment Type Of Employment-rag pickers
Satisfaction With Working Conditions-
no
Type Of Employment-labour
Satisfaction With Working Conditions-yes
Education Years Of Education-8-10
Literacy Rate-low
School Enrolment Rate-less
Years Of Education-increase
Literacy Rate-better
School Enrolment Rate-increase
Life Satisfaction Perceived Life Satisfaction-no
Perceived Happiness-no
Perceived Life Satisfaction-yes
Perceived Happiness-yes
Safety Crime Rate- more Crime Rate- gated community
Thus, it can be concluded that the relocation from the present site will bring a hope amongst the slum dwellers
to prosper and improve their current status quo.
The proximity to a village will enable friendliness which they lack here, and the proximity to industrial area will
bring a big time career and job opportunity to work harder with improved wages and eventually rise out of the
poverty traps and break the notion prevailing to rise out. The new location will be a ladder of progress to these
slum dwellers.
INFERENCES:
The relocation should be done in accordance with the needs of the slum residents since "one size does
not fit all".
the change in quality of life can be achieved only by practical interventions and not going by the book.
hope to prosper should be there and interventions should keep those aspirations lively.
low wages and job uncertainty have been dealt nicely, by locating the people next to an industrial site,
providing them with fixed and assured income generator.
security and safety are essential for survival, the gated communities provide the same so that people can
live peacefully with no fear of future eviction and invest on their neighbourhood.
the sense of ownership will be there.
proper and regulated basic amenities will be provided them with all required infrastructure.
education and skill development centre to initiate and enhance their skills and create awareness about
their livelihood and living conditions so they improve their literacy rate, education is the sole parameter of
progress.
community area and open parks for leisure and recreation, a way to build up their social life as well.
all these have been incorporated by DUSIB and DSIIDC in their new site so they have a new beginning
to life with a brighter side this time.

BIBLIOGRAPHY:
1. Roy, A. (2003a). City Requiem, Calcutta: Gender And The Politics Of Poverty. Minneapolis: University
Of Minnesota Press.
2. Roy, A., & Alsayyad, N. (Eds.). (2004). Urban Informality: Transnational Perspectives Fom The
Middle East, South Asia And Latin America. Lanham, MD: Lexington Books.
3. Greyling Talita,A Composite Index For The Gauteng City Region, Department Of Economics And
Econometrics, University Of Johannesburg, November 2013, 54pp.
4. Shoeibi Mojtaba, Amraii Iman, Mafakheri Amin, Karimi Aram, Vandi Aydaalahdini, Analysis Of
Subjective Indicators Of Quality Of Life In Urban Areas Of Iran, Journal Of Research In Humanities And
Social Sciences, Volume 3- Issue 3(2015), ISSN (Online) 2321-9467, 7pp.
5. Fayaz Sameer, Naqshbandi Zoya, Farooq Hakim, Parray Jahangir A., Shah Arif H. And Bhat M. Sultan,
Physical Ecology Of Slums In Srinagar City, International Journal Of Recent Scientific Research, Volume6,
Issue 12, Pp.7972-7977, December(2015), ISSN 0976-3031.
6. C. Sufaira,Department Of Economics, Central University Of Kerala, IOSR Journal Of Humanities And
Social Sciences, Volume 10, Issue 5(May-June. 2013), Pp 12-24, P-ISSN 2279-0845.
7. Jha Darshan Kumar, Tripathi V.K, Unpublishes Thesis, Varanasi, U.P, Quality Of Life Of Slums Of
Varanasi City, Pp.13.
8. Wani Rashid Ashraf, Khaikar Vijaya P., Department Of Geograpghy, Pune University, Journal Of Arts,
Science And Commerce, ISSN 2231-4172, Pp 15.
9. A Rao, A Reader In Urban Sociology, Orient Longman, (1991), ISSN 0863111513, 9780863111518, Pp
425.
10. Http://Delhishelterboard.In/Main/?Page_Id=3644.
11. Http://Dda.Org.In/Ddanew/Housing.Aspx.