Effect of traffic noise on birds -...
42
Appendix T ........................................................................... Effect of traffic noise on birds ........................................................................... Effect of traffic noise on birds Phoenix Environmental Sciences, March 2011. Assessment of the Effect of Traffic Noise on Wetland Birds: Background Study for the Roe Highway Extension Project. Unpublished report prepared in association with AECOM for South Metro Connect, Perth, WA.
Transcript of Effect of traffic noise on birds -...

Appendix T. . . . . . . . . . . . . . . . . . . . . . . . . . . . . . . . . . . . . . . . . . . . . . . . . . . . . . . . . . . . . . . . . . . . . . . . . . .Effect of traffic noise on birds. . . . . . . . . . . . . . . . . . . . . . . . . . . . . . . . . . . . . . . . . . . . . . . . . . . . . . . . . . . . . . . . . . . . . . . . . . .
Effect of traffic noise on birds
Phoenix Environmental Sciences, March 2011. Assessment of the Effect of Traffic Noise on Wetland Birds: Background Study for the Roe Highway Extension Project. Unpublished report prepared in association with AECOM for South Metro Connect, Perth, WA.

Assessment of the Effect of Traffic Noise on Wetland Birds Background study for the Roe Highway Extension Project
South Metro Connect Final Report
Phoenix Environmental Sciences Pty Ltd i
Assessment of the Effect of Traffic Noise on Wetland Birds Background study for the Roe Highway Extension Project
South Metro Connect Final Report
Phoenix Environmental Sciences Pty Ltd i
Assessment of the Effect of Traffic Noise on Wetland Birds
Background Study for the Roe Highway Extension Project
Prepared in association with AECOM Pty Ltd for South Metro Connect
Final Report
Authors: Guillaume Bouteloup, Jarrad Clark and Dick Petersen
Reviewers: Melanie White and Karen Crews
Date: March 2011
Submitted to: Jamie Shaw © Phoenix Environmental Sciences Pty Ltd 2011 The use of this report is solely for the Client for the purpose of which it was prepared. Phoenix Environmental Sciences accepts no responsibility for use beyond this purpose. All rights are reserved and no part of this publication may be reproduced or copied in any form without the written permission of Phoenix Environmental Sciences or AECOM Pty Ltd (for South Metro Connect).
Phoenix Environmental Sciences Pty Ltd
1/511 Wanneroo Road
BALCATTA WA 6023
P: 08 9345 1608
F: 08 6313 0680
Project code: 963-ROE-AEC-FAU

Assessment of the Effect of Traffic Noise on Wetland Birds Background study for the Roe Highway Extension Project
South Metro Connect Final Report
Phoenix Environmental Sciences Pty Ltd ii
TABLE OF CONTENTS
EXECUTIVE SUMMARY ................................................................................................................................... iv
1 INTRODUCTION ........................................................................................................................................ 1
1.1 Background ......................................................................................................................................... 1
1.2 Scope of work and survey objectives .................................................................................................. 1
2 EXISTING ENVIRONMENT ....................................................................................................................... 3
2.1 Climate ................................................................................................................................................ 3
2.2 The Beeliar Wetlands .......................................................................................................................... 3
2.3 Northern Lakes .................................................................................................................................... 3
3 METHODOLGY .......................................................................................................................................... 5
3.1 Desktop Review .................................................................................................................................. 5
3.2 Data Collection .................................................................................................................................... 5 3.2.1 Historical bird counts .................................................................................................................... 5 3.2.2 Traffic volume............................................................................................................................... 5
3.3 Noise Measurements .......................................................................................................................... 5
3.4 Limitations ........................................................................................................................................... 5 3.4.1 Reliability of previous bird count data .......................................................................................... 5 3.4.2 Timing and seasonality ................................................................................................................ 6 3.4.3 Study length ................................................................................................................................. 6 3.4.4 Abiotic factors............................................................................................................................... 6 3.4.5 Traffic volume............................................................................................................................... 6 3.4.6 Validity of comparisons ................................................................................................................ 6
4 RESULTS ................................................................................................................................................... 7
4.1 Literature Review: Impact of Traffic Noise on Birds, and Implications Within the Study Area............ 7 4.1.1 Noise and the bird‟s ear ............................................................................................................... 7 4.1.2 Absolute threshold of hearing ...................................................................................................... 7 4.1.3 Effects of noise on bird hearing ................................................................................................... 8
4.1.3.1 Permanent and temporary threshold shifts .............................................................................. 8 4.1.3.2 Auditory masking ...................................................................................................................... 8 4.1.3.3 Adaptations in response to masking ...................................................................................... 10
4.1.4 The masking effect of traffic noise ............................................................................................. 10 4.1.5 Noise impacts on bird distribution and reproductive success .................................................... 11 4.1.6 Summary and implications for the Project ................................................................................. 13
4.2 Wetland birds of the Study Area ....................................................................................................... 14 4.2.1 Species of conservation significance ......................................................................................... 15
4.3 Wetland bird Usage of the Study Area .............................................................................................. 19 4.3.1 Factors influencing wetland bird populations and distribution ................................................... 19
4.3.1.1 Rainfall and temperature ........................................................................................................ 19 4.3.1.2 Coastal conditions .................................................................................................................. 19 4.3.1.3 Wetland conditions ................................................................................................................. 19 4.3.1.4 Population trends ................................................................................................................... 19
4.3.2 Species richness within the study area and northern lakes ....................................................... 20 4.3.2.1 Bird numbers within the study area ........................................................................................ 20 4.3.2.2 Conservation significance ...................................................................................................... 21
4.3.3 Wetland bird communities .......................................................................................................... 22
4.4 Traffic Volume ................................................................................................................................... 23 4.4.1 Noise Measurements ................................................................................................................. 24
4.4.1.1 Noise Levels ........................................................................................................................... 24 4.4.1.2 Frequency content of traffic noise .......................................................................................... 25
4.5 Summary of results ........................................................................................................................... 26

Assessment of the Effect of Traffic Noise on Wetland Birds Background study for the Roe Highway Extension Project
South Metro Connect Final Report
Phoenix Environmental Sciences Pty Ltd iii
5 DISCUSSION AND CONCLUSION ......................................................................................................... 27
5.1 Birds of the Study Area and Northern Wetlands ............................................................................... 27
5.2 Noise Levels and Potential Impacts on Bird Populations ................................................................. 28
6 REFERENCES ......................................................................................................................................... 29
7 GLOSSARY .............................................................................................................................................. 33
LIST OF TABLES Table 2-1 Profile of wetlands within the study area and northern lakes (highlighted) (Source:
Environmental Protection Authority (1993) Storey et al (1993) Western Wildlife (2010)). ............ 4 Table 4-1 Description of the impact zones (as presented in Figure 4-4) for the proposed project. ............ 13 Table 4-2 The conservation significant wetland birds of the study area. ..................................................... 16 Table 4-3 Wetlands ranked by species richness (northern lakes are highlighted). .................................... 20 Table 4-4 Wetlands ranked by highest total counts (northern lakes are highlighted). ................................. 21 Table 4-5 Wetlands of the study area and northern lakes, ranked by Conservation Significant species
(northern lakes are highlighted). .................................................................................................. 21 Table 4-6 Occurrence frequencies (%) of the different bird communities of the study area (northern lakes
highlighted, red numbers are the maximum occurrence frequencies for each group of birds). .. 22 Table 4-7 Wetlands ranked by TVDR, (northern lakes are highlighted) ..................................................... 23 Table 4-8 Wetlands ranked by noise levels (northern lakes are highlighted). ............................................ 24 Table 4-9 Overall ranking of the 16 wetlands of the study area according to all measured data from the
current study and previous surveys (1981 to 2010) (northern lakes are highlighted). ................ 26
LIST OF FIGURES Figure 4-1 Median bird audiogram based on 49 bird species, compared to the human audiogram (Dooling
and Popper 2007). ......................................................................................................................... 8
Figure 4-2 The median critical ratio for the typical bird based on data for 14 bird species, compared to humans. ......................................................................................................................................... 9
Figure 4-3 Conceptual model for predicting the masking effect of traffic noise (Dooling and Popper 2007).10
Figure 4-4 Relationship between traffic noise levels, distance from transport corridor, and potential impact on birds. Potential impacts are most significant in zone 1 closest to the transport corridor (Dooling and Popper 2007). ........................................................................................................ 13
Figure 4-5 One-third octave band noise levels measured at the six sites with highest noise levels ............ 25
Assessment of the Effect of Traffic Noise on Wetland Birds Background study for the Roe Highway Extension Project
South Metro Connect Final Report
Phoenix Environmental Sciences Pty Ltd iv
EXECUTIVE SUMMARY
South Metro Connect (SMC) commissioned Phoenix Environmental Sciences Pty Ltd (Phoenix) to undertake a study of existing road traffic noise at wetlands located in the vicinity of the Roe Highway Extension Project („the proposed project‟) and investigate potential effects on wetland birds. The study was undertaken in August 2010 and encompassed 13 wetlands in the Beeliar Wetlands (the “study area”) that were compared to three lakes located north of the Beeliar Wetlands but close to heavily trafficked roads (the “northern lakes”).
Three types of data were investigated and collected:
Literature documenting bird vocalizations, hearing capacities and the effect of traffic noise on birds;
Data on wetland bird populations of the study area and northern lakes; and
Data on traffic volumes (number of cars per day) and the ambient noise (in dB(A)) and frequency range ( Hz) generated by the roads adjacent to each sampled wetland.
The highest bird counts and the species occurrence frequency over the last 30 years were analyzed for the study area and the northern lakes.
Noise measurements were conducted in the field and traffic volume data were obtained from Main Roads Western Australia.
The results are subjects to several limitations:
Disparity in bird count data from different historical sources;
Timing and seasonality;
Study length; and
Wetland conditions and abiotic factors.
The highest noise measurements reached 62 dB(A). In the study area, only three sites experience noise levels of 55 dB(A) or higher. According to the literature, the effect of traffic noise on birds becomes apparent above noise levels of 55 dB(A). Lake Monger experiences the highest noise level and highest traffic volume to distance ratio (TVDR) but still supports an appreciable number of species (the 8
th highest of the sampled
wetlands, at 56 species). This seems to be linked to the size of the lake and the greater number of habitats provided (6
th largest lake at 70ha). Habitat availability seems to be the key factor that would explain the
difference between the wetland bird communities of the Beeliar Wetlands and wetland bird communities of the northern lakes. However habitats were not assessed for this study.
The northern lakes support fewer shorebird species than the Beeliar Wetlands (10 species of regular occurrence compared with 23 at Beeliar Wetlands) but this can be explained by limited available shallow water/foraging habitat.
The total number of species of the Beeliar Wetlands is higher than for the northern lakes (96 vs 66). The average species richness of the northern lakes (50 species) is higher than for the Beeliar Wetlands (43 species) despite a higher average noise level (53 dB(A) vs 49 dB(A)) and a much higher average TVDR (767 vs 53).
The noise measurements collected in the study did not demonstrate any evidence of a relationship between road traffic noise and wetland birds. This may be due to the low noise levels recorded at most of the sampled wetlands. Due to the great number of limitations applying to this study no strong conclusions can be made regarding the relationship between road traffic noise and wetland birds within the study area.
A review of the literature suggests impacts on birds are experienced above 55 dB(A). As a minimum, noise levels emanating from the proposed project to Bibra and North Lake must be kept below 55 dB(A), according

Assessment of the Effect of Traffic Noise on Wetland Birds Background study for the Roe Highway Extension Project
South Metro Connect Final Report
Phoenix Environmental Sciences Pty Ltd v
to the literature available. However, as there is limited data available specifically for wetland birds and the results from this study are inconclusive, and as such a precautionary approach is warranted.
We also thank Dr Dick Petersen from AECOM for undertaking the literature review on the Impact of Traffic Noise on Birds.
.

Assessment of the Effect of Traffic Noise on Wetland Birds Background study for the Roe Highway Extension Project
South Metro Connect Final Report
Phoenix Environmental Sciences Pty Ltd 1
1 INTRODUCTION
South Metro Connect (SMC) commissioned Phoenix Environmental Sciences Pty Ltd (Phoenix) to undertake a study of existing road traffic noise at wetlands located in the vicinity of the Roe Highway Extension Project („the proposed project‟).
The sampled wetlands form part of the Beeliar Wetland chain within Beeliar Regional Park and one of them (Thomsons Lake) is of international significance for wetland birds. The proposed project is anticipated to generate a higher level of traffic noise in a northern section of the Beeliar Wetlands than is currently experienced, particularly in the vicinity of northern Bibra Lake and North Lake.
We thank Dr Dick Petersen from AECOM for undertaking the literature review on the Impact of Traffic Noise on Birds.
1.1 BACKGROUND
The Government of Western Australia (Main Roads WA) is planning to extend Roe Highway from its current connection to Kwinana Freeway in Jandakot to Stock Road in Coolbellup. The proposed alignment for the highway between the Kwinana Freeway and North Lake Road is within the existing Primary Regional Roads Metropolitan Regional Scheme (MRS) boundary that divides the Beeliar Regional Park between Bibra Lake and North Lake.
Stakeholders have raised concerns about the potential noise volumes that will be generated by the proposed project, and the potential impact of this noise on the local wetland bird populations, principally at Bibra Lake and North Lake.
1.2 SCOPE OF WORK AND SURVEY OBJECTIVES
The aim of the study was to collect baseline noise data at 16 wetlands in the Perth Metropolitan Area to inform an assessment of potential impacts of traffic noise from the proposed project on wetland birds.
The specific objectives of this study were to:
Collect noise level (dB) and frequency range ( Hz) baseline measurements from 16 wetlands where wetland birds are present;
Collect the most recent and comprehensive bird data for the 16 surveyed wetlands;
Consider previous bird count in relation to changes in bird composition and abundance over time; and
Interpret the noise measurement results in the context of the bird data available and if possible make some observations regarding the potential impact of road traffic noise from the proposed project on wetland birds.
Achieving these objectives requires an understanding of; the effects of traffic noise on birds, the nature of bird communities (and conservation significant species) within the proposed project area, the sensitivity of species to noise disturbance and the current noise levels experienced by birds in the area.
The wetlands surveyed focused on the Beeliar Wetland chain and sites subject to high traffic volumes. They comprised:
North and Bibra Lakes (test lakes within the project area for the proposed project);
Eleven other wetlands in the Beeliar chain (reference sites adjacent to the proposed project; South Lake, Thomsons Lake, Kogolup Lake, Manning Lake, Little Rush Lake, Yangebup Lake, Roe Swamp, Lake Coogee, Fawcett Road Wetland, Horse Paddock Swamp, Market Garden Swamp);
Three wetlands in the northern suburbs of the Perth Metropolitan area where high volumes of road traffic are experienced (Lake Joondalup, Lake Monger and Booragoon Lake).

Assessment of the Effect of Traffic Noise on Wetland Birds Background study for the Roe Highway Extension Project
South Metro Connect Final Report
Phoenix Environmental Sciences Pty Ltd 2
The wetlands of the Beeliar chain listed in the first two bullets above are considered to be „the study area‟. The three remaining wetlands are hereafter referred to as „the northern lakes‟.
Assessment of the Effect of Traffic Noise on Wetland Birds Background study for the Roe Highway Extension Project
South Metro Connect Final Report
Phoenix Environmental Sciences Pty Ltd 3
2 EXISTING ENVIRONMENT
General information pertaining to the project area specifically, its location in the Swan Coastal Plain IBRA
subregion (SWA2), landforms and associated vegetation complexes and land use are described in the
Vertebrate Fauna Surveys for the Roe Highway Extension Project – Baseline Report (2010) prepared by
Phoenix Environmental Sciences.
2.1 CLIMATE
Climate conditions for the study were surmised from recordings at Jandakot Aero, approximately 3km to the east of the project area. The mean daily maximum temperature of 31.3°C occurs in February, along with the highest minimum of 16.8°C. July is the coldest month on average, reaching a maximum temperature of 17.8°C. The lowest minimum is shared between July and August, both of which average 6.9°C. Rainfall occurs mainly during the cooler winter months between May and August, peaking in July with an average rainfall (36year period) of 180.3mm. Annual rainfall is 837mm (BOM 2010).
On the day of noise measurement recording (11 August 2010), the maximum temperature was 20.5°C and
minimum temperature was 10°C. No rainfall was recorded on this day.
2.2 THE BEELIAR WETLANDS
The Beeliar Wetlands are a group of 19 wetlands that run parallel to the Western Australian coastline. They are located in the central part of the Swan Coastal Plain, an area that has already lost 75 percent of its wetlands since European settlements (Dooley et al 2006). The Beeliar Wetlands are comprised of two parallel linear chains, the western chain and the eastern chain. The study area, located approximately 20km south of the city of Perth, encompasses 13 of the 19 Beeliar Wetlands.
Beeliar Regional Park was proposed in 1986 to facilitate coordinated planning and management strategies for the two wetland chains, as warranted by the diversity of their functions and values, e.g. biodiversity, indigenous and non-indigenous culture, landscape, education, research and recreation (Dooley et al 2006). The various values (and activities that take place) held by Beeliar Regional Park and the historical backdrop of wetland loss in Western Australia, coupled with continued urban and industrial pressures, mean that all remaining large lakes and wetlands are highly valuable on the Swan Coastal plain. The priority of the Beeliar Regional Park and Bibra Lake management plans (designed for the 2005 to 2014 period) is the “conservation and protection of the natural environment” (Dooley et al 2006).
Thomsons Lake (approximately 7km south of Bibra Lake) is the only site within the Beeliar Wetlands with international recognition. It was added to the Ramsar site list (the Convention on Wetlands of International Importance) in 1990. Thomsons lake was listed in accordance with Ramsar criteria 1, 3, 5 and 6, which correspond to significant local wetland habitat that regularly supports more than 20000 or more wetland birds and one percent (or more) of the population of at least one species of waterbird (Department of Conservation and Land Management 2003).
The other sites are of local conservation significance. Bibra Lake and Manning Lake are surrounded by recreational areas. Profiles of the 16 wetlands included in this study are summarised (Table 2-1). These data are based on Western Wildlife (2010), Storey et al (1993), Bennett Brook Environmental Services (2004), and Kinear and Garnett (1999).
2.3 NORTHERN LAKES
Three wetlands were included in this study for their proximity to high traffic roads: Leach Highway, Kwinana Freeway and the Mitchell Freeway. While not all part of the Beeliar Regional Park, these wetlands are encompassed in the larger Spearwood dune system and are therefore broadly comparable in terms of wetland geomorphology, associated habitats and conditions. All are located north of the Project Area.
Lake Monger is a freshwater lake adjoining the Mitchell freeway. The lake covers 70ha, is part of the Lake Monger Reserve (110ha) and is a significant recreational area (Lund 1992). The surrounding and fringing vegetation is inconsistent and dominated by terrestrial grasses across much of its perimeter. The eastern side contains many trees that act as a visual and noise barrier between the lake and the freeway. Lake Monger is historically known to harbour significant numbers of wetland birds (City of Perth 1998).

Assessment of the Effect of Traffic Noise on Wetland Birds Background study for the Roe Highway Extension Project
South Metro Connect Final Report
Phoenix Environmental Sciences Pty Ltd 4
Lake Joondalup is part of the larger Yellagonga Regional Park and covers 450ha. Like most wetlands in south-western Australia, water levels vary throughout the year with the peak minima occurring in December and the peak maxima occurring between July and September (Kinear and Garnett, 1999). Lake Joondalup is located north east of the Mitchell Freeway‟s northern end. This wetland is listed on the Directory of Important Wetlands in Australia under four criteria (Environment Australia 2001). It is also considered of national and international significance for the Red-necked Avocet (Watkins 1993).
Booragoon Lake is part of the eastern chain of the Beeliar Wetlands, within the Beeliar Regional Park (Dooley et al 2006). It covers 23ha and is a permanent wetland, even during the summer (Bennett Brook Environmental Services, 2004). Booragoon Lake is situated west of the Kwinana Freeway and north of Leach Highway. It is listed on the Directory of Important Wetlands in Australia (Environment Australia 2001). Engineering alterations have been made in an effort to limit the input of urban pollutants.
Table 2-1 Profile of wetlands within the study area and northern lakes (highlighted) (Source: Environmental Protection Authority (1993) Storey et al (1993) Western Wildlife (2010)).
Wetlands Type Area Salinity Shoreline
Length (m)
Summer drought refuge
importance for wetland
birds
Permanent Open Water <50cm deep
Permanent Open
Water >50cm deep
Manning Lake Permanent 14.9 Fresh 999 - - -
Market Garden Swamp
Permanent 4.8 Fresh 1102 - - -
Little Rush Lake Permanent 11.2 Fresh 1049 - - -
Roe Swamp Seasonal 12 Fresh 1400 - - -
Kogolup Lake Permanent 72.4 Fresh 1200 - - -
Booragoon Lake Permanent 13 Fresh 3200 Major X
South Lake Permanent 31.5 Fresh 1340 - - -
North Lake Permanent 24.6 Fresh 2000 Major X
Lake Coogee Permanent 62.9 Brackish 3889 Major X
Lake Monger Permanent 70 Fresh 4500 Major X
Yangebup Lake Permanent 90 Fresh 3100 Major X
Bibra Lake Permanent 188.7 Fresh 6670 Major X
Thomsons Lake Seasonal 236.5 Fresh 5552 Minor
Lake Joondalup Permanent 450 Fresh 12000 Major X -
Fawcett Road Wetland
- 4.4 Fresh - - - -
Horse Paddock Swamp
Seasonal 3.2 Fresh - - - -
Assessment of the Effect of Traffic Noise on Wetland Birds Background study for the Roe Highway Extension Project
South Metro Connect Final Report
Phoenix Environmental Sciences Pty Ltd 5
3 METHODOLGY
3.1 DESKTOP REVIEW
Extensive bibliographical searches were conducted in order to gather the information published on the impact of traffic noise on birds. Local, national and international studies have been considered as well as publications documenting the general impact of roads on birds, not specifically related to the effects of noise.
3.2 DATA COLLECTION
3.2.1 Historical bird counts
Numerous bird surveys have been conducted within the Beeliar Wetlands since the early 1980s. The majority of data from the most recent surveys, and the data and interpretations principally used in this study, have been provided by Western Wildlife (2010). Additional data was sourced from:
Previous projects conducted by the Royal Australian Ornithologists Union (RAOU, currently Birds Australia) and Conservation and Land Management (CALM, currently DEC);
Various reports with species lists and/or more detailed counts especially for the period 1990 to 2009;
The Western Australian Wetlands Database (DEC, 2010) (northern lakes only); and
The Bird Australia Birdata database (northern lakes only).
3.2.2 Traffic volume
The principal traffic parameter used was the Annual Average Weekday Traffic Flows (AAWTF; Main Roads Western Australia, 2009). Traffic volumes for roads and freeways adjacent to the sampled wetlands were provided by Main Roads Western Australia. Only the most trafficked roads located less than 1km away from wetland shorelines were investigated.
Data were available from 1998 onwards and provided two to four days of measurements for each road. The unit of measurement was AAWTF based on 24 hour traffic volumes for each road.
For each sampled wetland, the AAWTF of all investigated roads was pooled to obtain an average number of vehicles per day. A traffic volume/distance ratio (TVDR) was calculated based on the AAWTF in relation with the smallest distance between each investigated road and the corresponding wetland shoreline. In other words, the TVDR describes the relationship between the number of vehicles per day and the road-to-wetland distance.
3.3 NOISE MEASUREMENTS
Noise measurements were recorded on 11 August 2010 at all 16 wetlands of the study area and northern lakes. At each wetland, the noise level or volume ( dB(A)) and the noise frequency range (hertz) were measured at two different locations for a ten minute period using sound level meters (Rion NA-28 and Svan 949). Predominant background noise types were also noted. The noise recording locations were selected on the basis of nearest proximity to the most heavily-trafficked local road.
3.4 LIMITATIONS
3.4.1 Reliability of previous bird count data
To date, the most recent bird counts that have been conducted regularly and using a reliable protocol are those provided by Western Wildlife (2010), Bamford et al (2009) and DEC (1981 to 1992). Other data collected during the desktop review must be considered more carefully. They only include minimum bird numbers and therefore cannot be considered as comprehensive datasets. The DEC data from 1988 to 1992 is species-limited, in that it only includes waterfowl and Eurasian Coot numbers.
Assessment of the Effect of Traffic Noise on Wetland Birds Background study for the Roe Highway Extension Project
South Metro Connect Final Report
Phoenix Environmental Sciences Pty Ltd 6
3.4.2 Timing and seasonality
Ambient noise measurements were conducted in early August 2010 and therefore the data does not capture daily or seasonal variability. Noise levels may vary greatly depending on the time of year. The wetland bird populations of the study area and northern lakes are also subject to fluctuations throughout the year depending on factors such as rainfall, phenology, population trends, human activities or water levels (Section 4.4.1).
3.4.3 Study length
A long term study is essential to accurately assess the effects of traffic noise on wetland bird within the study area. The current study can only capture a snapshot of waterbird populations of the study area with respect to the ambient noise experienced.
3.4.4 Abiotic factors
Numerous environmental variables influence bird numbers and diversity (Newton 2003) (see Section 4.4.1) and the combined influence of these factors is likely to be greater than the effect of noise. Such confounding factors need consideration when interpreting the role of traffic noise in changes to local bird community abundance, diversity, behavior and biology. However, these factors have not been assessed in the current study. Habitat assessment requires extensive work in order to provide adequate results; such an effort was not adapted to the scale of the current study and was not included in the scope of work.
3.4.5 Traffic volume
Traffic volumes were not available for every road within the study area. Traffic volumes have been measured since 1998 for some sections, while other roads have only been measured more recently. Changes in traffic volume over time may not be completely represented in the previous datasets.
3.4.6 Validity of comparisons
Much less waterbird data is available for the northern lakes than for the Beeliar Wetlands, for the past decade (1999 to 2010). Consequently, the greater Beeliar Wetlands dataset is likely to include greater numbers of species and conservation significant species records. To balance this data gap for the 1999 to 2010 timeframe, additional data for the northern lakes was acquired from the Bird Australia database.

Assessment of the Effect of Traffic Noise on Wetland Birds Background study for the Roe Highway Extension Project
South Metro Connect Final Report
Phoenix Environmental Sciences Pty Ltd 7
4 RESULTS
4.1 LITERATURE REVIEW: IMPACT OF TRAFFIC NOISE ON BIRDS, AND IMPLICATIONS
WITHIN THE STUDY AREA
The literature review considered previous reviews, often updated to include the most recent publications. Very few empirical studies concerning the impact of roads and traffic noise on bird populations were available, especially when only noise interferences are considered. Only about 10 percent of the publications documenting the impact of traffic roads on wild animals specifically considered the effects on bird populations, and only 17 percent of those were conducted in Australia (Taylor and Goldingay 2010).
4.1.1 Noise and the bird’s ear
Birds produce a large variety of communication sounds including warning, territory and advertisement calls (Warren et al (2006)). Another important function of bird hearing is to learn about their surrounding environment, a process referred to as sampling of the „acoustic scene‟ (Bregman 1991). Awareness of the acoustic scene allows birds to learn more about their environment than from visual inspection alone. The bird ear consists of an external tympanic membrane, a middle ear, and an inner ear (Dooling et al 2000). Similar to most vertebrates, the inner ear has three semicircular canals and three otolith organs that play a function in determining balance and motion of the head. In addition, birds have a cochlear duct containing a basilar papilla upon which the sensory hair cells used for hearing sit. The sensory hair cells convert acoustic energy into energy compatible with the nervous system. While mammals typically have a three-bone middle ear structure, the birds have a single-bone middle ear.
These structural differences have a large influence on hearing capabilities. Birds generally detect a narrower range of frequencies than mammals (Dooling and Popper 2007), which is most likely the result of the basilar papilla being shorter and different in structure. The single bone in the avian middle ear generally limits high frequency hearing to approximately 10 kHz (Dooling et al 2000). The ability of birds to hear at both low and high frequencies is also reduced in comparison to most mammals due to a much shorter surface of sensory hair cells within the cochlea.
4.1.2 Absolute threshold of hearing
The hearing sensitivity of birds generally varies with frequency (Dooling et al 2000). Audiograms are therefore used to represent the sensitivity to sounds of different frequencies. An audiogram of a bird species relates the absolute threshold of hearing frequency for a quiet environment, and shows the frequency bandwidth over which a species can hear. A bird species is most sensitive to sounds at frequencies where its absolute hearing threshold is lowest.
The median audiogram for bird species based on 39 behavioural audiograms and ten physiological audiograms recorded over the past 50 years was compared with the human audiogram (Figure 4-1) (Dooling et al 2000). Bird hearing is typically most sensitive at frequencies between 1 and 5 kHz. This frequency range overlaps with the spectrum of bird vocalisations, indicating that birds usually hear best in the range of their species-specific vocalisations (with the exception of some nocturnal predators). Absolute hearing thresholds approach 0 to 10dB, within the most sensitive frequency region being between 2 and 4 kHz. The low frequency cut-off of hearing is about 300 Hz while the high frequency cut-off is about 6 kHz. The bandwidth available to birds for vocal communication spans approximately 5.7 kHz on average. In contrast, humans hear sounds as low as 0dB at around 3 kHz and have a much larger bandwidth of about 16 kHz.
Although hearing sensitivity varies among bird species, the variation is not great in comparison to other vertebrate groups (Dooling and Popper 2007). Generally, large birds hear better at low frequencies and small birds better at high frequencies. Nocturnal predators, such as most owls, generally have much lower thresholds than passeriformes (songbirds) such as sparrows, canaries, starlings, or other non-passeriformes, such as chickens, turkeys, pigeons, parrots, and owls, over their entire range of hearing (Dooling et al 2000). Passeriformes tend to have better hearing at high frequencies than non-passeriformes, while non-passeriformes can detect lower sound levels at low frequencies than passeriformes, with differences usually in the order of 5 to 10dB.

Assessment of the Effect of Traffic Noise on Wetland Birds Background study for the Roe Highway Extension Project
South Metro Connect Final Report
Phoenix Environmental Sciences Pty Ltd 8
Figure 4-1 Median bird audiogram based on 49 bird species, compared to the human audiogram (Dooling and Popper 2007).
4.1.3 Effects of noise on bird hearing
Potential effects of man-made noise on birds include hearing damage; permanent and temporary threshold shifts (PTS and TTS); masking of vocal communication and other biologically important sounds; and other physiological and behavioral responses. The general effects of noise on birds and the typical on-set noise levels for the different impacts are discussed below.
4.1.3.1 Permanent and temporary threshold shifts
When the avian auditory system is exposed to a high level of sound for a specific duration, the sensory hair cells begin to fatigue and do not immediately return to their normal shape (NRC, 2005). This causes a reduction in the bird‟s hearing sensitivity, or an increase in hearing threshold. If the noise exposure is below some critical energy level determined by duration and noise level, the hair cells will eventually return to their normal shape. This effect is called a temporary threshold shift (TTS) as the hearing loss is temporary. If the noise exposure exceeds the critical energy level, the hair cells become permanently damaged and the effect is called permanent threshold shift (PTS).
A number of studies have been conducted into threshold shifts due to acoustic over-stimulation of the avian ear (e.g. Saunders et al 1991, 1993; Niemec et al 1994). These studies indicate that the bird ear is capable of regenerating damaged hair cells after acoustic trauma, although considerable variation exists among species in the severity of the damage and the recovery time (Ryals et al 1999). The ability of the avian ear to regenerate damaged hair cells from noise over-exposure suggests that PTS from traffic noise is most likely not a significant concern for the majority of bird species.
Dooling and Popper (2007) conducted a review of the available studies on noise-induced hearing damage in birds. The review concluded that continuous noise levels between 93 and 110 dB(A) may cause TTS, with higher levels possibly resulting in PTS. For impulsive noise, such as piling or blasting noise, levels above 140 dB(A) for single pulses or 125 dB(A) for multiple pulses were estimated to cause hearing damage.
Traffic noise levels adjacent highways do not normally exceed the exposure criteria for noise-induced hearing damage in birds. As such, hearing damage is only a potential impact during the construction phase of a road project.
4.1.3.2 Auditory masking
Masking of a bird‟s communication signal occurs when the signal level received by another bird is below, or masked by, the ambient noise environment. The ambient noise environment effectively increases the threshold of detection of a communication signal above the absolute threshold of hearing. This limits the

Assessment of the Effect of Traffic Noise on Wetland Birds Background study for the Roe Highway Extension Project
South Metro Connect Final Report
Phoenix Environmental Sciences Pty Ltd 9
distance over which communication can take place. Masking caused by traffic noise may therefore potentially impact bird communication and behaviour. A simple measure of the ability of the bird ear to detect a sound amongst background noise is the critical ratio.
The critical ratio is determined by measuring the detection threshold of a pure tone in the presence of broadband ambient noise, and typically varies with frequency (Dooling et al 2000). A higher critical ratio means that the pure tone has to be of a higher level above the background noise to be detected. Species with a high critical ratio are therefore more susceptible to auditory masking than species with a low critical ratio. Critical ratios have been measured for fourteen bird species, including songbirds, non-songbirds, and nocturnal predators (Dooling et al 2000). The median critical ratio curve for these species has been compared with the median critical ratio of humans (Figure 4-2). The critical ratio for the typical bird is about 6dB greater than in humans in the bird communication range of 1 to 5 kHz (Dooling and Popper 2007).
Figure 4-2 The median critical ratio for the typical bird based on data for 14 bird species, compared to humans.
At a frequency of around 3 kHz, a bird communication signal needs to be about 27dB higher than the spectrum level of the background noise to be detectable by another (typical) bird. For humans, the level of the pure tone must be about 21dB higher to be detectable at this frequency. As a simple rule-of-thumb, the critical ratio in birds is about 6dB higher than in humans in the vocalization range of birds. This fact has both positive and negative implications:
Positive implication – humans hear noise from a heavily trafficked road at distances four times greater that birds. This is because noise from busy roads generally decreases by 3dB as distance doubles.
Negative implication – the distance over which communication between two birds can occur is halved in comparison to humans. Using a human listener to determine whether birds can hear a sound amongst background noise will therefore underestimate the masking effect of noise on bird communication.
Ambient noise in the frequency region of the pure tone has the greatest contribution to the masking of that tone, compared to noise at much lower or higher frequencies (Dooling et al 2007). This means that background noise in the vocalization range of birds between 2 and 8 kHz will have the most signification effect on the masking of bird communication signals. This is an important observation when assessing the masking effect of traffic noise, because traffic noise tends to have most energy at frequencies below the critical bird communication range.

Assessment of the Effect of Traffic Noise on Wetland Birds Background study for the Roe Highway Extension Project
South Metro Connect Final Report
Phoenix Environmental Sciences Pty Ltd 10
4.1.3.3 Adaptations in response to masking
Birds can mitigate the masking effect of high ambient noise by changing the amplitude or frequency of their vocalizations (Slabbekoorn and Ripmeester 2008), or locating themselves optimally with regards to the noise source, as follows:
Amplitude increase: humans increase their vocal level when there is an increase in background noise, to mitigate masking. This helps to ensure that the speaker is understood by the targeted listener amongst the background environment. Laboratory studies have shown that this adaptation also occurs in certain bird species (Pytte et al 2003; Cynx et al 1998; Manabe et al 1998; Brumm 2004; Brumm et al 2009).
Frequency shift: man-made noise usually has most energy at frequencies below 2 kHz. Birds can therefore opt to vocalize at higher frequencies to avoid masking of communication signals by high level man-made noise. A number of studies have found that birds at noisy city locations sing at a higher pitch than those at quieter locations (Slabbekoorn and Peet 2003; Nemeth and Brumm 2009).
Locating optimally: the masking effect of background noise may be less significant when the noise source can be spatially separated from the signal source. Masked thresholds can improve by as much as 10–15dB for certain bird species when the noise and signal source are separated by 90 degrees (Dent et al 1997). This suggests that the distance over which two birds can communicate quadruples if they position themselves optimally with regards to the noise source.
An Australian study by Parris and Schneider (2009) investigated the impact of traffic noise and volume on the Grey Shrike-thrush (Colluricincla harmonica) and the Grey Fantail (Rhipidura albiscapa), at 58 roadside sites on the Mornington Peninsula, Victoria. In the presence of traffic noise, the lower-singing Grey Shrike-thrush sang at a higher frequency while the Grey Fantail did not appear to change its song characteristics. This suggests that masking may have a more significant effect on species that use lower frequency vocalizations.
4.1.4 The masking effect of traffic noise
A conceptual model for predicting the masking effect of traffic noise on bird species was proposed by Dooling and Popper (2007). The conceptual model (Figure 4-3) provides a way to assess whether a given level of traffic noise will have an effect on the distance over which two birds can communicate. Behavioral impacts may occur if this distance is smaller than the bird‟s territory size or its communication distance in the existing ambient noise.
Figure 4-3 Conceptual model for predicting the masking effect of traffic noise (Dooling and Popper 2007).

Assessment of the Effect of Traffic Noise on Wetland Birds Background study for the Roe Highway Extension Project
South Metro Connect Final Report
Phoenix Environmental Sciences Pty Ltd 11
The shaded areas of the conceptual masking effect model (Figure 4-3) are defined as follows:
Light grey area: the white-dashed line within the light grey area shows the relationship between the traffic noise level and the maximum communication distance for typical birds with a critical ratio of 27dB. The dotted line (B) indicates that for a 20dB/ Hz spectrum level (~70 dB(A) overall level), the maximum communication distance between two birds is approximately 225 metres. For birds with a much higher critical ratio, the maximum communication distance decreases to 175 metres for the same noise level (A). Bird species with a much smaller critical ratio have a predicted maximum communication distance of 325 metres for the same noise level (C);
Dark grey area: short-term adaptations in response to masking may temporarily increase the maximum distance over which two birds can communicate. The dark-grey region is labeled as difficult because, although communication is possible, the short-term adaptations may be accompanied by an increase in effort for signaling (Warren et al 2006); and
Black area: communication becomes impossible due to high ambient noise levels or greater distance between the birds.
The above discussion indicates that for a given noise spectrum level, the maximum communication distance between two birds could vary from 50 to 150m, depending on the species‟ hearing acuity and short-term adaptations to overcome masking. Similarly, for a given communication distance, the noise spectrum level that starts to interfere with bird communication may vary by about 10dB, depending on the critical ratio of the species. For a given noise situation, masking effects may vary between species.
It is important to note that masking of communication signals already occurs in most natural noise environments, even in ambient noise environments typically found in suburban and rural areas that are not exposed to a large amount of traffic. Traffic noise will only cause additional masking of communication if the spectrum level of the traffic noise exceeds that of the ambient noise in the critical bird communication range of 2 to 8 kHz. The masking effect of traffic noise therefore depends on the pre-existing level of ambient noise. Typical ambient noise environments range from 25 to 35 dB(A) in quiet rural areas, to 40 to 45 dB(A) in quiet suburban areas.
In summary, the masking effect of traffic noise depends on a large number of variables, including the hearing ability of the species, the frequency content and amplitude of their vocalizations, their territory size, the transmission loss to the environment, and the level of the existing ambient noise. However, Dooling et al (2007) concluded that, given an existing ambient noise environment of 50 to 55 dB(A), traffic noise levels of 55 to 60 dB(A) can reasonably be assumed to begin to interfere with acoustic communication. These levels may be scaled according to the existing ambient noise environment.
4.1.5 Noise impacts on bird distribution and reproductive success
A number of studies have investigated the effect of man-made noise on bird distributions and reproductive success. Most of this research has focused on road traffic noise, although wind turbine noise has also been considered (Leddy et al 1999). The studies indicate that when in close proximity to roads, many bird species occur in lower densities, bird diversity is often lower, and breeding success appears to be negatively affected. A summary of these studies is presented below (Warren et al 2006):
Bird densities are lower beyond the view of the roads. A series of papers considered the effects of traffic noise on breeding bird populations in grasslands in the Netherlands (Reijnen and Foppen 1994, 1995; 1997; Reijnen et al 1995, 1996). When controlling for visibility of cars, bird densities were significantly lower for more species at sites with higher noise levels, but no differences were found when controlling for noise levels and varying car visibility. This suggests that noise is probably the most important cause of reduced densities near the road, not visibility of cars, direct mortality or pollution (Reijnen et al 1995).
Bird diversity is lower in noisier sites, independent of land use type. Stone (2002) investigated the correlation between bird diversity and noise levels over a range of land use types, including agricultural, residential, industrial, and grassland sites. Lower diversity levels were consistently found at noisier sites independent of land use type, which suggests that bird diversity is affected by man-made noise. However, habitat features such as more impervious ground surface and lower
Assessment of the Effect of Traffic Noise on Wetland Birds Background study for the Roe Highway Extension Project
South Metro Connect Final Report
Phoenix Environmental Sciences Pty Ltd 12
vegetative cover, which may be correlated with noise levels and are known to predict bird diversity in developed areas, were not considered in the study (Warren et al 2006).
Birds are observed to forage but not breed near roads. Forman et al (2002) evaluated the effects of roads with different traffic volumes on surrounding grassland bird distributions. Variables that were considered in the study included distance from the road, open-habitat patch size, area of quality microhabitat within a patch, adjacent land use, and distance to other open habitats. The results indicated that insufficient habitat to support feeding of offspring, or avoidance of the stressful effects of traffic, are unlikely causes for the observed reduction in bird breeding near the road. Observations of birds foraging near roads, but not breeding there, led the authors to suggest that parents simply move away from the road to prevent masking of low-amplitude calls that are often used by birds to communicate near nests and with offspring. The study did not consider that birds may be more tolerant to noise while foraging than while breeding (Warren et al 2006).
Birds with higher-frequency songs are more abundant near roads. Rheindt (2003) evaluated species richness and diversity at different distances from a highly-trafficked road. Species abundance, richness and diversity decreased closer to the road. However, no effects were found in a few species that use high-pitched vocalizations with frequencies well above those of traffic noise. This suggests that species with higher frequency vocalizations may be less susceptible to masking than species with lower frequency vocalizations, and that traffic noise may directly affect animal distributions via impairment of their ability to communicate (masking).
The Australian study by Parris and Schneider (2009) indicated that both species that were studied were more likely to be detected at sites with a quieter roadside habitat, although the effect was more pronounced for the Grey Shrike-thrush which has a lower frequency vocalization than the Grey Fantail. Although traffic noise may have directly caused the reduced abundance, the authors acknowledged that visual disturbance from passing cars, increased mortality due to higher traffic volume, and reduced probability of detection due to higher traffic noise level, may provide alternative explanations requiring further research (Paris and Schneider 2009).
Several authors have argued that reproductive success is directly affected by masking of communication signals that are assumed to be important during breeding. This argument was questioned by Warren et al (2006), who suggested that the available evidence is often indirect because other variables that may have an impact are often not controlled in the studies. These other variables may include visual stimuli, air pollution from cars and trucks, differences or changes in the environment near the road, and inter-species differences in hearing, communication style, and behaviour in response to adverse stimuli (Dooling and Popper 2007).

Assessment of the Effect of Traffic Noise on Wetland Birds Background study for the Roe Highway Extension Project
South Metro Connect Final Report
Phoenix Environmental Sciences Pty Ltd 13
4.1.6 Summary and implications for the Project
The different zones of impact of the operational phase of the proposed project were defined and described to provide context for other results (Table 4-1). The relationship between the potential effects of traffic noise, the level of the traffic noise, and the distance from the transport corridor (adopted from Dooling and Popper 2007) has been conceptually summarized (Figure 4-4).
Table 4-1 Description of the impact zones (as presented in Figure 4-4) for the proposed project.
Zone Description
1
Closest to the road, where traffic noise spectrum levels are higher than the ambient noise spectrum levels at frequencies critical for bird communication (2 to 8 kHz), traffic noise may increase masking of communication signals beyond that which already occurs from natural ambient noise.
2
Once traffic noise levels fall below the natural ambient noise environment at the critical communication frequencies for birds, masking of communication and other biologically important sounds is no longer an issue. Faintly heard sounds falling outside the frequency region of bird vocalisations, such as the low frequency noise from a truck, may still cause behavioural and/or physiological effects.
3 At this boundary, traffic noise levels are below the bird‟s masked threshold at all frequencies, such that the noise is inaudible above the ambient noise environment. The noise therefore has no effect on birds beyond zone 4.
Figure 4-4 Relationship between traffic noise levels, distance from transport corridor, and potential impact on birds. Potential impacts are most significant in zone 1 closest to the transport corridor (Dooling and Popper 2007).
Assessment of the Effect of Traffic Noise on Wetland Birds Background study for the Roe Highway Extension Project
South Metro Connect Final Report
Phoenix Environmental Sciences Pty Ltd 14
4.2 WETLAND BIRDS OF THE STUDY AREA
A total of 177 species of birds have been recorded within the study area, according to recent databases (12), bird surveys and previous reports (Phoenix Environmental Sciences, 2010). However, inclusion of historical data relevant to the study area increases the total number of species to 199, of which 98 can be considered to be wetland birds according to the criteria used by Western Wildlife (2010). Of these, 96 have been recorded at the Beeliar Wetlands and 66 at the northern lakes.
Since the purpose of this study was to provide a sound overview of the wetland bird communities of the study area, general abundance and distribution data were used rather than a detailed investigation of every single species. The groups found in the study area are listed below with a brief description of their biology. Most of them correspond to a taxonomic family classification (Christidis and Boles 2008), except for the birds of prey and the passeriformes:
Ducks and swans (16 species): also known as the Anatidae family, ducks and swans are among the most widespread and common wetland birds of the Swan coastal plain (Johnstone and Storr 1998). Most species have been recorded breeding in south-western Australia. Some species feed by plunge diving and consequently depend on water levels while others are surface feeders. Some ducks breed in tree hollows but most species nest in the surrounding riparian vegetation of wetlands.
Grebes (3 species): the Hoary-headed Grebe (Poliocephalus poliocephalus) is the most common. Grebes exclusively plunge to feed and nest in peripheral densely inundated vegetation.
Darters (1 species): darters are similar to cormorants in terms of morphology, feeding and breeding behaviour. They have an atrophied uropygial gland and a particular feather microstructure; they consequently need to dry their plumage after every feeding session. Darters nest in trees, usually in the proximity of cormorants.
Cormorants (4 species): like grebes, cormorants feed by plunge diving. However they are more adapted to coastal and marine environment than to freshwater and inland lakes. They usually breed in colonies and build their nests in trees;
Pelican (1 species): Pelicans usually occur in small groups and feed on fish when water levels are suitable; none breed in the study area.
Bitterns, egrets and herons (11 species): Also known as Ardeidae, they forage in shallow waters and mostly prey on fish and crustaceans (Johnstone and Storr, 1998). Some species breed in colonies and nest in trees (Cattle Egrets (Ardea ibis)) but some are more territorial and require large reed beds with a suitable inundation pattern throughout the year (Black and Australasian Bitterns (Ixobrychus flavicollis and I. dubius)). For these species as well as for the Nankeen night-Heron (Nycticorax caledonicus) and the Australian Little Bittern, breeding is usually hard to prove because of their discrete nesting behaviors. Therefore it is not very clear which species nest regularly within the study area;
Ibis and spoonbills (5 species): one species is rarely seen within the study area (Royal Spoonbill (Platalea regia)) while the others are fairly common, with the most numerous being the Australian White Ibis (Threskiornis molucca). All these species nest in trees and like the Ardeidae, forage in shallow waters;
Birds of prey (4 species): birds of prey do not entirely depend on wetlands to breed and feed but some species feed predominantly on wetland birds (e.g. the Swamp Harrier (Circus approximans)) or fish (Eastern Osprey (Pandion cristatus), White-bellied Sea Eagle (Haliaeetus leucogaster). The Whistling Kite (Haliastur sphenurus) is the only species that can be considered as an opportunistic ubiquitous species. They nest in trees or in tall reed beds (Swamp Harrier). No evidence of regular breeding of birds of prey has been found in the past two decades within the study area;
Coots, crakes and rails (8 species): except for the Eurasian Coots (Fulica atra) and the Purple Swamphen (Porphyrio phorphyrio), most Rallidae are secretive species that feed and nest in dense and high swampy vegetation. Nesting evidences are consequently hardly found. Most Rallidae species breed in the study area;

Assessment of the Effect of Traffic Noise on Wetland Birds Background study for the Roe Highway Extension Project
South Metro Connect Final Report
Phoenix Environmental Sciences Pty Ltd 15
Stilts and avocets (3 species): depending on the wetland conditions large flocks can occur (up to 2000 individuals). They forage in open shallow water and strongly depend on water levels. Invasive vegetation cover can also limit their access to food resources. Only the Black-winged Stilt (Himantopus himantopus) may potentially breed within the study area;
Plovers and dotterels (10 species): belong to the shorebird group but unlike Scolopacidae, some species breed in Australia;
Other shorebirds (23 species): all the shorebirds are migratory species and they consequently occur in the study area during the southern hemisphere summer (December to March) with some individuals staying longer. They feed on wetland shorelines. Depending on the water levels some species can occur in large flocks but most of them congregate in small groups. Shorebirds usually prefer coastal habitats rather than inland freshwater lakes or ponds;
Gulls and terns (7 species): within the study area only two species of Laridae occur regularly in freshwater habitats (Silver Gull (Chroicocephalus novaehollandiae), White-winged Black Tern (Chlidonias leucopterus). The other species are coastal. None breed within the study area;
Passeriformes (2 species): two species of passerine birds regularly breed in the study area (Little Grassbird (Megalurus gramineus) and Australian Reed Warbler (Acrocephalus australis)). They mainly nest in reed beds, sedges or tall wetland vegetation.
Of these, 19 species are vagrants or rare visitors to the study area (species in orange, Table 4-2). They can occur outside of their normal distribution range for several reasons (atmospheric conditions, lack of available habitat) and are generally in poor physiologic conditions.
4.2.1 Species of conservation significance
The conservation significance criteria are briefly summarized below. More detail is provided by Western Wildlife (2010). They are structured according to three different scales of importance:
Conservation significance 1 (CS1): listed under the Part 3 of the Environment Protection and Biodiversity Conservation Act (EPBC); species listed under the categories Extinct, Extinct in the wild, Critically Endangered, Endangered, Vulnerable and Conservation Dependent under the International Union for the Conservation of Nature (IUCN) criteria, the Action Plan for Australian Birds (Garnett and Crowley, 2000) and the Schedules 1, 2, 3, and 4 of the Western Australian Wildlife Conservation Act 1950 (WA WC Act)(State of Western Australia, 2008).
Conservation significance 2 (CS2): the species listed as priority species by the Department of Environment and Conservation (DEC). 5 priority ranks are considered.
Conservation significance 3 (CS3): are considered CS3 the species listed under the “significant” criterion of the Bush Forever project (Government of Western Australia, 2000).
According to these three criteria, 53 species of wetland birds are of conservation significance in the study area. Of these, 16 are vagrants and are of limited local significance. Due to their international migratory status, shorebirds are the best represented group with 29 species (11 vagrants). Ardeidae and Anatidae are the second most represented groups with seven species each, including one and two vagrant species, respectively.

Assessment of the Effect of Traffic Noise on Wetland Birds Background study for the Roe Highway Extension Project
South Metro Connect Final Report
Phoenix Environmental Sciences Pty Ltd 16
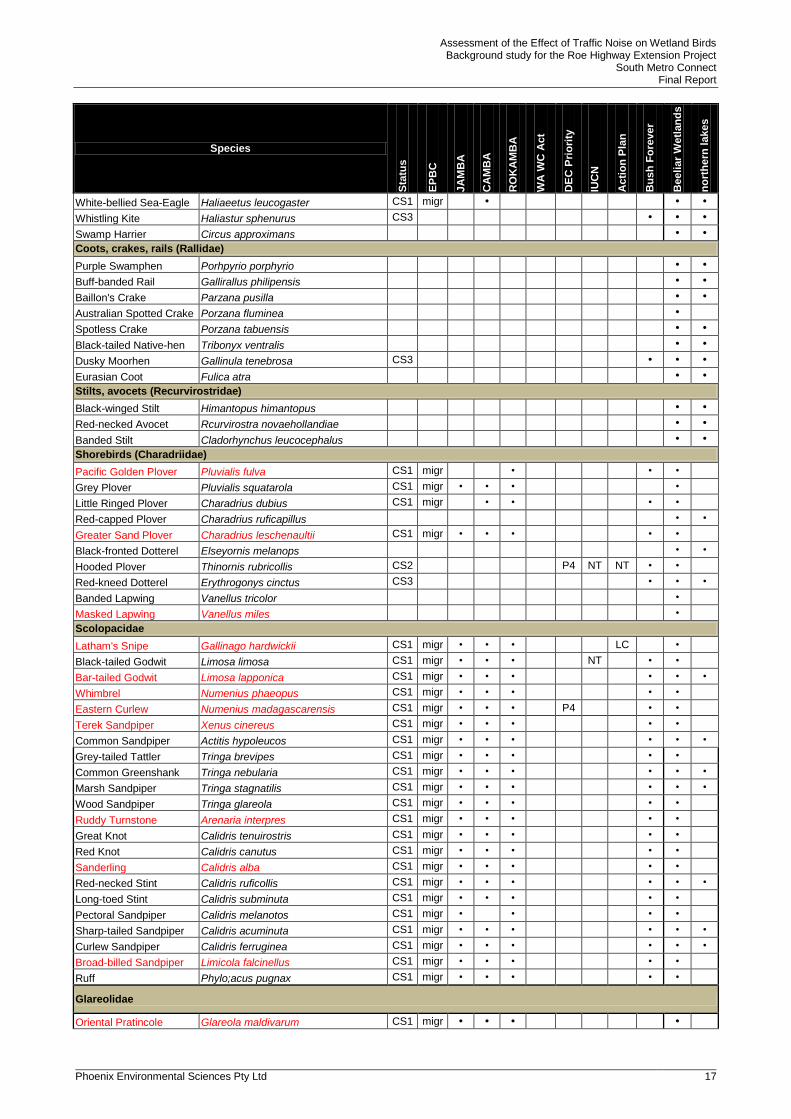
Table 4-2 The conservation significant wetland birds of the study area.
Please note: species of rare occurrence in red.
Species
Sta
tus
EP
BC
JA
MB
A
CA
MB
A
RO
KA
MB
A
WA
WC
Act
DE
C P
rio
rity
IUC
N
Acti
on
Pla
n
Bu
sh
Fo
rever
Beeli
ar
Wetl
an
ds
no
rth
ern
lakes
Ducks and swans (Anatidae)
Musk Duck Biziura lobata CS3 • • •
Freckled Duck Stictonetta naevosa CS3 • LC • • •
Black Swan Cygnus atratus • •
Australian Shelduck Tadorna tadornoides • •
Radjah Shelduck Tadorna radjah CS3 LC •
Australian Wood Duck Chenonetta jubata • •
Pink-eared Duck Malacorhynchus membranaceus CS3 • • •
Australasian Shoveler Anas rhynchotis CS3 • • •
Grey Teal Anas gracillis • •
Chestnut Teal Anas castanea • •
Northern Mallard Anas platyrhynchos • •
Pacific Black Duck Anas superciliosa • •
Hardhead Aythya australis CS3 • • •
Blue-billed Duck Oxyura australis CS3 NT LC • • •
Muscovy Duck Cairina moschata • •
Domestic Goose Anser sp. • •
Grebes (Podicipedidae)
Australasian Grebe Tachybaptus novaehollandiae • •
Hoary-headed Grebe Poliocephalus poliocephalus • •
Great Crested Grebe Podiceps cristatus • •
Darters (Anhingidae)
Australasian Darter Anhinga novaehollandiae CS1 • • • • • •
Cormorants (Anhingidae)
Little Pied Cormorant Microcarbo melanoleucos • •
Great Cormorant Phalacrocorax carbo • •
Little Black Cormorant Phalacrocorax sulcirostris • •
Pied Cormorant Phalacrocorax varius • •
Pelicans (Pelecanidae)
Australian Pelican Pelecanus consipicilatus • •
Bitterns, egrets, herons (Ardeidae)
Australasian Bittern Botaurus poiciloptilus CS1 SC1 VU VU • •
Australian Little Bittern Ixobrychus dubius CS2 P4 NT • • •
Black Bittern Ixobrychus flavicollis CS2 P4 LC • •
White-necked Heron Ardea pacifica • •
Eastern Great Egret Ardea modesta CS1 migr • • • •
Intermediate Egret Egretta intermedia •
Cattle Egret Ardea ibis CS1 migr • • • •
Little Egret Egretta garzetta • •
White-faced Heron Egretta novaehollandiae • •
Eastern Reef Egret Egretta sacra CS1 migr • •
Nankeen Night-Heron Nyticorax caledonius CS3 • • •
Ibis, spoonbills (Theskiornithidae)
Glossy Ibis Plegadis falcinellus CS1 migr • • •
Australian White Ibis Threskiornis molucca • •
Straw-necked Ibis Threskiornis spinicollis • •
Royal Spoonbill Platalea regia •
Yellow-billed Spoonbill Platalea flavipes • •
Birds of prey (Accipitridae)
Eastern Osprey Pandion cristatus CS1 migr • •
Assessment of the Effect of Traffic Noise on Wetland Birds Background study for the Roe Highway Extension Project
South Metro Connect Final Report
Phoenix Environmental Sciences Pty Ltd 17
Species
Sta
tus
EP
BC
JA
MB
A
CA
MB
A
RO
KA
MB
A
WA
WC
Act
DE
C P
rio
rity
IUC
N
Acti
on
Pla
n
Bu
sh
Fo
rever
Beeli
ar
Wetl
an
ds
no
rth
ern
lakes
White-bellied Sea-Eagle Haliaeetus leucogaster CS1 migr • • •
Whistling Kite Haliastur sphenurus CS3 • • •
Swamp Harrier Circus approximans • •
Coots, crakes, rails (Rallidae)
Purple Swamphen Porhpyrio porphyrio • •
Buff-banded Rail Gallirallus philipensis • •
Baillon's Crake Parzana pusilla • •
Australian Spotted Crake Porzana fluminea •
Spotless Crake Porzana tabuensis • •
Black-tailed Native-hen Tribonyx ventralis • •
Dusky Moorhen Gallinula tenebrosa CS3 • • •
Eurasian Coot Fulica atra • •
Stilts, avocets (Recurvirostridae)
Black-winged Stilt Himantopus himantopus • •
Red-necked Avocet Rcurvirostra novaehollandiae • •
Banded Stilt Cladorhynchus leucocephalus • •
Shorebirds (Charadriidae)
Pacific Golden Plover Pluvialis fulva CS1 migr • • •
Grey Plover Pluvialis squatarola CS1 migr • • • •
Little Ringed Plover Charadrius dubius CS1 migr • • • •
Red-capped Plover Charadrius ruficapillus • •
Greater Sand Plover Charadrius leschenaultii CS1 migr • • • • •
Black-fronted Dotterel Elseyornis melanops • •
Hooded Plover Thinornis rubricollis CS2 P4 NT NT • •
Red-kneed Dotterel Erythrogonys cinctus CS3 • • •
Banded Lapwing Vanellus tricolor •
Masked Lapwing Vanellus miles •
Scolopacidae
Latham's Snipe Gallinago hardwickii CS1 migr • • • LC •
Black-tailed Godwit Limosa limosa CS1 migr • • • NT • •
Bar-tailed Godwit Limosa lapponica CS1 migr • • • • • •
Whimbrel Numenius phaeopus CS1 migr • • • • •
Eastern Curlew Numenius madagascarensis CS1 migr • • • P4 • •
Terek Sandpiper Xenus cinereus CS1 migr • • • • •
Common Sandpiper Actitis hypoleucos CS1 migr • • • • • •
Grey-tailed Tattler Tringa brevipes CS1 migr • • • • •
Common Greenshank Tringa nebularia CS1 migr • • • • • •
Marsh Sandpiper Tringa stagnatilis CS1 migr • • • • • •
Wood Sandpiper Tringa glareola CS1 migr • • • • •
Ruddy Turnstone Arenaria interpres CS1 migr • • • • •
Great Knot Calidris tenuirostris CS1 migr • • • • •
Red Knot Calidris canutus CS1 migr • • • • •
Sanderling Calidris alba CS1 migr • • • • •
Red-necked Stint Calidris ruficollis CS1 migr • • • • • •
Long-toed Stint Calidris subminuta CS1 migr • • • • •
Pectoral Sandpiper Calidris melanotos CS1 migr • • • •
Sharp-tailed Sandpiper Calidris acuminuta CS1 migr • • • • • •
Curlew Sandpiper Calidris ferruginea CS1 migr • • • • • •
Broad-billed Sandpiper Limicola falcinellus CS1 migr • • • • •
Ruff Phylo;acus pugnax CS1 migr • • • • •
Glareolidae
Oriental Pratincole Glareola maldivarum CS1 migr • • • •

Assessment of the Effect of Traffic Noise on Wetland Birds Background study for the Roe Highway Extension Project
South Metro Connect Final Report
Phoenix Environmental Sciences Pty Ltd 18
Species
Sta
tus
EP
BC
JA
MB
A
CA
MB
A
RO
KA
MB
A
WA
WC
Act
DE
C P
rio
rity
IUC
N
Acti
on
Pla
n
Bu
sh
Fo
rever
Beeli
ar
Wetl
an
ds
no
rth
ern
lakes
Gulls, terns (Laridae)
Fairy Tern Sterna nereis CS2 VU LC •
Gull-billed Tern Gelochelidon nilotica •
Caspian Tern Hydroprogne caspia CS1 migr • • •
Whiskered Tern Chlidonias hybrida • •
White-winged Black Tern Chlidonias leucoptera CS1 migr • • • •
Common Tern Sterna hirundo CS1 • • • • •
Silver Gull Chroicocephalus novaehollandiae • •
Passeriformes (Acrocephalidae)
Australian Reed-Warbler Acrocephalus australis • •
Megaluridae
Little Grassbird Megalurus gramineus • •
CS1, CS2 and CS3 denotes conservation significance category; migr = migratory, NT = Near Threatened; VU = vulnerable, LC = Least Concern, P4 = Priority 4 species.
Please note: species of rare occurrence in red.

Assessment of the Effect of Traffic Noise on Wetland Birds Background study for the Roe Highway Extension Project
South Metro Connect Final Report
Phoenix Environmental Sciences Pty Ltd 19
4.3 WETLAND BIRD USAGE OF THE STUDY AREA
4.3.1 Factors influencing wetland bird populations and distribution
Abiotic factors influence the biology and life cycle of bird species, in both the short and long term. A limited number of studies document the relationship between wetland birds and their habitat in the Beeliar Wetlands and more widely, on the Swan Coastal Plain. These studies indicate that several factors affect waterbird numbers and their seasonal and inter-annual variation, but their importance in determining bird movements and numbers in the long term are poorly known (Kingsford and Norman 2002).
4.3.1.1 Rainfall and temperature
Climate plays an important role in the biology of most bird species (Newton 2008). Rainfall is the predominant variable that influences bird movement patterns in southwestern Australia. South-western Australia is governed by a Mediterranean climate regime and as such, air temperatures are greatest and rainfall lowest in summer months (December to February). Rapidly-declining water levels across the region in summer leave only a few wetlands inundated. Birds consequently congregate where resources are available (Halse and Jaensch 1989; Ford 1958), which may limit breeding opportunities.
After the wet season birds tends to leave their wintering grounds and spread across the southwest (and sometimes further) to start breeding. If rainfall is above average, more water bodies tend to be available and fewer individuals will remain on the permanent coastal wetlands. If rainfall is persistent, some inland wetlands may remain inundated for several years. In this case, bird movements may be limited in the medium-long term, with low numbers being recorded on the coastal wetlands (Bamford et al 2010). Depending on the species, movement following rainfall may be either rapid or follow a variable delay. Grey Teals (Anas gracilis) and Pink-eared Ducks (Malacorhynchus membranaceus) for example seem to respond very quickly to heavy rainfall, whereas Black Swans (Cygnus atratus), Australian Shelducks (Tadorna tadornoides) and Pacific Black Ducks (Anas superciliosa) appear to be more sensitive to a lower rainfall threshold (Halse and Jaensch 1986, Ford 1958; Roshier et al 2006).
The relationship between wetland birds and their habitat is still relatively poorly understood, especially the proximate cue that might explain how birds can react so quickly to rainfall and locate the newly inundated wetlands. Roshier et al (2006) assume that olfaction could explain bird movements following rainfall events, with birds smelling the increase in primary production that occurs after flooding.
Temperatures can influence arrival and departure dates of migratory or nomadic species. Chambers (2008) found that rainfall was the most influential factor on waterfowl seasonal timing in south-western Australia but for some species the temperature was the leading factor.
4.3.1.2 Coastal conditions
Shorebirds depend most strongly on the water levels during the staging period, as they feed on coastal or inland shorelines that need to be wet in order to access their food resources. As shorebirds feed on the coast, they are also sensitive to tidal patterns associated with the Leeuwin Current (Bamford et al 2010).
4.3.1.3 Wetland conditions
Size, salinity, depth and seasonality are some of the main factors that influence bird communities of the Swan Coastal Plain (Storey et al 1993). Seasonality is an essential element. During drought periods birds need refuges to feed. Salinity will impact bird communities that are likely to occur on a wetland, as well as the water column depth. Several duck species, but also cormorants and grebes for example feed by plunge diving and thus require reasonable depth to forage.
Vegetation cover plays an important role in terms of food availability but also as a breeding habitat. Some wetland birds nest in tree hollows (e.g. Australian Wood Ducks (Chenonetta jubata)), some on tree branches (cormorants) and some in halophyte vegetation (grebes) (Johnstone and Store 1998). Non-breeding birds are also affected by vegetation cover.
4.3.1.4 Population trends
Wetland bird populations can vary over long period of time depending on breeding success, recruitment and survival rates of fledglings and adults for example (Kingsford and Norman 2002). Two other factors are more

Assessment of the Effect of Traffic Noise on Wetland Birds Background study for the Roe Highway Extension Project
South Metro Connect Final Report
Phoenix Environmental Sciences Pty Ltd 20
likely to affect population demography: anthropogenic activities and the abiotic variables described previously.
Most shorebird species have seriously declined over the last 50 years because of habitat destruction (river damming, wetland destruction and alteration) or recreational activities (hunting, disturbance during migration or breeding, harvesting of benthic invertebrates) (Geering et al 2007; Burger et al 2004). In Eastern Australia between 1983 and 2006, migratory shorebirds declined by 73 percent and resident shorebirds by 81 percent (Nebel et al 2008) due primarily to anthropogenic influences.
4.3.2 Species richness within the study area and northern lakes
The species richness is defined as the total number of species that occur in a single area. For the Beeliar Wetlands, total species numbers are based on the data collected and analysed by Western Wildlife (2010) (Table 4-3).
Table 4-3 Wetlands ranked by species richness (northern lakes are highlighted).
Wetlands Species richness Area (ha)
Thomsons Lake 71 236.5 Bibra Lake 66 188.7 Lake Joondalup 64 550 Yangebup Lake 64 90 Kogolup Lake 56 72.4 North Lake 51 24.6 Lake Coogee 50 62.9 Lake Monger 49 70 Little Rush Lake 43 11.2 South Lake 40 31.5 Booragoon Lake 37 13 Market Garden Swamp
33 4.8 Manning Lake 32 14.9 Roe Swamp 23 12 Horse Paddock Swamp
23 3.2 Fawcett Road Wetland
13 4.4
A strong, positive correlation exists between wetland area (ha) and the species richness of birds (r = 0.64, n= 16) for the study area. This finding is in accordance with Storey et al (1993) and Davis et al (2001) who studied vertebrate and invertebrate communities of the SCP wetlands. Other parameters such as vegetation composition and structure, primary productivity and fish abundance are also involved in the composition of the waterbird communities, but none of these data have been specifically collected for this study.
A total of 96 waterbird species have been recorded within the study area (section 4.2). A total of 66 waterbird species have been recorded for the northern lakes.
4.3.2.1 Bird numbers within the study area
Bird numbers can be subject to significant variation throughout any year (Section 4.4.1). From 1981 to 2010 some species have declined, wetland conditions have changed and thus there have been consequences for bird numbers.
Four of the six wetlands that supported the largest numbers of species (species richness) also supported the largest abundance of birds. A moderate, positive correlation exists between wetland area (ha) and the abundance of birds (r = 0.55, n= 16) for the study area. This correlation was weaker than with respect to species richness and wetland area (Section 4.3.2).
However the situation has changed for some wetlands. The trend at Thomsons Lake is of particular concern; the maximum bird count was 22,196 individuals for the 1980 to 1990 decade, then 11,781 birds over the 1990 to 2000 period and 6,781 over the last decade (2000 to 2010).

Assessment of the Effect of Traffic Noise on Wetland Birds Background study for the Roe Highway Extension Project
South Metro Connect Final Report
Phoenix Environmental Sciences Pty Ltd 21
Shorebird numbers also record a notable decline. Horse Paddock Swamp seems to have followed the same pattern as Thomsons Lake, and significantly, has been completely dry for the last few years. Historical data were not available for every wetland, particularly for the smallest ones.
The results for bird numbers at the northern lakes contrasts with the pattern observed at the Beeliar Wetlands, where wetland size had little influence on bird numbers. This was especially the case at Booragoon Lake which recorded 5234 birds in 1988, of which 95 percent were Little Black Cormorants (Phalacrocorax sulcirostris). This wetland supports a large colony of several cormorant species, but the size of the colony has declined significantly over the last 20 years. The Great Cormorant (Phalacrocorax carbo) is almost absent, where there used to be up to 50 pairs. The Little Black Cormorant breeding population is currently 800 pairs, but used to be several thousands (Bennett Brook Environmental Services, 2004). In the meantime, the Australian White Ibis increased from none in the mid-20
th century to more than 1000
individuals today.
Despite being the largest water body of both the northern lakes group and the study area (550ha), Lake Joondalup recorded the third highest bird numbers. However, the site is known to support large numbers of Red-necked Avocets (e.g. 1200 individuals in 1985) and is consequently considered of international importance.
Table 4-4 Wetlands ranked by highest total counts (northern lakes are highlighted).
Wetlands Highest count Area (ha) Thomsons Lake 22,196 236.5 Bibra Lake 9,947 188.7 Lake Joondalup 6,563 550 Booragoon Lake 5,234 13 Yangebup Lake 4,976 90 Lake Monger 3,062 70 Kogolup Lake 1,732 72.4 North Lake 1,449 24.6 Lake Coogee 792 62.9 Horse Paddock Swamp
604 3.2 South Lake 430 31.5 Manning Lake 397 14.9 Little Rush Lake 300 11.2 Market Garden Swamp
163 4.8 Roe Swamp 156 12 Fawcett Road Wetland 99 4.4
4.3.2.2 Conservation significance
The conservation value of wetlands can be measured according to the CS1, CS2 and CS3 criteria. The use of these criteria provides a better understanding of the local, national or international conservation importance of each wetland in the study area and northern lakes group (Table 4-5).
The data shows that the largest wetlands (ha) supported the highest numbers of conservation significant species. Thomsons Lake confirms its international significance ranking, with the largest number of CS1 species. At the northern lakes, Lake Joondalup is the most important site in terms of conservation significant species. The low shorebird numbers recorded at the northern lakes partially explains the lesser significance of these sites in terms of conservation.
Table 4-5 Wetlands of the study area and northern lakes, ranked by Conservation Significant species (northern lakes are highlighted).
Wetlands Rank Total CS species
Number of each CS category
CS1 CS2 CS3
Thomsons Lake 1 31 20 2 9
Yangebup Lake 2 24 14 1 9
Lake Joondalup 3 24 12 2 10
Bibra Lake 4 23 13 1 9
Kogolup Lake 5 22 12 1 9
Lake Coogee 6 18 11 0 7

Assessment of the Effect of Traffic Noise on Wetland Birds Background study for the Roe Highway Extension Project
South Metro Connect Final Report
Phoenix Environmental Sciences Pty Ltd 22
Wetlands Rank Total CS species
Number of each CS category
CS1 CS2 CS3
North Lake 7 16 8 0 8
South Lake 8 15 5 0 10
Lake Monger 9 14 5 1 8
Little Rush Lake 10 12 5 0 7
Manning Lake 11 10 2 0 8
Booragoon Lake 12 10 2 0 8
Market Garden Swamp 13 9 2 0 7
Horse Paddock Swamp 14 7 2 0 5
Roe Swamp 15 6 1 0 5
Fawcett Road Wetland 16 3 0 0 3
4.3.3 Wetland bird communities
The wetlands of the study area differ in terms of bird community composition (Table 4-6). The groups of birds previously described (section 4.3) can be indicators of both the variability in wetland habitat and food availability (Kingsford and Norman, 2002).
Occurrence frequency can be used to assess which groups of birds are the most regularly seen on every wetland. The occurrence frequency is the number of times every species occurred in an area, in relation to the number of surveys that have been conducted in this area. Occurrence frequency is not related to bird numbers but to the regularity of occurrence.
No recent or historical data were available for Horse Paddock Swamp. Surveys (n=12) have been conducted in 2009 to 2010 by Western Wildlife, but the site was dry and unsuitable for wetland birds. The surveys from DEC (1988 to 1992) were excluded because they only included waterfowl, and no other groups of birds.
In the northern lakes and the Beeliar Wetlands, some groups of birds occurred more frequently: ducks, egrets, bitterns, herons, ibis, spoonbills, dotterels, plovers, crakes, rails, gulls and terns appeared relatively equally at both groups of wetlands. Ducks appeared in 89 percent of the surveys conducted and therefore constituted the most common group of wetland birds of the study area.
Grebes, darters, cormorants, pelicans, and warblers (megalurids and acrocephalids) were recorded more regularly at the northern lakes than at the Beeliar Wetlands. For darters and cormorants, the large breeding colony at Booragoon Lake explains the high occurrence frequency at that lake. Most of these species dive to feed, which is likely related to the relatively permanent and deeper water of the northern lakes.
Stilts, avocets, godwits, sandpipers, stints and birds of prey were more frequent at the Beeliar Wetlands than at the northern lakes.
Table 4-6 Occurrence frequencies (%) of the different bird communities of the study area (northern lakes highlighted, red numbers are the maximum occurrence frequencies for each group of birds).
Wetlands Nu
mb
ers
of
su
rve
ys
Du
cks &
sw
an
s
Gre
bes
Dart
ers
Co
rmo
ran
ts
Peli
can
s
Bit
tern
s,
eg
rets
&
hero
ns
Ibis
& s
po
on
bills
Cra
kes,
rail
s &
allie
s
Sti
lts &
avo
cets
Plo
ve
rs &
do
ttere
ls
Go
dw
its,
san
dp
ipers
Gu
lls &
Te
rns
Bir
ds o
f p
rey
Acro
cep
halid
Meg
alu
rid
Lake Joondalup 95 97 84 5 73 36 95 69 91 55 47 20 4 16 19 24
Lake Monger 21 100 90 23 66 61 33 0 90 33 9 4 95 4 80 76
Booragoon Lake 14 71 57 79 86 0 50 50 71 0 0 0 0 7 0 0
Average frequencies - northern lakes 89 77 36 75 32 59 40 84 29 19 8 33 9 33 33
Thomsons Lake 193 89 41 0 26 8 65 48 76 55 26 36 31 54 36 37
Bibra Lake 55 100 74 18 60 56 70 54 94 49 14 18 92 36 45 21

Assessment of the Effect of Traffic Noise on Wetland Birds Background study for the Roe Highway Extension Project
South Metro Connect Final Report
Phoenix Environmental Sciences Pty Ltd 23
Wetlands Nu
mb
ers
of
su
rve
ys
Du
cks &
sw
an
s
Gre
bes
Dart
ers
Co
rmo
ran
ts
Peli
can
s
Bit
tern
s,
eg
rets
&
hero
ns
Ibis
& s
po
on
bills
Cra
kes,
rail
s &
allie
s
Sti
lts &
avo
cets
Plo
ve
rs &
do
ttere
ls
Go
dw
its,
san
dp
ipers
Gu
lls &
Te
rns
Bir
ds o
f p
rey
Acro
cep
halid
Meg
alu
rid
North Lake 24 79 63 25 50 4 67 33 88 29 8 38 29 4 0 0
South Lake 16 75 68 25 62 0 56 62 56 31 31 18 0 31 0 0
Horse Paddock Swamp 12 - - - - - - - - - - - - - - -
Little Rush Lake 16 93 43 25 31 0 43 43 87 18 0 12 0 0 6 0
Roe Swamp 19 95 63 0 16 0 58 63 79 53 16 5 5 0 0 0
Yangebup Lake 72 97 84 2 27 37 45 45 54 56 50 29 30 25 22 12
Kogolup Lake 43 100 69 6 51 18 72 67 90 20 4 14 0 53 37 11
Lake Coogee 18 94 33 6 83 28 89 61 39 61 11 28 78 6 0 6
Manning Lake 26 88 38 0 15 0 42 19 81 13 23 8 77 0 0 0
Market Garden Swamp 12 83 33 0 42 8 58 58 58 42 8 0 42 17 0 0
Fawcett Road Wetland 11 73 0 0 0 0 18 36 36 27 9 0 64 0 0 0
Average frequencies - Beeliar Wetlands 89 51 9 39 13 57 49 70 38 17 17 37 19 12 7
4.4 TRAFFIC VOLUME
Some wetlands in the study area and northern lakes group were surrounded by high traffic volume roads which were located a reasonable distance from the lake (around 1km away), resulting in a lower traffic volume/distance ratio (<60; TVDR) compared with others. In contrast, wetlands surrounded by high traffic volume roads located close to the shoreline recorded higher ratios.
Of the northern lakes, Lake Monger is by far the closest wetland to a high traffic volume road: the Mitchell Freeway (15 to 30m). Booragoon Lake is under the influence of the Leach Highway (10-20m for the southern side) but the northern part of the lake is far from the main road (250 m). Lake Joondalup is a very large wetland surrounded by numerous high traffic roads but most of them are located far away from the shoreline (70 to 300m), with the exception of Ocean Reef Road which splits the southern end of the lake into two separate water bodies (20-30m away from the water).
Within the study area, roads around Bibra Lake and adjacent wetlands are moderately trafficked but are very close to the shoreline (closest 20m) especially along the northern side of Bibra Lake. The associated wetlands, Roe Swamp, North Lake and Horse Paddock Swamp, consequently recorded higher TVDRs than other Beeliar wetlands. The busiest part of North Lake Road is close to Little Rush Lake and Yangebup Lake (150m for both lakes). Wetlands with a TVDR below 60 were located a considerable distance from roads with moderate traffic volumes.
Table 4-7 Wetlands ranked by TVDR, (northern lakes are highlighted)
Wetlands Traffic Volume/Distance Ratio
(pooled AAWTF/pooled distances between roads and wetlands)
Lake Monger 1841 Booragoon Lake 385 Bibra Lake 157 Little Rush Lake 125 Roe Swamp 88 Lake Joondalup 76 North Lake 64 Horse Paddock Swamp 57 Yangebup Lake 56 South Lake 40 Market Garden Swamp 35
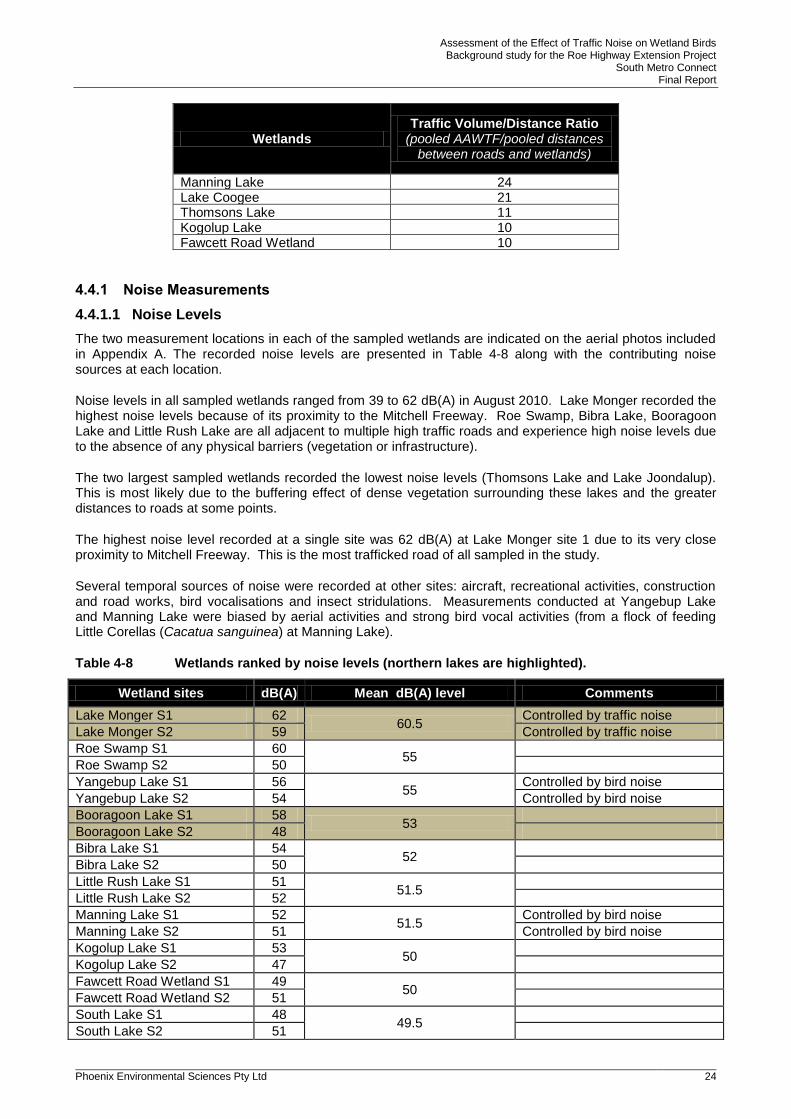
Assessment of the Effect of Traffic Noise on Wetland Birds Background study for the Roe Highway Extension Project
South Metro Connect Final Report
Phoenix Environmental Sciences Pty Ltd 24
Wetlands Traffic Volume/Distance Ratio
(pooled AAWTF/pooled distances between roads and wetlands)
Manning Lake 24 Lake Coogee 21 Thomsons Lake 11 Kogolup Lake 10 Fawcett Road Wetland 10
4.4.1 Noise Measurements
4.4.1.1 Noise Levels
The two measurement locations in each of the sampled wetlands are indicated on the aerial photos included in Appendix A. The recorded noise levels are presented in Table 4-8 along with the contributing noise sources at each location.
Noise levels in all sampled wetlands ranged from 39 to 62 dB(A) in August 2010. Lake Monger recorded the highest noise levels because of its proximity to the Mitchell Freeway. Roe Swamp, Bibra Lake, Booragoon Lake and Little Rush Lake are all adjacent to multiple high traffic roads and experience high noise levels due to the absence of any physical barriers (vegetation or infrastructure).
The two largest sampled wetlands recorded the lowest noise levels (Thomsons Lake and Lake Joondalup). This is most likely due to the buffering effect of dense vegetation surrounding these lakes and the greater distances to roads at some points.
The highest noise level recorded at a single site was 62 dB(A) at Lake Monger site 1 due to its very close proximity to Mitchell Freeway. This is the most trafficked road of all sampled in the study.
Several temporal sources of noise were recorded at other sites: aircraft, recreational activities, construction and road works, bird vocalisations and insect stridulations. Measurements conducted at Yangebup Lake and Manning Lake were biased by aerial activities and strong bird vocal activities (from a flock of feeding Little Corellas (Cacatua sanguinea) at Manning Lake).
Table 4-8 Wetlands ranked by noise levels (northern lakes are highlighted).
Wetland sites dB(A) Mean dB(A) level Comments
Lake Monger S1 62 60.5
Controlled by traffic noise
Lake Monger S2 59 Controlled by traffic noise
Roe Swamp S1 60 55
Roe Swamp S2 50
Yangebup Lake S1 56 55
Controlled by bird noise
Yangebup Lake S2 54 Controlled by bird noise
Booragoon Lake S1 58 53
Booragoon Lake S2 48
Bibra Lake S1 54 52
Bibra Lake S2 50
Little Rush Lake S1 51 51.5
Little Rush Lake S2 52
Manning Lake S1 52 51.5
Controlled by bird noise
Manning Lake S2 51 Controlled by bird noise
Kogolup Lake S1 53 50
Kogolup Lake S2 47
Fawcett Road Wetland S1 49 50
Fawcett Road Wetland S2 51
South Lake S1 48 49.5
South Lake S2 51

Assessment of the Effect of Traffic Noise on Wetland Birds Background study for the Roe Highway Extension Project
South Metro Connect Final Report
Phoenix Environmental Sciences Pty Ltd 25
Wetland sites dB(A) Mean dB(A) level Comments
North Lake S1 50 48.5
North Lake S2 47
Horse Paddock S1 49 47
Horse Paddock S2 45
Market Garden Swamp S1 45 46.5
Market Garden Swamp S2 48
Lake Coogee S1 42 46
Lake Coogee S2 50
Lake Joondalup S1 46 46
Lake Joondalup S2 46
Thomson Lake S1 39 41.5
Thomson Lake S2 44
4.4.1.2 Frequency content of traffic noise
Traffic noise in the bird vocalization range between 2 and 8 kHz will have the most significant effect on the masking of communication signals. The one-third octave band noise levels measured at the six sites that experience the highest traffic noise levels are summarised graphically in Figure 4-5. The graph shows that most of the traffic noise energy occurs below 2 kHz outside the bird vocalization range, with the noise levels dropping off above 3 kHz.
Figure 4-5 One-third octave band noise levels measured at the six sites with highest noise levels
Manning Lake was excluded from this analysis, as most of the noise emission at the Manning Lake sites was comprised of bird calls.
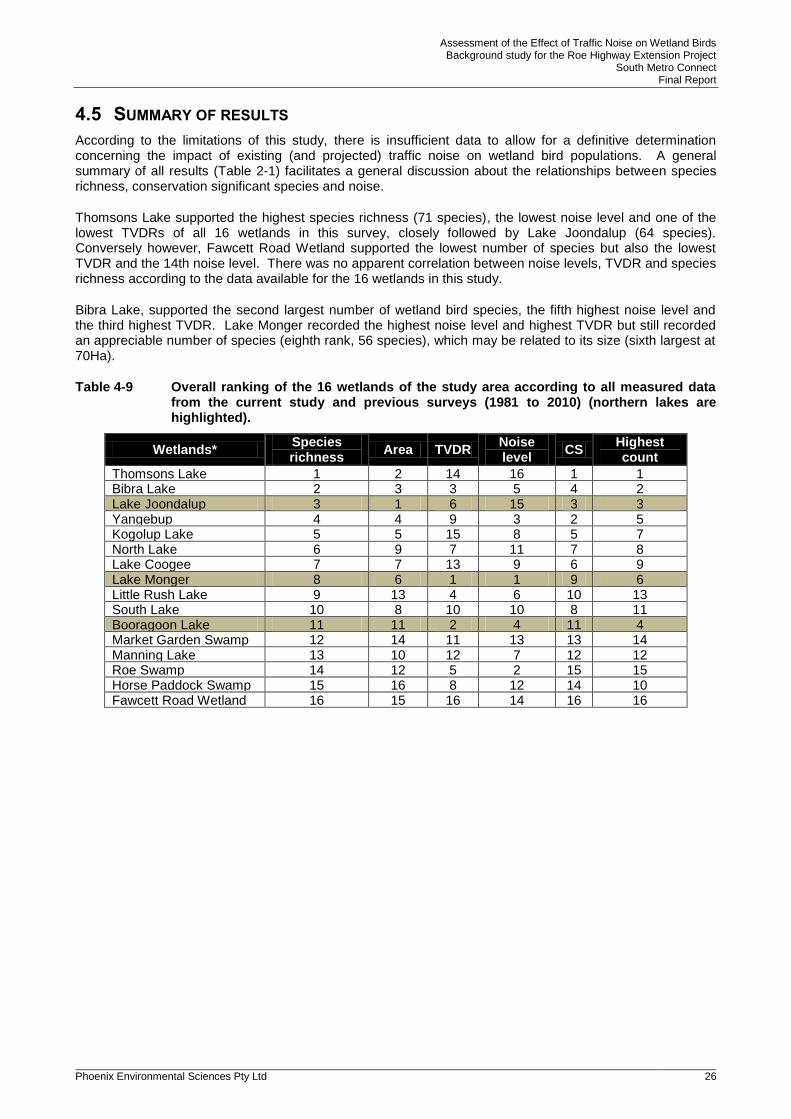
Assessment of the Effect of Traffic Noise on Wetland Birds Background study for the Roe Highway Extension Project
South Metro Connect Final Report
Phoenix Environmental Sciences Pty Ltd 26
4.5 SUMMARY OF RESULTS
According to the limitations of this study, there is insufficient data to allow for a definitive determination concerning the impact of existing (and projected) traffic noise on wetland bird populations. A general summary of all results (Table 2-1) facilitates a general discussion about the relationships between species richness, conservation significant species and noise.
Thomsons Lake supported the highest species richness (71 species), the lowest noise level and one of the lowest TVDRs of all 16 wetlands in this survey, closely followed by Lake Joondalup (64 species). Conversely however, Fawcett Road Wetland supported the lowest number of species but also the lowest TVDR and the 14th noise level. There was no apparent correlation between noise levels, TVDR and species richness according to the data available for the 16 wetlands in this study.
Bibra Lake, supported the second largest number of wetland bird species, the fifth highest noise level and the third highest TVDR. Lake Monger recorded the highest noise level and highest TVDR but still recorded an appreciable number of species (eighth rank, 56 species), which may be related to its size (sixth largest at 70Ha).
Table 4-9 Overall ranking of the 16 wetlands of the study area according to all measured data from the current study and previous surveys (1981 to 2010) (northern lakes are highlighted).
Wetlands* Species richness
Area TVDR Noise level
CS Highest count
Thomsons Lake 1 2 14 16 1 1 Bibra Lake 2 3 3 5 4 2 Lake Joondalup 3 1 6 15 3 3 Yangebup 4 4 9 3 2 5 Kogolup Lake 5 5 15 8 5 7 North Lake 6 9 7 11 7 8 Lake Coogee 7 7 13 9 6 9 Lake Monger 8 6 1 1 9 6 Little Rush Lake 9 13 4 6 10 13 South Lake 10 8 10 10 8 11 Booragoon Lake 11 11 2 4 11 4 Market Garden Swamp 12 14 11 13 13 14 Manning Lake 13 10 12 7 12 12 Roe Swamp 14 12 5 2 15 15 Horse Paddock Swamp 15 16 8 12 14 10 Fawcett Road Wetland 16 15 16 14 16 16
Assessment of the Effect of Traffic Noise on Wetland Birds Background study for the Roe Highway Extension Project
South Metro Connect Final Report
Phoenix Environmental Sciences Pty Ltd 27
5 DISCUSSION AND CONCLUSION
Wetlands are known worldwide to intermittently support large numbers of breeding, migratory and wintering birds. This is the case for Australia (Kingsford and Norman 2002) and Western Australia in particular (e.g. Bamford et al 2008). The study area is located on the Swan Coastal Plain, an area that has already lost more than 70 percent of its pre-European standing water bodies (Davis and Froend 1999).
The use of wetlands is known to vary between bird species. During migration, birds react differently than during the breeding season. For example, it is easy to get close to a breeding shorebird on its own territory but the same individual will have a higher disturbance threshold on stop-over or migrating sites (Smit and Visser 1993). This is due to trade-offs between surviving and breeding, and is dependent upon the season.
It is assumed that generally, traffic noise is likely to affect breeding shorebirds, as indicated by the literature (Reijnen and Foppen, 1997; Kuitunen et al 1998; Smith et al 2005; Hirvonen, 2001). The majority of studies documenting the impact of noise on migrating or wintering flocks of birds are related to wind turbines, military activities, aircraft noise or recreational activities. All are predominantly associated with strong visual stimuli or irregular noise events (Komenda-Zehnder et al 2003; Wyle undated; Larkin undated; Korschgen and Dahlgren 1992). In addition, the literature usually focuses on song birds (Laiolo 2010), with no publications documenting the effect of traffic noise on Australian breeding wetland birds.
An additional challenge is isolating the effect of noise from any other parameters such as natural population trends, abiotic factors or other road related disturbances (Donaldson and Bennett 2004; Benítez-lópez et al 2010). Gill et al (2001) suggest that when assessing the impact of human disturbances on wildlife, both behavioral observations and demographic parameters should be considered.
This study assessed traffic noise volumes for wetlands in the project area (North and Bibra Lakes), eleven other Beeliar Wetlands and three wetlands in the northern suburbs of the Perth Metropolitan area (Lake Joondalup, Lake Monger and Booragoon Lake). The latter lakes were considered to be representative of the potential traffic volumes created by the proposed project.
A number of major limitations applied to this study, including the limited timeframe available, the disparity of the bird count datasets and the sample size of the noise measurements. Habitat suitability and capacity is a key factor for wetland bird diversity and number but no habitat assessment was conducted for this study.
5.1 BIRDS OF THE STUDY AREA AND NORTHERN WETLANDS
Of all 16 wetlands considered in this survey, Thomsons Lake supported the highest species richness (71 species), followed by Lake Joondalup (64 species). Fawcett Road Wetland supported the lowest number of species.
The species richness of all sampled wetlands was significantly correlated with wetland size (r2=0.914), with
the largest wetlands potentially offering more available habitat. A larger number of species implies an increased chance of supporting more conservation significant species; this was also confirmed by a strong positive correlation (r
2=0.971).
The northern lakes supported fewer shorebird species than the Beeliar Wetlands; 10 species (combined), compared with 23 at the Beeliar Wetlands (combined). Most of the shorebird species that were recorded at the northern lakes are listed under the CS1 criteria – the highest level of conservation significance.
Habitat availability seems to be the key factor accounting for the difference between the Beeliar Wetlands and the northern lakes bird communities. The northern lakes provide a smaller area of shallow water (which is foraging habitat for shorebirds), than the Beeliar Wetlands where water levels are (on average) lower in summer. According to the EPA (1993), of the eight summer drought refuges in the study area, only Booragoon Lake and Lake Monger have water levels that exceed 50cm depth in summer. In the same context, diving birds occurred more regularly at the northern lakes than the Beeliar Wetlands.

Assessment of the Effect of Traffic Noise on Wetland Birds Background study for the Roe Highway Extension Project
South Metro Connect Final Report
Phoenix Environmental Sciences Pty Ltd 28
5.2 NOISE LEVELS AND POTENTIAL IMPACTS ON BIRD POPULATIONS
Bird vocalizations are relatively well documented within their breeding seasons, but there is a paucity of knowledge regarding factors affecting bird vocalizations outside of the breeding season, when birds may be more difficult to monitor.
Differences in the function of acoustic communication between breeding and non-breeding species in a sampling event, and different purposes for wetland use, may cause different responses to traffic noise disturbance between species. In the case of the latter point, a large majority of shorebirds primarily use the wetlands of the study area as a migratory stop-over (Western Wildlife, 2010).
The impact of road traffic noise on songbirds (and breeding birds in general) can potentially be important according to the literature. This group of birds was not included in this study.
Bird populations disturbed by traffic noise may move away from it (vertically in the vegetation structure or horizontally, to different territories). Such behaviour results in lower diversity and densities of birds near disturbed areas, especially in respect to breeding birds. Wetland birds (breeding and non-breeding) are known to be sensitive to human activities. However, within both the study area and the northern lakes, there were no strong correlations between species richness, number of conservation significant species, noise level (dB) and traffic volume/distance ratio (TVDR).
The Beeliar Wetlands were identified as supporting more species than the northern lakes; 96 species compared to 66 species. However, the average species richness of the northern lakes was higher than the Beeliar Wetlands (50 species versus 43 species, respectively), despite the higher-than-average noise level (53 dB(A) vs. 49 dB(A)) and a much higher average TVDR (767 vs. 53) of the northern lakes.
A similar result was noted for total numbers of birds in both groups of wetlands, with no strong correlation between bird numbers and TVDR, or noise levels in general.
Booragoon Lake may be an exception. This lake recorded comparatively large numbers of birds (up to 5234, the fourth highest of all sampled wetlands) for its relatively small size (13ha, eleventh of all sampled wetlands). It was the only wetland of the study area that supported a very large colony of cormorants, darters and ibis (though massive congregations of waterfowls or shorebirds were not recorded). However, cormorant numbers have declined notably over the last decade at Booragoon Lake. While the road traffic volume of the adjacent Leach Highway has apparently been stable since 1998, earlier data are not available so it is not possible to quantify any relationship between the decline in the breeding population of cormorants and changes in the traffic volume at this site over time.
No evidence of a relationship between road traffic noise and wetland birds could be found at any of the wetlands of the study area. None of the measurements in this study exceed 62 dB(A). Dooling and Popper (2007) suggest that interference with bird communication only begins at noise levels of 55 to 60 dB(A) when the ambient noise environment is in the order of 50 to 55 dB(A). In this study, only three sites recorded traffic noise levels at or above 55 dB(A); however, the ambient noise levels were not established. Due to the great number of limitations and the lack of literature documenting the effect of road traffic noise on wetland birds specifically the results of this study need to be interpreted with caution.
Assessment of the Effect of Traffic Noise on Wetland Birds Background study for the Roe Highway Extension Project
South Metro Connect Final Report
Phoenix Environmental Sciences Pty Ltd 29
6 REFERENCES
Bamford M (2009). Unpublished bird count data from Bibra Lake, Thomson’s Lake, Kogolup Lake and Yangebup Lake, collected June 1999 – Feb 2009.
Bamford M, Bancroft W, Raines J, (2010). Environmental investigations for the Jandakot Groundwater Scheme Stage 2: Effects of remote rainfall events on waterbird populations on the Jandakot Mound Wetlands. Water and Rivers Commission.
Bamford M D, Watkins W, Bancroft G, Tischler G, Wahl J (2008). Migratory Shorebirds of the East Asian - Australasian Flyway; Population Estimates and Internationally Important Sites. Wetlands International - Oceania. Canberra, Australia.
Bennett Brook Environmental Services (2004). Booragoon Lake Reserve Management Plan July 2004. City of Melville.
Benítez-lópez A, Alkemade R, Verweij P A (2010). Systematic review: the impacts of roads and other intrastructure on mammal and bird populations: A meta-analysis. Biological Conservation 143: 1307-1316.
Bregman AS, (1991). Auditory Scene Analysis: the Perceptual Organization of Sound. MIT Press.
Brumm H, (2004). The impact of environmental noise on song amplitude in a territorial bird. Journal of Animal Ecology: 73, 434-440.
Brumm H, Schmidt R, Schrader L, (2009). Noise-dependent vocal plasticity in domestic fowl. Animal Bevahiour , 78, 741-746.
Burger J, Jeitner C, Clark K, Niles L.J. (2004). The effect of human activities on migrant shorebirds: successful adaptive management. Environmental Conservation 31(4): 283-288.
Chambers LE, (2008). Trends in timing of migration of south-western Australian birds and their relationship to climate. Emu 108: 1-14.
City of Perth, (1998) Lake Monger management plan, 1993-1998.
Christidis L, Boles WE, (2008). Systematics and taxonomy of Australian birds. CSIRO Publishing.
Cynx J, Lewis R, Tavel B, Tse H, (1998). Amplitude regulation of vocalizations in noise by a songbird, Taeniopygia guttata. Animal Behaviour , 56, 107-113.
Davis J, Froend RH, (1999). Loss and degradation of wetlands in southwestern Australia: underlying causes, consequences and solutions. Wetlands ecology and management 7: 13-23.
Davis J, Halse SA, Froend RH, (2001). Factors influencing biodiversity in coastal plain wetlands of South-western Australia. Biodiversity in wetlands: assessment, function and conservation, volume 2. Backhuys Publishers.
Department of Environment and Conservation, (2010). Western Australian Wetlands Database available online at: http://spatial.agric.wa.gov.au/wetlands/index.asp
Department of Conservation and Land Management (2003). Information sheet on RAMSAR wetlands: Forrestdale and Thomson Lake, Western Australia. RAMSAR Convention
Dent ML, Larsen ON, Dooling RJ, (1997). Free-field binaural unmasking in budgerigars (Melopsittacus undulatus). Behaviour Neuroscience , 111, 590-598.
Donaldson A, Bennett A, (2004). Ecological effects of roads, implications for the internal fragmentation of Australian parks and reserves. Parks Victoria Technical Series, number 12.
Assessment of the Effect of Traffic Noise on Wetland Birds Background study for the Roe Highway Extension Project
South Metro Connect Final Report
Phoenix Environmental Sciences Pty Ltd 30
Dooley B, Nowra T, Strano P, Davis I, Murray R, McGowan R, (2006) – Beeliar Regional Park, Final management plan. CALM, City of Cockburn, City of Melville, Town of Kwinana, Murdoch University.
Dooling RJ, Fay RR, Popper AN, (2000). Comparative Hearing: Birds and Reptiles. Springer-Verslag.
Dooling RJ, Popper AN, (2007). The effects of highway noise on birds. Environmental BioAcoustics LLC for the California Department of Transportation, Division of Environmental Analysis.
Environment Australia, (2001). A Directory of Important Wetlands in Australia, Third Edition.Environment Australia, Canberra.
Environmental Protection Authority (1993). A Guide to Wetland Management in the Perth and near Perth Swan Coastal Plain Area, An update to EPA Bulletin 374. Report of the Environmental Protection Authority.
Ford JR, (1958). Seasonnal variation in population of Anatidae at the Bibra Lake District, Western Australia. Emu 58: 31-41.
Forman RT, Reineking B, Hersperger AM, (2002). Road traffic and nearby grassland bird patterns in a suburbanizing landscape. Environmental Management , 29 (6), 782-800.
Geering A, Agnew L, Harding S, (2007). Shorebirds of Australia. CSIRO Publishing.
Gill JA, Norris K, Sutherland WJ, (2001). Why behavioural responses may not reflect the population consequences of human disturbance. Biological Conservation 97: 265-268.
Government of Western Australia (2000). Bush forever, Volume 1, Policies, Principles and Processes. Final Report.
Halse SA, Jaensch RP, (1989). Breeding seasons of Waterbirds in South-western Australia – the importance of Rainfall. Emu 89: 232-249.
Hirvonen H, (2001). Impacts of highway construction and traffic on a wetland bird community. IN:Proceedings of the 2001 International Conference on Ecology and Transportation, Eds. Irwin CL, Garrett P, McDermott KP. Center for Transportation and the Environment, North Carolina State University, Raleigh, NC: pp. 369-372.
Jaensch RP, Vervest RM, Hewish MJ, (1988). Waterbirds in Nature Reserves of South-Western Australia 1981-1985, reserve accounts. RAOU Report n°30.
Jonshtone RE, Store GM, (1998). Handbook of Western Australian Birds, Volume 1 – non-passerines (Emu to Dollarbirds). WA Museum.
Kinnear A, Garnett P, (1999) – Water chemistry of the wetlands of the Yellagonga Regional Park, Western Australia. Journal of the Royal Society of Western Australia 82: 79-85.
Kingsford RT, Norman FI, (2002). Australian waterbirds – products of the continent’s ecology. Emu 102: 47-69.
Komenda-Zehnder S, Cevallos M, Bruderer B, (2003). Effects of disturbance by aircraft overflight on waterbirds – An experimental approach. International Bird Strike Committee. Warsaw, 5-9 May 2003.
Korschgen CE, Dalgren RB, (1992). Human disturbances of waterfowl: causes, effects, and management. Waterfowl management handbook. Fish and Wildlife Leaflet 13.2.15.
Kuitunen M, Rossi E, Stenroos A, (1998). Do highways influence density of land birds? Environmental management 22 (2): 297-302.
Leddy, K. L., Higgins, K. F., and Naugle, D. E. (1999). Effects of wind turbines on upland nesting birds in conservtaion reserve program grassland.Wilson Bulletin , 100-104.

Assessment of the Effect of Traffic Noise on Wetland Birds Background study for the Roe Highway Extension Project
South Metro Connect Final Report
Phoenix Environmental Sciences Pty Ltd 31
Laiolo P, (2010). Review: the emerging significance of bioacoustics in animal species conservation.
Biological Conservation 143: 1635-1645.
Lund MA, (1992) - Aspects of the ecology of a degraded Perth wetland (Lake Monger, Western Australia) and implications for biomanipulation and other restoration techniques. Ph.D. Thesis, Murdoch University, Western Australia.
Larkin RP, (undated). Effects of military noise on wildlife: a literature review. Center for Wildlife Ecology, Illinois Natural History Survey.
Main Roads Western Australia, (2009). Metropolitan Average Weekday Traffic. Asset and Network Information Branch.
Manabe K, Sadr EI, Dooling RJ, (1998). Control of vocal intensity in budgerigars (Melopsittacus undulatus): differential reinforcement of vocal intensity and the Lombard effect. Journal of the Acoustical Society of America , 103 (2), 1190-1198.
Nebel S, Porter JL, Kinsford RT, (2008). Long-term trends of shorebird populations in eastern Australia and impacts of freshwater extraction. Biological Conservation 141: 971-980.
Nemeth E, Brumm H, (2009). Blackbirds sing higher-pitched songs in cities: adaptation to habitat acoustics or side-effect of urbanization. Animal Behaviour , 78, 637-641.
Newton I, (2003). Population limitation in birds. Academic Press Limited.
Newton I, (2008). The migration ecology of birds. Academic Press.
Niemec A, Raphael Y, Moody D, (1994). Return of auditory function. Hearing Research , 75, 209-224. NRC. (2005). Marine Mammal Populations and Ocean Noise - Determining When Noise Causes Biologically Significant Effects. National Research Council, National Academies Press.
NRC (2005). Marine Mammal Populations and Ocean Noise – Determining When Noise Causes Biologically Significant Effects. National Research Council, National Academies Press.
Parris KM, Schneider A, (2009). Impacts of traffic noise and traffic volume on birds of roadside habitats. Ecology and Society 14(1): 29 [online].
Pytte CL, Rusch KM, Ficken MS, (2003). Regulation of vocal amplitude by the blue-toathed hummingbird, Lampornis clemenciae. Animal Behaviour , 66, 703-710.
Reijnen R, Foppen R, (1994). The effects of car traffic on breeding bird populations in woodland. I. Evidence of reduced habitat quality for willow warblers (Phylloscopus trochilus) breeding close to a highway. Journal of Applied Ecology 31 (1): 85-94.
Reijnen R, Foppen R, (1995). The effects of car traffic on breeding bird populations in woodland. IV. Influence of population size on the reduction of density close to a highway. Journal of Applied Ecology 32 (3): 481-491.
Reijnen R, Foppen R, Ter Braak C, Thissen J, (1995). The effects of car traffic on breeding bird populations in woodland. III. Reduction of density in relation to the proximity of main roads. Journal of Applied Ecology , 32 (1), 187-202.
Reijnen R, Foppen R, Meeuwsen H, (1996). The effects of traffic on the density of breeding birds in Dutch agricultural grassland. Biological Conservation 75: 255-260.
Reijnen R, Foppen R, (1997). Disturbance by traffic of breeding birds: evaluation of the effect and considerations in planning and managing road corridors. Biodiversity and Conservation 6: 567-581.
Rheindt FE, (2003). The impacts of roads on birds: Does song frequency play a role in determining susceptibilityto noise pollution? Journal of Ornithology , 144 (3), 295-306.
Assessment of the Effect of Traffic Noise on Wetland Birds Background study for the Roe Highway Extension Project
South Metro Connect Final Report
Phoenix Environmental Sciences Pty Ltd 32
Roshier DA, Klomp NI, Asmus M, (2006). Movements of a nomadic waterfowl, the Grey Teal Anas gracilis, across inland Australia – result from satellite telemetry spanning fifteen months. Ardea 94 (3): 461-475.
Ryals BM, Dooling RJ, Westbrook E, Dent ML, MacKenzie A, Larsen ON, (1999). Avian species differences in susceptibility to noise exposure. Hearing research 131: 71-88.
Saunders JC, Cohen YE, Szymko YM, (1991). The structural and funtionla consequences of acoustic injury in the cohlea and peripheral auditory system: A five year update. Journal of the Acoustical Society of America , 90 (1), 136-146.
Saunders JC, Torsiglieri AJ, DeDio RM, (1993). The growth of hearing loss in neonatal chicks exposed to intense pure tones. Hearing Research , 69, 25-34.
Saunders SS, Salvi RJ, (1993). Psychoacoustics of normal adult chieckens: threshold and temporal integration. Journal of the Acoustical Society of America , 94 (1), 83-90.
Slabbekoorn H, Peet M, (2003). Birds sing at a higher pitch in urban noise. Natur: 424, 267.
Slabbekoorn H, Rippmeister P, (2008). Birdsongs and anthropogenic noise: implications and applications for conservatrion. Molecular Ecology 17: 72-83.
Smit CJ, Visser GJM, (1993). Effects of disturbance on shorebirds: a summary of existing knowledge from the Dutch Wadden Sea and Delta area.
Smith AC, Virgl JA, Panayi D, Armstrong AR, (2005). Effects of a diamond mine on Tundra-breeding birds. Arctic 58 (3):295-304.
State of Western Australia, (2008). Part 1: Conservation – Wildlife Conservation Act 1950. Western Australian Government Gazette 134: 3471-3485.
Stone E, (2002). Separating the noise from the noise: a finding in support of the 'niche hypothesis', that birds are influenced by human-induced noise in natural habitats. Anthrozoos 13: 225-231.
Storey AW, Vervest RM, Pearson GB, Halse SA, (1993). Wetlands of the Swan Coastal Plain, volume 7. Waterbird usage of wetlands on the Swan Coastal Plain. Department of Conservation and Land Management.
Taylor BD, Goldingay RL, (2010). Roads and wildlife: impacts, mitigation and implications for wildlife management in Australia. Wildlife Research 37(4): 320–331.
Warren PS, Katti M, Ermann M, Brazel A, (2006). Urban bioacoustics: it's not just noise. Animal Behaviour 71: 491-502.
Watkins D, (1993). A national Plan for Shorebird conservation in Australia. Australasian Wader Studies Group of the Royal Australasian Ornithologists Union, RAOU report 90.
WYLE, (undated) – Noise basics and the effect of aviation noise on the environment.
Western Wildlife, (2010). Roe Highway extension: Wetland and migratory bird study, 2009-2010. Prepared for South Metro Connect.

Assessment of the Effect of Traffic Noise on Wetland Birds Background study for the Roe Highway Extension Project
South Metro Connect Final Report
Phoenix Environmental Sciences Pty Ltd 33
7 GLOSSARY
Study Area: the study area includes the 13 Beeliar Wetlands surveyed by Western Wildlife (2010) (Lake Thomsons, Kogolup, Yangebup, Coogee, Fawcett Road Wetland, Roe Swamp, Horse Paddock Swamp, Bibra Lake, North Lake, South Lake, Little Rush Lake, Market Garden Swamp and Manning Lake) as well as the 3 comparison sites (Lake Joondalup, Monger and Booragoon Lake) also called “northern lakes”, due to their location north of the Beeliar Regional Park.
Ambient sound: Environmental background noise not of direct interest during a measurement or observation.
Audiogram: Graph showing an animal‟s absolute auditory threshold versus frequency.
Auditory threshold: Minimum sound level that can be perceived by an animal in the absence of significant background noise.
Bandwidth: The range of frequencies over which a sound is produced or received.
Decibel (dB): Unit used in the logarithmic measure of sound pressure, intensity and power.
Frequency: Rate at which water particles move backwards and forwards measured in cycles per seconds or Hertz ( Hz).
Hearing threshold: The hearing threshold generally represents the lowest signal level an animal can detect, usually referred (and measured) as the threshold at which an animal will indicate detection 50 percent of the time.
Impulse sound Transient: sound produced by a rapid release of energy, usually electrical or chemical such as circuit breakers or explosives. Impulse sound has extremely short duration and high peak sound pressure.
Migratory species: are migratory the non-resident species that travel between a breeding range and a wintering range. Partial migratory species are more likely to travel depending on the climatic conditions, following rainfall most of the time. In Australia, 169 species are partial migrants (Chan, 2001). In the Study Area, a large majority of migratory birds are shorebirds.
Northern lakes: Lake Joondalup, Lake Monger and Booragoon Lake. These sites were not included in the wetland bird survey conducted by Western Wildlife (2010).
Opportunist: an opportunist species is a species that can feed on a wide range of preys (e.g. carrions, invertebrates, human waste, live animals) and is therefore better adapted than specialist species to environmental changes.
Permanent Threshold Shift (PTS): A permanent loss of hearing caused by acoustic trauma from irreversible damage to the sensory hair cells of the ear.
Phenology: chronology of species‟ biological cycle. For birds, phenology is about timing of migration of breeding season.
Sound attenuation: Reduction of the sound pressure level, which occurs naturally through dissipating processes (such as friction) as a wave travels through a material (liquid or solid).
Sound Pressure Level (SPL): The sound pressure level is the sound pressure expressed in the decibel (dB) scale and with the standard reference pressures of 20 μPa for air.
Sound pressure spectrum: Distribution of sound pressure versus frequency.
Temporary Threshold Shift (TTS): Temporary loss of hearing as a result of exposure to sound over time. Exposure to high levels of sound over relatively short time periods can cause the same amount of TTS as exposure to lower levels of sound over longer time periods. The mechanisms underlying TTS are not well

Assessment of the Effect of Traffic Noise on Wetland Birds Background study for the Roe Highway Extension Project
South Metro Connect Final Report
Phoenix Environmental Sciences Pty Ltd 34
understood, but there may be some temporary damage to the sensory hair cells. The duration of TTS varies depending on the nature of the stimulus.
Ubiquitous: in ornithological term, a ubiquitous species is a species that can breed and feed regularly in several types of habitats.
Wetland birds: refers to all species that complete a substantial part of their life cycle in wetlands (Jaensch et al 1988).

Phoenix Environmental Sciences Pty Ltd 35