Effect of Thermal Management on Battery Life Development ... · PDF filevehicle applications....
10
ABSTRACT Battery life and performance depend strongly on temperature; thus there exists a need for thermal conditioning in plug-in vehicle applications. The effectiveness of thermal management in extending battery life depends on the design of thermal management used as well as the specific battery chemistry, cell and pack design, vehicle system characteristics, and operating conditions. We examine the case of an air cooled plug-in hybrid electric vehicle battery pack with cylindrical LiFePO 4 /graphite cell design and address the question: How much improvement in battery life can be obtained with passive air cooling? To answer this question, a model is constructed consisting of a thermal model that calculates temperature change in the battery and a degradation model that estimates capacity loss. A driving and storage profile is constructed and simulated in two cities - Miami and Phoenix - which have different seasonal temperatures. The results suggest that air cooling may extend battery life by 5% in Miami, characterized by higher average temperatures, and by 23% in Phoenix, characterized by higher peak temperatures. Thus, thermal management appears to have the greatest effect in regions with high peak temperatures, even if the region has lower average temperatures. INTRODUCTION Plug-in hybrid electric vehicles (PHEVs) have the potential to reduce operating cost, greenhouse gas (GHG) emissions, and petroleum consumption in the transportation sector. Despite these benefits, there are barriers to market penetration and high battery cost is among the most significant [ 1, 2, 3, 4]. For many plug-in vehicles, the battery is the most expensive component, so if batteries need to be replaced before the vehicle's end of life, cost competitiveness suffers. Although different design choices can lead to different battery EOL criteria [ 5], EOL is typically defined as the time when 20% capacity loss or 30% internal resistance growth is reached, whichever comes first. According to the goals set by US Advanced Battery Consortium (USABC), a PHEV battery is targeted to have 15 years of calendar life and 300,000 cycles of cycle life [ 6]. Battery life depends on the inherent characteristics of the battery such as its technology and design. Currently, PHEVs use Li-ion chemistries due to superior power and energy characteristics. However, battery characteristics such as power, energy, life and safety can vary among different type of Li-ion batteries, depending on the cell design and the material chemistries used in cathode and anode. Although there are various materials being used as cathode material, the most commonly used anode material is graphite. Therefore, in the literature, Li-ion chemistry is often specified by its cathode material. Apart from the specific type and design of the battery, the conditions and stress factors during storage and cycling also affects how quickly the battery will degrade. There are various factors that affect battery life such as time, charge/ discharge rate, temperature, and state of charge (SOC). How these factors affect degradation depends on battery chemistry. Therefore modeling degradation is a complex and challenging task. There is no single life model that models degradation of all Li-ion chemistries. One of the stress factors that is known to affect degradation rate in all Li-ion chemistries is temperature. Usually, the relationship between degradation and temperature can be formulated by an Arrhenius type behavior where degradation rate increases exponentially with temperature [ 7, 8, 9]. However, the exact relation depends on the specific Development of a Simulation Model to Analyze the Effect of Thermal Management on Battery Life 2012-01-0671 Published 04/16/2012 Tugce Yuksel and Jeremy Michalek Carnegie Mellon Univ. Copyright © 2012 SAE International doi: 10.4271/2012-01-0671 Gratis copy for Tugce Yuksel Copyright 2012 SAE International E-mailing, copying and internet posting are prohibited Downloaded Wednesday, April 25, 2012 02:36:10 PM
Transcript of Effect of Thermal Management on Battery Life Development ... · PDF filevehicle applications....

ABSTRACTBattery life and performance depend strongly on temperature;thus there exists a need for thermal conditioning in plug-invehicle applications. The effectiveness of thermalmanagement in extending battery life depends on the designof thermal management used as well as the specific batterychemistry, cell and pack design, vehicle systemcharacteristics, and operating conditions. We examine thecase of an air cooled plug-in hybrid electric vehicle batterypack with cylindrical LiFePO4/graphite cell design andaddress the question: How much improvement in battery lifecan be obtained with passive air cooling? To answer thisquestion, a model is constructed consisting of a thermalmodel that calculates temperature change in the battery and adegradation model that estimates capacity loss. A driving andstorage profile is constructed and simulated in two cities -Miami and Phoenix - which have different seasonaltemperatures. The results suggest that air cooling may extendbattery life by 5% in Miami, characterized by higher averagetemperatures, and by 23% in Phoenix, characterized byhigher peak temperatures. Thus, thermal management appearsto have the greatest effect in regions with high peaktemperatures, even if the region has lower averagetemperatures.
INTRODUCTIONPlug-in hybrid electric vehicles (PHEVs) have the potential toreduce operating cost, greenhouse gas (GHG) emissions, andpetroleum consumption in the transportation sector. Despitethese benefits, there are barriers to market penetration andhigh battery cost is among the most significant [1,2,3,4]. Formany plug-in vehicles, the battery is the most expensivecomponent, so if batteries need to be replaced before thevehicle's end of life, cost competitiveness suffers. Although
different design choices can lead to different battery EOLcriteria [5], EOL is typically defined as the time when 20%capacity loss or 30% internal resistance growth is reached,whichever comes first. According to the goals set by USAdvanced Battery Consortium (USABC), a PHEV battery istargeted to have 15 years of calendar life and 300,000 cyclesof cycle life [6].
Battery life depends on the inherent characteristics of thebattery such as its technology and design. Currently, PHEVsuse Li-ion chemistries due to superior power and energycharacteristics. However, battery characteristics such aspower, energy, life and safety can vary among different typeof Li-ion batteries, depending on the cell design and thematerial chemistries used in cathode and anode. Althoughthere are various materials being used as cathode material, themost commonly used anode material is graphite. Therefore,in the literature, Li-ion chemistry is often specified by itscathode material.
Apart from the specific type and design of the battery, theconditions and stress factors during storage and cycling alsoaffects how quickly the battery will degrade. There arevarious factors that affect battery life such as time, charge/discharge rate, temperature, and state of charge (SOC). Howthese factors affect degradation depends on battery chemistry.Therefore modeling degradation is a complex andchallenging task. There is no single life model that modelsdegradation of all Li-ion chemistries.
One of the stress factors that is known to affect degradationrate in all Li-ion chemistries is temperature. Usually, therelationship between degradation and temperature can beformulated by an Arrhenius type behavior where degradationrate increases exponentially with temperature [7,8,9].However, the exact relation depends on the specific
Development of a Simulation Model to Analyze theEffect of Thermal Management on Battery Life
2012-01-0671Published
04/16/2012
Tugce Yuksel and Jeremy MichalekCarnegie Mellon Univ.
Copyright © 2012 SAE International
doi:10.4271/2012-01-0671
Gratis copy for Tugce YukselCopyright 2012 SAE International
E-mailing, copying and internet posting are prohibitedDownloaded Wednesday, April 25, 2012 02:36:10 PM

electrochemistry, design, and conditioning of the battery.Degradation models used in the literature are usually notderived from physical fundamentals but obtained fromexperimental data. These data are obtained mostly byperforming experiments on cells rather than battery packs,and studies cover a wide variety depending on the cellelectrochemistry, capacity and power characteristics. Twochemistries that have been extensively tested in the publicliterature are LiNixCoyAl(1-x-y)O2 (NCA) and LiFePO4(LFP) chemistries.
Hall et al. [10] tested NCA cells used in satellite applicationsand found that the main degradation mechanism is the lithiumloss due to the formation of a layer between cathode andelectrolyte called solid electrolyte interface (SEI). In the samestudy, it was also shown that during storage impedancegrowth has a t½ dependence, where t represents time, andduring cycling a component linear with time is added to thisbehavior. The same type of storage behavior of impedancegrowth in this chemistry was also reported by Thomas et al.[8] in which the temperature dependence of impedancegrowth rate was modeled using an Arrhenius type ofequation. The Gen 2 Performance Evaluation Final Report[11] by Advanced Technology Development Programshowed that the capacity loss in this chemistry depends notonly on temperature but also on SOC exponentially.
LiFePO4 chemistry is promising due to its safety and longerlife characteristics [12,13,14]. Liu et al. [15] showed that,similar to NCA chemistry, the main mechanism ofdegradation in LiFePO4 batteries is active lithium loss duringthe formation of the SEI layer. They also showed that, thereis not an appreciable impedance growth in this chemistry.Peterson et al. [16] tested LiFePO4 chemistry cellsmanufactured by A123 Systems at a single ambienttemperature and reported that degradation is not dependentupon the depth of discharge (DOD). Wang et al. [9]performed similar tests at various temperatures and showedthat capacity loss can be related to temperature and ampere-hour (Ah) processed. They modeled the temperaturedependence with an Arrhenius type of equation anddependence on Ah-processed by an Ah0.552 behavior. Li et al.[17] tested and evaluated the degradation in cells byconsidering the effects of coupling between stress factors.They analyzed the effects of temperature, charge/dischargerate, end of charge voltage and end of discharge voltage, andshowed that there is a coupling effect between each of thesefactors. Coupling is related to stress levels and there exists acritical stress level at which coupling can be neglected.Finally, A123 Systems provided capacity loss with cycling
and storage at different temperatures for their LiFePO4chemistry ANR26650M1 cells [18, 19].
The exponential effect of temperature on degradation in bothchemistries shows the necessity to control the batterytemperature in PHEVs. Thermal management techniques canbe classified depending on the purpose (heating only versusheating and cooling), the source (passive if ambient air isused without any pre-heating/cooling before entering thebattery, active if a heating/cooling device is built-in to thesystem) and the cooling medium (air versus liquid)1 [20]. Toevaluate the performance of a thermal management system,thermal models of the battery and thermal management canbe used. Ma et al. [21] calculated the temperature increaseand temperature distribution in a PHEV battery pack using afinite element thermal model. Kim and Paseran [22]compared air and liquid cooling thermal managementtechniques. They concluded that liquid cooling providesmuch better heat transfer rate, however liquid coolingincreases complexity and cost, as well as maintenancerequirements.
Most of the studies on this topic restrict scope to eitherbattery degradation or battery thermal management. Studiesof the effect of thermal management on battery life are rare.Gross and Clark [23] aimed to analyze the effect of thermalmanagement on battery life in a battery electric vehicle(BEV). They compared two cases: (1) cell heat is transferredto ambient environment; (2) active thermal management,where the coolant is forced to be at a temperature belowambient. They used a generic formulation for degradationwhich they assumed to be applicable to all batterychemistries. Experiment driven estimations for heat transferrates for each case were used to calculate the change inbattery temperature. They found that active cooling improvesbattery life by 4.4% to 6.5%, where values vary depending onthe region.
We construct an integrated thermal management and batterydegradation model for an air cooled PHEV battery pack withLiFePO4/graphite cell chemistry to address the question:“How much improvement can be obtained in battery life withsimple air cooling?”. A daily driving and storage scenario isposed and applied under different weather conditions in twocities, Miami and Phoenix, and battery life is calculated fortwo cases: air cooling versus no cooling. Preliminary results,limitations, and future work are discussed.
1Note that, in this study, the air cooling systems currently being used in hybrid electric vehicles are referred as ‘passive’, even though the ambient air is cooled or heated by vehicle's airconditioning and heating system before going into the battery. In this study, the ‘active’ and ‘passive’ system definitions proposed by Paseran [20] are used. According to his definition, athermal management system is called ‘passive’ unless there is an active component (evaporators, heating cores, engine coolant) in the thermal management system itself. Therefore, using airconditioning system to pre-cool the air does not make the thermal management system itself ‘active’.
Gratis copy for Tugce YukselCopyright 2012 SAE International
E-mailing, copying and internet posting are prohibitedDownloaded Wednesday, April 25, 2012 02:36:10 PM

ANALYSISDESCRIPTION OF THE SIMULATIONSSimulation ProcedureUsing the thermal and life models, daily simulations for avehicle use and storage profiles are performed. Thesesimulations are summarized in Figure 1. Battery life iscalculated by computing capacity loss in two parts: cyclingcapacity loss, which corresponds to the loss during drivingand charging, and storage capacity loss.
To calculate cycling degradation, driving and charging powerdemand at each time step are given as inputs to the thermalmodel. Thermal model calculates the rate of change of batterytemperature by computing heat generated inside and heattransferred from the battery for two separate cases: (1) thebattery is being cooled by an air cooling thermal managementsystem, and (2) there is no thermal management system tocool the battery. In these calculations, the initial batterytemperature is assumed to be equal to ambient temperature.The net heat transfer is used to calculate the change in batterytemperature. Temperature is an input to the cycle life model,which computes capacity loss at each time step usingtemperature, time and current drawn from the battery asinputs. Battery current is obtained based on the driving andcharging profile. The cycling life model also takes theprevious capacity loss history into account duringcalculations. The set of calculations performed at each timestep are given in Equations 1 and 2.
(1)
(2)
In these equations, subscript t refers to time step t. T is thebattery temperature, Ṫ is the change in battery temperaturewhich is assumed to be constant over Δt, Q̇GEN is rate of theheat generated in the battery, Q̇TR is the rate of heat removedfrom the battery, T∞ is the cabin air temperature entering intopack, Vair, ρair and cair are air speed, density and constantspecific heat respectively, Acell is the heat transfer area of acell, CCYC is percent cycling capacity loss, I is the currentdrawn from the battery, and R is internal resistance.
Daily storage fade (capacity loss when the battery is at rest) isevaluated using the calendar life model, assuming that thebattery is at ambient temperature when it is at rest. The totalcapacity fade at the end of the day is the sum of cycling andcapacity fade. Simulations corresponding to duration of oneweek are performed at each seasonal ambient temperature. Itwas observed from one week simulations that capacity fade isnot constant on daily basis, but there is a power functionrelationship between the number of days and capacity loss,where the power is equal to ½. Using this fact, capacity fadeprofile during the simulated one week period is extrapolatedto estimate fade during the remainder of the season. Batterylife is defined as the number of years passed until a totalcapacity loss of 20% reached. The evaluated system and thecalculations performed at each block of the simulation aredetailed in the following sections.
Daily Usage ProfileThe simulated vehicle - which is considered to have thespecifications of a PHEV conversion of a 2004 Toyota Prius -is assumed to make two trips in a day with the UrbanDynamometer Driving Schedule (UDDS). The dynamicpower profile needed to achieve this driving cycle is derivedby calculating the acceleration force as well as the resistanceforces such as air and rolling resistances as described inPeterson, 2010 [16]. After both trips are completed, thebattery is charged at a constant current of 4.6 amperes up to90% SOC, after which there is a rest period until the next trip.This daily profile is given in Table 1 and simulated for twocities: Miami and Phoenix. These two cities were selected to
Figure 1. Schematic view of simulations to calculate battery life.
Gratis copy for Tugce YukselCopyright 2012 SAE International
E-mailing, copying and internet posting are prohibitedDownloaded Wednesday, April 25, 2012 02:36:10 PM

satisfy modeling constraints while comparing cities withdifferent levels of seasonal variation. The ambienttemperature profile is obtained by dividing a year into fourseasons and using the average temperatures of each season asdaily ambient temperature. The seasonal averagetemperatures are given in Table 2.
Table 1. Daily Usage Profile Simulated.
Table 2. Seasonal Average Temperatures in SimulatedCities [°C] [24].
THERMAL MANAGEMENTMODELINGBattery PackIn this study, a battery pack similar to the A123 SystemsHymotion Li-ion battery pack is modeled. This is a kit toconvert a hybrid electric vehicle (HEV) to a PHEV, used inthe Toyota Prius conversion. This pack consists of 14modules, each module having 44 cylindrical cells, as shownin Figure 2 [25]. The pack is cooled by a fan which drawscabin air to the battery as shown in Figure 3 [20, 26]. Air isdivided into parallel flows so that each module has the sameamount of air passing through [21]. Therefore, in this study,only one module is modeled to represent the whole batterypack. The fan in Prius HEV works with an on-off controlstrategy and is not turned on until the battery temperaturereaches 35°C. Then it turns off again if the batterytemperature falls to 33°C [26]. In this study, the Hymotionpack fan is assumed to have the same on-off control strategywith Prius HEV. During driving and charging, it is assumedthat the driver conditions the cabin and keeps the cabintemperature at 24°C all the time. Therefore, during drivingand charging, the air inlet temperature is 24°C. When thebattery is at rest, cabin air temperature is presumed to beequal to the ambient temperature. It is assumed that air entersthe pack at a constant flow rate when the fan is on.
Figure 2. A123 Hymotion Li-ion conversion batterypack.
Table 3. Hymotion Battery Pack Specifications [25].
Figure 3. Air cooling thermal management system [20].
Heat Generated in the BatteryThe heat generated inside the pack is modeled as:
(3)
I is the current drawn from each cell, which is calculatedfrom the power load on the battery using the relation I=P/V. Ris the internal resistance of the cell, a function of temperatureT and state-of-charge (SOC). Internal resistance maps arederived from the voltage-versus-capacity graphs given in themanufacturer's specifications [18]. N is the number of cells inthe battery.
Heat Transferred from the BatteryAlthough the real cell arrangement in the pack is neitherentirely aligned nor staggered, it has a mostly staggeredarrangement; therefore the pack is modeled as a staggeredbank of tubes as given in Figure 4. It is assumed that the cellsare constant temperature surfaces and also the temperaturedistribution is uniform throughout the module, sinceproviding uniform temperature distribution is a designcriterion in battery thermal management systems [20,27].
Gratis copy for Tugce YukselCopyright 2012 SAE International
E-mailing, copying and internet posting are prohibitedDownloaded Wednesday, April 25, 2012 02:36:10 PM
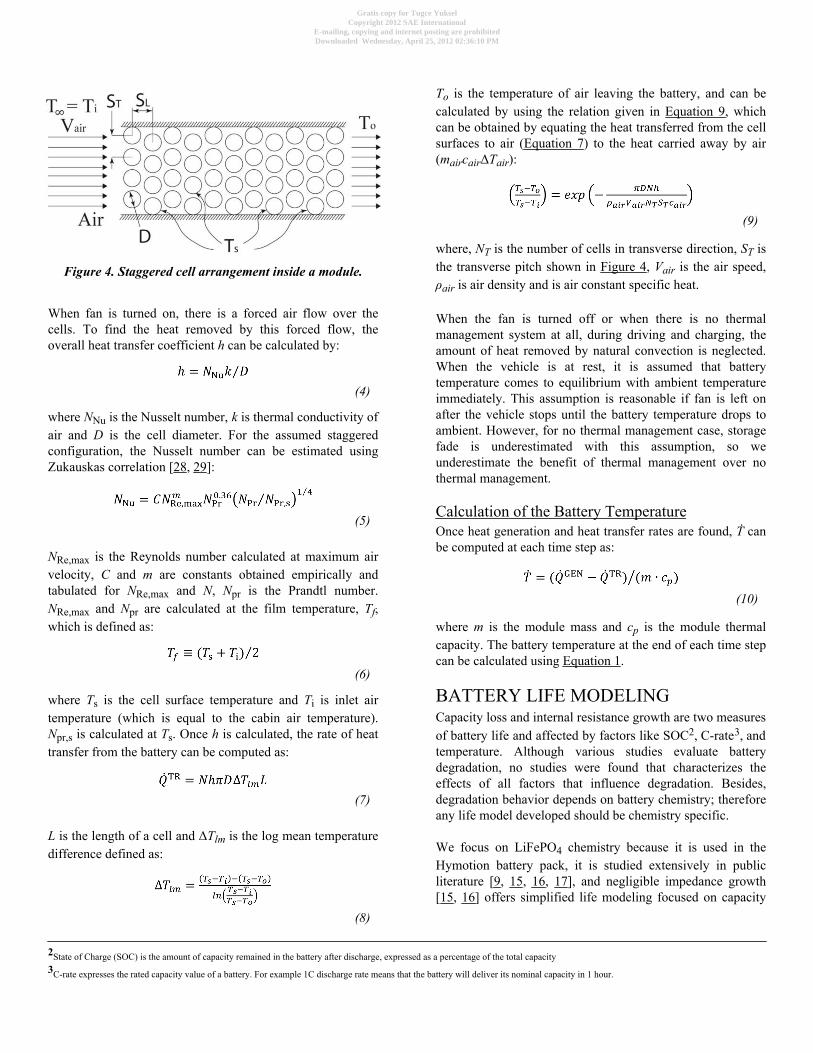
Figure 4. Staggered cell arrangement inside a module.
When fan is turned on, there is a forced air flow over thecells. To find the heat removed by this forced flow, theoverall heat transfer coefficient h can be calculated by:
(4)
where NNu is the Nusselt number, k is thermal conductivity ofair and D is the cell diameter. For the assumed staggeredconfiguration, the Nusselt number can be estimated usingZukauskas correlation [28, 29]:
(5)
NRe,max is the Reynolds number calculated at maximum airvelocity, C and m are constants obtained empirically andtabulated for NRe,max and N, Npr is the Prandtl number.NRe,max and Npr are calculated at the film temperature, Tf,which is defined as:
(6)
where Ts is the cell surface temperature and Ti is inlet airtemperature (which is equal to the cabin air temperature).Npr,s is calculated at Ts. Once h is calculated, the rate of heattransfer from the battery can be computed as:
(7)
L is the length of a cell and ΔTlm is the log mean temperaturedifference defined as:
(8)
To is the temperature of air leaving the battery, and can becalculated by using the relation given in Equation 9, whichcan be obtained by equating the heat transferred from the cellsurfaces to air (Equation 7) to the heat carried away by air(maircairΔTair):
(9)
where, NT is the number of cells in transverse direction, ST isthe transverse pitch shown in Figure 4, Vair is the air speed,ρair is air density and is air constant specific heat.
When the fan is turned off or when there is no thermalmanagement system at all, during driving and charging, theamount of heat removed by natural convection is neglected.When the vehicle is at rest, it is assumed that batterytemperature comes to equilibrium with ambient temperatureimmediately. This assumption is reasonable if fan is left onafter the vehicle stops until the battery temperature drops toambient. However, for no thermal management case, storagefade is underestimated with this assumption, so weunderestimate the benefit of thermal management over nothermal management.
Calculation of the Battery TemperatureOnce heat generation and heat transfer rates are found, Ṫ canbe computed at each time step as:
(10)
where m is the module mass and cp is the module thermalcapacity. The battery temperature at the end of each time stepcan be calculated using Equation 1.
BATTERY LIFE MODELINGCapacity loss and internal resistance growth are two measuresof battery life and affected by factors like SOC2, C-rate3, andtemperature. Although various studies evaluate batterydegradation, no studies were found that characterizes theeffects of all factors that influence degradation. Besides,degradation behavior depends on battery chemistry; thereforeany life model developed should be chemistry specific.
We focus on LiFePO4 chemistry because it is used in theHymotion battery pack, it is studied extensively in publicliterature [9, 15, 16, 17], and negligible impedance growth[15, 16] offers simplified life modeling focused on capacity
2State of Charge (SOC) is the amount of capacity remained in the battery after discharge, expressed as a percentage of the total capacity3C-rate expresses the rated capacity value of a battery. For example 1C discharge rate means that the battery will deliver its nominal capacity in 1 hour.
Gratis copy for Tugce YukselCopyright 2012 SAE International
E-mailing, copying and internet posting are prohibitedDownloaded Wednesday, April 25, 2012 02:36:10 PM

loss criteria. Cycling and storage capacity loss mechanismsare assumed to be decoupled and modeled separately.
Cycling FadeCycling capacity fade is modeled using data from A123Systems specification sheets for their LiFePO4/graphite basedANR26650M1 cells [18], in which they provide constantcharge/discharge capacity loss versus number of cycles atthree different temperatures: 25, 45 and 60°C. The constantdischarge/charge duty cycle is quite different than the UDDScycle simulated in this study. Therefore, using number ofcycles in the cycling degradation model would needmisleading results. In this paper, to reduce the discrepancydue to different duty cycles, the number of cycles isconverted to Ah- processed (IPR), the integral of absolutevalue of current over time. The literature suggests thatcapacity loss is a function of (IPR)z where z is a value near 0.5[9]. Using an Arrhenius type of relation for temperaturedependence, the fit given in Equation 11 is obtained, whereRgas is the universal gas constant, and T is the batterytemperature in Kelvin.
(11)
Using least-squares fit to data points extracted from [18]gives:
This model fits the data with R2= 0.98. Figure 5 shows thedata points and the fit.
Storage FadeUsing data from manufacturer's specifications [19], whichgives the storage fade with time at four differenttemperatures, the fit in Equation 12 is obtained, again usingleast squares regression.
(12)
This model form is selected because it is observed from datathat there is a linear relationship between the percent capacityloss and logarithm of time (in days). Data and fit at storage isgiven in Figure 6.
Figure 5. Capacity fade with cycling-Data and fit.
Figure 6. Capacity Fade at Storage-Data and Fit.
RESULTS AND DISCUSSIONFigures 7 and 8 give the daily temperature profile duringusage (2 trips and charging) in Miami and Phoenixrespectively. Fluctuations observed around 33°C are due tothe thermal fan on-off control strategy. Temperature riseduring charging is observed to be relatively low. When thereis no thermal management system, the temperature reaches amaximum value of 39°C in Miami, whereas in Phoenix themaximum temperature is about 43°C in summer. Thermalmanagement maintains the battery temperature below 35°C inboth cities.
Gratis copy for Tugce YukselCopyright 2012 SAE International
E-mailing, copying and internet posting are prohibitedDownloaded Wednesday, April 25, 2012 02:36:10 PM

Figure 7. Temperature profile obtained from driving andcharging simulations in Miami. (Battery temperature atrest is not shown in this graph since it is simply assumed
to be equal to ambient temperature.)
Figure 8. Temperature profile obtained from driving andcharging simulations in Phoenix. (Battery temperature
at rest is not shown in this graph since it is simplyassumed to be equal to ambient temperature.)
The change in capacity loss over 30 years is calculated forboth cases and the results are presented in Figures 9 and 10for Miami and Phoenix respectively. The results designatethat if a thermal management system is used, the battery has alonger life in Phoenix than in Miami. When thermalmanagement is not used in Miami, battery life decreases onlyone year, whereas a decrease of 3 years is observed inPhoenix.
Average seasonal temperatures in Phoenix are lower than orequal to the corresponding temperatures in Miami exceptduring the summer season. However, when there is nothermal management to cool the battery, battery life inPhoenix is ∼3 years shorter than the battery life in Miami.This shows the importance of high peak temperatures onbattery life, even if they are observed only in one fourth ofthe year. The effect of this high temperature season could bereduced by cooling the battery with air in Phoenix, where aircooling provides an estimated battery life improvement of23%. However, in Miami the improvement in battery life isonly 5%, corresponding to 1 year of additional battery life.This shows that the life improvement that can be obtainedwith a specific type of thermal management system, and/orthe decision to upgrade a thermal management systemdepends on the region where the vehicle is being used. Theresults also indicate that battery thermal management is mostcritical for peak temperatures. The results are summarized inTable 4.
Figure 9. Capacity Loss in Miami.
Gratis copy for Tugce YukselCopyright 2012 SAE International
E-mailing, copying and internet posting are prohibitedDownloaded Wednesday, April 25, 2012 02:36:10 PM

Figure 10. Capacity Loss in Phoenix.
Table 4. Summary of Results
ASSUMPTIONS/MODELLIMITATIONSThis paper presents the preliminary results of an ongoingstudy evaluating the effect of thermal management on batterylife. The models presented here therefore have somelimitations that will be addressed in future work. Inparticular, the battery life models used in this study arederived using data for a limited range of temperatures, andtrends are extrapolated for lower temperatures. When storagelife models are extrapolated to temperatures lower than 15°C,counterintuitive trends are observed. We selected cities toavoid temperatures below 15°C; however, becausedegradation rates are primarily driven by peak temperatures,errors in degradation rates at low temperatures may be lesscritical. Secondly, real-world driving profiles, which tend tobe more aggressive than EPA test cycles, should be simulated
to obtain more realistic battery life results. In addition, sinceresults significantly depend on peak temperatures, higherresolution temperature data, such as hourly or dailytemperature averages should be used instead of seasonalaverages to improve estimates.
In thermal management, providing uniform temperaturedistribution is a design criterion. In this study, it was assumedthat the system modeled satisfies this criterion by maintaininga negligible temperature variance across the pack. However,since temperature variance will cause some cells degradefaster than others, it is still necessary to check the validity ofthis assumption in future studies by using tools likecomputational fluid dynamics analysis. In addition, naturalconvection and pack conduction, ignored in this study, maybe important when there is no forced air flow over the cells.Moreover, the assumption that battery temperature reachesambient immediately when the vehicle is at restunderestimates storage fade. If the fan runs using ambient airafter parking, we estimate that the pack can be cooled towithin 5% of ambient temperature in less than 25 minutes foran extreme case of 30°C battery temperature at the momentthe vehicle stops and 15°C ambient temperature. This time isreduced if pre-conditioned cabin air is used or if thetemperature difference is smaller. Because 25 minutes is lessthan 5% of total storage time, we expect the effect of thissimplification on calendar fade to be second order. However,for the case of no thermal management, the time needed tocool down to ambient temperature would be longer, causingincreased storage fade. By ignoring the time taken for thebattery to cool down when at rest, we underestimate thebenefit of thermal management over no thermal management.Therefore, it is necessary in future work to assess the actualtemperature profile of the battery at rest and use that profilein storage fade calculations. We also explore only limitedthermal control strategies, assuming fixed thresholdtemperatures for turning the thermal management system onand off. We observe that decreasing the fan onset temperatureby 2°C can extend battery life by as much as 10 percent, sofurther examination of control parameters is necessary tounderstand optimal operating conditions for comparison.Likewise, changing air flow rate may affect resultssignificantly. In future work, we intend to analyze sensitivityof results to these variables and address the model limitationsdescribed above.
SUMMARY/CONCLUSIONSWe present an analysis to estimate the improvement inbattery life in PHEVs by air-cooling the battery using anintegrated thermal management and battery degradationmodel for a battery pack with LiFePO4/graphite cellchemistry. Daily simulations were performed in two cities,Miami and Phoenix, using a constructed daily driving andcharging profile and seasonal average ambient temperatures.Thermal management provided a better improvement in
Gratis copy for Tugce YukselCopyright 2012 SAE International
E-mailing, copying and internet posting are prohibitedDownloaded Wednesday, April 25, 2012 02:36:10 PM

Phoenix, where higher peak temperatures are observed. It wasalso observed that the battery life in Phoenix is shorter than inMiami even though the temperature in Phoenix is lower thanMiami half of the year. These results suggest that theimprovement that can be obtained by thermal managementdepends on the region where the vehicle is being used, andbattery thermal management is most critical for peaktemperatures. Future work will address the identified modellimitations to improve accuracy of estimates andcomparisons.
REFERENCES1. Michalek, J., Chester, M., Jaramillo, P., Samaras, C.,Shiau, N. & Lave, L., “Valuation of Plug-in Vehicle LifeCycle Air Emissions and Oil Displacement Benefits,”Proceedings of the National Academy of Sciences, 108(40):16554-16558, 2011, doi: 10.1073/pnas.1104473108.2. Axsen, J., Burke, A.F., & Kurani, K.S., “Batteries forPHEVs: Comparing Goals and State of Technology,” Electricand Hybrid Vehicles: Power Sources, Model, Sustainability,Infrastructure and the Market, ed Pistoia, G. (Elsevier,Amsterdam, The Netherlands), 2010, pp 405-427.3. Delucchi, M. & Lipman, T., “Lifetime cost of battery,fuel-cell, and plug-in hybrid electric vehicles,” Electric andHybrid Vehicles: Power Sources, Model, Sustainability,Infrastructure and the Market, ed Pistoia, G (Elsevier,Amsterdam, The Netherlands), 2010, pp 19-60.4. Markel, T., Brooker, A., Gonder, J., O'Keefe, M.,Simpson, A. & Thornton, M., “Plug-in Hybrid VehicleAnalysis,” National Renewable Energy Laboratory,Milestone Report, 2006.5. Shiau, N., Kaushal, N., Hendrickson, C., Peterson, S.,Whitacre, J., & Michalek, J., “Optimal Plug-In HybridElectric Vehicle Design and Allocation for Minimum LifeCycle Cost, Petroleum Consumption, and Greenhouse GasEmissions,” Journal of Mechanical Design, 132:091013-1,2011, doi: 10.1115/1.4002194.6. Peseran, A.A., Markel, T., Tataria & Howell, D., “BatteryRequirements for Plug-In Hybrid Electric Vehicles-Analysisand Rationale,” presented at 23rd International ElectricVehicle Symposium, Anaheim, California, USA, December2-5, 2007.7. Broussely, M., “Aging Mechanisms and Calendar-LifePredictions in Lithium-Ion Batteries,” Advances in Lithium-Ion Batteries, ed van Schalkwijk, W.A & Scrosati, B (KluwerAcademic/Plenum Publishers, New York), 2002, pp 393-432.8. Thomas, E.V., Bloom, I., Christophersen, J.P. & Battaglia,V.S., “Statistical methodology for predicting the life oflithium-ion cells via accelerated degradation testing,” Journalof Power Sources, 184: 312-317,2008, doi: 10.1016/j.jpowsour.2008.06.017.9. Wang, J., Liu, P., Hicks-Garner, J., Sherman, E.,Soukiazian, S., Verbrugge, M., Tataria, H., Musser, J. &
Finamore, P., “Cycle-life model for graphite-LiFePO4 cells,”Journal of Power Sources, 196: 3942-3948, 2011, doi:10.1016/j.jpowsour.2010.11.134.
10. Hall, J.C., Lin, T., Brown, G., Biensan, P. & Bonhomme,F., “Decay Process and Life Predictions for Lithium IonSatellite Cells,” presented at 4th International EnergyConversion Engineering Conference and Exhibit, California,USA, June 26-29, 2006.
11. Christophersen, J.P., Bloom, I., Thomas, E.V., Gering,K.L., Henriksen, G.L., Battaglia, V.S., & Howell, D.,“Advanced Technology Development Program For Lithium-Ion Batteries: Gen 2 Performance Evaluation Final Report,”Idaho National Laboratory, July 2006.
12. Broussely, M., “Battery Requirements for HEVs,PHEVs, and EVs: An Overview,” Electric and HybridVehicles: Power Sources, Model, Sustainability,Infrastructure and the Market, ed Pistoia, G (Elsevier,Amsterdam, The Netherlands), 2010, pp 305-347.
13. Zhang, Y., Wang, C., & Tang, X., “Cycling degradationof an automotive LiFePO4 lithium-ion battery,” Journal ofPower Sources, 196: 1513-1520, 2011, doi: 10.1016/j.jpowsour.2010.08.070.
14. Amine, K., Liu, J., & Belharouak, I., “High-temperaturestorage and cycling of C- LiFePO4/graphite Li-ion cells,”Electrochemistry Communications, 7: 669-673, 2005, doi:10.1016/j.elecom.2005.04.018.
15. Liu, P., Wang, J., Hicks-Garner, J., Sherman, E.,Soukiazian, S., Verbrugge, M., Tataria, H., Musser, J. &Finamore, P., “Aging Mechanisms of LiFePO4 BatteriesDeduced by Electrochemical and Structural Analyses,”Journal of The Electrochemical Society, 157(4): A499-A507,2010, doi: 10.1149/1.3294790.
16. Peterson, S., Apt, J. & Whitacre, J.F., “Lithium-ionbattery cell degradation resulting from realistic vehicle andvehicle-to-grid utilization,” Journal of Power Sources, 195:2385-2392, 2010, doi: 10.1016/j.jpowsour.2009.10.010.
17. Li, Z., Lu, L., Ouyang, M. & Xiao, Y., “Modeling thecapacity degradation of LiFePO4/graphite batteries based onstress coupling analysis,” Journal of Power Sources, 196:9757-9766, 2011, doi: 10.1016/j.jpowsour.2011.07.080.
18. A123 Systems, “ANR26650M1A Cells Data Sheet”http://www.a123systems.com/products-cells-26650-cylindrical-cell.htm.
19. A123 Systems, “Development of Battery Packs for SpaceApplications,” presented at NASA Aerospace BatteryWorkshop, USA, November 27-29, 2007.
20. Pesaran, A.A., “Battery Thermal Management in EVsand HEVs: Issues and Solutions,” presented at AdvancedAutomotive Battery Conference, Nevada, USA, February 6-8,2001
Gratis copy for Tugce YukselCopyright 2012 SAE International
E-mailing, copying and internet posting are prohibitedDownloaded Wednesday, April 25, 2012 02:36:10 PM

21. Ma, Y., Teng, H., and Thelliez, M., “Electro-ThermalModeling of a Lithium-ion Battery System,” SAE Int. J.Engines 3(2):306-317, 2010, doi:10.4271/2010-01-2204.22. Kim, G.H. & Peseran, A.A., “Battery ThermalManagement System Design Modeling,” presented at 22ndInternational Battery, Hybrid and Fuel Cell Electric VehicleConference and Exhibition, Yokohoma, Japan, October23-28, 2006.23. Gross, O. and Clark, S., “Optimizing Electric VehicleBattery Life through Battery Thermal Management,” SAE Int.J. Engines 4(1):1928-1943, 2011, doi:10.4271/2011-01-1370.24. NOAA Satellite and Information Service, “U.S. ClimateNormals”, http://cdo.ncdc.noaa.gov/cgi-bin/climatenormals/climatenormals.pl.25. A123 Systems, “Hymotion L5 Plug-in ConversionModule Spec-sheet”, http://www.hymotion.com/hymotion/pdf/L5_SpecSheet.pdf.26. Zolot, M., Pesaran, A., and Mihalic, M., “ThermalEvaluation of Toyota Prius Battery Pack,” SAE TechnicalPaper 2002-01-1962, 2002, doi:10.4271/2002-01-1962.27. Pesaran, A.A., Burch, S., & Keyser, M., “An Approachfor Designing Thermal Management Systems for Electric andHybrid Vehicle Battery Packs,” presented at the FourthVehicle Thermal Management Systems Conference andExhibition, London, UK, May 24-27, 1999.28. Incropera, F.P. & De Witt, D.P., “Fundamentals of Heatand Mass Transfer,” John Wiley and Sons, ISBN0-471-30460-3, 1996.29. Zhukauskas, A., & Ulinskas, R., “Heat Transfer in TubeBanks in Crossflow,”: Hemisphere Pub. Corp., New York,ISBN 0-89116-685-8, 1988
CONTACT INFORMATIONTugce YukselResearch AssistantDepartment of Mechanical EngineeringCarnegie Mellon UniversityPittsburgh, PA [email protected]
Jeremy MichalekAssociate ProfessorDepartment of Mechanical EngineeringDepartment of Engineering and Public PolicyCarnegie Mellon UniversityPittsburgh, PA [email protected]
ACKNOWLEDGMENTSThe authors wish to thank Professor Shawn Litster and themembers of the Vehicle Electrification Group and the DesignDecisions Laboratory at Carnegie Mellon University; Dr.Kandler Smith and Dr. Shriram Santhanagopalan at theNational Renewable Energy Laboratory; Dr. Ted Miller atFord Motor Company; Mr. Bill Reinert, Mr. JeffreyMakarewicz and Dr. Monique Richard at Toyota MotorCorporation; Mr. Oliver Gross at Chrysler Group LLC; andDr. Philip Stephenson and Dr. Yang Chen at A123 Systems,Inc. for their valuable guidance, suggestions, and feedback.This work was supported in part by a Fulbright grant from theU.S. Department of State Bureau of Educational and CulturalAffairs, a grant from the National Science FoundationCAREER program #0747911, and a grant from Toyota MotorCorporation. Any opinions, findings, and recommendationsexpressed are those of the authors and do not necessarilyreflect the views of the sponsors.
The Engineering Meetings Board has approved this paper for publication. It hassuccessfully completed SAE's peer review process under the supervision of the sessionorganizer. This process requires a minimum of three (3) reviews by industry experts.
All rights reserved. No part of this publication may be reproduced, stored in aretrieval system, or transmitted, in any form or by any means, electronic, mechanical,photocopying, recording, or otherwise, without the prior written permission of SAE.
ISSN 0148-7191
Positions and opinions advanced in this paper are those of the author(s) and notnecessarily those of SAE. The author is solely responsible for the content of the paper.
SAE Customer Service:Tel: 877-606-7323 (inside USA and Canada)Tel: 724-776-4970 (outside USA)Fax: 724-776-0790Email: [email protected] Web Address: http://www.sae.orgPrinted in USA
Gratis copy for Tugce YukselCopyright 2012 SAE International
E-mailing, copying and internet posting are prohibitedDownloaded Wednesday, April 25, 2012 02:36:10 PM