Effect of the mixing velocity and the active chlorine .... Azeroual, A. Dani, B. Bejjany*, H....
12
Azeroual et al., JMES, 2017, 8 (8), pp. 2769-2780 2769 JMES, 2017 Volume 8, Issue 8, Page 2769-2780 http://www.jmaterenvironsci.com/ 2’JP2E2016, 24-25 Oct. 2016, FP-Taza 1. Introduction The water quality entering to sewage treatment plants is increasingly affected by the contamination of persistent organic compounds from different branches of industry, chemical, pharmaceutical, agri-food, etc. Pollutants commonly found in industrial and urban discharges include synthetic dyes, which causes many disturbances to aquatic fauna and constitute a risk to human health. With a view to degrading this pollution, several processes have been subject of researches, and the choice of the most suitable technology depends, in part, on the physico- chemical characteristics of the effluent, on its final destination and on the economic feasibility of the process. Special attention has been paid to electrochemical oxidation processes (direct or indirect oxidation) for the treatment of these effluents. These techniques are clean and flexible for the development of new methods for the treatment of wastewater [1,2]. For direct oxidation, there is a direct effect on a species in solution when the electron is exchanged exclusively on the electrode, while the indirect oxidation consists in generating a powerful oxidizing agent which reacts with organic pollutants. Among these oxidizing agents, there is Ag 2+ and Co 3+ [3,4]. The indirect action may also be obtained by oxidation of the halides (Cl – , Br – or I – ) or by reduction of the dissolved oxygen, the reactions of which make it possible to generate strong oxidants such as HClO, HBrO, IOH. In particular, Canizares and al. [5] have proved that hypochlorite acid (HClO) is a strong oxidant capable of oxidizing and modifying the structure of organic molecules and producing less toxic components. The in situ generation of active chlorine has been widely applied in the treatment of sewer water [6], dyes such as methyl violet (MV2B), Eosin Yellowish (EOY), Trypan Blue (TRB) ACridine Orange (ACO) [7], textile dyes [8], tannery wastewater [9], and pesticides such as atrazine [10]. Indeed, the electrolytic production of active chlorine is one of the most important industrial electrochemical reactions [8, 11] and its use for the disinfection of drinking water has expanded greatly [12,13]. Then, the research of Zaviska and al. [7,10] demonstrated that the direct effect ofin situ generation of active chlorine is only 10%, whereas the indirect effect Journal of Materials and Environmental Sciences ISSN : 2028-2508 Copyright © 2017, University of Mohammed Premier Oujda Morocco Effect of the mixing velocity and the active chlorine concentration in anolyte on the indirect electrochemical oxidation of the Acid Red35 dye. N. Azeroual, A. Dani, B. Bejjany*, H. Mellouk, K. Digua Laboratory of Process Engineering and Environment, Faculty of Sciences and Techniques of Mohammedia, Hassan II University of Casablanca, Morocco Abstract The main objective of this work is to study the effect of the agitation rate and the concentration of active chlorine on the efficiency of the degradation of the Acid Red35(AR35) dye by indirect electrochemical oxidation. The experimental tests were carried out in a stirred tank with a reaction volume of approximately 350 mL. The Reynolds number is set to a high value so that the mixture is perfect. The synthetic solution of the dye at a concentration of 20 mg∙L -1 and the initial pH of the anolyte used for the treatment is between 3.2 and 4.4. The stirring velocity has a very limited effect on the degradation of the dye for a 16.6% added anolyte volume fraction containing 210 ppm of active chlorine. For the same volume fraction of anolyte and a stirring velocity of 300 rpm, the temporal evolution of the dye concentration shows that the time required for an 80% reduction has increased from 3 to 40 minutes for Chlorine, respectively, of 440 and 120 ppm. The effectiveness of the treatment of the synthetic solution of the AR35 dye increases as the concentration of active chlorine increases. In addition, empirical correlations expressing the results were developed based on curve fitting. These correlations estimate the time required for the degradation of the AR35 dye as a function of the volume added of the anolyte and the yield of the discoloration as a function of the reaction time for different concentrations of active chlorine. Received 9Jan 2017, Revised 5Apr 2017, Accepted 7Apr 2017 Keywords Acid Red35 dye, indirect electrochemical oxidation, anolyte, stirred tank, active chlorine Abbreviations AR35: Acid Red35 ECA: ElectroChemical Activation RMSE : Root Mean Square Error NRMSE: Normalized Root Mean Square Error [email protected] ,
Transcript of Effect of the mixing velocity and the active chlorine .... Azeroual, A. Dani, B. Bejjany*, H....

Azeroual et al., JMES, 2017, 8 (8), pp. 2769-2780 2769
JMES, 2017 Volume 8, Issue 8, Page 2769-2780
http://www.jmaterenvironsci.com/
2’JP2E2016, 24-25 Oct. 2016, FP-Taza
1. Introduction The water quality entering to sewage treatment plants is increasingly affected by the contamination of persistent
organic compounds from different branches of industry, chemical, pharmaceutical, agri-food, etc. Pollutants
commonly found in industrial and urban discharges include synthetic dyes, which causes many disturbances to
aquatic fauna and constitute a risk to human health. With a view to degrading this pollution, several processes
have been subject of researches, and the choice of the most suitable technology depends, in part, on the physico-
chemical characteristics of the effluent, on its final destination and on the economic feasibility of the process.
Special attention has been paid to electrochemical oxidation processes (direct or indirect oxidation) for the
treatment of these effluents. These techniques are clean and flexible for the development of new methods for the
treatment of wastewater [1,2]. For direct oxidation, there is a direct effect on a species in solution when the
electron is exchanged exclusively on the electrode, while the indirect oxidation consists in generating a
powerful oxidizing agent which reacts with organic pollutants. Among these oxidizing agents, there is Ag2+
and
Co3+
[3,4]. The indirect action may also be obtained by oxidation of the halides (Cl–, Br
– or I
–) or by reduction
of the dissolved oxygen, the reactions of which make it possible to generate strong oxidants such as HClO,
HBrO, IOH. In particular, Canizares and al. [5] have proved that hypochlorite acid (HClO) is a strong oxidant
capable of oxidizing and modifying the structure of organic molecules and producing less toxic components.
The in situ generation of active chlorine has been widely applied in the treatment of sewer water [6], dyes such
as methyl violet (MV2B), Eosin Yellowish (EOY), Trypan Blue (TRB) ACridine Orange (ACO) [7], textile
dyes [8], tannery wastewater [9], and pesticides such as atrazine [10]. Indeed, the electrolytic production of
active chlorine is one of the most important industrial electrochemical reactions [8, 11] and its use for the
disinfection of drinking water has expanded greatly [12,13]. Then, the research of Zaviska and al. [7,10]
demonstrated that the direct effect ofin situ generation of active chlorine is only 10%, whereas the indirect effect
Journal of Materials and Environmental Sciences ISSN : 2028-2508
Copyright © 2017,
University of Mohammed Premier
Oujda Morocco
http://www.jmaterenvironsci.com/
Effect of the mixing velocity and the active chlorine concentration in anolyte on
the indirect electrochemical oxidation of the Acid Red35 dye.
N. Azeroual, A. Dani, B. Bejjany*, H. Mellouk, K. Digua
Laboratory of Process Engineering and Environment, Faculty of Sciences and Techniques of Mohammedia,
Hassan II University of Casablanca, Morocco
Abstract
The main objective of this work is to study the effect of the agitation rate and the
concentration of active chlorine on the efficiency of the degradation of the Acid
Red35(AR35) dye by indirect electrochemical oxidation. The experimental tests were
carried out in a stirred tank with a reaction volume of approximately 350 mL. The
Reynolds number is set to a high value so that the mixture is perfect. The synthetic
solution of the dye at a concentration of 20 mg∙L-1
and the initial pH of the anolyte used
for the treatment is between 3.2 and 4.4. The stirring velocity has a very limited effect
on the degradation of the dye for a 16.6% added anolyte volume fraction containing 210
ppm of active chlorine. For the same volume fraction of anolyte and a stirring velocity
of 300 rpm, the temporal evolution of the dye concentration shows that the time
required for an 80% reduction has increased from 3 to 40 minutes for Chlorine,
respectively, of 440 and 120 ppm. The effectiveness of the treatment of the synthetic
solution of the AR35 dye increases as the concentration of active chlorine increases. In
addition, empirical correlations expressing the results were developed based on curve
fitting. These correlations estimate the time required for the degradation of the AR35
dye as a function of the volume added of the anolyte and the yield of the discoloration
as a function of the reaction time for different concentrations of active chlorine.
Received 9Jan 2017,
Revised 5Apr 2017,
Accepted 7Apr 2017
Keywords
Acid Red35 dye,
indirect electrochemical
oxidation,
anolyte,
stirred tank,
active chlorine
Abbreviations
AR35: Acid Red35
ECA: ElectroChemical
Activation
RMSE : Root Mean
Square Error
NRMSE: Normalized Root
Mean Square Error

Azeroual et al., JMES, 2017, 8 (8), pp. 2769-2780 2770
is predominant. For this reason, the electrochemical activation technique (ECA) shows promise from an
environmental and economic point of view. The method consists in chemically activating of brine in order to
generate in the anode compartment of the electrochemical cell a solution called anolyte. It is composed of active
molecules such as active chlorine, which can reach a concentration of 500 ppm (for an initial concentration of
NaCl between 800 and 1000 ppm), free radicals and highly reactive ions [14]. Although chlorine gas is the
initial product of electrochemical oxidation of chloride ions, other species may be formed depending on the pH
of the system. Consequently, active chlorine is a term used to designate the concentration of three highly
oxidizing chlorine species, namely molecular chlorine (Cl2), hypochlorous acid (HOCl) and hypochlorite (OCl−)
ions [15]. All are collectively called active chlorine.
Some authors have pointed out that several other radicals such as chlorine radicals (Cl°, ClO° and Cl2°) can be
formed during the electrochemical generation of active chlorine and have higher oxidation potentials than active
chlorine Cl° / Cl– = 2.410 V / ENH, E0 Cl2°/ 2Cl
– = 2.090 V / ENH, E0 Cl2 / 2Cl
– = 1.395 V / ENH) [16,17].
With all these active elements, the anolyte is capable of reacting rapidly and non-selectively on most persistent
organic compounds [18]. Design considerations and operational factors for systems using chlorine are still being
studied to optimize these systems.
In this study, the anolyte generated from the electrochemical activation process of brine is the oxidizer used for
the indirect oxidation of the AR35 textile dye in a stirred tank at atmospheric pressure and ambient temperature.
This type of dye was chosen as the target compound because it is found abundantly in the liquid effluents of the
textile industries. The effect of different parameters on the evolution of the coloration removal efficiency as a
function of the reaction time is discussed in order to show the importance of each parameter and to elaborate
useful correlations for the sizing of the reactors. The parameters followed are the stirring speed, the volume
fraction in added anolyte, the pH and the concentration of active chlorine in the anolyte.
2. Materials and methods 2.1. Materials
Anolyte: supplied by the company Alternatech subsidiary of "Envirolyte France", is a solution recovered from
the anode part of the Electrochemical Activation system ECA, it is a colorless liquid, its pH is very acid from (2
to 4.5), with a characteristic odor of chlorine. The anolyte is characterized by a high oxidation potential in the
range +1200 to +1500 mV. It is made up of several efficient and non-selective oxidizing agents: chlorine
(Cl2dissolved), hypochlorite acid (HClO), hydrogen peroxide (H2O2), ozone (O3), hydroxyl radicals and chlorine
radicals, which contribute to the powerful oxidizing properties of the anolyte. The various dissolved chlorine
species (molecular chlorine (Cl2), hypochlorous acid (HOCl) and hypochlorite ions (ClO−) are called active
chlorine [19, 28, 29]. The relative amount of each of these forms of free chlorine is dependent on the pH of the
anolyte and temperature. At room temperature, Cl2 (aq) is the dominant species under very acidic conditions,
HOCl predominates at 3.3 <pH <7.5, while ClO− is the main species at pH> 7.5. Starting with pH = 4, the
hypochlorite is transformed into hypochlorous ions (ClO−) less active than HOCl and Cl2. Control of the pH of
the anolyte is a critical factor for the operation of the reactor for treating water containing a dye.
Acid Red35 dye: The synthetic solution of AR35 dye of chemical formula C19H15N3Na2O8S2 (CAS 6441-93-6).
Its chemical structure was given in Figure 1 is used to simulate industrial wastewater. For all the experiments
carried out in this study, the initial solution is prepared by diluting 20 mg of the dye, in powder form, in one liter
of distilled water (C0 = 20 mg∙L-1
).
Potassium iodide, acetic acid, sodium thiosulfate and starch (analytical grade-SigmaAldrich) are used for
titration of active chlorine contained in the anolyte.
Figure1. Chemical structure of AR35.

Azeroual et al., JMES, 2017, 8 (8), pp. 2769-2780 2771
2.2. Methods
The measurement of the active chlorine content is very important in our case because the quality of the anolyte
is controlled by its concentration of active chlorine and its pH.
The concentration of active chlorine present in the anolyte is determined via the iodometric standard volumetric
method by titration with thiosulfate [19].And the initial pH of the anolyte is measured by a pH meter of brand-
name (PHM 240 PH / ion meter MeterlabTM).The pH of the reaction mixture after addition of the anolyte
remains virtually neutral during the treatment of the colored solution.
The degradation of the dye is carried out by the addition of the anolyte which is realized in a vessel that has a
diameter of 80 mm as shown inFigure 2. The mixture is provided by a magnetic bar of cylindrical shape with a
length of 28 mm and a diameter of 5 mm and stirring speed is adjusted by a magnetic stirrer from the brand
(AGIMATIC N). The absorbance is monitored by a UV / visible spectrophotometer (HITACHI High-
Technologies Co.,Tokyo-Japan, model U5100 RATIO BEAM)using a 10 mm wide quartz cell.IRspectra were
obtained on a FTIR (Bruker Vector 22spectrometer) and reported in wave numbers (cm-1
).
Figure 2: Experimental design
In this study, the residual AR35 dye concentration was measured to evaluate the performance of the treatment
by addition of the anolyte to various operating conditions: agitation velocity, the amount of added anolyte and
the concentration of active chlorine in the anolyte. The dye concentration is determined indirectly by measuring
the absorbance at a wavelength of 515 nm which corresponds to a peak in the absorption spectrum. The volume
of the synthetic solution of the dye is fixed at 300 mL.
3. Results and discussion 3.1. UV-VIS analysis
Figure 3 shows the temporal evolution of the absorption spectrum of the reaction mixture consisting of the
synthetic solution of the AR35 dye with an initial concentration of 20 mg.L-1
(C0 = 20 mg.L-1
), and a volume of
50 mL of the anolyte with a concentration of 480 ppm of active chlorine. The rate of stirring is set at 300 rpm.
The scanning is carried out between the wavelengths 200 and 700 nm. An absorption peak is located in the
visible spectrum between 430 and 610 nm with a maximum absorbance at the wavelength 515 nm (λmax = 515
nm). After three minutes of reaction, the absorbance increases from 0.3 (before the addition of the anolyte) to
0.035, this corresponds to an 88% decrease in absorbance. During the processing time, the absorbance becomes
very low for wavelengths that are greater than 400 nm. The evolution of the absorbance in the visible range is
synonymous with a chemical transformation of the synthetic solution by indirect oxidation of the dye by the
oxidants contained in the anolyte and particularly the active chlorine. Throughout the treatment, the

Azeroual et al., JMES, 2017, 8 (8), pp. 2769-2780 2772
predominant peak corresponding to the wavelength λmax = 515 nm disappears after 37 min. Therefore, the
absorbance at 515 nm can be used to evaluate the degradation performance of the dye.
Figure 3: UV-vis spectrum at different treatment times (τr = 3, 7.5, 37.3 and 163 min) with C0 = 20 mg.L
-1, 50mL of
anolyte of 480 ppm of active chlorine, and a rate of stirring of 300 rpm
In the UV range, where the wavelength is included in our study between 200 and 400 nm, three net absorption
peaks are observed for the synthetic solution of the dye before the addition of the anolyte. These peaks are
located at 230, 310 and 380 nm. Indeed, the intensities of the bands at 310 and 380 nm decreases greatly, this is
mainly caused by changes in the centers of aromatic character in the dye molecule [20]. After three minutes of
oxidation of the dye, an absorption peak appears at 345 nm and is greatly decreased. Another one appears at 220
nm and the absorbance remains virtually identical to this wavelength until a treatment time of 7.5 minutes
(τr≤7.5). For τr≥37.3, the absorbance begins to decrease slowly. This can be explained by the formation of a
transient species during the fragmentation of the dye molecule and that this species requires a very long time to
react compared to others. The absorbance peak at 260 nm may be associated with an excess of oxidants
originally contained in the anolyte and formed during the reaction between Cl2and O3 [21]. According to the
same work [21], the disinfection by-product ClO2– is generated as an intermediate of the reaction between
excess active chlorine and ozone, and that (Cl2 + ClO2–) absorbs at the wavelength 360 nm. In this study, the
absorption peak at the wavelength 360 nm is not observed, so it can be concluded that there are no disinfection
by-products (ClO2– and even ClO3
– , which is generated by the reaction of active chlorine and ClO2
– [22]). The
formation of such undesired products has often been mentioned in the case of chlorination of wastewater (Sellar,
1974, Jolley, 1975). Generally, the incorporation of halogen atoms into an organic molecule results in increased
risks in terms of toxicity, bioaccumulation or persistence. Arber et al. (1984) compare the effects of chlorination
of wastewater with increasing chlorine levels at different positions on the breaking point curve according to
bacteriological and chemical criteria. The best results in disinfection are obtained in the presence of free
chlorine, a situation in which the formation of organochlorine derivatives, such as trihalomethanes, is also
maximal. Whereas in our case several other investigations carried out on electrochemical oxidation by chlorine
have proved the absence of its degradation by-products.
Indirect oxidation byt headdition of anolyte generated by ECA appears to be suitable for discoloration of the
synthetic solution of AR35 dye. In the rest of this study, we measured the absorbance at 515 nm for the
evaluation of the performance of the treatment of the synthetic solution of the AR35 dye for various operating
conditions because the variation in the absorbance at this wavelength is very important. Measurement of the

Azeroual et al., JMES, 2017, 8 (8), pp. 2769-2780 2773
absorbance at λmax=515 nm for different dye concentrations between 0 and 20 mg.L-1
made it possible to obtain
a calibration curve whose evolution is linear. Therefore, the residual dye concentration is deduced from equation
(1).
𝐶(𝑅𝑒𝑑35) = 62.03 ∗ 𝐴𝑏𝑠 𝜆=515𝑛𝑚 (1)
The coefficient of determination R2 for the establishment of this linear regression equation is almost equal to 1
(R2 = 0.9996). Therefore, this equation explains 100% of the distribution of points with a very low error.
The performance of the treatment of the AR35 dye is also evaluated by the yield calculated by equation (2).
𝑅 % =𝐶0−𝐶𝑡
𝐶0∗ 100 =
𝐴𝑏𝑠0−𝐴𝑏𝑠𝑡
𝐴𝑏𝑠0∗ 100(2)
With,
C0 and Abs0 are respectively the dye concentration and the absorbance at the wavelength 515 nm before the
addition of the anolyte (τ = 0 s).
Ct and Abst are respectively the dye concentration and the absorbance at the wavelength 515 nm at a time τ after
the addition of the anolyte which corresponds to a reaction time τr.
3.2. IR analysis
The mechanism behind effective decoloration and degradation of AR35 dye was investigated by means of IR
analyses of the traited solution.
4000 3000 2000 1000 0
60
70
80
90
100
110
120
130
trans
mita
nce
wave number (cm-1)
B
Figure 4: IR Spectrum of the treated solution of AR 35 dye
As shown in figure 4 the IR Spectrum contains three bands:
a-Strong and very wide absorption band between 2900 and 3700 cm-1
b-Medium and sharp band at 1635cm-1
c-Strong band between 500 and 800cm-1
After analyzing the spectrum (Figure 4) and verifying the existence of each of the conventional absorption
bands (see document "IR analysis of the treated solution of the AR35 dye" attached). The spectrum is thus
identified as that of a compound containing a characteristic group of a carboxylic acid. Indeed, there is a broad
absorption band between 2900 and 3700 cm-1
, and a thin strip around 1635 cm-1
. An N-H bond may also be
present because our spectrum contains a mean band between 1500-1700 cm-1
which characterizes this bond. In
addition, a strong band exists in our spectrum between 500-800 cm-1
corresponds to the C-Cl bond as the
treatment of the dye is carried out by anolyte which contains active chlorine. So to conclude these last two
connections can be existed with that of the carboxylic acids demonstrated at the top.
Azeroual et al., JMES, 2017, 8 (8), pp. 2769-2780 2774
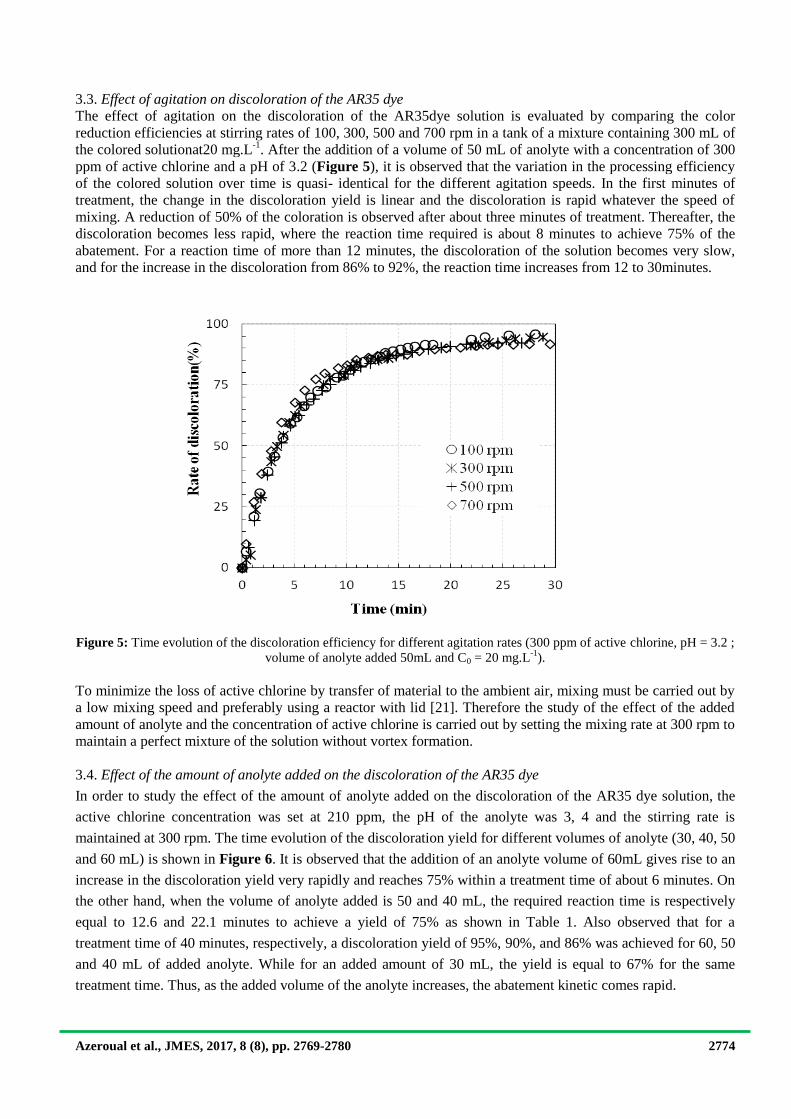
3.3. Effect of agitation on discoloration of the AR35 dye
The effect of agitation on the discoloration of the AR35dye solution is evaluated by comparing the color
reduction efficiencies at stirring rates of 100, 300, 500 and 700 rpm in a tank of a mixture containing 300 mL of
the colored solutionat20 mg.L-1
. After the addition of a volume of 50 mL of anolyte with a concentration of 300
ppm of active chlorine and a pH of 3.2 (Figure 5), it is observed that the variation in the processing efficiency
of the colored solution over time is quasi- identical for the different agitation speeds. In the first minutes of
treatment, the change in the discoloration yield is linear and the discoloration is rapid whatever the speed of
mixing. A reduction of 50% of the coloration is observed after about three minutes of treatment. Thereafter, the
discoloration becomes less rapid, where the reaction time required is about 8 minutes to achieve 75% of the
abatement. For a reaction time of more than 12 minutes, the discoloration of the solution becomes very slow,
and for the increase in the discoloration from 86% to 92%, the reaction time increases from 12 to 30minutes.
Figure 5: Time evolution of the discoloration efficiency for different agitation rates (300 ppm of active chlorine, pH = 3.2 ;
volume of anolyte added 50mL and C0 = 20 mg.L-1
).
To minimize the loss of active chlorine by transfer of material to the ambient air, mixing must be carried out by
a low mixing speed and preferably using a reactor with lid [21]. Therefore the study of the effect of the added
amount of anolyte and the concentration of active chlorine is carried out by setting the mixing rate at 300 rpm to
maintain a perfect mixture of the solution without vortex formation.
3.4. Effect of the amount of anolyte added on the discoloration of the AR35 dye
In order to study the effect of the amount of anolyte added on the discoloration of the AR35 dye solution, the
active chlorine concentration was set at 210 ppm, the pH of the anolyte was 3, 4 and the stirring rate is
maintained at 300 rpm. The time evolution of the discoloration yield for different volumes of anolyte (30, 40, 50
and 60 mL) is shown in Figure 6. It is observed that the addition of an anolyte volume of 60mL gives rise to an
increase in the discoloration yield very rapidly and reaches 75% within a treatment time of about 6 minutes. On
the other hand, when the volume of anolyte added is 50 and 40 mL, the required reaction time is respectively
equal to 12.6 and 22.1 minutes to achieve a yield of 75% as shown in Table 1. Also observed that for a
treatment time of 40 minutes, respectively, a discoloration yield of 95%, 90%, and 86% was achieved for 60, 50
and 40 mL of added anolyte. While for an added amount of 30 mL, the yield is equal to 67% for the same
treatment time. Thus, as the added volume of the anolyte increases, the abatement kinetic comes rapid.

Azeroual et al., JMES, 2017, 8 (8), pp. 2769-2780 2775
Figure 6: Time evolution of the discoloration yield for various volumes added to the anolyte (210 ppm of active chlorine,
pH = 3.4, Ci = 20 mg L-1
and stirring speed of 300 rpm)
Table 1: Treatment time for different rates of discoloration (40, 50, 65 and 75%)
Rate of
discoloratio
n
Volume of
anolyteadded, Va
(mL)
τr (min) τr/τr(50 mL) Va/ 50(mL) τr|mod(min) Error
40%
30
16.06 4.226 0.6 16.06 0%
40
6.6 1.737 0.8 6.77 -3%
50 3.8 1 1 3.47 9%
60 1.99 0.524 1.2 2.01 -1%
50%
30
22.7 4.408 0.6 22.53 1%
40
9 1.748 0.8 9.51 6%
50 5.15 1 1 4.87 5%
60 2.7 0.524 1.2 2.82 4%
65%
30 37.65 4.461 0.6 37.39 1%
40 15.05 1.783 0.8 15.77 -5%
50
8.44 1 1 8.08 4%
60 4.42 0.524 1.2 4.67 -6%
75%
40
22.1 1.754 0.8 22.53 -2%
-2% 50 12.6 1 1 11.54 8%
8% 60 6.3
0.5 1.2 6.68 -6%
-6%
The addition of an anolyte volume of 50 mL makes it possible to achieve a discoloration yield of 50% and 75%
respectively at 5.15 and 12.6 minutes. These times may be considered reasonable for the treatment of water
containing dyes. Indeed, the time τ1/2 for a similar treatment with the addition of H2O2 coupled with UV was the
order of 5.8 min for the degradation of two acid dyes namely Acid Red1 and Acid Yellow23at 20 mg.L-1
[23]. For a rate of discoloration of 75% in less than 13 min can satisfy the dimension of a reactor [24]. Indeed, a 15
min residence time is required for the pilot scale electrochemical treatment of the waste water with a current
density of 3mA.cm-2
and a feed rate of 0.3 m3h
-1 [25]. Then, the addition of 50 mL of anolyte, which represents

Azeroual et al., JMES, 2017, 8 (8), pp. 2769-2780 2776
about 16% relative to the volume of the colored water to be treated, can be considered as a reference state. An
increase in the volume of anolyte by 10 mL, which corresponds to a 20% increase in volume, results in a
reduction of about 50% in the reaction time. On the other hand, this reaction time increases by 75% when the
volume of anolyte is reduced by 20%. For a 40% reduction in the amount of anolyte added, it is necessary to
increase the reaction time by 4 times to reach 40, 50 and 65% on the rate of discoloration (Table 1).
The evolution of the reaction time as a function of the volume added to the anolyte, for different discoloration
efficiencies, is identical and follows a power law (Figure 7). The correlation of the experimental points, using
this law, made it possible to establish an equation making it possible to estimate the reaction time necessary to
achieve a given discoloration yield (equation 3).
𝝉𝒓 = 𝑲𝝉 ∗ 𝑽𝒂−𝟑 (3)
The values of the constant Kτ are grouped in Table 2.
Figure7: Comparison of experimental and estimated effect of the volume of added anolyte on the reaction time
This correlation makes it possible to correctly estimate the reaction time (R2 converges to 1) for the different
discoloration yields. As shown in Table1, the maximum error for estimating the reaction time is 9%. This
correlation can be used for dimensioning a colored water treatment reactor. Indeed, for a reaction time
previously fixed as a function of the flow rate of the colored waters to be treated, it is possible to evaluate the
amount of anolyte necessary to achieve a given discoloration yield.
Table 2: Values of constant K for different rates of discoloration (40, 50, 65 and 75 %)
The volume added to the anolyte is none other than the quantity of active chlorine used for the treatment of
colored water. The effect of the active chlorine concentration in the anolyte on the reaction time required to
achieve a given discoloration yield is studied by keeping the reference volume set at 50 mL which is about 16%
of the volume of the colored water to be treated.
Rate of
discoloration 𝑲𝝉 × 𝟏𝟎+𝟓(𝒎𝒊𝒏. 𝒄𝒎−𝟑)
40%
4.34
50%
6.08
65% 10.10
75%
14.42
Azeroual et al., JMES, 2017, 8 (8), pp. 2769-2780 2777
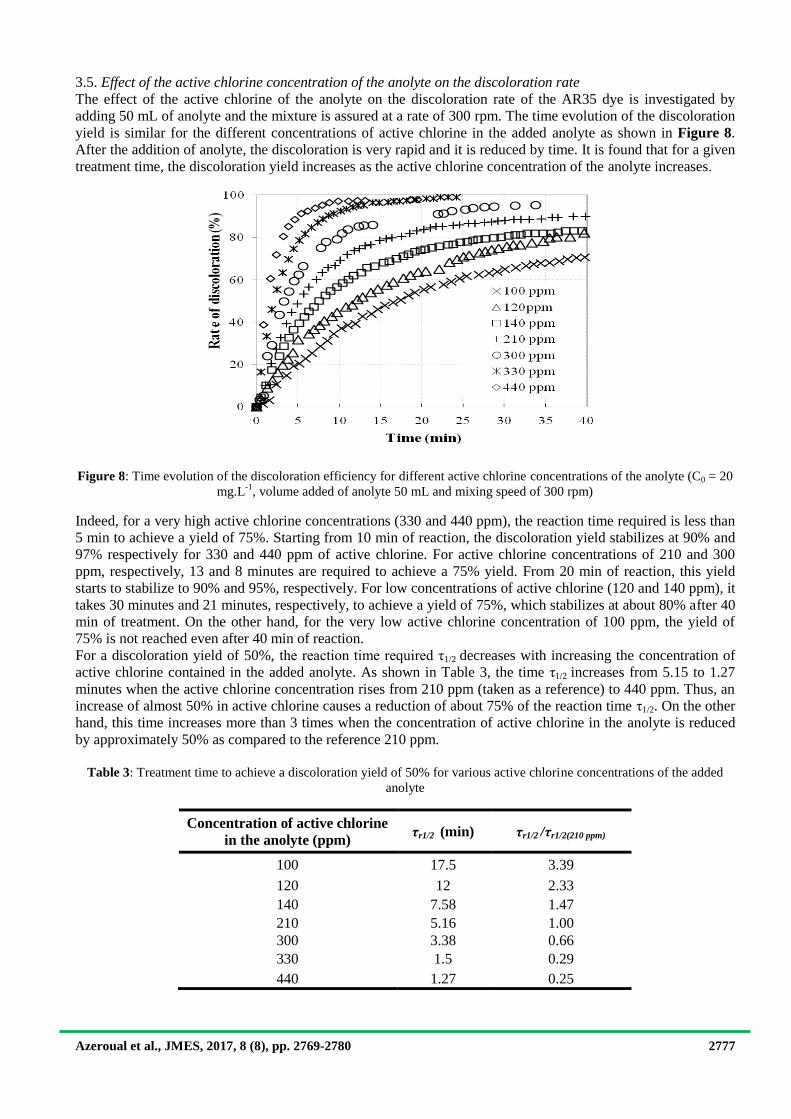
3.5. Effect of the active chlorine concentration of the anolyte on the discoloration rate
The effect of the active chlorine of the anolyte on the discoloration rate of the AR35 dye is investigated by
adding 50 mL of anolyte and the mixture is assured at a rate of 300 rpm. The time evolution of the discoloration
yield is similar for the different concentrations of active chlorine in the added anolyte as shown in Figure 8.
After the addition of anolyte, the discoloration is very rapid and it is reduced by time. It is found that for a given
treatment time, the discoloration yield increases as the active chlorine concentration of the anolyte increases.
Figure 8: Time evolution of the discoloration efficiency for different active chlorine concentrations of the anolyte (C0 = 20
mg.L-1
, volume added of anolyte 50 mL and mixing speed of 300 rpm)
Indeed, for a very high active chlorine concentrations (330 and 440 ppm), the reaction time required is less than
5 min to achieve a yield of 75%. Starting from 10 min of reaction, the discoloration yield stabilizes at 90% and
97% respectively for 330 and 440 ppm of active chlorine. For active chlorine concentrations of 210 and 300
ppm, respectively, 13 and 8 minutes are required to achieve a 75% yield. From 20 min of reaction, this yield
starts to stabilize to 90% and 95%, respectively. For low concentrations of active chlorine (120 and 140 ppm), it
takes 30 minutes and 21 minutes, respectively, to achieve a yield of 75%, which stabilizes at about 80% after 40
min of treatment. On the other hand, for the very low active chlorine concentration of 100 ppm, the yield of
75% is not reached even after 40 min of reaction.
For a discoloration yield of 50%, the reaction time required τ1/2 decreases with increasing the concentration of
active chlorine contained in the added anolyte. As shown in Table 3, the time τ1/2 increases from 5.15 to 1.27
minutes when the active chlorine concentration rises from 210 ppm (taken as a reference) to 440 ppm. Thus, an
increase of almost 50% in active chlorine causes a reduction of about 75% of the reaction time τ1/2. On the other
hand, this time increases more than 3 times when the concentration of active chlorine in the anolyte is reduced
by approximately 50% as compared to the reference 210 ppm.
Table 3: Treatment time to achieve a discoloration yield of 50% for various active chlorine concentrations of the added
anolyte
Concentration of active chlorine
in the anolyte (ppm) τr1/2 (min) τr1/2 /τr1/2(210 ppm)
100 17.5 3.39
120 12 2.33
140 7.58 1.47
210 5.16 1.00
300 3.38 0.66
330 1.5 0.29
440 1.27 0.25

Azeroual et al., JMES, 2017, 8 (8), pp. 2769-2780 2778
The residual active chlorine concentration should be minimized to avoid the production of disinfection by-
products [11] in order to comply with environmental discharge standards and to reduce the operating cost of the
water treatment plant. It is then preferred to use an anolyte with an active chlorine concentration of 120 ppm and
an anolyte fraction of about 16% since the treatment time required to achieve a 50% discoloration yield is 12
minutes, or a low volume of anolyte highly concentrated in active chlorine.
Under the operating conditions cited above, the discoloration yield can be estimated by equation (4) which has
been established by correlating the experimental points.
𝑹𝒎𝒐𝒅 (%) = 𝟏 −𝟏
𝟏 + 𝒌𝟏𝝉𝒓 𝒌𝟐 × 100 (4)
τ : reaction time of discoloration ofAR35 dye by anolyte (min),
k1 and k2: are constants that depend on the active chlorine concentration and the initial C0 concentration.
The determination of the constants k1 and k2, which depends on the active chlorine concentration, is carried out
by iterative calculation by minimizing the error between the experimental discoloration yield of the AR35 dye
and that estimated by equation (4). The values of these constants are grouped in Table 4.
To show that the correlation established (equation 4) correctly estimates the discoloration efficiency as a
function of the reaction time for the different concentrations of active chlorine, three indices of concordance are
used: the coefficient of determination R2, RMSE (Root Mean Square Error) and NRMSE (Normalized Root
Mean Square Error). The description of a real process by a mathematical model is better when the coefficient of
determination R2 converges to 1, RMSE and NRMSE are close to 0. These are often used in the literature
[26,27] given by the following formulas:
𝑅2 = 1 − (y𝑖 exp −y𝑖 mod )2𝑛𝑖=1
(y𝑖 exp −ӯexp )2𝑛𝑖=1
(5)
𝑅𝑀𝑆𝐸 = (y𝑖 exp −y𝑖 mod )2𝑛𝑖=1
𝑁
1/2
(6)
𝑁𝑅𝑀𝑆𝐸 =𝑅𝑀𝑆𝐸
(y𝑖 exp )max −(y𝑖 exp )min (7)
With: N: number of points compared;
yiexp: experimental value;
yimod: value obtained by applying the model;
Ӯiexp: mean experimental value;
(Yiexp) max and (Yiexp) min: maximum and minimum experimental value.
For each concentration of active chlorine, the values of the two constants k1 and k2 are determined as shown in
Table 4. It is noted that the coefficient of determination R2 is very close to 1,and that the two indices of
concordanceRMSE and NRMSE are close to 0, irrespective of the concentration of active chlorine. Then, it can
be considered that the discoloration yield estimated by the model (equation 4) is very close to the experimental
yield as shown in Figure 9.
Table 4: Constants k1 and k2 of the correlation and the coefficients RMSE, NRMSE and R
2
Concentration of active chlorine of
the anolyte (ppm) k1* 10
-2 k2 RMSE NRMSE R
2
100 3.52 1.47 0.011 0.015 0.997
120 5.65 1.37 0.010 0.013 0.998
140 10.9 1.15 0.089 0.010 0.957
210 18.1 1.11 0.025 0.027 0.990
300 8.63 2.63 0.028 0.029 0.993
330 9.5 3.83 0.003 0.003 0.9998
440 16.9 3.80 0.005 0.005 0.9996

Azeroual et al., JMES, 2017, 8 (8), pp. 2769-2780 2779
Using this correlation (equation 4), it is also possible to determine the reaction time required to achieve a given
discoloration yield:
𝝉𝒓(𝒎𝒊𝒏) =𝟏
𝒌𝟏 −𝟏 + 𝟏 −
𝑹𝒎𝒐𝒅 (%)
𝟏𝟎𝟎 −𝟏/𝒌𝟐
(8)
Figure 9: Comparison between the temporal evolution of the experimental discoloration yield of AR35 dye and estimated
by the mathematical model (equation 4)
It has been demonstrated by Zaviska et al. that the predominant reaction mechanism is the indirect effect of the
electric current corresponding to the oxidation of MV2B by the active chlorine (the 10% reduction would only
be related to the direct effect of the electric current). This indicates that the higher the initial concentration of
MV2B, the greater the active chlorine concentration required. The maximum active chlorine concentration
produced by their system was 150 ppm (after 1 h of 2A electrolysis with Ti / IrO2 as anodic electrode material).
It was also possible for Flavio et al. to produce up to 60 mg L-1
of active chlorine on a Ti / Sn0.99Ir0.01O2 anode.
The discoloration of a red 29 acidic textile dye (CI 16570) was also investigated in situ with electro-active
chlorine. The best conditions were found to be: NaCl pH 4, 25 mA.cm-2
and 6 h of electrolysis. It is important to
emphasize that in such a treatment (in-situ), the electrochemical kinetics can be limited either by the process of
supplying electro-activated species of the solution to the electrode, the solubility of chlorine gas in the solution.
Because chlorate can be generated by parasitic reactions of solution hypochlorite (transfer of matter) cases of
Zaviska et al. and Flavio et al. or by the electron transfer process (electrochemical reaction). Indeed, a difference
in the concentration of active chlorine produced can be explained by a difference in limitations.In our present
study, the concentrations of active chlorine employed at pH values of less than 4.5, ranging from 90 ppm up to
440 ppm batchwise, are relatively high, thus avoiding any limitation on the transfer of matter. Nevertheless, in
the case of the Nagata et al. study, the process is limited by an electronic transfer caused by an accumulation of
the ionic species in the vicinity of the electrodes, thus forming a diffusion layer.
Conclusion The addition of acidic anolyte with a pH of between 3 and 4 allowed a discoloration of the synthetic solution of
the dye AR35. The mixing rate does not have a significant effect on the discoloration efficiency. On the other
hand, the volume of the added anolyte is a key parameter for reactor operation because the reaction time is
inversely proportional to the volume of anolyte at power 3 (Va3). The active chlorine concentration in the
anolyte has a remarkable effect on the processing time and the discoloration yield.

Azeroual et al., JMES, 2017, 8 (8), pp. 2769-2780 2780
For a good operation of the reactor for treating this water containing the AR35dye, it is necessary to avoid the
formation of the disinfection by-products. It is preferable to use an anolyte with an active chlorine concentration
of 120 ppm and an anolyte fraction of approximately 16% since the processing time necessary to achieve a
discoloration yield of 50% is acceptable (τr1/2 = 12 min) or a low volume of anolyte highly concentrated in active
chlorine.
Acknowledgments-The authors thank Zakia ZMIRLI for the help with the experimental apparatus. Thanks
also to H. Labjer for her contribution in IR analyses.
References 1. Drogui P., Blais J.F., Mercier G., Recent Patent Eng. 1 (2007) 257-272.
2. Panizza M., Cerisola G., Environ. Sci. Technol. 38 (2004) 5470-5475.
3. Sequeira C.A.C., Santos D.M.F., Brito P.S.D., Applied Surface Science. 252 (2006) 6093–6096.
4. Racaud Ch., Savall A., Rondet Ph., Bertrand N., Groenen-Serrano K., Chemical Engineering Journal. 211-
212 (2012) 53-59. ISSN 1385-8947.
5. Canizares P., Lobato J., Paz R., Rodrigo M.A., Saez C.J., Rodrigo M.A., Water Research 39 (2005) 2687-
2703
6.Drogui P., Bureau M.A., Blais J.F., Mercier G., Demande de brevet canadien. N° CA 2,511,091, (2006).
7. Zaviska F., Drogui P., Mercier G., Blais J.F., J Appl. Electrochem. 39 (2009) 2397-2408.
8. Oliveira F.H., Osugi M.E., Paschoal F.M.M., Profeti D., Olivi P., Zanoni M.V.B., J Appl. Electrochem. 37
(2007) 583–592.
9. Vijayaraghavan K., Ramanujam T.K., Balasubramanian N., Journal of Environmental Engineering.124 (9)
(1998) 887-891.
10. ZaviskaF., Drogui P., Blais J.F., Mercier G., Lafrance P., Journal of Hazardous Materials 185 (2011)1499-
1507.
11. Xie Y.F., CRC Press LLC (2004).
12. Kraft A., Stadelmann M., Blaschke M., Kreysig D., Sandt B., Schröder F., Rennau J., J. Appl. Electrochem.
26 (1999) 861-868.
13. Rudolf M., RousarI., Krisa J., J. Appl. Electrochem. 25 (1995) 155-165.
14. Jeong J., Kimb Ch., Yoonb J., Water Research. 43 (2009) 895 – 901.
15. Casson LW., Bess JW Jr., CRC Press LLC (2003).
16. Spyrkowicz L., KaulSN.,Neti RN., Satyanarayan S., Water Research. 39 (2005) 1601-1613.
17. Hepel M., Luo J., Electrochim. Acta 47 (2001) 729-740.
18. Azni I., Katayon S., Global Nest. The Int. J. 4 (2/3) (2002) 139 -144.
19. Callaway JO In., Clesceri LS., Greenberg AE., Trussel RR., 17th edn. Alpha Awwa-WPCF, Washington,
DC, Part 4000 (1989) 62.
20. Zollinger H., Color chemistry, 2nd
edn. V.C.H. Publishers, New York (1991).
21. Hyunju S., Min Ch., Jaeeun K., Byungtaek O.,Hyenmi Ch., Jeyong Y., Water Research 39 (2005) 721–727.
22. Peintler G., Nagypal I., Epstein, I.R., J. Phys. Chem. 94 (1990) 954–958.
23. Shu H-Y., Huang Ch-R., Chang M-Ch., Chemosphere. 29 (12) (1994) 2597-2607.
24. ZaviskaF. Journal of Water Science 22 (4) (2009) 535-564.
25. Feng C., Sugiura N., Shimada S., Maekawa T., J. Hazard. Mater. 103 (2003) 65-78.
26. Esrael D., INSA de Lyon, (2015). Français. <NNT : 2015ISAL0134>. <tel-01277663>.
27. Lazar L., Talmaciu A.I., Volf I., Popa V.I., (2016) 6.
28. Snoeyink V.L., Jenkins D., Journal of chemical education John Wiley & Sons, New York, (1980) 386.
29. Ghernaout D., Naceur M.W., Aouabed A., Desalination, 270 (2011) 9–22.
(2017) ; http://www.jmaterenvironsci.com/