Effect of Elastic Blade Deformation on Trim and Vibratory ...

Effect of the Initial Out-of-Straightness on the Lateral Torsional
Buckling Strength of Steel Beams
Ming Li
Thesis submitted to the
Faculty of Graduate and Postdoctoral Studies
in partial fulfillment of the requirements
for the degree of Master of Applied Science in Civil Engineering
Department of Civil Engineering
Faculty of Engineering
University of Ottawa
© Ming Li, Ottawa, Canada, 2017
ii
Abstract
The effect of initial out-of-straightness of steel beams with wide flange cross-sections on their
elastic lateral torsional buckling strength is investigated analytically and numerically. A variational
principle is first developed and then used to obtain the governing equilibrium conditions and
associated boundary conditions for a beam with general patterns of initial out-of-straightness and
initial angles of twist. The principle is then used to develop a finite element formulation to
characterize the lateral torsional response of beams with initial out-of-straightness under general
transverse loading. The validity of the finite element formulation is verified through comparison
against results from models based thin-walled beam finite element and shell element models
available in ABAQUS. Since the load lateral displacement responses do not exhibit a distinct point
of loss of stability, two design criteria are proposed for the characterization of the failure. The first
criterion is based on a threshold value for additional lateral displacement and the second criterial
is based on a threshold value for the normal stresses. Both criteria are applied in conjunction with
the analytical solution and finite element formulation in order to determine a moment resistance
based on lateral torsional buckling that incorporates the effect of initial out-of-straightness. The
moment capacity based on the displacement-based criterion is shown to solely depend on the ratio
between the initial out-of-straightness component associated with the first buckling mode and the
additional displacement threshold value specified. To the contrary, moment capacity based on the
stress criterion, was found to depend upon the initial out-of-straightness magnitude, the normal
stress threshold value and the geometry of the cross-section.
The effects of the above parameters on the predicted moment capacity were investigated for beams
with common sections in a systematic parametric study. Possible means of modifying the present
provisions of CAN-CSA S16 relating to elastic lateral torsional buckling to incorporate the effect
of initial out-of-straightness effects are discussed and illustrated through examples.
The load-deformation plots for beams with initial out-of-straightens as predicted by the
formulations developed in the present study are then used to extend the Southwell plot technique,
originally developed for buckling of column with initial out-of-straightness, to the lateral torsional
buckling of beams with initial out-of-straightness. The study shows that the plot, either
experimentally or analytically obtained, of the applied load versus lateral displacement, at any
point or angle of twist at any section, for a beam with initial out-of-straightness case can predict

iii
(a) the elastic critical moment of an analogous initially straight beam, and (b) the first buckling
mode contribution to the initial out-of-straightness.

iv
Acknowledgements
I would have never accomplished my thesis without the guidance of my supervisor Dr. Magdi
Mohareb. I would like to convey my profound gratitude to Dr. Magdi Mohareb for sharing his
prominent knowledge and expertise in the technical problems and editing hence his great patience
to guide me to finish a tough job like this thesis. I will always cherish those meetings we had and
carry forward what I learned throughout my future study and work.
I would also like to thank my colleagues Dr. Arash Sahraei and Mr. Huade Cao for their help and
suggestions.
Finally, I would like to thank my parents for their financial and moral support, and my girlfriend
Tong Zeng for her sacrifice and encouragement through the tough moments.

v
TABLE OF CONTENTS
Abstract ....................................................................................................................................... ii
Acknowledgements .................................................................................................................... iv
TABLE OF CONTENTS ............................................................................................................ v
LIST OF SYMBOLS ................................................................................................................. ix
LIST OF ACRONYMS ............................................................................................................ xii
LIST OF FIGURES ................................................................................................................. xiii
LIST OF TABLES ................................................................................................................... xvi
1. Introduction ........................................................................................... 1
1.1 Background ...................................................................................................................... 1
1.2 Lateral torsional buckling behavior of straight versus initially crooked beams .............. 1
1.3 Design standard provisions for beams ............................................................................. 3
1.3.1 Canadian steel design standard ................................................................................. 3
1.3.2 American steel design standard ................................................................................ 6
1.3.3 Australian Standards ............................................................................................... 10
1.3.4 The Eurocode Standard ........................................................................................... 12
1.3.5 Comparison of approaches of various standards .................................................... 14
1.4 Motivation of present study............................................................................................ 14
1.5 Research Objectives ....................................................................................................... 15
1.6 Outline of the thesis........................................................................................................ 15
Appendix 1. A ........................................................................................................................... 17
2. Literature review ......................................................................................... 18
2.1 LTB for beams with initial geometric imperfections ..................................................... 18
2.2 Studies related to the Eurocode 3 buckling provisions for beams or beam-columns .... 20
vi
2.3 Probabilistic and Stochastic studies on LTB of beams with initial geometric imperfections
22
2.4 The Southwell plot and its extension to lateral torsional buckling ................................ 22
2.5 Conclusions .................................................................................................................... 24
3. Finite element for the lateral torsional response of beams with initial geometric
imperfections ............................................................................... 26
3.1 Scope and Objective ....................................................................................................... 26
3.2 Statement of the problem and Notation.......................................................................... 26
3.3 Assumptions ................................................................................................................... 27
3.4 Formulation .................................................................................................................... 28
3.4.1 Total potential energy ............................................................................................. 28
3.4.2 Closed form Solution for beam under uniform moments ....................................... 31
3.4.3 Finite element formulation ...................................................................................... 33
3.5 Convergence study and verification for a perfectly straight beam................................. 35
3.6 Verification for a beam with initial geometric imperfections ........................................ 38
3.6.1 Mesh sensitivity analysis ........................................................................................ 38
3.6.2 Comparison with other solutions ............................................................................ 39
3.6.3 Verification and Comparisons ................................................................................ 40
3.7 Effect of the IOS pattern on response for beams under uniform moments .................... 41
3.7.1 Effect of IOS/IAT patterns...................................................................................... 42
3.7.2 Contribution of higher modes ................................................................................. 45
3.8 Proposed design criteria for beams with initial geometric imperfections ...................... 46
3.8.1 Verification of stresses ............................................................................................ 47
3.8.2 Applying the displacement failure criterion-Illustrative Example.......................... 48
3.8.3 Illustrative example for applying stress failure criterion ........................................ 49
3.9 Parametric study ............................................................................................................. 55
vii
3.9.1 Effect of beam span on bending moment and normal stress ratios ......................... 55
3.9.2 Effect of section class on normalized bending moments and normal stress ........... 56
3.10 Summary and Conclusions ......................................................................................... 56
Appendix 3.A. Matrices in Finite Element Solution................................................................. 58
4. Parametric study for proposed design equations ..................................................... 60
4.1 Objectives ....................................................................................................................... 60
4.2 Considered beams for the parametric study ................................................................... 60
4.3 Moment ratios based on threshold displacement criterion ............................................. 61
4.3.1 Formulation ............................................................................................................. 61
4.3.2 Extension of the approach to other loading cases ................................................... 66
4.3.3 Effect of span .......................................................................................................... 68
4.3.4 Nominal moment resistance based on displacement criterion ................................ 68
4.4 Moment ratio based on the threshold stress criterion ..................................................... 70
4.4.1 Formulation ............................................................................................................. 70
4.4.2 Comparison and Verification .................................................................................. 73
4.4.3 Effect of slenderness ............................................................................................... 75
4.4.4 Effect of initial out-of-straightness and yield stress fraction .................................. 76
4.4.5 Effect of slenderness ............................................................................................... 78
4.4.6 Effect of cross-section parameters .......................................................................... 79
4.4.7 Moment resistance ratios for other loading cases ................................................... 82
4.4.8 Extension of the analytical solution to other loading cases .................................... 86
4.4.9 Nominal moment resistance based on stress criterion ............................................ 92
4.5 Summary and Conclusions ............................................................................................. 93
Appendix 4.A ............................................................................................................................ 95

viii
5. Estimating critical moments for perfectly straight beams from the lateral torsional
response of initially crooked beams............................................................................... 96
5.1 Introduction .................................................................................................................... 96
5.2 Theoretical Background ................................................................................................. 96
5.3 Extension of the Southwell plot technique to beams with non-uniform moments ........ 99
5.4 Extension of the technique to other displacements ...................................................... 102
5.5 Prediction of the IOS magnitude .................................................................................. 105
5.6 Effect of higher modes on the response ....................................................................... 108
5.7 Predicting the number of contributing modes .............................................................. 109
5.8 Summary and Conclusions ........................................................................................... 111
6. Summary and Conclusions ............................................................................................ 113
6.1 Summary ...................................................................................................................... 113
6.2 Conclusions .................................................................................................................. 114
6.3 Recommendations for Future Research ....................................................................... 115
Reference ....................................................................................... 117

ix
LIST OF SYMBOLS
A area;
B bimoment; b flange width; C moment gradient factor;
eC elastic buckling resistance for columns;
rC column buckling resistance;
wC warping constant;
d nodal displacement vector;
0d initial nodal displacement vector;
d total section height;
E modulus of elasticity;
crF elastic critical strength in American design provisions;
yF yield strength;
0F d external force vector induced by the IOS;
f nodal force vector;
G shear modulus;
1 2
T
H z vector of linear shape functions;
xI moment of inertia about x -aixs
yI moment of inertia about y -aixs
J Saint-Venant torsional constant;
K effective length factor;
tk twist restraint factor;
lk load height factor;
rk lateral rotation restraint;
ek elastic stiffness matrix;
gk geometric stiffness matrix;
L span;
el effective length;
pL length between yield failure and inelastic LTB;
rL length between inelastic and elastic LTB;
m sequence number; T
M nodal moment vector;
M applied moment;
iM inelastic lateral torsional buckling moment;
pM sectional plastic moment;

x
uM critical elastic moment;
YM sectional yield moment;
maxM Maximum moment along the span;
, ,A B CM M M Moment value at 4, 2,3 4L L L
crM elastic critical moment from the eigenvalue as determined from
eigen-value analysis
criM elastic critical moment for mode i ;
1 2,M M Equivalent nodal moment;
xM strong axis bending moment;
yM weak axis bending moment about y-axis;
q transverse load; U internal strain energy;
T
Nu vector of nodal lateral displacement;
T
0Nu vector of nodal initial lateral displacement;
u z additional lateral displacement at section shear centre as a
function of coordinate
0u z initial out-of-straightness (IOS) at section shear centre;
0 cu z IOS at the compression flange;
cu z additional peak lateral displacement at the compression flange;
cu z total out-of-straightness at the compression flange;
0 tu z IOS at the tension flange;
0 pu z peak IOS at either flange;
0 qu z IOS at the other flange corresponding to 0 pu ;
iu z lateral buckling shape corresponding to mode i ;
V load potential energy; v transverse displacement; w web thickness;
z longitudinal coordinate;
eZ effective section modulus;
LT recommended imperfection factor;
m moment modification factor in Australian Standard;
s slenderness reduction in Australian Standard;
stress fraction;
i eigen vector for buckling mode i ;
1 first buckling mode normalized by the peak IOS at the
compression flange
xi
3 third buckling mode normalized by the peak IOS at the
compression flange
z additional angle of twist;
z Total angle of twist;
0 z initial angle of twist (IAT);
i z twisting buckling function for mode i ;
T
Nθ vector of nodal angles of twist;
T
0Nθ vector of nodal initial angles of twist (IAT);
fitting coefficient for the nominal moment equation in stress
criterion load scaling factor;
e section slenderness in Australian Standards;
LT slenderness parameter in Eurocode 3;
yield to critical moment ratio; total potential energy; normal stress; column slenderness
LT intermediate coefficient in Eurocode 3;
resistance factor; residual stress pattern factor for columns;
LT lateral torsional buckling reduction factor;
i scaling factor for mode i ;
warping function of the cross-section

xii
LIST OF ACRONYMS
IOS Initial out-of-straightness;
IAT Initial angle of twist;
LTB Lateral torsional buckling;
TLOS Total lateral out-of-straightness;
TAT Total angle of twist;

xiii
LIST OF FIGURES
Figure 1.1 (a) Lateral torsional buckling configuration and (b) moment versus lateral displacement
relationship for straight and initially crooked beams ...................................................................... 2
Figure 1.2 Comparison between the design curves in CAN/CSA S16-14 and the elastic buckling
curve for (a) beams and (b) columns .............................................................................................. 6
Figure 1.3 Comparison between the design curves in ANSI/ASCI S360-10 and the elastic buckling
curve for (a) beams and (b) columns ............................................................................................ 10
Figure 1.4 Comparison between the design curves in AS 4100-1998 for beams ......................... 12
Figure 1.5 Comparison between the design curves in EN 1993-1-1: 1998 for beams for
recommended imperfection factor 0.21a , 0.34b , 0.49c and 0.76d (curves for b,c and d
not practical for W250X36 section) .............................................................................................. 14
Figure 3.1 Model under investigation and deformed configurations ............................................ 27
Figure 3.2 Displacement field for (a) cross-section and (b) plan view configuration for load
potential energy expression........................................................................................................... 31
Figure 3.3 Buckling shape for a 6-m span beam with W250X45 section under uniform bending
moments based on S4R model in ABAQUS ................................................................................ 37
Figure 3.4 First buckling mode for 6m straight beam based on a) present study, b) B31OS solution
and c) S4R solution ....................................................................................................................... 38
Figure 3.5 Lateral displacement at centroid at mid-span versus the number of elements used in the
present finite element solution (applied moment = 90.1kNm) ..................................................... 39
Figure 3.6 Bending moments versus total lateral displacement at the compression flange For
W250x45 section .......................................................................................................................... 40
Figure 3.7 Moment-lateral displacement relations for W250X18, W250X28, W250X45 and
W250X58 obtained from B31OS mode in ABAQUS .................................................................. 41
Figure 3.8 Illustration for the combination of IOS and IAT for (a) pattern a and (b) pattern b ... 43
Figure 3.9 Bending moments versus (a) peak total lateral out-of-straightness (TLOS) at section
mid-height and (b) total angle of twist (TAT) for 0 0,p qu u = (a) /1000 1,1L , (b)
/1000 1,0.325L , (c) /1000 1,0L , (d) /1000 1, 1L and (f) /1000 0,1L (peak lateral
displacement is 1000L in all cases) ........................................................................................... 44
xiv
Figure 3.10 Bending moments versus the peak total lateral out-of-straightness (TLOS) for the first
and third buckling modes superposition cases .............................................................................. 45
Figure 3.11 Geometric relationship for the projections of the applied moment on the bending axes
....................................................................................................................................................... 47
Figure 3.12 Comparison between normal stresses as determined by various techniques ............ 48
Figure 3.13 Bending moments versus total lateral displacement at compression flange midspan for
various IOS a) 0 /1000 6cu L mm b) 0 / 800 7.5cu L mm and c) 0 / 600 10cu L mm ..... 49
Figure 3.14 Peak normal stresses for 6m-span simply supported beams with a) W250X45 and b)
W250X18 ...................................................................................................................................... 51
Figure 3.15 Stress contours predicted by the present solution for top flange under a)
60.0 kNmM , b) 70.0 kNmM , c) 80.0 kNmM and d) 90.0 kNmM for simply
supported beam with W250X45 cross-section (scaling factor for width=10x scaling factor for span)
....................................................................................................................................................... 52
Figure 3.16 Normal stress ratio and percentage of normal stresses versus normalized peak
displacement for W250X18 (a b), W250X28 (c and d), W250X45 (e and f) and W250X58 (g and
h) ................................................................................................................................................... 55
Figure 3.17 (a) Normalized bending moments and (b) normalized normal stresses versus
normalized peak total lateral out-of-straightness (TLOS) for W250X45 with span from 5 m to 8 m
....................................................................................................................................................... 55
Figure 3.18 (a) Normalized bending moments and (b) stress ratios versus normalized peak total
lateral out-of-straightness (TLOS) for various classes ................................................................. 56
Figure 4.1 Moment resistance ratio based on displacement criterion for 21 common cross-sections
under uniform bending moment.................................................................................................... 66
Figure 4.2 Moment resistance ratio based on displacement criterion for considered sections under
(a) uniform distributed load and (b) point load at mid-span with three scenarios for out-of-
straightness .................................................................................................................................... 67
Figure 4.3 moment resistance ratio for W200X36 cross-section with varying spans .................. 68
Figure 4.4 Normalized nominal moment resistance for W150x14 section ( 180L ) (a) Elastic
range for various out-of-straightness values ( 1000,1500,2000,i ) and (b) total range for the
case 1000i ................................................................................................................................ 70

xv
Figure 4.5 Effect of yield to buckling moment ratio Y crM M on the moment resistance ratio for (a)
various out-of-straightness coefficient i and (b) various yield stress fractions ..................... 76
Figure 4.6 effect of slenderness on Moment resistance ratios of W200x36 for (a) various out-of-
straightness coefficient i and (b) various yield stress fraction on the moment resistance ratio –
All beams are under uniform moments ......................................................................................... 78
Figure 4.7 Effect of the span to flange width ratio on moment resistance ratio for beams under
uniform moment for various beam cross-sections ........................................................................ 79
Figure 4.8 . Effects of (a) flange thickness (b) section depth and (c) web thickness on moment
resistance ratio for W200x36 under uniform bending .................................................................. 82
Figure 4.9 Moment resistance ratio for considered sections under uniform moment, point load at
mid-span and UDL for (a) out-of-straightness i 1000, 1500 and 2000, (b) yield stress fraction
0.67, 0.70 and 0.75. Moment resistance ratio for W200X36 for (c) out-of-straightness
coefficients i 1000, 1500 and 2000, (d) yield stress fractions 0.67, 0.70 and 0.75 .......... 85
Figure 4.10 Proposed design curves based on stress target value 0.7 yF for 1000, 1500i L L
and 2000L (W150X14) .............................................................................................................. 93
Figure 5.1 Relation between the additional peak lateral displacement to the applied load ratio and
the additional peak lateral displacement (Southwell plot) .......................................................... 102
Figure 5.2 Southwell plot based on four types of displacement (a) lateral displacement at the
centroid at mid-span 2u L , (b) angle of twist about the centroid at mid-span / 2L , (c) lateral
displacement at centroid at location 4u L and (d) lateral displacement at the extreme fibre at
mid-span / 2cu L ..................................................................................................................... 105
Figure 5.3 Relation between (a) the peak lateral displacement and (b) the additional peak lateral
displacement and the applied load for the examined four cases ................................................. 108
Figure 5.4 Relation between the percentage difference between the predicted IOS and the input
IOS and the applied moment for case 2 ...................................................................................... 111
Figure 5.5 Normalized lateral displacement versus normalized coordinate of case 2 under 39.2kNm
and the predicted shapes by ........................................................................................................ 111

xvi
LIST OF TABLES
Table 1.1 Recommended values for imperfection factors for lateral torsional buckling curves .. 13
Table 1.2 Recommended values for lateral torsional buckling curves for cross-sections ............ 13
Table A1.3 Lateral rotation restraint factor rk ............................................................................. 17
Table 2.1 Comparison of variations of the Southwell plot studies (simply supported beams) .... 24
Table 3.1: Possible boundary conditions at ends 0z and z L ............................................... 30
Table 3.2: convergence study on the critical load......................................................................... 36
Table 3.3 Section dimensions and geometric properties for the examined cross-sections ........... 41
Table 3.4: Section properties for the four examined I-section class ............................................. 56
Table 4.1 Dimensions and section properties for the considered cross-sections in the parametric
study .............................................................................................................................................. 61
Table 4.2 Moment resistance ratios between the present finite element solution and the prediction
of Eq. (4.10) .................................................................................................................................. 65
Table 4.3 Percentage difference in predicted moment resistance ratio based on FEA critical
moment and CSA critical moment approach for Beams under uniform bending moment
( 11.54yEb F L , 0.70 and 2 1.0 ) ................................................................................. 74
Table 4.4 Percentage difference in predicted moment resistance ratio based on FEA critical
moment and CSA critical moment approach f or Beams under point load at mid-span
( 11.54yEb F L , 0.70 and 2 1.265 ) ............................................................................. 88
Table 4.5 Percentage difference in predicted moment resistance ratio based on FEA critical
moment and CSA critical moment approach f or Beams under point load at mid-span
( 11.54yEb F L , 0.70 and 2 1.36 ) ............................................................................... 89
Table 4.6 Percentage difference in predicted moment resistance ratio based on FEA critical
moment and CSA critical moment approach for Beams under uniform distributed load
( 11.54yEb F L , . 0.70 . and 2 1.13 ) .............................................................................. 90
Table 5.1 The predicted critical moment and magnitude of the IOS based on the considered range
for the applied moment ............................................................................................................... 102
Table 5.2 Predicted critical moment and the magnitude of the IOS based on the considered
displacement ............................................................................................................................... 104

xvii
Table 5.3 Assessment of Southwell plot technique to estimate IOS .......................................... 107

1
1. Introduction
1.1 Background
In the design for laterally unsupported steel beams, the resistance is often governed by the lateral
torsional buckling (LTB) mode of failure. For the idealized case of a perfectly straight beam with
a wide flange section subjected bent about the strong axis, the buckling point is associated with a
distinct bifurcation point at which the beam exhibits a sudden change in the deformation pattern
characterized by sudden lateral bending and twist. The buckling load level corresponding to such
a point of instability is detected by solving an eigenvalue problem. Real steel beams possess
inevitable initial out-of-straightness during the manufacturing process. Thus, unlike the idealized
case of a perfectly straight beam, when real beams are subjected to strong axis bending, they do
not exhibit a clear-cut point of bifurcation. Rather, such beams exhibit gradual lateral bending and
twist as the applied transverse loads are incrementally increased. When the applied loads approach
the theoretical buckling load of a perfectly straight beam, lateral displacements and twist tend to
become excessive, typically attaining threshold displacement and/or stress values prior to attaining
the critical loads determined for idealized perfectly straight beam. Thus, the lateral torsional
buckling resistance of a real beam is, in principle, inferior to that of a comparable straight beam.
The detrimental effect of initial crookedness on lateral torsional bucking resistance is reflected in
some of the structural steel design standards, but is omitted in others. Thus, the present study
intends to characterize the lateral torsional buckling strength reduction induced by the initial
crookedness of the beams. The following sections thus provide a review of lateral torsional
buckling provisions in international steel design standards with emphasis on aspects related to
initial crookedness.
1.2 Lateral torsional buckling behavior of straight versus initially crooked
beams
Consider a perfectly straight beam (configuration 1 in Figure 1.1). Upon the application of a
transverse load P , the straight beam deflects vertically by a displacement v from configuration 1
to configuration 2. The applied load is then assumed to increase by a factor and attain the value
P at the onset of buckling (Configuration 3) where the pre-buckling displacement is assumed to
increase to v . At configuration 3, the section has a tendency to buckle to Configuration 4 by

2
moving laterally to displacement bu and twisting through angle b (Configuration 4). The
corresponding load versus lateral displacement relation P - bu is depicted in Figure 1.1b where no
lateral displacements take place between 1-3 and a sudden displacement takes place between3-4.
The buckling load P is obtained through an eigenvalue analysis. In contrast, for beams with
initial out-of-straightness 0 0,u in the un-deformed state (configuration 1’) by incrementally
applying transverse load P, the section undergoes gradually increasing lateral displacement u and
angle of twist as depicted by the nonlinear loading path 1-2’-3’4’ and asymptotically approach
the buckling load P from below. The behavior is fundamentally different from that of a perfectly
straight beam and no clear-cut buckling load exist. Thus, it would be of interest trace the nonlinear
load deformation path 1’-2’-3’-4’. At a given lateral displacement (or a given stress), the difference
P between the buckling load based on a perfectly straight beam and that for an initially crooked
beam is measure of loss of lateral torsional buckling loss of strength of the member due to initial
out-of-straightness. As will be shown in the following sections, this loss in strength has been
considered in some but not all structural steel design standards.
v
vP
PP
bu
1
2
3 4
1'
2'
3'
4'
1u 2u 3u
b
1
2
3
1P
2P
3P
(a)
1
2
34
1'
2'
3'
4'
P
u0u
P
(b)
Figure 1.1 (a) Lateral torsional buckling configuration and (b) moment versus lateral displacement
relationship for straight and initially crooked beams

3
1.3 Design standard provisions for beams
In various national design standards for steel members, discrepancies are observed in determining
the LTB resistance for beams depending on whether the detrimental effect of the initial geometric
imperfection has been accounted for or not. Thus, design provisions for beams are demonstrated
to present the discrepancies in this section.
1.3.1 Canadian steel design standard
For laterally unsupported members with doubly symmetric sections subjected to bending in
CAN/CSA S16-14, the moment resistance rM is classified by the section class. For beams with
class 1 and 2 sections, the moment resistance rM is computed based on the sectional plastic
moment pM . For class 3 and 4 sections, the sectional yield moment YM is used in calculating the
moment resistance. The following narrative is based on beams with class 1 and 2 sections. The
boundary conditions are assumed simply supported with respect to the lateral displacement and
the angle of twist. Three ranges governed by different failure modes are proposed for designing in
the Canadian design provision standard. These ranges are distinguished by the sectional plastic
moment pM and the critical elastic moment uM which is given by
2
CANu y y w
C EM EI GJ I C
L L
(1.1)
in which, L is the span between lateral torsional supports, E is the modulus of elasticity of steel,
G is the shear modulus, yI is the weak axis moment of inertia, J is the Saint-Venant torsional
constant, and wC is the warping constant. The coefficient CANC is a moment gradient coefficient
given by 2 2 2 2
max max4 4 7 4 2.5a b cM M M M M and accounts for the increase in lateral
torsional buckling resistance due to uniform bending moments, and , ,a b cM M M are the moments
at quarter-span, half-span, and three-quarter span, respectively, and maxM is the maximum
moment within the unsupported span L .
For comparatively long beams (i.e. 0.67u pM M proposed in CAN/CSA S16-14), the moment
resistance is governed by the elastic lateral torsional buckling failure mode and given by uM ,

4
which is the primary focus of the present thesis. The resistance factor accounts for the material
variability in the material properties (e.g. E , G , yF etc.).
When 0.67u pM M , the flexural resistance of the beams with intermediate spans is governed by
inelastic lateral torsional buckling (LTB) failure mode. However, the inelastic lateral torsional
buckling moment cannot exceed the resistance pM , i.e., the flexural resistance of very short
beams is governed by yielding. To sum up, the moment resistance rM proposed in CAN/CSA
S16-14 is given by
0.67
0.281.15 1 0.67
u u p
p
r i p u p
u
p i p
M M M
MM M M M M
M
M M M
(1.2)
The curve for Eq. (1.2) in CAN/CSA S16-14 is depicted in Figure 1.2 (a) with the elastic buckling
curve from the bifurcation problem. For beams undergoing elastic LTB under uniform bending
moments (i.e. 1CANC ) and the variability in material properties are omitted (i.e. 1 ), Eq.
(1.2) (a) is simplified as Eq. (1.1) by Timoshenko (1961) which accounts for no initial out-of-
straightness. Thus, Eq. (1.2) (a) in CAN/CSA S16-14 is based on the eigenvalue solution which
assumes a perfectly straight member. The fact that the Canadian standard provisions do not involve
a reduction the elastic critical moment capacity r uM M is indicative of the fact that they do not
capture the effect of initial out-of-straightness in the design equation for flexural members. This
contrasts with approach taken by the Canadian standards for the design of compression members
as will be outlined in the following section.
For a member with doubly symmetric cross-sections subjected to axial compression, the resistance
rC is given by
1
21r yC AF
(1.3)
in which A is the gross cross-section area, yF is the yield strength, yKL r F E is a
slenderness factor characterizing the length of the member and the boundary conditions, K is a
5
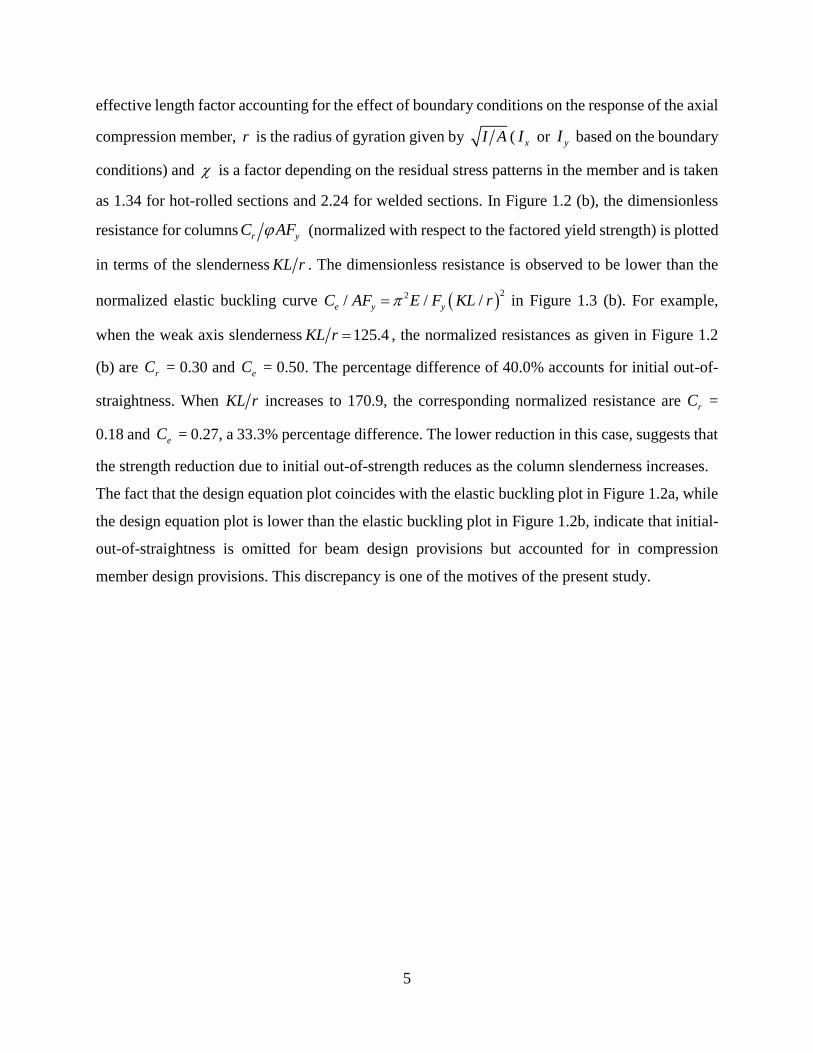
effective length factor accounting for the effect of boundary conditions on the response of the axial
compression member, r is the radius of gyration given by I A ( xI or yI based on the boundary
conditions) and is a factor depending on the residual stress patterns in the member and is taken
as 1.34 for hot-rolled sections and 2.24 for welded sections. In Figure 1.2 (b), the dimensionless
resistance for columns r yC AF (normalized with respect to the factored yield strength) is plotted
in terms of the slenderness KL r . The dimensionless resistance is observed to be lower than the
normalized elastic buckling curve 22/ / /e y yC AF E F KL r in Figure 1.3 (b). For example,
when the weak axis slenderness 125.4KL r , the normalized resistances as given in Figure 1.2
(b) are rC = 0.30 and eC = 0.50. The percentage difference of 40.0% accounts for initial out-of-
straightness. When KL r increases to 170.9, the corresponding normalized resistance are rC =
0.18 and eC = 0.27, a 33.3% percentage difference. The lower reduction in this case, suggests that
the strength reduction due to initial out-of-strength reduces as the column slenderness increases.
The fact that the design equation plot coincides with the elastic buckling plot in Figure 1.2a, while
the design equation plot is lower than the elastic buckling plot in Figure 1.2b, indicate that initial-
out-of-straightness is omitted for beam design provisions but accounted for in compression
member design provisions. This discrepancy is one of the motives of the present study.

6
(a)
(b)
Figure 1.2 Comparison between the design curves in CAN/CSA S16-14 and the elastic
buckling curve for (a) beams and (b) columns
1.3.2 American steel design standard
For members with doubly symmetric I-profile undergo bending about their strong axis, the
American design provisions (ANSI/ASCI 360-16) distinguish the governing failure mode by
lengths of the member. For beams with spans smaller than the limiting length 1.76p y yL r E F ,
the moment resistance is deemed to be governed by yielding and is given by the sectional plastic

7
moment pM . For beams with intermediate length, i.e., larger than pL but smaller than rL , The
limiting length rL is given by
2 20.7
1.95 6.760.7
y
r ts
y x o x o
FE Jc JcL r
F S h S h E
(1.4)
the resistance of the member is governed by the inelastic LTB. In Eq. (1.4) which, 2
ts y w xr I C S
and 1c for doubly symmetric I-sections and 2o y wc h I C for channels. When rL L ,
the moment resistance is governed by the elastic LTB given by cr xF S , in which crF is given by
22
2
0
1 0.078ANSI c bcr
x ts
ts
C E J LF
S h rL
r
(1.5)
where ANSIC is the moment gradient factor specified in ANSI/AISC 360-10 and given by
max max 4 2 3 412.5 2.5 3 4 3ANSI L L LC M M M M M , 0h is the distance between the flange
centroids. From the relation st y w xr I C S , by substitution into Eq. (1.5) and multiplying both
sides by xS , one obtains
2
2
00.078ANSIr cr x y w y w y
C EM F S I C EI GJ E C I Gh
L L
(1.6)
Eq. (1.6) is similar in form as Eq. (1.1) except the term 2
00.078 w yE C I Gh . For a doubly
symmetric I-sections, it can be shown that the term 2
00.078 1w yE C I Gh . Thus, Eq. (1.5)
is another form of Eq. (1.1) and does not capture the initial out-of-straightness effects. To sum up,
the nominal flexural resistance for members subjected to strong axis bending based on the
American design provision is given by
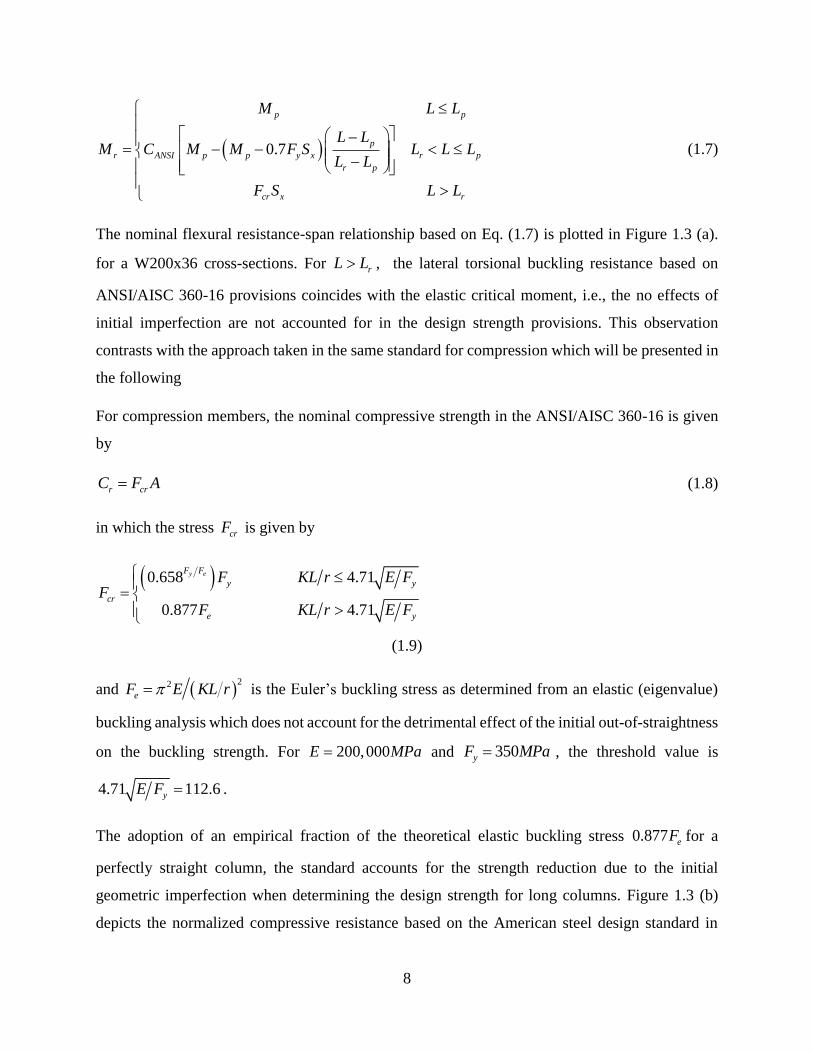
8
0.7
p p
p
r ANSI p p y x r p
r p
cr x r
M L L
L LM C M M F S L L L
L L
F S L L
(1.7)
The nominal flexural resistance-span relationship based on Eq. (1.7) is plotted in Figure 1.3 (a).
for a W200x36 cross-sections. For rL L , the lateral torsional buckling resistance based on
ANSI/AISC 360-16 provisions coincides with the elastic critical moment, i.e., the no effects of
initial imperfection are not accounted for in the design strength provisions. This observation
contrasts with the approach taken in the same standard for compression which will be presented in
the following
For compression members, the nominal compressive strength in the ANSI/AISC 360-16 is given
by
r crC F A (1.8)
in which the stress crF is given by
0.658 4.71
0.877 4.71
y eF F
y y
cr
e y
F KL r E FF
F KL r E F
(1.9)
and 22
eF E KL r is the Euler’s buckling stress as determined from an elastic (eigenvalue)
buckling analysis which does not account for the detrimental effect of the initial out-of-straightness
on the buckling strength. For 200,000E MPa and 350yF MPa , the threshold value is
4.71 112.6yE F .
The adoption of an empirical fraction of the theoretical elastic buckling stress 0.877 eF for a
perfectly straight column, the standard accounts for the strength reduction due to the initial
geometric imperfection when determining the design strength for long columns. Figure 1.3 (b)
depicts the normalized compressive resistance based on the American steel design standard in

9
terms of the slenderness /KL r for a W200x36 cross-section. Like the design curve for columns
in CAN/CSA S16-14 (Figure 1.2 (b)), the nominal resistance for columns provides is lower than
the elastic buckling resistance. The 12.3% difference in strength between the nominal design
strength and the elastic buckling strength accounts for the strength reduction due to column out-
of-straightness. In a manner similar to CAN/CSA S16-14, the design rules columns of American
standard accounts for the detrimental effect of the initial out-of-straightness when characterizing
the column nominal strength but not when characterizing the beam strength.
(a)
(b)

10
Figure 1.3 Comparison between the design curves in ANSI/ASCI S360-10 and the elastic
buckling curve for (a) beams and (b) columns
1.3.3 Australian Standards
In the Australian Standard (AS 4100-1998), the nominal resistance rM for a flexural member is
given by
r m s s sM M M (1.10)
where m is a moment modification factor (akin to moment gradient factor in CAN-CSA S16
2014) and is given by
max
2 2 2
1.72.5m
a b c
M
M M M
(1.11)
In Eq. (1.11), the nominal moment resistance sM is given by
s y eM F Z (1.12)
in which, eZ is the effective section modulus which is depends on the section slenderness e
defined as
250
y
e
Fb
t
(1.13)
where b is the width of the element outstanding from the face of the supporting plate element or
the width of the element between the faces of supporting plate elements, and t is the element
thickness. The effective section modulus eZ is given by
2
min ,1.5 82
115min ,1.5 82 115
33
115115
x x e
se x x x x e
x e
s
Z S
Z S Z S S
S
(1.14)
11
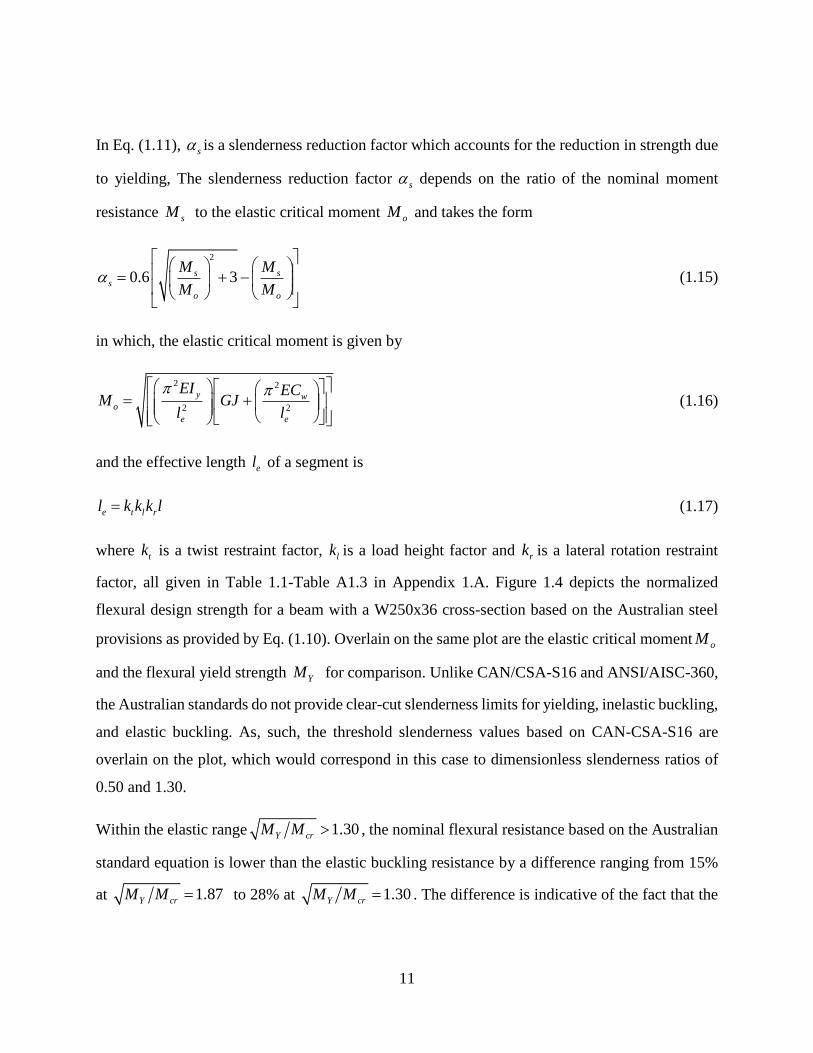
In Eq. (1.11), s is a slenderness reduction factor which accounts for the reduction in strength due
to yielding, The slenderness reduction factor s depends on the ratio of the nominal moment
resistance sM to the elastic critical moment oM and takes the form
2
0.6 3s ss
o o
M M
M M
(1.15)
in which, the elastic critical moment is given by
2 2
2 2
y wo
e e
EI ECM GJ
l l
(1.16)
and the effective length el of a segment is
e t l rl k k k l (1.17)
where tk is a twist restraint factor, lk is a load height factor and rk is a lateral rotation restraint
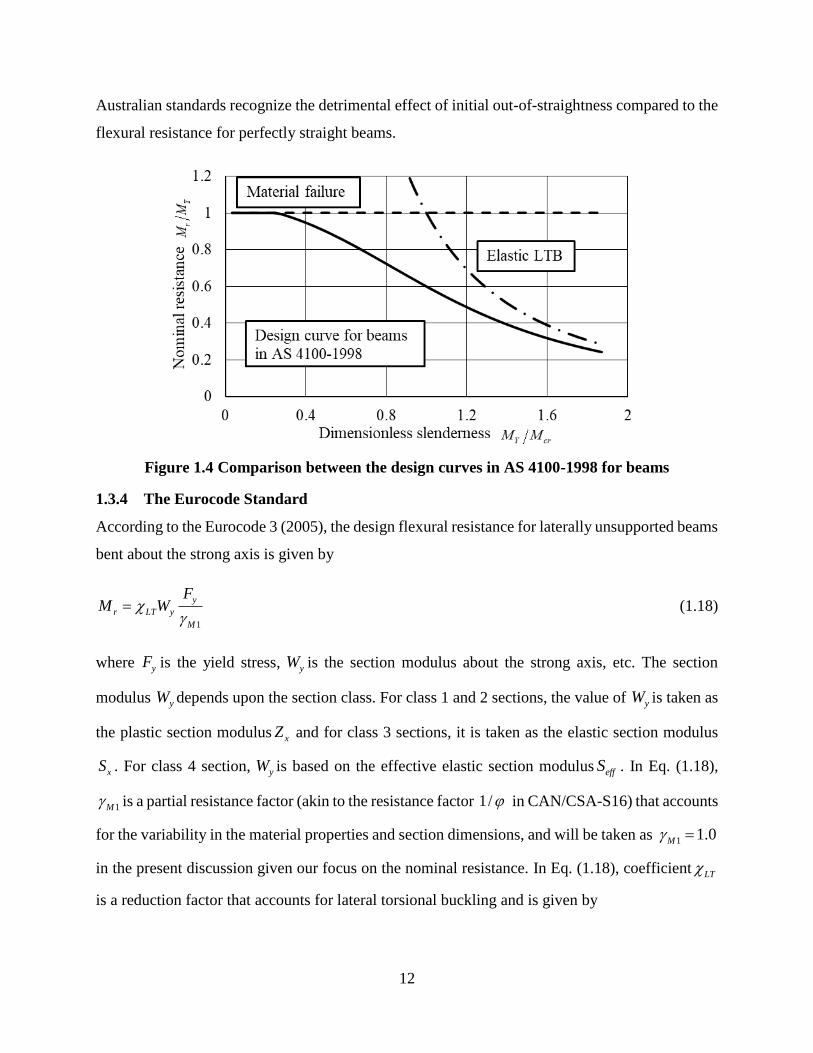
factor, all given in Table 1.1-Table A1.3 in Appendix 1.A. Figure 1.4 depicts the normalized
flexural design strength for a beam with a W250x36 cross-section based on the Australian steel
provisions as provided by Eq. (1.10). Overlain on the same plot are the elastic critical moment oM
and the flexural yield strength YM for comparison. Unlike CAN/CSA-S16 and ANSI/AISC-360,
the Australian standards do not provide clear-cut slenderness limits for yielding, inelastic buckling,
and elastic buckling. As, such, the threshold slenderness values based on CAN-CSA-S16 are
overlain on the plot, which would correspond in this case to dimensionless slenderness ratios of
0.50 and 1.30.
Within the elastic range 1.30Y crM M , the nominal flexural resistance based on the Australian
standard equation is lower than the elastic buckling resistance by a difference ranging from 15%
at 1.87Y crM M to 28% at 1.30Y crM M . The difference is indicative of the fact that the
12
Australian standards recognize the detrimental effect of initial out-of-straightness compared to the
flexural resistance for perfectly straight beams.
Figure 1.4 Comparison between the design curves in AS 4100-1998 for beams
1.3.4 The Eurocode Standard
According to the Eurocode 3 (2005), the design flexural resistance for laterally unsupported beams
bent about the strong axis is given by
1
y
r LT y
M
FM W
(1.18)
where yF is the yield stress, yW is the section modulus about the strong axis, etc. The section
modulus yW depends upon the section class. For class 1 and 2 sections, the value of yW is taken as
the plastic section modulus xZ and for class 3 sections, it is taken as the elastic section modulus
xS . For class 4 section, yW is based on the effective elastic section modulus effS . In Eq. (1.18),
1M is a partial resistance factor (akin to the resistance factor 1/ in CAN/CSA-S16) that accounts
for the variability in the material properties and section dimensions, and will be taken as 1 1.0M
in the present discussion given our focus on the nominal resistance. In Eq. (1.18), coefficient LT
is a reduction factor that accounts for lateral torsional buckling and is given by

13
2 2
1LT
LT LT LT
(1.19)
where 20.5 1 0.2LT LT LT LT with LT being a factor accounting for member
imperfections as listed in Table 1.1 and ranges between 0.21 and 0.76, depending upon the
manufacturing method and the height to width ratio. It accounts for misalignment and different
residual stress distributions. For example, for the value 0.21a , the nominal design resistance is
found to be 78%-88% of the elastic buckling resistance for a perfectly straight beam. In Eq. (1.19)
LT is a slenderness parameter (akin to coefficient Y oM M In the Australian standard) and is
given by LT y y crW F M in which crM is the elastic critical moment and y yW F is the moment
resistance based on material failure, i.e., yield moment for W200x36. The nominal flexural
resistance curves based on Eurocode 3 (EN 1993-1-1: 2005) are provided in Figure 1.5 based on
the LT values listed in Table 1.1.
Table 1.1 Recommended values for imperfection factors for lateral torsional buckling curves
Buckling curve a b c d
Imperfection
factor LT
0.21 0.34 0.49 0.76
* Descriptions of cross-sections a-d are given in Table 1.2
Table 1.2 Recommended values for lateral torsional buckling curves for cross-sections
Cross-section Limits Buckling curve
Rolled I-sections 2h b
2h b
a
b
Welded I-sections 2h b
2h b
c
d
Other cross-sections N/A d

14
Figure 1.5 Comparison between the design curves in EN 1993-1-1: 1998 for beams for
recommended imperfection factor 0.21a , 0.34b , 0.49c and 0.76d (curves for b,c
and d not practical for W250X36 section)
1.3.5 Comparison of approaches of various standards
While Canadian and American standards recognize the detrimental effect of the initial out-of-
straightness on column strength, such effects are not considered when characterizing the flexural
member strength. In contrast, the effect of initial out-of-straightness is accounted for in the
Australian and Eurocode standards. In the Australian design equation for beams, a slenderness
factor s is introduced to quantify the influence of initial imperfections on the buckling resistance
for beams whereupon a reduction is found when compared to the buckling resistance obtained
from the eigenvalue solution. No clear statement regarding the types of initial imperfections is
provided and no distinction is made between the treatment of rolled and welded cross-sections.
This approach contrasts with that of the Eurocode 3, in which four levels of imperfection values
LT are provided, depending on the manufacturing method and the sectional height to width ratio.
1.4 Motivation of present study
Present standards seem to be inconsistent in that the Eurocode and the Australian standards account
for the effect of initial out-of-straightness when characterizing the LTB resistance of beams while
the Canadian and American standards omit such effects. The present thesis thus aims at providing
a theoretical foundation for quantifying the detrimental effects on initial out-of-straightens on LTB
resistance by developing analytical and finite element solutions and applying them in conjunction

15
with proposed design criteria for possible future adoption in standards. The study focuses
exclusively on elastic lateral torsional buckling and is thus intended for long span beams, as
opposed to beams with intermediate spans where the presence of residual stresses may accelerate
the yielding in portions of the cross-section.
1.5 Research Objectives
The specific objectives of the present study are to:
• Develop a finite element solution for the response of laterally unsupported steel beams
subjected to various types of loads.
• Propose failure criteria based on displacement threshold and stress threshold values.
• Establish the relationship between the LTB resistance of perfectly straight beams and
imperfect beams.
• Identify the parameters affecting design criteria and quantify their effects in a parametric
study on common cross-sections in the W150 and W310 series of Handbook of steel
construction (2014), and propose simplified design equations for both design criteria.
• Previously proposed methodologies (e.g., the Southwell plot (1931)) were devised to
predict the buckling loads for ideal columns (without imperfections) from the experimental
results on real columns (with initial-out-of-straightness). Since the present study
establishes relations between the lateral torsional buckling strength of beams with initial
imperfections and those that are perfectly straight, the study aims at assessing the
extensibility of the Southwell plot technique, and variations thereof, to lateral torsional
buckling of beams.
1.6 Outline of the thesis
Present Chapter 1 provided a comparative discussion of present standard provisions in the
treatment of out-of-straightness effects when characterizing the lateral torsional buckling of
strength of beams.
Chapter 2 provides a literature review on studies related lateral torsional buckling that account for
the effect of initial out-of-straightness of steel beams. Studies related the inclusion of initial out-
of-straightness into lateral torsional buckling strength in the Eurocode 3 provisions are also
summarized given their relevance to the topic. Studies aiming at determining the critical loads (or

16
moments) for perfectly straight columns (or beams) from the load-displacements of members with
initial crookedness are also surveyed given their relevance to the developments of Chapter 5.
Chapter 3 develops a finite element solution to capture the response of beams with initial geometric
imperfections subjected to general transverse loads. The chapter also proposes two criteria, based
on threshold displacements and threshold stresses, to characterize the effect of initial out-of-
straightness on the elastic lateral torsional buckling strength of beams. The finite element solution
is used in conjunction with the criteria proposed to investigate the effects of various geometric
parameters on the moment capacity.
Chapter 4 presents the results of a parametric study on common cross-sections under three loading
conditions: uniform moments, mid-span point loading, and uniformly distributed loading. The
study investigates the effect of key parameters affecting the lateral torsional buckling resistance
based on the both criteria proposed. Illustrative examples for incorporating the effect of initial-
out-of-straightness into the present Canadian standards are provided.
Chapter 5 presents an extension of the Southwell plot technique that predicts the critical moments
and initial geometric imperfections for an initially crooked beam. The extension of the Southwell
plot technique is based on the finite element solution developed in Chapter 3. Various scenarios
for initial out-of-straightness are examined to study the effect of higher modes on prediction in
initial geometric imperfections.
Chapter 6 provides a summary of the work done, compiles the findings and conclusions of the
study, and provides recommendations for future research.

17
Appendix 1. A
Table A1.1 Twist restraint factor tk
Restraint arrangement Factor tk
FF, FL, LL, FU 1.0
FP, PL, PU 3
1
21
f
w
w
td
l t
n
PP 3
122
1
f
w
w
td
l t
n
Table A1.2 Load height factor lk for gravity loads
Longitudinal position
of the load
Restraint
arrangement
Load height position
Shear centre Top flange
Within segment FF, FP, FL, PP, PL,
LL, FU, PU
1.0
1.0
1.4
2.0
At segment end FF, FP, FL, PP PL,
LL, FU, PU
1.0
1.0
1.0
2.0
Table A1.3 Lateral rotation restraint factor rk
Restraint arrangement Ends with lateral rotation
restraints
Factor rk
FU, PU Any 1.0
FF, FP, FL, PP, PL, LL None 1.0
FF, FP, PP One 0.85
FF, FP, PP Both 0.70
* F ≡ fully restrained, L ≡ laterally restrained, P ≡ partially restrained and U ≡ unrestrained
18
2. Literature review
The present study focuses on investigating the reduction effect of initial geometric imperfections
on the lateral torsional buckling resistance of steel beams. Thus, Section 2.1 of this chapter presents
a review of studies depicting mechanical or experimental approaches to capture the effect of initial
geometric imperfections on the LTB problem. Section 2.2 provides an overview of studies related
to the treatment for initial geometric imperfections in the Eurocode 3 (EN 1993-1-1(2005)). A
review of studies investigating the probability and stochastics aspects of LTB problem is presented
in Section 2.3. A summary of studies on experimental treatment to obtain the LTB critical load is
provided in Section 2.4.
2.1 LTB for beams with initial geometric imperfections
Using the transfer matrix method, Yoshida and Maegawa (1983) determined the load-lateral
displacement relationship of a laterally curved beam subjected to uniform moments. The beam
radius of curvature was taken as constant and had a large magnitude compared to the dimensions
of the cross section. The stress-strain was assumed to be perfectly elastic-plastic. The transfer
matrix was derived based on the direct equilibrium approach of an infinitesimal element. To assess
the validity of the analysis, the numerical results were compared to experimental results by
Fukumoto and Nishida (1981) for IPE200, IPE250 and IPE600 sections.
Yoshida and Maegawa (1984) distinguished between the critical loads of perfectly straight
members which are obtained an eigenvalue solution and the ultimate load for initially crooked
members which are obtained from a non-linear analysis. The load-displacement relations were
obtained based on the work of Yoshida and Maegawa (1983). The cases investigated involved (1)
a beam with initial lateral deflection approximated by a circular arc, (2) a beam subjected to a mid-
span point force acting on the top flange at horizontal offset from the center line of the section, (3)
a beam subjected to vertical and a horizontal load acting at the same point on the top flange and
(4) a beam with initial lateral out-of-straightness subjected to laterally eccentric point load acting
at mid-span. The results were provided in a dimensionless form. The study investigated the effect
of residual stress distribution, amplitude of the initial circular arc, loading conditions, and cross-
section dimension. The influence of residual stress on the ultimate load was found to be low
compared to initial imperfections and the dimensions of the cross section was found to have small
effects on the ultimate strength.

19
Hasham and Rasmussen (1995) conducted two series of experiments on members under
compression and major axis bending. Two spans were considered; 1990mm and 3990mm and
different axial force to major axis bending moment ratios were applied on the specimens. The
authors measured the sectional dimensions of the specimens and reported the average value and
standard deviation. The authors also measured the initial out-of-straightness at the flange tips and
section centroid. The axial force- bending moments interaction relations were plotted and
compared against the predictions of AS4100 (1990), AISC-LRFD (1993) and Eurocode 3(1993)
for the problem of out of plane lateral torsional buckling. The authors concluded that the design
capacities based on AS4100, AISC-LRFD and Eurocode 3 were conservative when the bending
moments to axial force ratios were comparatively high. In contrast, AISC-LRFD interaction
relations were found to be overly conservative for series 2.
Dubina and Ungureanu (2002) performed nonlinear finite element analyses (FEA) on beams and
columns with non-lipped and lipped channel sections which incorporate the effects of residual
stresses and initial geometric imperfections. Two types of geometric imperfections were
considered; transverse, and lateral/torsional imperfections and local-sectional imperfections in the
form of web distortion. Local-section imperfections were introduced as symmetrical or
asymmetric sine shapes along the web height as well as imperfections based on probabilistic
analysis. The study investigated the reduction in the buckling strength due to imperfections and
interactive buckling. Comparisons were conducted with the Australian and European standard
predictions. The buckling strength based on the symmetric and asymmetric local imperfections
were found to differ and the sinusoidal shape was not always appropriate for representing local-
sectional imperfections. Also, the influence of local imperfections was found relatively low
compared to global imperfections. The erosion of critical bifurcation load (ECBL) imperfection
approach was found to be effective in charactering the geometric imperfections.
McCann et al. (2013) investigated the lateral torsional buckling (LTB) for beams with discrete
lateral restraints that are vertically offset from the shear center. The model developed related to
simply supported beams with doubly symmetric I-sections and linearly elastic lateral restraints.
The solution was based the Rayleigh-Ritz method and the lateral displacement, angle of twist, and
initial imperfections were expressed as Fourier series. Two eigen-value models were developed
for perfectly straight beams; the first accounted for the flexibility of the lateral braces while the
20
second omitted their flexibility. A third solution was developed for beams with initial out of
straightness. The work investigated the effect of bracing height on the required lateral restraint
stiffness. Comparisons were performed against the predictions of LTBeam, a software for
determining the critical moments of restrained beams. The comparison has shown that while a
single harmonic solution may not be sufficient to predict the critical moments, the use of the full
Fourrier series predictions in very good agreement with numerical results.
Nguyen and Chan et al. (2013) conducted geometric nonlinear FEA on I-section beams with Fibre
Reinforced Polymer (FRP) and steel materials. The study examined the influence of load height
effect and end warping fixity conditions on the critical lateral torsional buckling load and then
incorporated the effect of initial lateral and twist imperfections in their analysis. The lateral out-
of-straightness and the initial twist imperfection were assumed as half and quarter wave sinusoidal
functions. The authors observed that the reduction in strength due to load height effects and the
release of end warping fixity conditions to be more significant in FRP beams than in steel beams.
Ascione (2014) developed a finite element formulation wide flange beams with initial
imperfections. The model was used to investigate the lateral torsional buckling of simply supported
beams made of pultruded GFRP subjected to transverse uniformly distributed load acting at the
top flange. Three types of imperfections were investigated; (1) lateral out-of-straightens and (2)
non-orthogonality of the flanges and the web, and (3) combinations of both types of imperfections.
The author observed that lateral out-of-straightness had a larger detrimental effect than the non-
orthogonality of the flanges and the web.
2.2 Studies related to the Eurocode 3 buckling provisions for beams or beam-
columns
Maquoi et al. (2001) presented a theoretical treatment for interaction equations of beam columns
and provided a framework for generalizing the design provisions for beam-columns in Australia
(AS 4100-1998), America (AISC 1966 and 1986), Europe (ECCS 1976 and 1978) and Germany
(DIN 18800 1988). The proposed method can account for the lateral torsional buckling through
amendments in computing the coefficients appearing in the interaction equations.
Boissonade et al. (2002) developed a second-order in-plane elastic analysis and used it to propose
a new interaction equation as an alternative to that of the Eurocode 3 (1993). The alternative

21
interaction equation was developed by adopting the closed form solution developed by Maquoi
and Rondal (1982) in conjunction with the interaction equation in the German steel standard
provisions (DIN 18800). The work captured biaxial moments and plasticity effects. Finite element
analyses on practical section dimensions were performed to assess the validity of the proposed
solution. The proposed solution was found safe, efficient, and more accurate than that in EC 3 with
the ability to account for lateral torsional buckling.
Aguero and Pallares (2007) summarized the approach methodology and simplified method used
in the Spanish steel standard (NBE-EA-95) and Eurocode 3 (1992) for the ultimate strength of
members in slender frames. A simplified method to capture second order effects was proposed by
separating the analysis into sway and non-sway parts, and an auxiliary coefficient was developed
to amplify the bending moments. The Dutheil’s method (1952) was adopted to obtain equivalent
imperfections. An illustrative example was presented for a beam with lateral and twist initial
geometric imperfections subjected to biaxial bending. The accuracy of the proposed method was
assessed by comparison against a closed form solution. The proposed solution was observed to be
valid for predicting the ultimate limit state of slender members.
Szalai and Papp (2010) developed a generalization of the Ayrton-Perry Formula (APF) (Ayrton
and Perry 1886) originally developed for predicting the buckling resistance for columns
undergoing flexural buckling, and extended the APF to account for effect of initial imperfections
on the lateral torsional buckling strength of beams and beam-columns.
Taras and Greiner (2010) conducted geometric and material nonlinear analyses for the lateral
torsional buckling (LTB) analysis of beams. The results were found to be inconsistent with the
Eurocode 3 solution. Based on the first yield criterion and a consistent derivation, the authors
proposed new design curves.
By relating the stresses to the derivatives of the displacement fields, and adopting the first yield
criterion based on von Mises stress, Aguero and Pallares (2015a) proposed initial lateral out-of-
straight and angle of twist patterns for the design of members undergoing lateral torsional buckling.
The proposed treatment simplified that design of members with initial out-of-straightness in a
manner consistent with EC 3 and extended its scope to various load and boundary conditions.

22
Aguero and Pallares (2015b) implemented the Eurocode 3 in design members in frames by
proposing a procedure to estimate the most adverse imperfection direction. A criterion was
proposed to determine the number of buckling modes needed to define a proper imperfection shape
based on the lowest buckling mode corresponding to a non-zero strain energy.
2.3 Probabilistic and Stochastic studies on LTB of beams with initial geometric
imperfections
Kala and Melcher (2009) compiled statistical information on the measured yield strength and
cross-sectional geometric parameters for Czech hot rolled steel I sections using various
probabilistic distributions with S355 structural steel (yield strength =355MPa). The statistical
characteristics compiled were subsequently used in Kala (2013) to investigate the lateral torsional
buckling problems of simply supported beams with doubly symmetric-sections under major axis
uniform bending moments. The authors assumed simple sinusoidal lateral and twist imperfections
and provided a stress approach to predict the ultimate moment for initially crooked beams. A
stochastic analysis was performed based on the Monte Carlo simulation to determine the stochastic
characteristics of the critical moments. The lateral torsional buckling strength of I-section thin-
walled members were reported to be sensitive to the magnitude of the initial imperfections
Papadopoulos and Soimiris et al. (2013) conducted finite element analyses for beam-columns and
frames with I-sections in which members with imperfect geometry were modeled. The initial
imperfections were given as non-homogeneous Gaussian fields and were generated based on the
evolutionary power spectra using the method of separation. The relationship between local and the
global imperfections were based on geometric equilibrium considerations. Two types of models
were investigated (1) a column with an imperfection field under a compressive load and (2) a portal
frames consisting of I-sections under a uniformly distributed vertical loading and a horizontal
concentrated force. A Monte Carlo simulation was conducted on multiple initial imperfection
scenarios were generated and a statistical description of the buckling load capacity and strength
reduction were obtained.
2.4 The Southwell plot and its extension to lateral torsional buckling
A common challenge encountered when conducting buckling experiments on real (i.e., with initial
of out straightness) columns or beams is that the obtained load deflection relation exhibits a

23
nonlinear relationship. The buckling behavior of such members is fundamentally different from
that of ideal (i.e., perfectly straight members) for which theoretical eigenvalue analysis predicts a
sudden change in the deformation pattern once the applied load attains a critical value. Several
researchers have attempted to use the experimental nonlinear load deformation relations to predict
the critical load of a perfectly straight members (e.g., Southwell (1931) method and its variations
by Ariartnam 1960, Massey 1963, Meck 1977, and Mandal and Cadalin 2002). Such studies are
discussed given that the present study will develop techniques to predict the magnitudes of lateral
displacements and angles of twist for beams with initial lateral out-of-straightness and initial angle
of twist. Such expressions will provide a basis to assess the seemingly conflicting variation of the
Southwell plot solutions (Chapter 5).
Southwell (1931) developed a technique to estimate the critical load for pin-ended ideal perfectly
straight column from the measured axial load-lateral displacement curves for real columns with
initial out-of-straightness. The initial out-of-straightness of the column is assumed as a Fourier
series. By omitting the contribution of higher modes on the lateral defection, Southwell observed
a linear relationship between the lateral deflection-to-applied-load /u P ratio and the lateral
deflection u . The Southwell method forms a basis to predict the critical load for columns from
experimental results and was shown to compare well with classical buckling loads based on
eigenvalue solution results.
Ariaratnam (1960) developed a theoretical framework to extend the work by Southwell plot
methodology (Southwell 1931) for the prediction of the critical loads of plane frames and the
torsional buckling loads for columns. Massey (1963) proposed a modified version of the Southwell
plot technique, in which rather than adopting the /u P u plot, they advocated the use 2M
versus plots to estimate the critical moments for beams with I-sections with initial lateral or
twist imperfections subjected to a uniform bending moments. The method was further extended to
account for material inelastic effects.
Meck (1977) proposed a modified method based on the original Southwell plot where they have
advocated the use of u P versus or P versus u to predict the critical load for beams with
initial lateral and twist imperfections. The load conditions investigated were extended to mid-span
point load. By using a direct equilibrium method in conjunction with the principle of stationary

24
potential energy, a linear relation was observed between lateral displacement to moment ratio and
the angle of twist. Also, the relation between the twist-to-moment ratio and the lateral displacement
was found to be linear. These two sets of relations formed the basis of the proposed method to
predict the LTB critical load for beams. The method was verified through comparison of
experimental results with eigenvalue solution results.
Mandal and Calladine (2002) developed a theoretical framework for the evaluation of the work of
Southwell (1931), that of Massey (1963) and that of Meck (1977). The analysis advocated the
extension of the original /u P u Southwell plot, originally developed for columns, for the lateral
torsional buckling analysis of beams with initial imperfects.
Table 2.1 Comparison of variations of the Southwell plot studies (simply supported beams)
Author Buckling
Type
Plot method Load condition Type of
imperfections
considered
Southwell
(1931)
Flexural P versus Axial force 0u
Massey
(1963)
LTB 2M versus
Uniform bending
moment 0u and 0
Meck
(1977)
LTB u M versus
and P versus
u
Uniform bending
moment
Midspan point load
0u and 0
Mandal
and
Cadalin
(2002)
LTB u P versus u Uniform bending
moment
0u and 0
* , P are the deflection at mid-span and corresponding applied axial force respectively.
** , M are the angle of twist at mid-span and corresponding applied uniform bending moment.
2.5 Conclusions
As summarized in section 2.1, the behavior of beams with initial geometric imperfections has been
studied in multiple studies for hot-rolled, FRP and cold-form sections through mechanical and
experimental approaches. Capturing the effect of initial geometric imperfections on LTB behavior
through the Ayrton-Perry formula has been well studied through various studies related to
Eurocode 3 (EC 3) reported in Section 2.2. Scenarios investigated in these studies are limited to
simply supported members subjected to uniform bending moment or point load at mid-span. Also,
25
the shapes of the initial geometric imperfections are assumed to be sinusoidal functions. Thus, a
finite element solution investigating the LTB behavior of geometrical imperfect beams is
developed in Chapter 3 accounting for imperfections given by superpositions of amplified
buckling modes. Relatively fewer stochastic studies are reported to investigate beams with initial
geometric imperfections as presented in Section 2.3 while no key parameters are found for design.
In Chapter 4, a throughout parametric study for displacement and stress based design criteria is
provided to depict key parameters in designing beams with initial geometric imperfections.
Experimental treatments for estimating the critical load for practical members are well developed
in studies summarized in Section 2.4. These studies focus on the prediction for the critical load
and overlook the estimation for the initial geometric imperfections. A trial is presented in Chapter
5 to adopt the Southwell to estimate the initial geometric imperfections through the load-
displacement curve generated in the finite element solution developed in Chapter 3.

26
3. Finite element for the lateral torsional response of beams with
initial geometric imperfections
3.1 Scope and Objective
This chapter develops a simplified beam finite element formulation to predict the load-
displacement response of laterally unsupported beams with initial crookedness subjected to general
transverse loading. The present finite element solution is validated by comparison with results
based on the commercial software ABAQUS. A parametric study is then presented to investigate
the influence of various geometric parameters on the lateral torsional response of initially crooked
beams.
3.2 Statement of the problem and Notation
A beam with a doubly symmetric I-section is assumed (Figure 3.1) with span L is assumed to
have an initial lateral out-of-straightness (IOS) 0u z and initial angle of twist (IAT) 0 z . The
beam is subjected to transverse loads q z . Under such loads, the beam deforms from
Configuration 1 to Configuration 2 (Figure 3.1) by undergoing displacements ( )v z , u z and twist
z . The bending moments associated with the transverse displacements ( )v z are M z . The
loads are assumed to incrementally increase to q z , where is a scaling factor. The associated
transverse displacement function is v z and the corresponding bending moments is M z .
As the beam deflects transversely, it undergoes lateral displacement ,u z and angle of twist
, z . Unlike the transverse response, ,u z and , z are nonlinear functions of the load
parameter . It is required to determine the lateral and torsional response of the system ,u z
and , z . As a matter of notation, the sum of the IOS 0u z and the lateral displacement
,u z is referred as the total lateral out-of-straightness cu (TLOS). Also, the sum of the IAT
0 z and the angle of twist , z is the Total Angle of Twist (TAT) (Figure 3.1). A right-
handed Cartesian coordinate system is adopted in which the z-axis is oriented along the
longitudinal direction and the x and y-axes (Figure 3.1) are parallel to lateral and transverse
directions, respectively.

27
Figure 3.1 Model under investigation and deformed configurations
3.3 Assumptions
The following assumptions are adopted
1. The formulation is restricted to prismatic thin-walled members with doubly-symmetric
sections.
2. The cross-section is assumed to move as a rigid disk in its own plane during deformation (i.e.,
the beam cross-section follows the first Vlasov hypothesis (Vlasov 1961))
3. The transverse shear deformation within the middle surface of the cross-section is neglected
(i.e., the section is assumed to follow the second Vlasov hypothesis)
4. The material is linearly elastic isotropic and follows Hooke’s law
5. When characterizing the destabilizing term due to lateral torsional buckling, pre-buckling
effects are assumed to be negligible.

28
3.4 Formulation
3.4.1 Total potential energy
At a given load level q , the total potential energy for the member is given by
U V (3.1)
in which U is the internal strain energy stored throughout the deformation of the member in going
from the initial crooked configuration to the final deformed configuration and V is the load
potential energy gained by the applied loads. The internal strain energy is given by
2
0
2 2 2
0 0 0
1 1 1
2 2
1
22
L L L L
wx yEI dz GJ dU EI z EC dzv dz u (3.2)
in which E is the Young’s modulus and G is the shear modulus and the relevant section properties
are the strong axis moment of inertia 2
xA
I y dA , the weak axis moment of inertia 2
yA
I x dA ,
the Saint-Venant torsional constant 3 3J bt and the warping constant is 2
4w xC I d t .
The load potential energy 1 2V V V gained by the loads is the sum of two components;
10
L
V q v dz due to transverse forces q undergoing transverse displacements v and
2V due to weak axis bending moments in the deformed configuration undergoing lateral curvatures.
In Figure 3.2 coordinate system oxy is fixed in space while coordinate system ox y rotates with
the section. The bending moments M due to transverse loads, acting on a segment of beam of
length dz are denoted by the double headed arrow in Figure 3.2 and are assumed to preserve their
direction (i.e., conservative loading) as the beam deforms and rotates. As the cross section twists
from angle 0 in the un-deformed configuration to angle 0 , the bending moment M acting
about the un-deformed y axis induces a weak axis bending moment about the deformed 'x axis.
The projection of moment M on the x axis is 0sinxM M . For small angles
0 one can write the approximation 0xM M . The corresponding curvature
(Figure 3.2(b)) is given by 3/2
2
0 01u u u u
which simplifies to 0u u for small
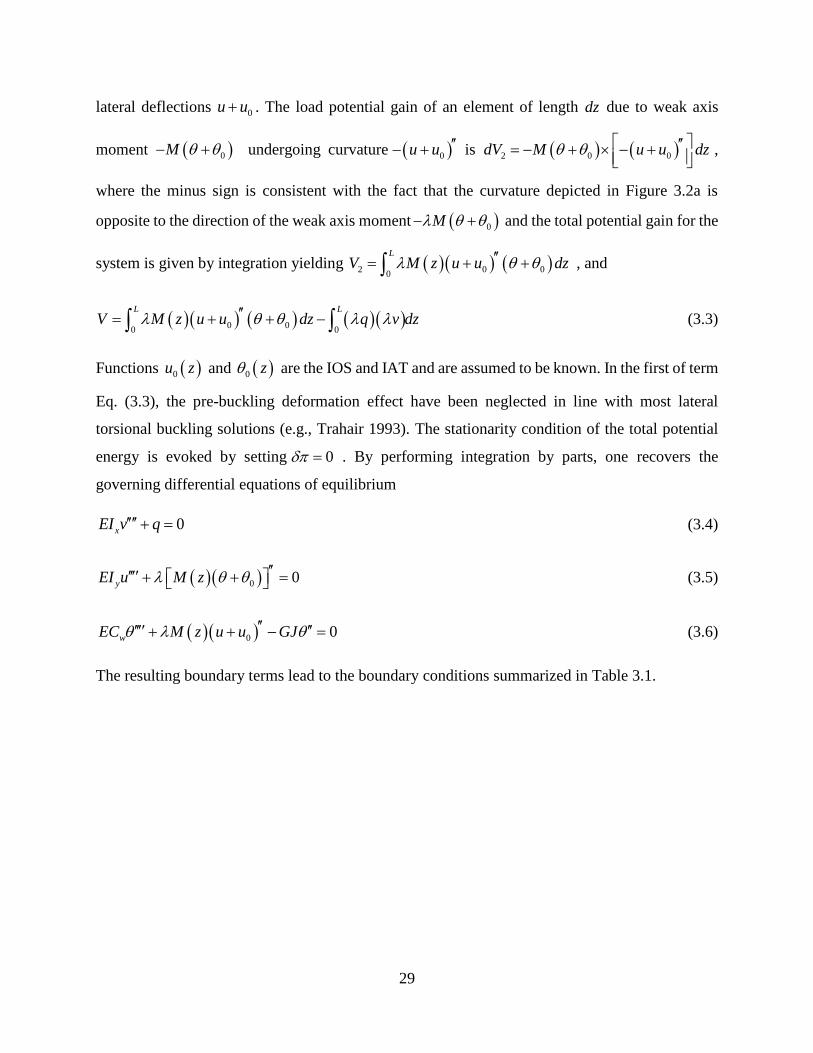
29
lateral deflections 0u u . The load potential gain of an element of length dz due to weak axis
moment 0M undergoing curvature 0u u is 2 0 0dV M u u dz
,
where the minus sign is consistent with the fact that the curvature depicted in Figure 3.2a is
opposite to the direction of the weak axis moment 0M and the total potential gain for the
system is given by integration yielding 2 0 00
L
V M z u u dz , and
0 00 0
L L
V M z u u dz q v dz (3.3)
Functions 0u z and 0 z are the IOS and IAT and are assumed to be known. In the first of term
Eq. (3.3), the pre-buckling deformation effect have been neglected in line with most lateral
torsional buckling solutions (e.g., Trahair 1993). The stationarity condition of the total potential
energy is evoked by setting 0 . By performing integration by parts, one recovers the
governing differential equations of equilibrium
0xEI v q (3.4)
0 0y MEI zu (3.5)
0 0w M z uE uC GJ (3.6)
The resulting boundary terms lead to the boundary conditions summarized in Table 3.1.
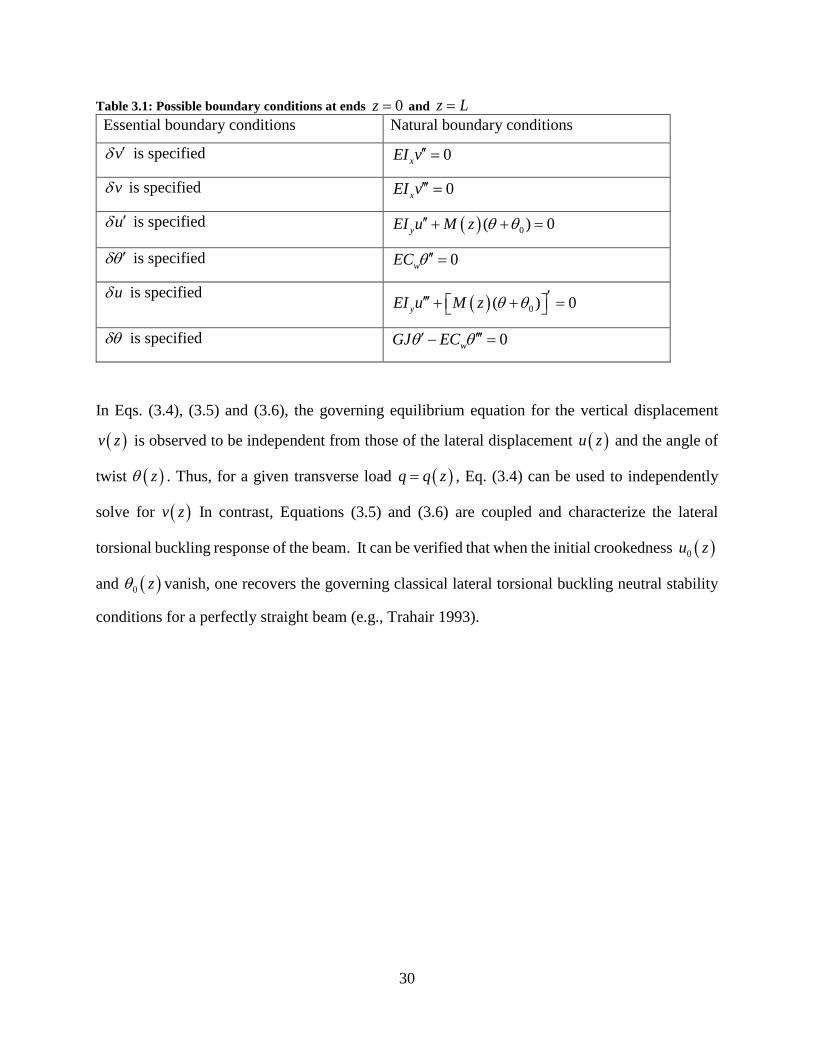
30
Table 3.1: Possible boundary conditions at ends 0z and z L
Essential boundary conditions Natural boundary conditions
v is specified 0xEI v
v is specified 0xEI v
u is specified 0( ) 0yEI u M z
is specified 0wEC
u is specified 0( ) 0yEI u M z
is specified 0wGJ EC
In Eqs. (3.4), (3.5) and (3.6), the governing equilibrium equation for the vertical displacement
v z is observed to be independent from those of the lateral displacement u z and the angle of
twist z . Thus, for a given transverse load q q z , Eq. (3.4) can be used to independently
solve for v z In contrast, Equations (3.5) and (3.6) are coupled and characterize the lateral
torsional buckling response of the beam. It can be verified that when the initial crookedness 0u z
and 0 z vanish, one recovers the governing classical lateral torsional buckling neutral stability
conditions for a perfectly straight beam (e.g., Trahair 1993).
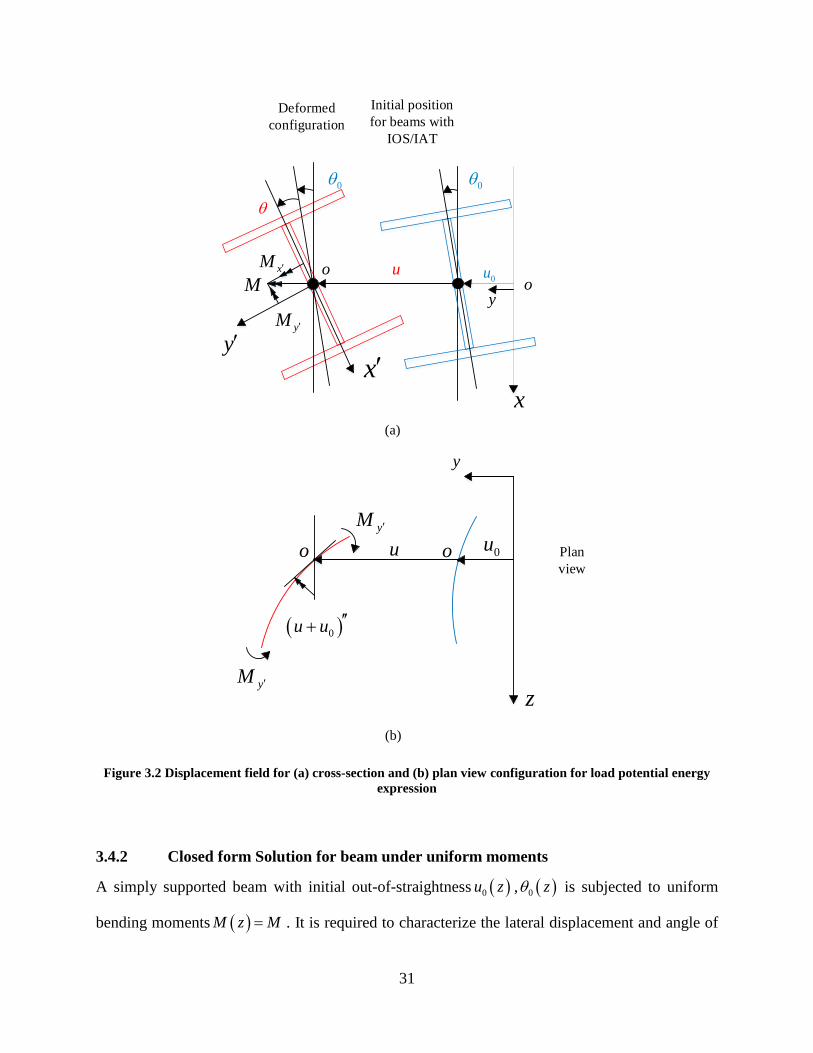
31
Initial position
for beams with
IOS/IAT
Deformed
configuration
Plan
view
(a)
(b)
o ou 0uyM
yM
0u u
y
y
z
x
00
oo
xy
yM
MxM u
0u
Figure 3.2 Displacement field for (a) cross-section and (b) plan view configuration for load potential energy
expression
3.4.2 Closed form Solution for beam under uniform moments
A simply supported beam with initial out-of-straightness 0u z , 0 z is subjected to uniform
bending moments M z M . It is required to characterize the lateral displacement and angle of

32
twist in terms of the applied moments M . It is expedient to express the initial imperfection pattern
as a linear summation of n buckling mode shapes for a perfectly straight beam, i.e.,
0 0
1
,n
T T
m m m
m
u z z u z z
where mu z , m z are the buckling shapes for modes
1, 2..m n and m is a scaling factor for mode m .
The mode shapes for a perfectly straight beam are obtained by setting 0u z , 0 z in Eqs. (3.5)
and (3.6) to zero and +. The governing equations become 0yEI u M and
0wC JuE M G and the corresponding boundary conditions are
0 0 0 0 0u u 0u L u L L L . The solution of the above
system of homogeneous of equations yields the critical moments crmM and the buckling modes
mu z and m z are
2
2
2sin sin 1,2,..
crm m y w y
y
m m m m
crm
m m EM M EI GJ C I
L L
EIm z m zu z z m n
L M L L
(3.7)
Using Fourier decomposition, a general IOS/IAT pattern can be expressed as a linear summation
of mode shapes, i.e.
2
0 0 21
1 sinn
T y
m
m crm
EI m zu z z
M L L
(3.8)
where both sides of the above equation become equal as n . For practical purposes, the series
will be truncated by taking only the first few modes. From Eqs. (3.5) and (3.6), by setting
M z M and substituting the IOS/IAT expressions from Eqs. (3.8), one obtains the additional
displacements u z and z

33
22 2
2 2
4 21 2
sin
y y
y y w yn
crm crm
m
my
w y y
EI EImEI M EI EC EI GJ
M L L M LM m zu z
EI Lm mEC EI EI GJ M
L L
(3.9)
222
2
4 2 21
sin
y
ny crm
i
m
w
y
EIM mM
EI M L L m zz
Lm m MEC GJ
L L EI
(3.10)
For the special case where the initial geometric imperfections are assumed to be characterized by
the first buckling mode as 2 2
0 0 1 11, sinT
y cru z z EI M L z L
, Eq. (3.9) and
(3.10) simplify to
22 2
2 2
1 1
1 4 2
2
sin
y y
y y w y
cr cr
y
w y y
EI EIEI M EI EC EI GJ
M L L M LM zu z
EI LEC EI EI GJ M
L L
(3.11)
222
2
1
1 4 2 2sin
y
y cr
w
y
EIMM
EI M L L zz
LMEC GJ
L L EI
(3.12)
Equations (3.11) and (3.12) coincide with the work by Massay (1963).
3.4.3 Finite element formulation
The displacement fields u z , z , and initial imperfections 0u z and 0 z are related to
the nodal displacements, i.e.,
1 4 1 4
0 01 4 1 4
,
,
T T
T T
u z z z z
u z z z z
u N θ N
u 0N θ 0N
N u N θ
N u N θ (3.13)
where zuN , zθN are the shape functions given by

34
2 2 3 3 2 3 2 2 2 3 3 3 2 2
1 41 3 2 2 3 2
T
z z L z L z z L z L z L z L z L z L uN
2 2 3 3 2 3 2 2 2 3 3 3 2 2
1 41 3 2 2 3 2
T
z z L z L z z L z L z L z L z L z L θN
1 1 2 2 1 1 2 2,T T
u u u u N Nu θ are the vectors of nodal displacements,
01 01 02 02 ,T
u u u u 0Nu 01 01 02 02
T 0Nθ are the vector of nodal initial out-
of-straightness, and 1 1 2, ,...,u u are the nodal displacements. The moment distribution within the
element is related to the nodal moments vectors 1 2M MTM through linear interpolation,
i.e.,
2 11 2
T
M z z
H M (3.14)
in which 1 2
1T
z L z L H z . From Eq. (3.13), by substituting into the energy
expressions Eqs. (3.1)-(3.3), and omitting the strong axis bending terms as they are uncoupled
from the lateral torsional response, one obtains
1 2
0 0 0 0
1 1
2 2
T T
T T T T
N e N N e N
N g N N g N N g N N g N
u k u θ k θ
u k θ u k θ u k θ u k θ
(3.15)
in which 10
,L
yEI dz T
e u uk N N and 20 0
L L
wGJ dz EC dz
T T
ek N N N N are the elastic
stiffness matrices pertaining to weak axis flexure and torsion/warping, respectively, and
1 20
1L
M z L M z L dz T
g uk N N is the geometric stiffness matrix and the entries
of matrices 1ek , 2ek and gk are provided in Appendix 3-A. By evoking the stationarity
condition and rearranging, one obtains
e g 0k d k d F d (3.16)
in which
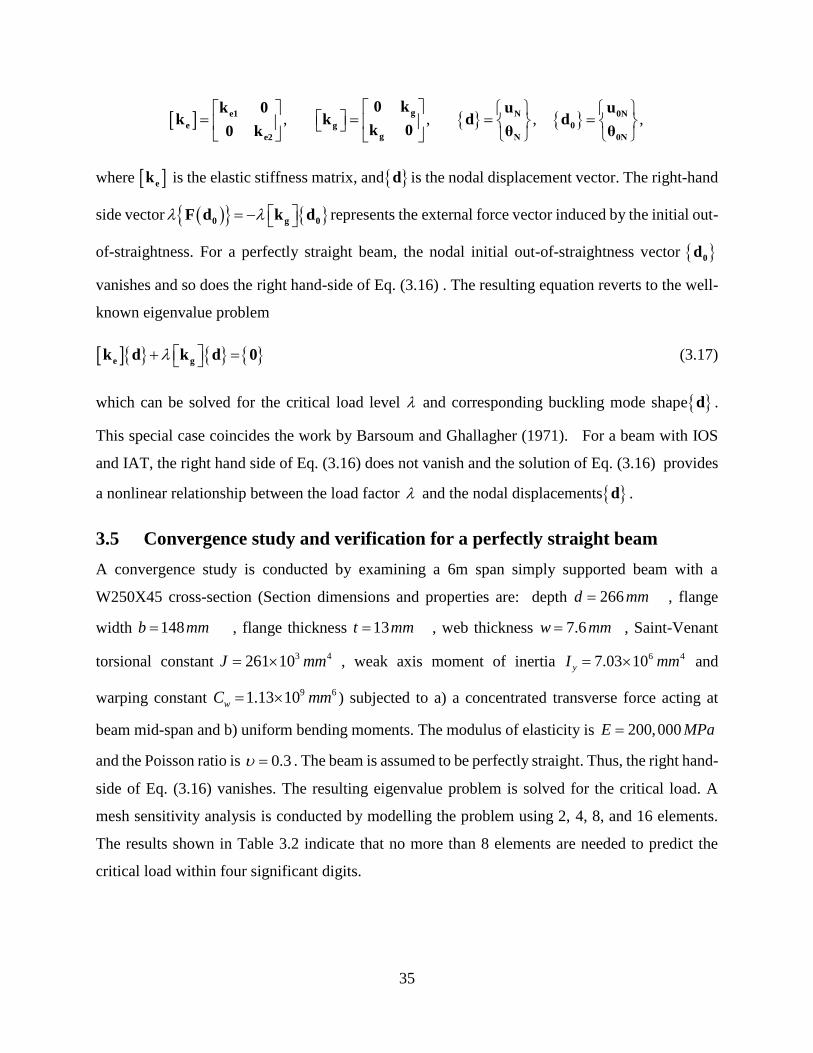
35
, , , ,
ge1 N 0N
e g 0
ge2 Ν 0Ν
0 kk 0 u uk k d d
k 00 k θ θ
where ek is the elastic stiffness matrix, and d is the nodal displacement vector. The right-hand
side vector 0 g 0F d k d represents the external force vector induced by the initial out-
of-straightness. For a perfectly straight beam, the nodal initial out-of-straightness vector 0d
vanishes and so does the right hand-side of Eq. (3.16) . The resulting equation reverts to the well-
known eigenvalue problem
e gk d k d 0 (3.17)
which can be solved for the critical load level and corresponding buckling mode shape d .
This special case coincides the work by Barsoum and Ghallagher (1971). For a beam with IOS
and IAT, the right hand side of Eq. (3.16) does not vanish and the solution of Eq. (3.16) provides
a nonlinear relationship between the load factor and the nodal displacements d .
3.5 Convergence study and verification for a perfectly straight beam
A convergence study is conducted by examining a 6m span simply supported beam with a
W250X45 cross-section (Section dimensions and properties are: depth 266d mm , flange
width 148b mm , flange thickness 13t mm , web thickness 7.6w mm , Saint-Venant
torsional constant3 4261 10J mm , weak axis moment of inertia
6 47.03 10yI mm and
warping constant 9 61.13 10wC mm ) subjected to a) a concentrated transverse force acting at
beam mid-span and b) uniform bending moments. The modulus of elasticity is 200,000E MPa
and the Poisson ratio is 0.3 . The beam is assumed to be perfectly straight. Thus, the right hand-
side of Eq. (3.16) vanishes. The resulting eigenvalue problem is solved for the critical load. A
mesh sensitivity analysis is conducted by modelling the problem using 2, 4, 8, and 16 elements.
The results shown in Table 3.2 indicate that no more than 8 elements are needed to predict the
critical load within four significant digits.

36
Table 3.2: convergence study on the critical load
Number of
elements
Critical
moments for
case (a) (kNm)
*
16a aM M Critical moment
for case (b)
(kNm)
*
16b bM M Moment
gradient
a bM M
2 137.66 1.005 101.14 1.005 1.361
4 137.00 1.001 100.70 1.000 1.360
8 136.91 1.000 100.67 1.000 1.360
16 136.91 1.000 100.67 1.000 1.360
* 16aM critical moment based on 16 elements in case (a), 16bM critical bending moments
based on 16 elements in case (b)
The moment gradient obtained in the last column of Table 3.2 compares to
2 2 2 2
max max 1.4 2654 7 4CAN A B CC M M M M M based on the Canadian Standards
(CAN/CSA S16-14) where AM , BM and CM are the bending moments at the quarter-span, mid-
span and three-quarter span points. The corresponding value in American Standards (ANSI/AISC
360-16) is max max12.5 2.5 3 4 3 1.316AISC A B CC M M M M M , that based on the
Australian Standard (AS 4100-1998) is 2 2 2
max1.7 1.388AUS A B CC M M M M and that based
on the Eurocode Guide (EN 1993-1-1:2005) is 1.365EUC . For the case of uniform moments, the
present solution predicts a critical moment crM of 100.7 kNm. This value nearly coincides with
that based on the thin-walled B31OS element in ABAQUS of 99.5 kNm using 40 elements.
Another comparison is done by modeling the problem using the shell element S4R in ABAQUS.
The S4R element has 4 nodes with six degrees of freedom per node with reduced integration and
hourglass control. The mesh used involves six elements for each flange, eight elements along the
web height, and 180 elements along the span. The simply supported boundary conditions are
imposed by restraining the vertical, horizontal displacement and the rotation about the longitudinal
axis of both flanges and web at both ends. The critical moment obtained is 95.9 kNm which is 4.8%
percent lower than that predicted by the present element. The slight difference is due to the fact
that, unlike thin-walled beam elements, the shell solution captures shear deformation and
distortional effects. The corresponding buckling mode is depicted in Figure 3.3. A comparison of
the buckling modes shapes normalized with respect to the peak lateral displacement at the centroid

37
of the mid-span / 2cu z L shows that the buckling mode shapes based on the present solution
essentially coincide with those based on B31OS and S4R elements model in ABAQUS (Figure
3.4). Slight differences are observed in the angle of twist plots depicted in Figure 3.4 (b) where a
difference of 1.16% is observed between the present solution and the B31OS solution and a 3.11%
difference with the S4R model.
Figure 3.3 Buckling shape for a 6-m span beam with W250X45 section under uniform bending moments
based on S4R model in ABAQUS

38
(a)
(b)
Figure 3.4 First buckling mode for 6m straight beam based on a) present study, b) B31OS solution and c) S4R
solution
3.6 Verification for a beam with initial geometric imperfections
3.6.1 Mesh sensitivity analysis
A beam with initial geometric imperfections, cross-section, span, and material properties identical
to those described in section 3.5 is considered in this section. The IOS 0u z and IAT 0 z are
assumed to follow the first buckling mode shape as obtained from the eigen-solution for the
perfectly straight beam in Section 3.5. The amplitude of the peak IOS at mid-span of the
compression flange is 0 0 0/ 2 / 2 / 2 / 2cu L u L d L , in which subscript c denotes the
compression flange, subscript 0 denotes the initial out-of-straightness, and d is the total section
height. The peak IOS 0 / 2cu L was set equal to /1000 6L mm . A mesh sensitivity analysis for
the present element is conducted by analyzing the beam using 2, 4, 8 and 16 elements as illustrated
in Figure 3.5. The lateral displacements at the centroid of the mid-span section against the the
number of elements when the applied moment is 90.1M kNm . The difference in lateral
displacement at mid-span as predicted by the 8 and 16 elements is found negligible. Thus, 8
elements in the model are judged to be adequate to capture the displacement response for beams
with initial out-of-straightness. In the following analyses, 40 elements are used in the present finite
element solution to obtain smooth curves for the additional lateral displacement u z and the
angle of twist z .

39
Figure 3.5 Lateral displacement at centroid at mid-span versus the number of elements used in the present
finite element solution (applied moment = 90.1kNm)
3.6.2 Comparison with other solutions
The problem was solved using the present model and a nonlinear incremental load-deformation
analysis based on the S4R element shell FEA (Figure 3.6). The specifics of the S4R mesh are
identical to those of Section 3.5. Keyword NLGEOM in ABAQUS is adopted to evoke the
geometric nonlinear feature. Under the present model, the beam is meshed into 40 elements.
Figure 3.6 depicts the applied moments versus the peak total lateral displacement at compression
flange mid-span as given by 0 0/ 2 / 2 / 2 / 2 / 2 / 2cu L u L u L d L L where,
as matter of convention, the bar on top of an argument displacement denotes the total out-of-
straightness obtained by the summation of the initial out-of-straightness and the additional
displacement. When the applied moments are comparatively low, the peak total lateral
displacement predicted by the present finite element formulation is observed to coincide with that
based on the ABAQUS model. The difference between the two models is observed to slightly grow
with the loading level, but still agree within 2.2% within the range of deformations investigated.

40
Figure 3.6 Bending moments versus total lateral displacement at the compression flange For W250x45 section
3.6.3 Verification and Comparisons
Four common cross-sections (Table 3.3) are examined using the present finite element solution
and the B31OS element in ABAQUS to assess the validity of the present finite element solution.
The B31OS element is a two-node linear element and has seven degrees of freedom (three
translations, three rotations and a warping deformation) for each node. The B31OS model is
discretized into 40 elements along the span. The initial out-of-straightness is modeled directly by
input of the pre-calculated coordinates for the considered beam with initial out-of-straightness.
Option NLGEOM in Abaqus is evoked to apply the load incrementally and generate the load-
displacement relation in Figure 3.7.
Figure 3.7 shows that, for all four sections examined, the lateral displacement increases slowly
with the applied moments within the range 0.8crM M , but rises rapidly beyond this range. The
present finite element solution predicts a moment-displacement relationship that asymptotically
approaches the relation 1crM M , crM being the elastic critical moments as determined by the
eigen-value solution of a perfectly straight beam.
The best agreement between the present finite element solution and B31OS model is obtained for
the W250X28 section. When the additional lateral displacement at the compression fiber is
270cu L the difference in / crM M predictions is 1.5% (Figure 3.7). This percentage difference

41
decreases to 1.3% when 180cu L , and 0.9% when 90cu L . The largest difference between the
predictions of the present finite element and B31OS solutions is observed for the W250X58 section,
where the difference in / crM M is found to be 9.7% when the additional lateral displacement at
the extreme fiber is 270cu L . This difference is found to marginally increase to 10.2% and 10.5%
when the displacements increases to 180cu L and 90cu L , respectively.
Table 3.3 Section dimensions and geometric properties for the examined cross-sections
d b t w xI yI wC J
mm
4
610
mm
4
510
mm
6
1010
mm
3
410
mm
W250X18 251 101 5.3 4.8 22.4 9.1 1.4 2.2
W250X28 260 102 10 6.8 40.0 17.8 2.8 9.7
W250X45 266 148 13 7.6 71.7 70.3 11.3 26.1
W250X58 252 203 13.5 8 87.3 188.0 26.8 40.9
Figure 3.7 Moment-lateral displacement relations for W250X18, W250X28, W250X45 and W250X58
obtained from B31OS mode in ABAQUS
3.7 Effect of the IOS pattern on response for beams under uniform moments
In the absence of experimental measurements, previous studies (e.g., Kala and Melcher 2009 and
Nguyen and Chan et al. 2013) have assumed the initial out of straightness to follow a sinusoidal

42
distribution. Other studies (Aguero et al. 2015 a,b) have postulated that initial geometric
imperfections to follow the first buckling mode for a straight beam. The validity of such
assumptions on the response need to be examined and is the scope of the following sub-sections.
3.7.1 Effect of IOS/IAT patterns
Consider a beam with a W250x45 under strong axis moment M that induces compression at the
top flange (Figure 3.8). It is assumed that the initial geometric imperfections are fully characterized
by the IOS 0u z (defined at the section centroid) and the IAT 0 z for the cross-section. The
corresponding initial IOS at the compression flange is 0 0 02cu z u z d z and that at
the tension flange is 0 0 02tu z u z d z . It is assumed that both 0u z and 0 z are
sinusoidal curves so that peak IOS 0 0 0max / 2 , / 2p t cu u L u L may take place either at
the top flange under compression (Pattern a in Figure 3.8) or the bottom under tension (Pattern b
in Figure 3.8b) of the mid-span section. The peak IOS is specified to take some value such as
0 1000pu L while the IOS at the other flange 0 qu ranges from 0 pu to 0 pu . Five IOS cases
(1 through 5) are considered
0 0, /1000 1,1 1,0.325 1,0 1, 1 0,1p qu u L
where Case 1 corresponds to equal lateral IOS at both flanges (i.e., with no IAT), Case 2
corresponds to first mode shape of the beam where the bottom flange undergoes a lateral
displacement equal to 32.5% of that of the top flange for the present problem, Case 3 corresponds
to a top flange IOS with no IOS at bottom flange, Case 4 corresponds to two equal and opposite
lateral displacements of both flanges, thus corresponding to the case with IAT but no IOS, and
Case 5 corresponds to bottom flange IOS (with no IOS at top flange).

43
(a) (b)
Perfectly straight configuration
Imperfect beam
Figure 3.8 Illustration for the combination of IOS and IAT for (a) pattern a and (b) pattern b
Figure 3.9 (a) shows that a beam with a specified IOS a larger positive and a given load level, an
increase in IAT 0 z corresponds to a larger total lateral out-of-straightness (TLOS)
displacement at the compression flange cu (Case a in Figure 3.8 a). However, for the case where
the IAT 0 z is negative (Figure 3.8 b), a larger IAT magnitude results in a smaller TLOS
displacement the compression flange since the cross-section rotates to the position of zero twist as
the applied load is increased before it undergoes a positive angle of twist. This observation
coincides with the characteristics of the closed form solution buckling solution where both u z
and z are positive.
Taking Case 1 0 0, 1000 1,0p qu u L which conforms to pattern (a) in Figure 3.8 (a) the load-
displacement curves for the lateral displacement at the compression flange/angle of twist at mid-
span are presented in the plot labelled as (1, 0) in Figure 3.8 (b). If the beam is installed upside
down, the compression flange in case (a) becomes the tension flange in case (b) (i.e.

44
0 0, 1000 0,1p qu u L ), and the behavior of the load-displacement curve would differ as
depicted in the plot labelled (0,1) in Figure 3.9. This suggests that the orientation of the section
influences the load-displacement curves.
In the absence of specific experimental measurements for initial geometric imperfections, past
studies on steel beams (Kala and Melcher 2009 and Nguyen and Chan et al. 2013) have been
postulated to conform to the first buckling mode shape. Such an approach corresponds to
1000 1,0.325L in the present study. The plots provided Figure 3.9(a), suggest that this
approach leads to conservative estimates for the lateral displacements and the angle of twist for
the cases 0 0, 1000 0,1p qu u L and 0 0, 1000 1,1p qu u L but corresponds to un-
conservative estimates for cases 0 0, 1000 1,0p qu u L and 0 0, 1000 1, 1p qu u L .
However, it is observed that the difference between all five cases considered decreases as the
applied moments decrease. For example, the ratio of moments for the two extreme cases
0 0, 1000 0,1p qu u L and 1000 1, 1L , is 25% when 30cu mm while the difference
between the case 0 0, 1000 1,1p qu u L and 1000 1,0.325L is smaller than 6%. The
corresponding difference in total angle of twist for these two cases are found negligible when
0.15rad .
(a)
(b)
Figure 3.9 Bending moments versus (a) peak total lateral out-of-straightness (TLOS) at section mid-height and
(b) total angle of twist (TAT) for 0 0,p qu u = (a) /1000 1,1L , (b) /1000 1,0.325L , (c)
/1000 1,0L , (d) /1000 1, 1L and (f) /1000 0,1L (peak lateral displacement is 1000L in
all cases)

45
3.7.2 Contribution of higher modes
A perfectly straight beam corresponding to that investigated in the previous section is examined
to obtain the first and third buckling modes by conducting an eigenvalue analysis. The extracted
buckling modes are then normalized so that the peak lateral displacement for the corresponding
mode at the top flange of mid-span section is equal to unity to reach the normalized buckling
modes 1 and 3 . A load-displacement analysis based on the present model is conducted
based on an IOS pattern given by a linear combination
1 3 1 3/1000 1 6 1L mm . Six cases are considered for
1.0, 5 6, 4 6, 3 6 ,2 6 ,1 6 where 1.0 corresponds to the case where IOS follows only
the first mode, and 5 6 corresponds to the case where the magnitude of IOS due to the first
mode is 5mm and that due to the third mode is 1mm , etc. Plots for the bending moments versus
the peak TLOS are provided in Figure 3.10. At a given bending moment level, the beam with the
lower contribution of the first buckling mode is observed to undergo a smaller lateral displacement.
The observation suggests that, for a given peak initial out-of-straightness 0 / 2cu L , the first
mode is consistently more detrimental and then the third mode and will thus be adopted in
subsequent investigations.
Figure 3.10 Bending moments versus the peak total lateral out-of-straightness (TLOS) for the first and third
buckling modes superposition cases

46
3.8 Proposed design criteria for beams with initial geometric imperfections
As depicted in Figure 3.6, an eigenvalue solution provides a clear-cut value for the critical
load/moments for an initially perfectly straight beam. Such an analysis does not incorporate the
IOS-IAT effects. To the contrary, a nonlinear analysis accounts for IOS-IAT effects but provides
no clear-cut value for critical load. To establish a design value, it is thus necessary to introduce
failure criteria for design. Two types of failure criteria can be considered:
(1) A serviceability criterion can be postulated such that it limits the peak additional lateral
displacement / 2 / 2 / 2u L d L under service loads to a threshold value such as /180L ,
/ 360L etc. where the magnitude of such a threshold value depends on the type of application
involved.
(2) A stress based criterion, where the normal stresses induced by the combined normal stresses
induced by the strong axis moment xM , weak axis moment yM and bimoments B are not to
exceed the yield strength of the material yF , taken as 350MPa in subsequent runs, or a fraction
thereof yF , to account for the presence of residual stresses such a criterion may take the form
2 2 4
yx
y
x y w
M zM z B zh b bdz F
I I C (3.18)
in which, is a fraction of the yield strength that accounts for the presence of residual stress. In
ANSI- AISC 360-16 the fraction is taken as 0.7. The criterion in Eq. (3.18) is valid for Class 3
sections (i.e., non-compact in ANSI/AISC 360-16), and would yield conservative results for Class
1 or 2 section (compact sections). To obtained the normal stress at section z for the uniform
bending moment case, Eq. (3.18) is expressed in terms of the applied moment M as (Figure 3.11)
cos sin
2 2 4x y w
M z M z B zh b bdz
I I C
(3.19)
in which, B z is obtained by post-multiplying the elastic stiffness matrix ek of the relevant
element by the corresponding nodal displacements ed . When the angle of twist z in Eq.
(3.19) is small, one obtains

47
2 2 4x y w
M z B zM h b bdz
I I C
(3.20)
The maximum compressive stress takes place at beam mid-span and is obtained by setting / 2z L .
Figure 3.11 Geometric relationship for the projections of the applied moment on the bending axes
3.8.1 Verification of stresses
Consider a six-meter-span beam with W250X28 cross-section with IOS 1000 6L mm based on
IOS that follows the first mode. For a beam under uniform bending moments, the normal stresses
have been computed using three different approaches as detailed in the following:
(1) In the present finite element solution, the internal forces ( ,x yM M and B ) are obtained by post-
multiplying the elastic stiffness matrix ek of the relevant element by the corresponding nodal
displacement ed to recover the nodal force vector 8 1 8 18 8
e ef k d . The elements of nodal
forcv vector f contain the internal forces , ,x yM M B needed to compute the stresses from Eq.
(3.18).
(2) For a simply supported beam under uniform moments M z M , the bending moments are
given from equilibrium, i.e., cosxM z M z , sinyM z M z as illustrated in Figure

48
3.11. However, the bimoment B z needs to be determined from the technique described in the
previous section. The stresses are then computed from Eq. (3.19).
(3) For the verification, the stress output as obtained from a B31OS solution.
A comparison of the results is shown in Figure 3.12. All three solutions predict nearly coinciding
normal stresses. Thus, the present FEM solution in conjunction with Eq. 3.18 will be used to
compute the normal stresses in subsequent sections.
Figure 3.12 Comparison between normal stresses as determined by various techniques
3.8.2 Applying the displacement failure criterion-Illustrative Example
A simply supported beam with W250X45 cross-section has a 6m span and is subjected to uniform
bending moments M . The beam is assumed to be initially non-straight and to follow the first
buckling mode. Three IOS magnitudes are examined for the peak initial out-of-straightness at the
top flange 0 / 600 10cu L mm 0 / 800 7.5cu L mm and 0 /1000 6cu L mm . The
relationships between the bending moments and corresponding total lateral displacement at the
compression flange 0 0/ 2 / 2 / 2 / 2 / 2 / 2cu L u L u L d L L are compared in
Figure 3.13. All three cases exhibit an asymptotic behaviour towards the critical moment as
predicted by the eigenvalue solution for a hypothetically perfectly straight beam with similar
dimensions. For a given target total lateral displacement at the compression flange, an increase in
IOS is observed to decrease the corresponding bending moments attained. For example, if a total

49
lateral displacement at the compression flange of / 2cu L 30mm is targeted, the cases where
the total peak IOS are / 600L , / 800L and /1000L , respectively correspond to 66.6%, 75.0%,
and 80.0% of the critical moments crM of the perfectly straight beam (as determine by an
eigenvalue solution). Also, depicted in Figure 3.13 are the bending moments corresponding to a
additional peak lateral displacement /180cu L . Bending moment fractions of 0.77Mcr, 0.82Mcr
and 0.85Mcr are attained respectively for peak IOS = / 600L , / 800L and /1000L .
Figure 3.13 Bending moments versus total lateral displacement at compression flange midspan for various
IOS a) 0 /1000 6cu L mm b) 0 / 800 7.5cu L mm and c) 0 / 600 10cu L mm
3.8.3 Illustrative example for applying stress failure criterion
A comparison between the stress predictions of ABAQUS-S4R and ABAQUS-B31OS solutions
and those of the present study is provided in Figure 3.14 for the example defined in the previous
section. For a specified target peak normal stress of 70% of the yield strength, the present solution
is observed to slightly underestimate the peak bending moments compared to the ABAQUS S4R
shell model predictions. The present model predicts that the beam with W250X45 cross-section
attains 80.3% of the critical moments while the corresponding fraction of the W250X18 cross-
section is 91.2%. The present solution predicts that the peak normal stress as determined from Eq.
(3.18) attains the threshold yield stress of 0.7 245yF MPa when the applied bending moment is
80.34 kNm (Figure 3.14 a). The corresponding prediction based on the S4R model is 83.9kNm, a
4.29% difference. In comparison, for the W250X18 section, Figure 3.14 (b) shows that the
moments predicted by the present model is 10.0 kNm while the corresponding value based on the

50
ABAQUS model is 10.6 kNm, a 5.67% difference. For the W250X45 cross-section, the bending
moment-normal stress relationship based on all three solutions are in close agreement (Fig. 3.13a).
The plot based on the B31OS element is observed to be close to that based on the present FEM for
small applied moments (i.e., 60M kNm ). Beyond this range, the response of the B31OS model
slightly departs from the present solution and merges with the response of the S4R model. To the
contrary, for the W250x18 beam, the difference between the applied moments from B31OS
element and the present FEM is found to decrease as the normal stresses increase. For example,
when 50MPa , the difference between the two models is 14.1%. When the peak normal
stresses at mid-span increase to 200MPa , the corresponding difference is 3.4%.
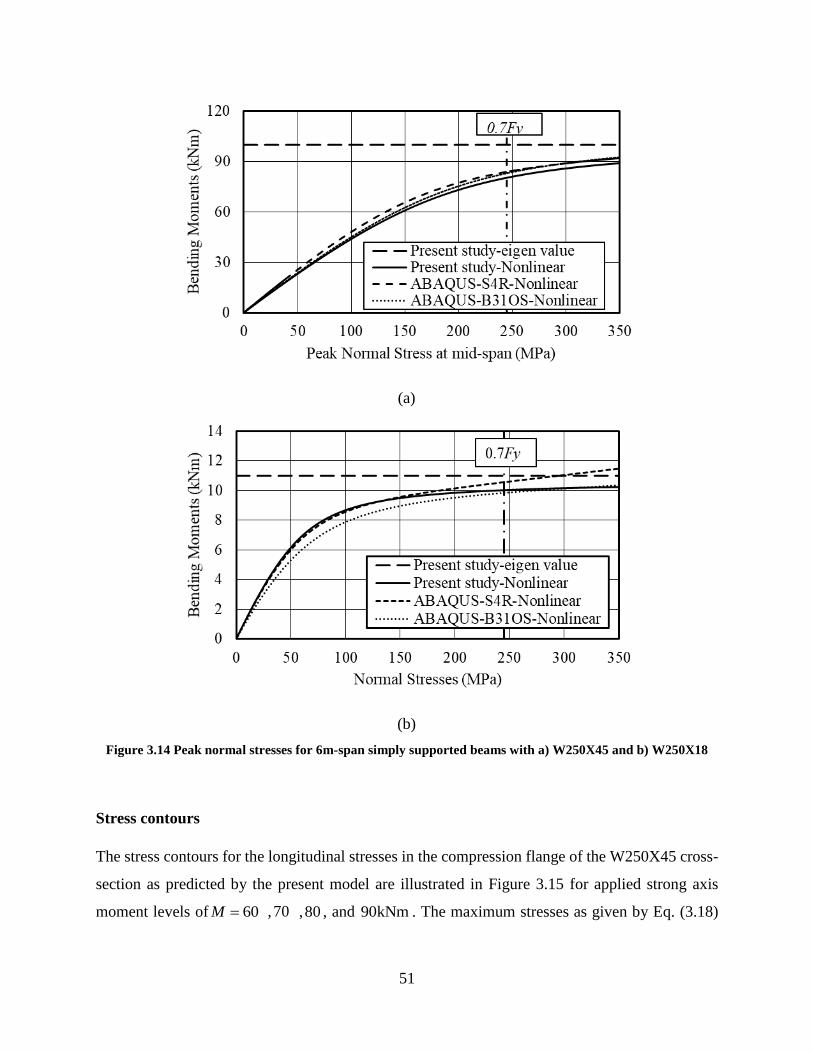
51
(a)
(b)
Figure 3.14 Peak normal stresses for 6m-span simply supported beams with a) W250X45 and b) W250X18
Stress contours
The stress contours for the longitudinal stresses in the compression flange of the W250X45 cross-
section as predicted by the present model are illustrated in Figure 3.15 for applied strong axis
moment levels of 60M , 70 ,80 , and 90kNm . The maximum stresses as given by Eq. (3.18)
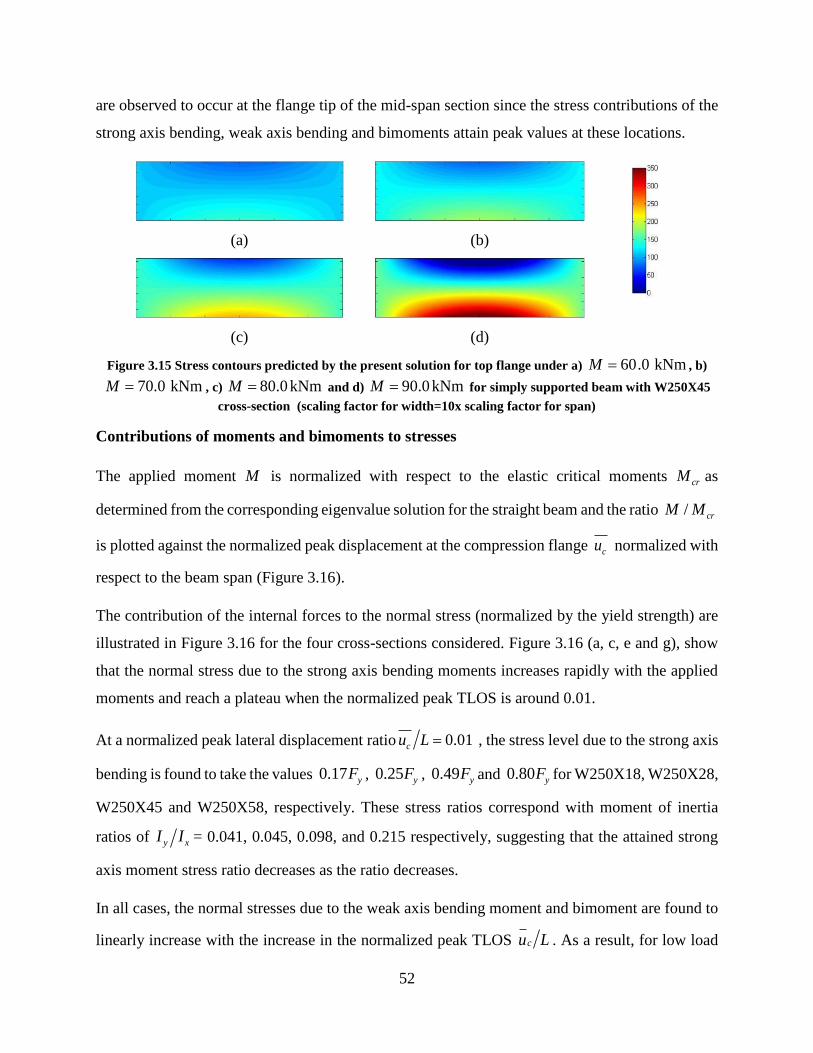
52
are observed to occur at the flange tip of the mid-span section since the stress contributions of the
strong axis bending, weak axis bending and bimoments attain peak values at these locations.
(a)
(b)
(c)
(d)
Figure 3.15 Stress contours predicted by the present solution for top flange under a) 60.0 kNmM , b)
70.0 kNmM , c) 80.0 kNmM and d) 90.0 kNmM for simply supported beam with W250X45
cross-section (scaling factor for width=10x scaling factor for span)
Contributions of moments and bimoments to stresses
The applied moment M is normalized with respect to the elastic critical moments crM as
determined from the corresponding eigenvalue solution for the straight beam and the ratio / crM M
is plotted against the normalized peak displacement at the compression flange cu normalized with
respect to the beam span (Figure 3.16).
The contribution of the internal forces to the normal stress (normalized by the yield strength) are
illustrated in Figure 3.16 for the four cross-sections considered. Figure 3.16 (a, c, e and g), show
that the normal stress due to the strong axis bending moments increases rapidly with the applied
moments and reach a plateau when the normalized peak TLOS is around 0.01.
At a normalized peak lateral displacement ratio 0.01cu L , the stress level due to the strong axis
bending is found to take the values 0.17 yF , 0.25 yF , 0.49 yF and 0.80 yF for W250X18, W250X28,
W250X45 and W250X58, respectively. These stress ratios correspond with moment of inertia
ratios of y xI I = 0.041, 0.045, 0.098, and 0.215 respectively, suggesting that the attained strong
axis moment stress ratio decreases as the ratio decreases.
In all cases, the normal stresses due to the weak axis bending moment and bimoment are found to
linearly increase with the increase in the normalized peak TLOS cu L . As a result, for low load

53
levels, the normal stresses are primarily due to strong axis bending. As the applied loads increase,
the share of normal stresses due to weak axis bending and bimoments increase compared to that
of the strong axis contribution which decreases with cu L as illustrated in Figure 3.16 (b, d, f,
and h). At a normalized peak TLOS of 0.03, the percentage of the normal stress due to weak axis
bending moment is around 50% of the total normal stress in all four cases.
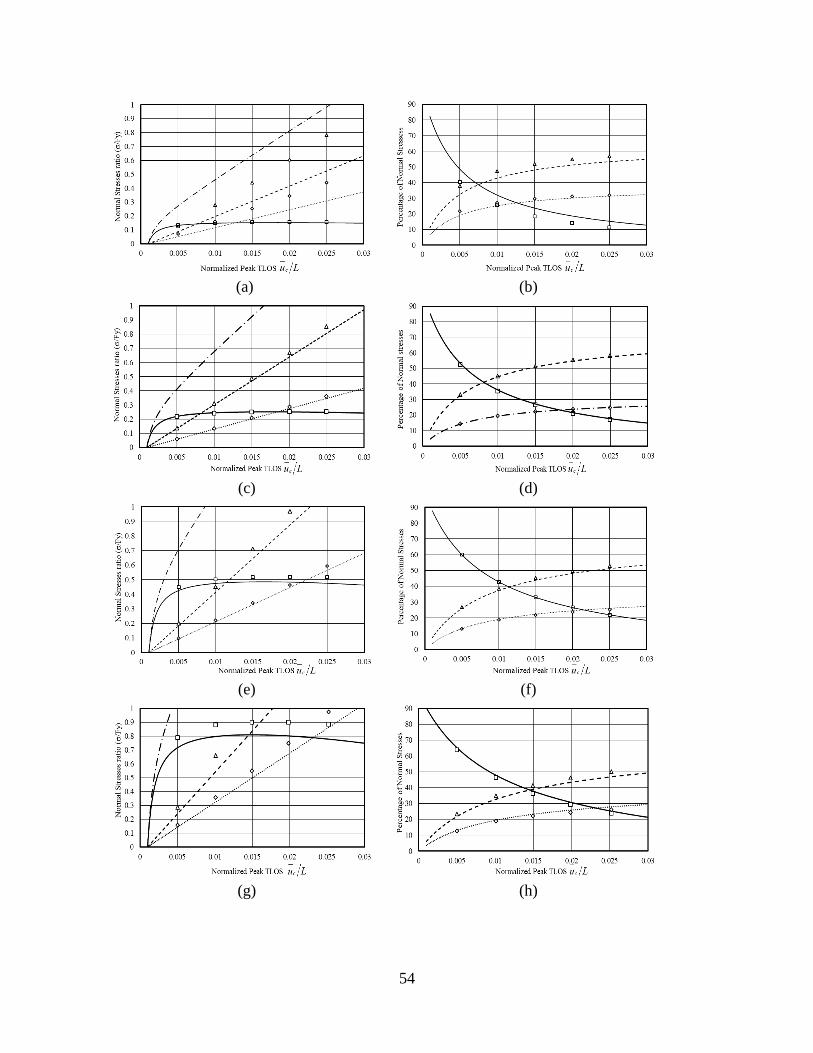
54
(a)
(b)
(c)
(d)
(e)
(f)
(g)
(h)

55
Figure 3.16 Normal stress ratio and percentage of normal stresses versus normalized peak displacement for
W250X18 (a b), W250X28 (c and d), W250X45 (e and f) and W250X58 (g and h)
3.9 Parametric study
3.9.1 Effect of beam span on bending moment and normal stress ratios
To investigate the influence of beam span, four simply supported beams with a W250X45 cross-
section with spans ranging from five to eight meters are investigated using the present solution.
The imperfection pattern is assumed to follow the first mode (as discussed in Section 3.7.2) and
the peak IOS is set to 0 /1000cu L in all cases, corresponding to values of a) 5mm, b) 6mm, c)
7mm and d) 8mm, respectively.
The relationship between the normalized peak TLOS / 2 /cu L L and the normalized bending
moments / crM M is depicted in in Figure 3.17 (a) for all spans examined. All four relationships
are observed to perfectly coincide, indicating that the span has no effect on the normalized
moment-displacement curves. Figure 3.17 (b) shows that for a given normalized peak total lateral
out-of-straightness /cu L , the normal stresses ratio yF attained is found to decrease with the
span, suggesting that longer span beams can sustain a larger normalized peak displacement
compared to short span beams.
(a)
(b)
Figure 3.17 (a) Normalized bending moments and (b) normalized normal stresses versus normalized peak
total lateral out-of-straightness (TLOS) for W250X45 with span from 5 m to 8 m

56
3.9.2 Effect of section class on normalized bending moments and normal stress
Four simply supported beams with different section classes are examined. The W250x25 is taken
as a reference case (Case 1 in Table 3.4). For a yield strength of 350MPa, the web meets class 1
requirements according to CAN-CSA S16 (2014). The web thickness is then reduced so that it
becomes class 2 (Case 2), and then further reduced to become class 3 (Case 3) and class 4 (Case
4). The geometric parameters of the four sections are provided in Table 3.4. Figure 3.18 (a) shows
identical bending moment versus normalized TLOS in all four cases while Figure 3.18 (b), shows
a minor difference in stress ratios.
Table 3.4: Section properties for the four examined I-section class
Total web
depth (mm)
Web thickness
(mm)
Flange
breadth
(mm)
Flange
thickness
(mm)
Class 1 257 6.1 102 8.4
Class 2 257 6.1 102 6.5
Class 3 257 6.1 102 5.0
Class 4 257 6.1 102 4.0
(a)
(b)
Figure 3.18 (a) Normalized bending moments and (b) stress ratios versus normalized peak total lateral out-of-
straightness (TLOS) for various classes
3.10 Summary and Conclusions
A thin-walled-beam finite element solution was developed for the lateral torsional response of
steel beams with initial geometric imperfections. The validity of the solution was assessed by
comparisons against Abaqus shell models (using S4R elements) and thin-walled elements (using
57
B31OS elements). Two design criteria were proposed based on threshold values for (1) the total
lateral displacement and (2) the maximum normal stress. Illustrative examples were provided for
applying each of the criteria. Patterns of the initial geometric imperfections were studied and a
parametric study was performed to study the effect of spans and section class on the behavior of
examined beams. The main findings of the study are summarized as follows:
1. The present finite element solution reliably predicts the load-displacement behavior for
geometrically imperfect beams.
2. For a given peak initial lateral out-of-straightness, the most detrimental initial imperfection
patterns were found to be associated with the highest initial angle of twist where the other flange
has an equal and opposite lateral out-of-straightness.
3. When the initial imperfections are expressed as the summation of buckling modes, the most
adverse geometric imperfection pattern is found to be associated with the first buckling mode.
3. For the displacement based design criterion, it is observed that only the magnitude of the initial
imperfection affects the response of the beam. Thus, the LTB resistance of a beam is solely
influenced by the magnitude of the initial imperfection 0 cu , and the threshold displacement
chosen by the designer.
4. The stress ratios / yF due to minor axis bending and warping are found to linearly increase
with the normalized peak additional lateral displacement /cu L while normal stress ratio yF
due to major axis bending reaches a plateau value.
5. According the stress-based design criterion, for a given normalized peak TLOS /cu L the stress
ratio / yF is found to decrease with the beam span.
6. The present model suggests that web thickness does not influence the normalized moment versus
/cu L response and to have a rather minor role in the stress ratio / yF versus /cu L response.
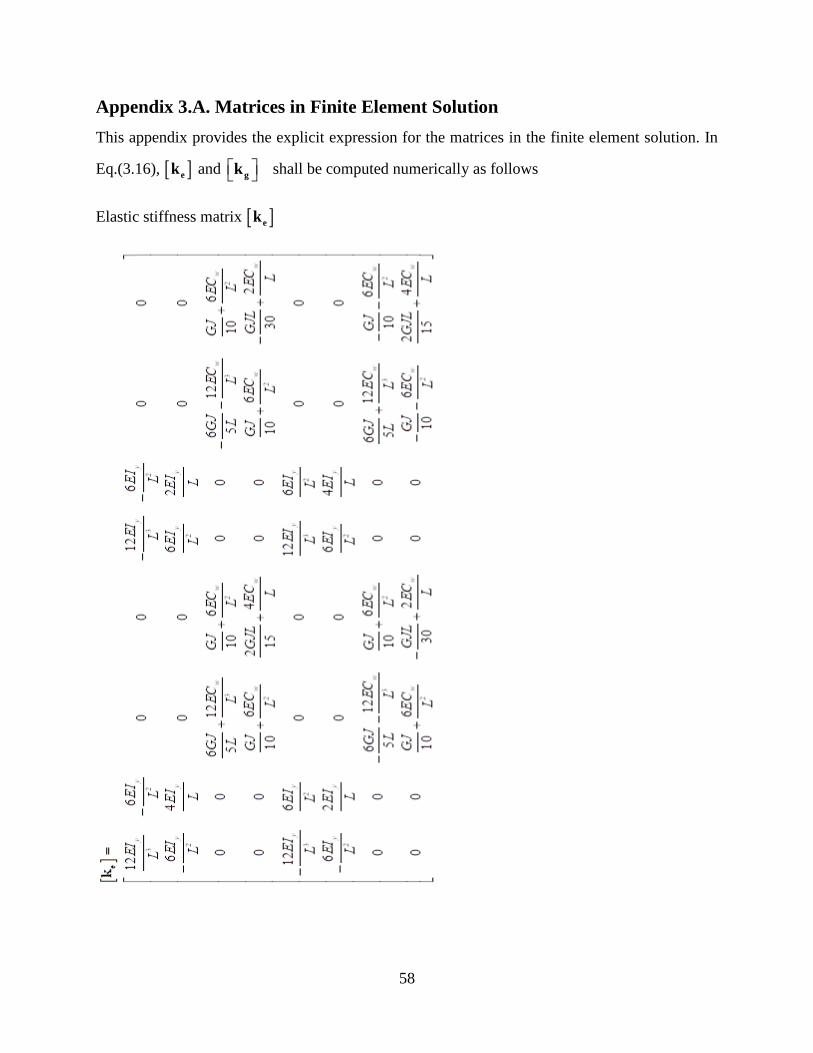
58
Appendix 3.A. Matrices in Finite Element Solution
This appendix provides the explicit expression for the matrices in the finite element solution. In
Eq.(3.16), ek and gk shall be computed numerically as follows
Elastic stiffness matrix ek

59
Geometric stiffness matrix gk

60
4. Parametric study for proposed design equations
4.1 Objectives
The present chapter complements the study in Chapter 3 by identifying the key parameters
affecting the moment fraction attainable based on the displacement and stress criteria proposed in
the previous chapter. The influential dimensionless parameters are first extracted from the closed
form solution for an initially crooked beam under uniform moments. Next, the parameters
identified are extended to investigate other loading cases.
4.2 Considered beams for the parametric study
A total of 21 cross-sections (Table 4.1) among common W150 to W310 sections in Part 6 of
Handbook of Steel Construction 2016 are selected for the parametric study. The dimensions and
section properties based on the idealized sections are provided in Table 4.1. In the calculation of
section properties rounded fillets were omitted to compare the results of the present model to that
of shell solution which does not model fillets. All spans were selected to lie within the range
min maxL L L , where the lower limit minL by equating the equation for the elastic LTB to
0.67 pM (Eq. (4.1)) for class 1 and 2 sections which is based at the border of the elastic LTB
buckling failure and inelastic LTB in the Canadian design standard (CAN/CSA S16-14) for beams
under uniform bending moment (i.e. 1CANC ). For class 3 section, the plastic moment pM in
Eq. (4.1) shall be replaced by the yield moment YM .
min
2 22
2
+4 0.67
y w
y y y w p
EI ECL
EI GJ EI GJ E I C M
(4.1)
The upper limit maxL is taken as the lesser of min2L and 12m given that beams longer than 12m
would require splicing and would thus normally avoided by designers.

61
Table 4.1 Dimensions and section properties for the considered cross-sections in the parametric study
4.3 Moment ratios based on threshold displacement criterion
4.3.1 Formulation
Chapter 3 formulated expressions for the additional lateral displacement u z and the angle of
twist z for a beam under uniform moments M with a general initial out-of-straightness
pattern of the form
2
0 0 21
1 sinn
T y
m
m crm
EI m zu z z
M L L
(4.2)
Section d b t w span A Ix Iy J Cw
(m)mm^2
x10^3
mm^4
x10^6
mm^4
x10^6
mm^4
x10^4
mm^4
x10^9
1 W150x24 160 102 10.3 6.6 5.37 30.6 13.4 1.8 9.3 10.2
2 W200x42 205 166 11.8 7.2 8.74 53.1 40.9 9.0 22.2 84.0
3 W200x36 201 165 10.2 6.2 8.68 45.7 34.4 7.6 14.5 69.6
4 W150x18 153 102 7.1 5.8 5.37 22.9 9.2 1.3 3.7 6.7
5 W200x31 210 134 10.2 6.4 7.05 40.0 31.4 4.1 11.9 40.9
6 W250x45 266 148 13.0 7.6 7.79 57.2 71.1 7.0 26.1 113.0
7 W250x39 262 147 11.2 6.6 7.74 49.2 60.1 5.9 16.9 93.4
8 W200x27 207 133 8.4 5.8 7.00 33.9 25.8 3.3 7.1 32.5
9 W200x22 206 102 8.0 6.2 5.37 28.6 20.0 1.4 5.7 13.9
10 W150x14 150 100 5.5 4.3 5.26 17.3 6.9 0.9 1.7 4.8
11 W250x28 260 102 10.0 6.4 5.37 36.3 40.0 1.8 9.7 27.7
12 W150x13 148 100 4.9 4.3 5.26 16.1 6.1 0.8 1.4 4.2
13 W250x33 258 146 9.1 6.1 7.68 41.7 48.9 4.7 9.9 73.2
14 W310x45 313 166 11.2 6.6 8.74 56.9 99.2 8.6 19.1 195.0
15 W200x19 203 102 6.5 5.8 5.37 24.8 16.6 1.2 3.6 11.1
16 W200x21 203 133 6.4 5 7.00 27.0 19.8 2.5 3.6 24.3
17 W250x25 257 102 8.4 6.1 5.37 32.3 34.2 1.5 6.5 23.0
18 W310x33 313 102 10.8 6.6 5.37 41.8 65.0 1.9 12.2 43.8
19 W310x39 310 165 9.7 5.8 8.68 49.4 85.1 7.3 12.6 164.0
20 W250x24 253 145 6.4 5 7.63 31.1 34.7 3.3 4.0 49.5
21 W310x31 306 164 7.4 5 8.63 39.3 65.4 5.4 6.1 121.0
(mm)

62
in which 2
crm m y w yM M m L EI GJ m E L C I is the critical moment corresponding to
buckling mode m . The corresponding response as characterized by the additional displacements
u z and z was found to take the form
22 2
2 2
4 21 2
sin
y y
y y w yn
crm crm
m
my
w y y
EI EImEI M EI EC EI GJ
M L L M LM m zu z
EI Lm mEC EI EI GJ M
L L
(4.3)
222
2
4 2 21
sin
y
ny crm
m
m
w
y
EIM mM
EI M L L m zz
Lm m MEC GJ
L L EI
(4.4)
Consider the special case where the initial imperfections follow the first mode. By setting 1 0
and 2 3 ... .. 0i in (4.2) and setting / 2z L to recover the peak lateral IOS 0 / 2cu L at
the compression flange located at a height / 2d , one obtains
2
0 0 0 1 2/ 2 2 2 2 1 2
y
c
cr
EIu L u L d L d
M L
(4.5)
in which 2
1cr cr y w yM M L EI GJ E L C I . If the peak lateral IOS is not to exceed a
threshold value / iL , the amplitude 1 associated with the an initial imperfection following the
first buckling mode is obtained by equating 0 / 2cu L to /L , yielding
1 2
21 2
y
i
cr
L
EId
M L
(4.6)
Under applied moments M , the corresponding additional peak lateral displacement / 2cu L
takes place also in the compression flange of the mid-span section and is obtained from (4.3) and
(4.4) as

63
2
1 22 2 2 2 1
2
y
c
cr cr
EIM du L u L d L
M M M L
(4.7)
From Eq. (4.6) by substituting into Eq. (4.7), one obtains
/ 2
1
cr
c
i cr
L M Mu L
M M
(4.8)
By adding the initial out-of-straightness 0 c iu L to both sides of Eq. (4.8), the total lateral out-
of-straightness at mid-span section / 2ctu L of the compression flange is obtained as
0
1/ 2 / 2 / 2
1c c c
i cr
Lu L u L u L
M M
(4.9)
Solving Eq. (4.9) for / crM M one obtains 1 / 2ccr iM M L u L . If the total lateral out-of-
straightness / 2cu L is not to exceed the specified threshold value / 2c iu L L L , the
magnitude of the corresponding moment , iM is given by
,1i
cr i
M
M
(4.10)
In the absence of other information, typical threshold values for initial out-of-straightness i can
be taken consistent with allowable camber and sweep limits for beams provided in Part 6 of the
Handbook of Steel Construction (2016) and plumbness limits for column as provided in Clause
29.3.3 of CAN-CSA-S16 (2014) and could be in the order of 1000, 1500, ...i etc. Also, in the
absence of additional application-specific information for beams, typical threshold values of
could be in the range 180-360 in a manner consistent with displacement thresholds specified in
informative Appendix D of CSA/CAN S16-14.
The moment ratios , /i crM M as computed from Eq. (4.10) are provided in Table 4.2. For
comparison, the critical moments crM FEA were obtained based on the present eigenvalue
analysis to characterize the critical moment for the hypothetical case of a perfectly straight beam.

64
Also, the moment M FEA corresponding to the threshold / 2c iu L L L is obtained
based on the finite element formulation developed in Chapter 3. Threshold initial out-of-
straightness values of 1000, 1500, 2000i are taken and a threshold for the additional
displacement of 180 is assumed. The results in Table 4.2 show that both approaches lead to
essentially identical results. A plot of the results is provided in Figure 4.1where the moment , iM
(as obtained from the present FEM) corresponding to a peak additional lateral displacement at the
compression flange 180cu L is normalized by the critical moment crM for a perfectly straight
beam is plotted against the ratio of the yield moment to the critical moment ratio Y crM M which
can be regarded as a measure of beam slenderness (for a given section Y crM M increases as the
span increases). In a manner consistent with the predictions of Eq. (4.10), the moment resistance
ratio , /i crM M is found to be independent of the beam slenderness and solely dependent upon
the IOS magnitude selected. For a selected threshold lateral displacement 180 , the ratios
, /i crM M are found to decease as the initial out of straightness increase (i.e., as i increases).

65
Table 4.2 Moment resistance ratios between the present finite element solution and the prediction of Eq. (4.10)
Section Span
Critical
moment
based on
FEA
(kNm)
Critical
moment
based on
CSA
(kNm)
(m) (kNm) (kNm) L/1000 L/1500 L/2000 L/1000 L/1500 L/2000 L/1000 L/1500 L/2000
W150x24 5.37 31.4 31.4 0.847 0.898 0.924 0.848 0.893 0.917 0.12% 0.56% 0.76%
W200x42 8.74 66.9 67.0 0.847 0.898 0.924 0.848 0.893 0.917 0.12% 0.56% 0.76%
W200x36 8.68 51.0 51.0 0.847 0.898 0.923 0.848 0.893 0.917 0.12% 0.56% 0.65%
W150x18 5.37 17.0 17.0 0.847 0.898 0.924 0.848 0.893 0.917 0.12% 0.56% 0.76%
W200x31 7.05 41.9 41.9 0.847 0.898 0.924 0.848 0.893 0.917 0.12% 0.56% 0.76%
W250x45 7.79 73.7 73.7 0.847 0.898 0.924 0.848 0.893 0.917 0.12% 0.56% 0.76%
W250x39 7.74 56.1 56.1 0.847 0.899 0.924 0.848 0.893 0.917 0.12% 0.67% 0.76%
W200x27 7.00 30.1 30.1 0.847 0.898 0.924 0.848 0.893 0.917 0.12% 0.56% 0.76%
W200x22 5.37 22.7 22.7 0.847 0.898 0.924 0.848 0.893 0.917 0.12% 0.56% 0.76%
W150x14 5.26 10.4 10.4 0.848 0.898 0.923 0.848 0.893 0.917 0.00% 0.56% 0.65%
W250x28 5.37 33.7 33.7 0.847 0.898 0.924 0.848 0.893 0.917 0.12% 0.56% 0.76%
W150x13 5.26 8.9 8.9 0.847 0.898 0.924 0.848 0.893 0.917 0.12% 0.56% 0.76%
W250x33 7.68 39.9 39.8 0.847 0.898 0.924 0.848 0.893 0.917 0.12% 0.56% 0.76%
W310x45 8.74 66.1 66.1 0.847 0.898 0.924 0.848 0.893 0.917 0.12% 0.56% 0.76%
W200x19 5.37 16.7 16.7 0.847 0.898 0.923 0.848 0.893 0.917 0.12% 0.56% 0.65%
W200x21 7.00 19.4 19.4 0.849 0.898 0.923 0.848 0.893 0.917 0.12% 0.56% 0.65%
W250x25 5.37 33.7 25.9 0.846 0.899 0.924 0.848 0.893 0.917 0.24% 0.67% 0.76%
W310x33 5.37 40.4 40.4 0.847 0.898 0.923 0.848 0.893 0.917 0.12% 0.56% 0.65%
W310x39 8.68 51.6 51.6 0.847 0.898 0.924 0.848 0.893 0.917 0.12% 0.56% 0.76%
W250x24 7.63 22.9 22.9 0.846 0.898 0.923 0.848 0.893 0.917 0.24% 0.56% 0.65%
W310x31 8.63 33.8 33.8 0.847 0.898 0.924 0.848 0.893 0.917 0.12% 0.56% 0.76%
Displacement based moment
resistance fraction (FEM)
Moment resistance fraction
based on Eq. (4.10) Percentage difference
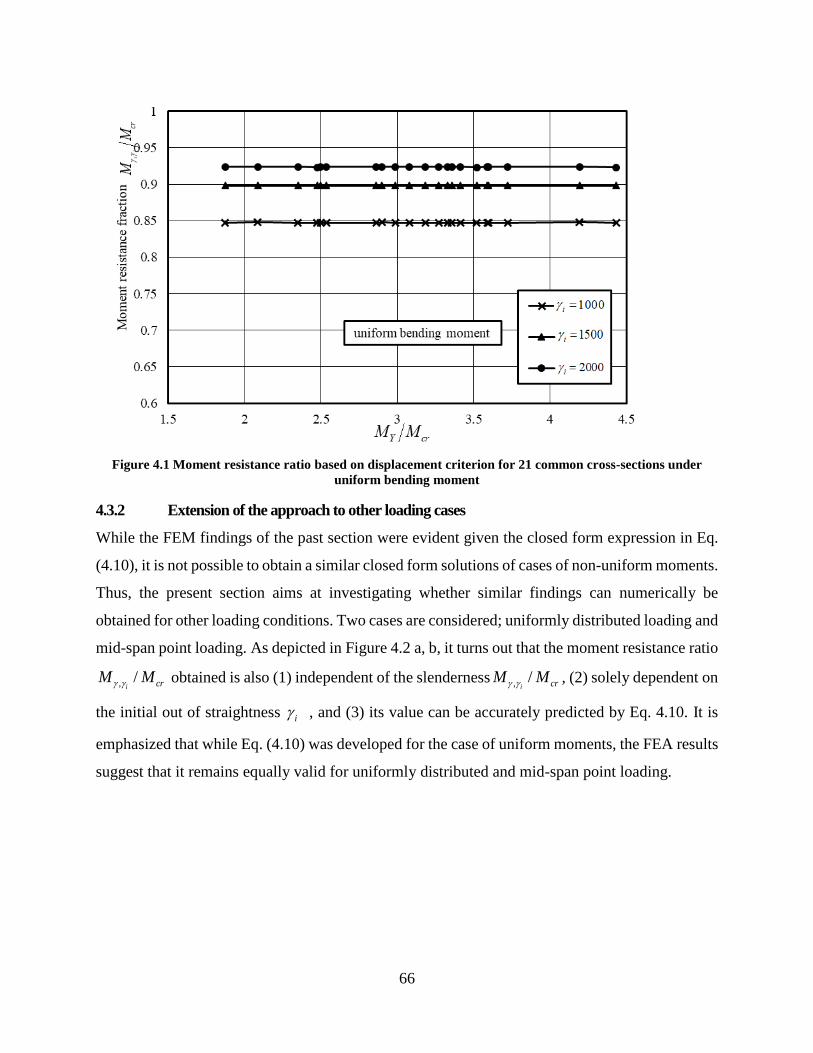
66
Figure 4.1 Moment resistance ratio based on displacement criterion for 21 common cross-sections under
uniform bending moment
4.3.2 Extension of the approach to other loading cases
While the FEM findings of the past section were evident given the closed form expression in Eq.
(4.10), it is not possible to obtain a similar closed form solutions of cases of non-uniform moments.
Thus, the present section aims at investigating whether similar findings can numerically be
obtained for other loading conditions. Two cases are considered; uniformly distributed loading and
mid-span point loading. As depicted in Figure 4.2 a, b, it turns out that the moment resistance ratio
, /i crM M obtained is also (1) independent of the slenderness , /
i crM M , (2) solely dependent on
the initial out of straightness i , and (3) its value can be accurately predicted by Eq. 4.10. It is
emphasized that while Eq. (4.10) was developed for the case of uniform moments, the FEA results
suggest that it remains equally valid for uniformly distributed and mid-span point loading.

67
(a)
(b)
Figure 4.2 Moment resistance ratio based on displacement criterion for considered sections under (a) uniform
distributed load and (b) point load at mid-span with three scenarios for out-of-straightness

68
4.3.3 Effect of span
To investigate the effect of the span on the moment resistance ratio attained based on the
displacement criterion, a beam is considered with a W200X36 cross-section under uniform
bending moment with spans varying from 6 to 10m which correspond to 36.4L b to 60.6L b
(Figure 4.3). As in previous sections, three initial out-of-straightness scenarios are considered
1000, 1500, 2000i . For a given out-of-straightness, the moment resistance ratio is found to be
independent of the slenderness L b .
Figure 4.3 moment resistance ratio for W200X36 cross-section with varying spans
4.3.4 Nominal moment resistance based on displacement criterion
In the previous section, it was observed that the only parameter influencing the moment resistance
ratio , /i crM M is the ratio of the initial out-of-straightness coefficient and the displacement target
value i . When the displacement target value is set to 180L , the moment resistance ratios are
always found to be 0.847, 0.898 and 0.924 for 1000, 1500i L L and 2000L for examined
beams, respectively. Thus, if the effect of out-of-straightness is to be incorporated into the solution,
an out-of-straightness reduction factor can be applied to the critical moment crM . The value of
the reduction factor is 0.847, 0.898 and 0.924 for 1000, 1500i L L and 2000L respectively.
For example, the nominal design moment nM accounting for initial out of straightness is given by

69
0.847n crM M when 1000i L . The reduction factor is applicable for uniform moments,
uniformly distributed loading, or mid-pan point loading.
Figure 4.4 (a) depicts the nominal moment normalized with respect to the plastic moment versus
the span (presented using the dimensionless slenderness Y crM M ) for beam with a W150X14
cross-section for three out-of-straightness scenarios ( 1000,1500,2000i ) in addition to the case
of zero out-of-straightness i as extracted from the eigen-solution. The results indicate that
the nominal resistance ranges from 84.7% of the critical moment for 2000i to 92.4% for
1000i .
Strictly speaking, the above findings are limited to the elastic range of the response as no attempts
were made to model the effect of plasticity nor to account for residual stresses. One recalls that for
a perfectly straight beam of a Class 1 or 2 cross-section, CAN-CSA-S16 (2014) stipulates that
when 0.67cr pM M , the nominal resistance is governed by the inelastic lateral torsional buckling
resistance as given by 1.15 1 0.28n p p crM M M M where the elastic critical moment
expressions for crM as provided in the present standard do not account for initial-out-of-
straightness effects. The present study provides a basis to account for such effects by simply
replacing crM by 1,M so that
1, 0.67 pM M , the nominal resistance would be governed by
inelastic lateral torsional buckling as given by the modified equation
, ,1.15 1 0.28i in p pM M M M
. It is clear that the proposed equation reverts to the present
standard equation for the case of no initial out-of-straightness where , iM crM . The
resulting plots are presented in Fig. 4.4b for the case i . The validity of proposed modified
equation would have to be verified by conducting a finite element analysis that incorporates such
effects and is outside the scope of the present study.

70
(a)
(b)
Figure 4.4 Normalized nominal moment resistance for W150x14 section ( 180L ) (a) Elastic range for
various out-of-straightness values ( 1000,1500,2000,i ) and (b) total range for the case 1000i
4.4 Moment ratio based on the threshold stress criterion
4.4.1 Formulation
For a wide flange beam subjected to biaxial bending and warping, the normal stresses , , ,x y z
at a point with coordinates , ,x y of a section z is given by
71
, , ,yx
x y w
M zM z B zx y z y x
I I C (4.11)
The peak stresses max z take place at the corner points of the section where the point coordinates
have maximal values, i.e., max max max, , , , / 2, / 2, / 4x y x y b d bd . By defining the
section moduli max/x xS I y , max/y yS I x , and max/w wS C , one has
max
yx
x y w
M zM z B zz
S S S (4.12)
Noting that yM z EIu z and wB z EC , the magnitude of maximum stress in the
section is can be expressed as
max
y
x y w
EI u z EC zM z
zS S S
(4.13)
From Eqs. (4.3) and (4.4), by differentiating u z and z , and substituting into (4.13) one
obtains
2 2 2
max 1 max a
2
1
2
2
m 2xsin sin
sin2 4
y
cr cr cr
y
cr
x
x cr
EMz E x
S
M b
IM z M z
L M M L L M L M M L
EIM z
M M L M
bE
L
d
LS
(4.14)
The peak normal stress takes place at mid-span where 2z L and is given by
2
max m
2
2ax 122 4
y
cr crx
EIM
M
M b bdL E
S M L M L
(4.15)
From Eq. (4.15), by substituting into Eq. (4.5), one obtains
2
max2
/ 2cr ix
M Eb
ML
S
M
M L
(4.16)
72
The peak stress is set to a specified threshold fraction of the yield stress, i.e., yF .
Typically, design standards assume the residual stresses around 0.3 0.33y yF F . Thus, the
condition max 0.7 yF or max 0.67 yF must be satisfied for the material to remain in the elastic
range and the typical values for the threshold stress fraction are 0.67,0.7 . By equating
max / 2L as obtained from (4.16) to the threshold value yF , one obtains
2
2y
x cr i
M MF
S M LM
Eb
(4.17)
Rearranging, one has
22 0
2
xcr y x y x cr
i
SM M F M S
LS F M
Eb
(4.18)
Solving Eq. (4.18) for the moment M , one obtains
22 2
1 1
2 2 24
2
x xcr y x cr y x x y cr
i i
S SM M F S M F S S F M
Eb Eb
L L
(4.19)
Dividing both sides by crM one recovers the moment ratio , crM M attainable based on the
threshold stress yF
22 2
, 1 11 1 4
2 2 2 2
i Y Y Y Y Y
cr i y cr cr i y cr cr cr
M M M M M MEb Eb
M F L M M F L M M M
(4.20)
Equation 1.16 indicates that the moment ratio attainable depends on the four dimensionless
parameters i , , yEb F L and Y crM M where one recalls that Y x yM S F ,
2
cr y w yM L EI GJ E L C I and ratio Y crM M will be adopted in subsequent sections to
provide a dimensionless measure of the section slenderness.

73
4.4.2 Comparison and Verification
The comparison for the moment ratios ,i crM M as predicted by Eq. (4.20) and those based on
the present FEM (Table 4.3) are found to be nearly identical, with a maximum difference of 0.7%.
Equation (4.20) indicates that the moment ratio ,i crM M depends on seven parameters
, , , , , ,i Y crM M L d d b b t d w . In the following sections, the effects of each of the seven
parameters are assessed by varying each parameter at a time while keeping the other six constants.
An idealized (i.e., with no fillets) W200x36 with ( , ,d b b t d w =1.22, 16.18, 32.4) cross-section
with a stress fraction 0.70 and an out-of-straightness coefficient 1000i is used as a
reference case when assessing the geometric dimensionless parameters , ,d b b t d w .
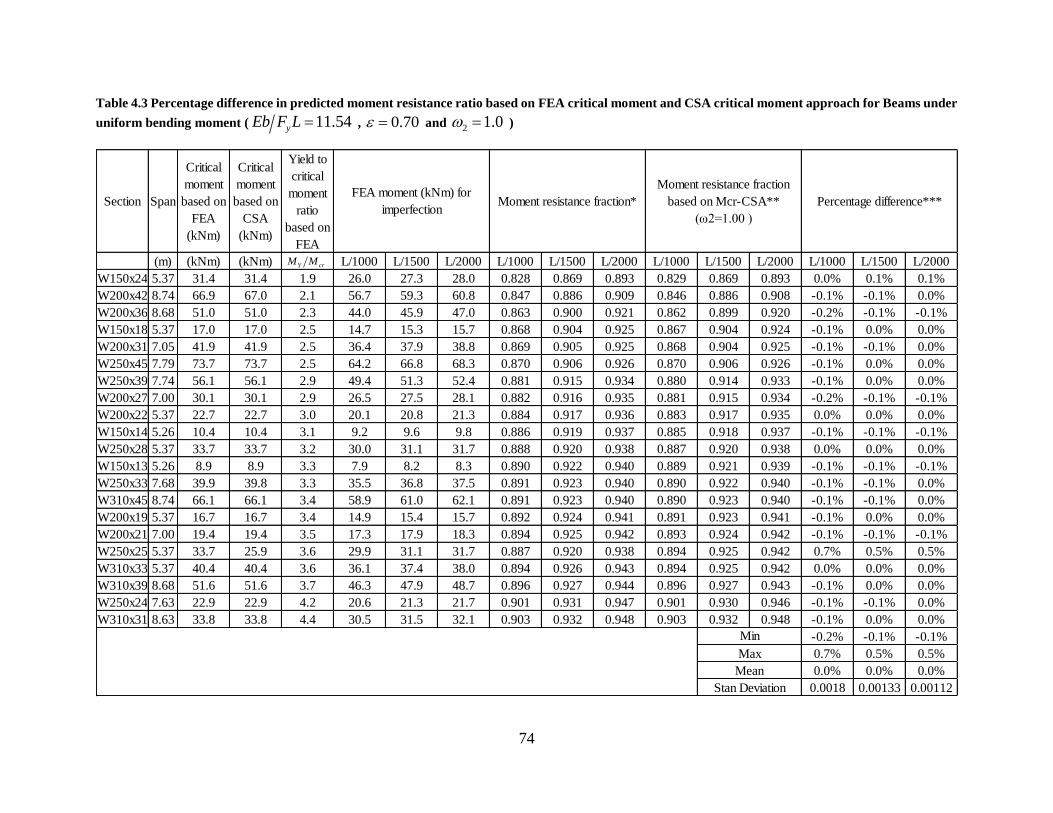
74
Table 4.3 Percentage difference in predicted moment resistance ratio based on FEA critical moment and CSA critical moment approach for Beams under
uniform bending moment ( 11.54yEb F L , 0.70 and 2 1.0 )
Section Span
Critical
moment
based on
FEA
(kNm)
Critical
moment
based on
CSA
(kNm)
Yield to
critical
moment
ratio
based on
FEA
(m) (kNm) (kNm) L/1000 L/1500 L/2000 L/1000 L/1500 L/2000 L/1000 L/1500 L/2000 L/1000 L/1500 L/2000
W150x24 5.37 31.4 31.4 1.9 26.0 27.3 28.0 0.828 0.869 0.893 0.829 0.869 0.893 0.0% 0.1% 0.1%
W200x42 8.74 66.9 67.0 2.1 56.7 59.3 60.8 0.847 0.886 0.909 0.846 0.886 0.908 -0.1% -0.1% 0.0%
W200x36 8.68 51.0 51.0 2.3 44.0 45.9 47.0 0.863 0.900 0.921 0.862 0.899 0.920 -0.2% -0.1% -0.1%
W150x18 5.37 17.0 17.0 2.5 14.7 15.3 15.7 0.868 0.904 0.925 0.867 0.904 0.924 -0.1% 0.0% 0.0%
W200x31 7.05 41.9 41.9 2.5 36.4 37.9 38.8 0.869 0.905 0.925 0.868 0.904 0.925 -0.1% -0.1% 0.0%
W250x45 7.79 73.7 73.7 2.5 64.2 66.8 68.3 0.870 0.906 0.926 0.870 0.906 0.926 -0.1% 0.0% 0.0%
W250x39 7.74 56.1 56.1 2.9 49.4 51.3 52.4 0.881 0.915 0.934 0.880 0.914 0.933 -0.1% 0.0% 0.0%
W200x27 7.00 30.1 30.1 2.9 26.5 27.5 28.1 0.882 0.916 0.935 0.881 0.915 0.934 -0.2% -0.1% -0.1%
W200x22 5.37 22.7 22.7 3.0 20.1 20.8 21.3 0.884 0.917 0.936 0.883 0.917 0.935 0.0% 0.0% 0.0%
W150x14 5.26 10.4 10.4 3.1 9.2 9.6 9.8 0.886 0.919 0.937 0.885 0.918 0.937 -0.1% -0.1% -0.1%
W250x28 5.37 33.7 33.7 3.2 30.0 31.1 31.7 0.888 0.920 0.938 0.887 0.920 0.938 0.0% 0.0% 0.0%
W150x13 5.26 8.9 8.9 3.3 7.9 8.2 8.3 0.890 0.922 0.940 0.889 0.921 0.939 -0.1% -0.1% -0.1%
W250x33 7.68 39.9 39.8 3.3 35.5 36.8 37.5 0.891 0.923 0.940 0.890 0.922 0.940 -0.1% -0.1% 0.0%
W310x45 8.74 66.1 66.1 3.4 58.9 61.0 62.1 0.891 0.923 0.940 0.890 0.923 0.940 -0.1% -0.1% 0.0%
W200x19 5.37 16.7 16.7 3.4 14.9 15.4 15.7 0.892 0.924 0.941 0.891 0.923 0.941 -0.1% 0.0% 0.0%
W200x21 7.00 19.4 19.4 3.5 17.3 17.9 18.3 0.894 0.925 0.942 0.893 0.924 0.942 -0.1% -0.1% -0.1%
W250x25 5.37 33.7 25.9 3.6 29.9 31.1 31.7 0.887 0.920 0.938 0.894 0.925 0.942 0.7% 0.5% 0.5%
W310x33 5.37 40.4 40.4 3.6 36.1 37.4 38.0 0.894 0.926 0.943 0.894 0.925 0.942 0.0% 0.0% 0.0%
W310x39 8.68 51.6 51.6 3.7 46.3 47.9 48.7 0.896 0.927 0.944 0.896 0.927 0.943 -0.1% 0.0% 0.0%
W250x24 7.63 22.9 22.9 4.2 20.6 21.3 21.7 0.901 0.931 0.947 0.901 0.930 0.946 -0.1% -0.1% 0.0%
W310x31 8.63 33.8 33.8 4.4 30.5 31.5 32.1 0.903 0.932 0.948 0.903 0.932 0.948 -0.1% 0.0% 0.0%
-0.2% -0.1% -0.1%
0.7% 0.5% 0.5%
0.0% 0.0% 0.0%
0.0018 0.00133 0.00112
Max
Mean
Stan Deviation
Min
Percentage difference***
Moment resistance fraction
based on Mcr-CSA**
(ω2=1.00 )
FEA moment (kNm) for
imperfectionMoment resistance fraction*
Y crM M
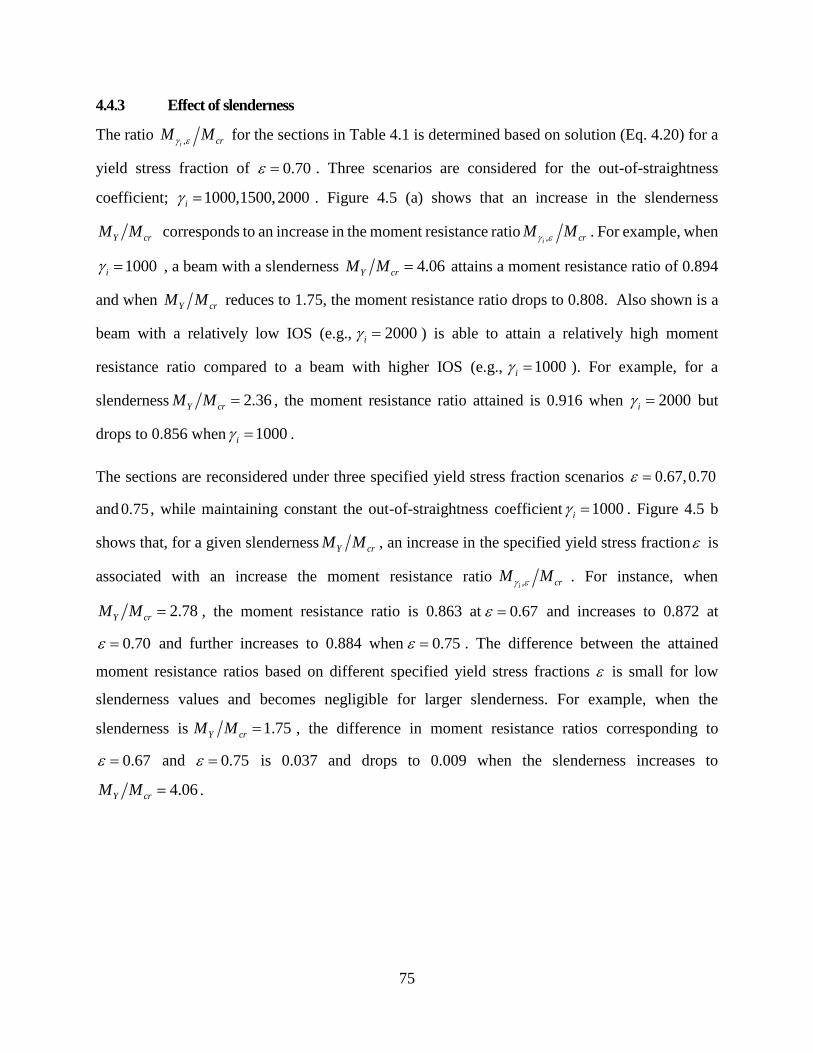
75
4.4.3 Effect of slenderness
The ratio ,i crM M for the sections in Table 4.1 is determined based on solution (Eq. 4.20) for a
yield stress fraction of 0.70 . Three scenarios are considered for the out-of-straightness
coefficient; 1000,1500,2000i . Figure 4.5 (a) shows that an increase in the slenderness
Y crM M corresponds to an increase in the moment resistance ratio ,i crM M . For example, when
1000i , a beam with a slenderness 4.06Y crM M attains a moment resistance ratio of 0.894
and when Y crM M reduces to 1.75, the moment resistance ratio drops to 0.808. Also shown is a
beam with a relatively low IOS (e.g., 2000i ) is able to attain a relatively high moment
resistance ratio compared to a beam with higher IOS (e.g., 1000i ). For example, for a
slenderness 2.36Y crM M , the moment resistance ratio attained is 0.916 when 2000i but
drops to 0.856 when 1000i .
The sections are reconsidered under three specified yield stress fraction scenarios 0.67,0.70
and 0.75 , while maintaining constant the out-of-straightness coefficient 1000i . Figure 4.5 b
shows that, for a given slenderness Y crM M , an increase in the specified yield stress fraction is
associated with an increase the moment resistance ratio ,i crM M . For instance, when
2.78Y crM M , the moment resistance ratio is 0.863 at 0.67 and increases to 0.872 at
0.70 and further increases to 0.884 when 0.75 . The difference between the attained
moment resistance ratios based on different specified yield stress fractions is small for low
slenderness values and becomes negligible for larger slenderness. For example, when the
slenderness is 1.75Y crM M , the difference in moment resistance ratios corresponding to
0.67 and 0.75 is 0.037 and drops to 0.009 when the slenderness increases to
4.06Y crM M .

76
(a)
(b)
Figure 4.5 Effect of yield to buckling moment ratio Y crM M on the moment resistance ratio for (a) various
out-of-straightness coefficient i and (b) various yield stress fractions
4.4.4 Effect of initial out-of-straightness and yield stress fraction
To assess the effect of out-of-straightness coefficient i and yield stress fraction on the moment
resistance ratio ,i crM M , two sets of analyses are conducted on a beam with W200X36 cross-

77
section. In the first series, the yield stress fraction is kept constant at 0.7 while the initial out-
of-straightness coefficient i is varied from 1000 to 2000 (Figure 4.6 a). In the second series, the
out-of-straightness coefficient is kept constant at 1000i while the yield stress fraction is
varied from 0.67 to 1.0 (Figure 4.6 b).
In both series, the beam slenderness L b is varied and the moment resistance ratio ,i crM M is
predicted in Eq. (4.20). Figure 4.6 a, b shows that the moment resistance ratio increases with
slenderness. For example, for the case 1000i , 0.70 , when 33.3L b the moment
resistance ratio attained is 0.691. When the slenderness increases to 66.7L b , the moment
resistance ratio ,i crM M is found to increase to 0.905. Figure 4.6 (a) shows that a large out-of-
straightness coefficient corresponds to a low IOS, which corresponds to a comparatively high
moment resistance ratio. For example, for a slenderness 45.5L b , the moment resistance ratio
attained is 0.890 when 2000i and drops to 0.821 when 1000i . As expected, in Figure 4.6(b),
where 1000i is kept constant, the moment resistance ratio attained is found to increase with
the yield stress fraction. For instance, when 51.52L b the moment resistance ratio is 0.846 at
0.67 , increases to 0.856 when, 0.70 and further increases to 0.916 when 1.00 .
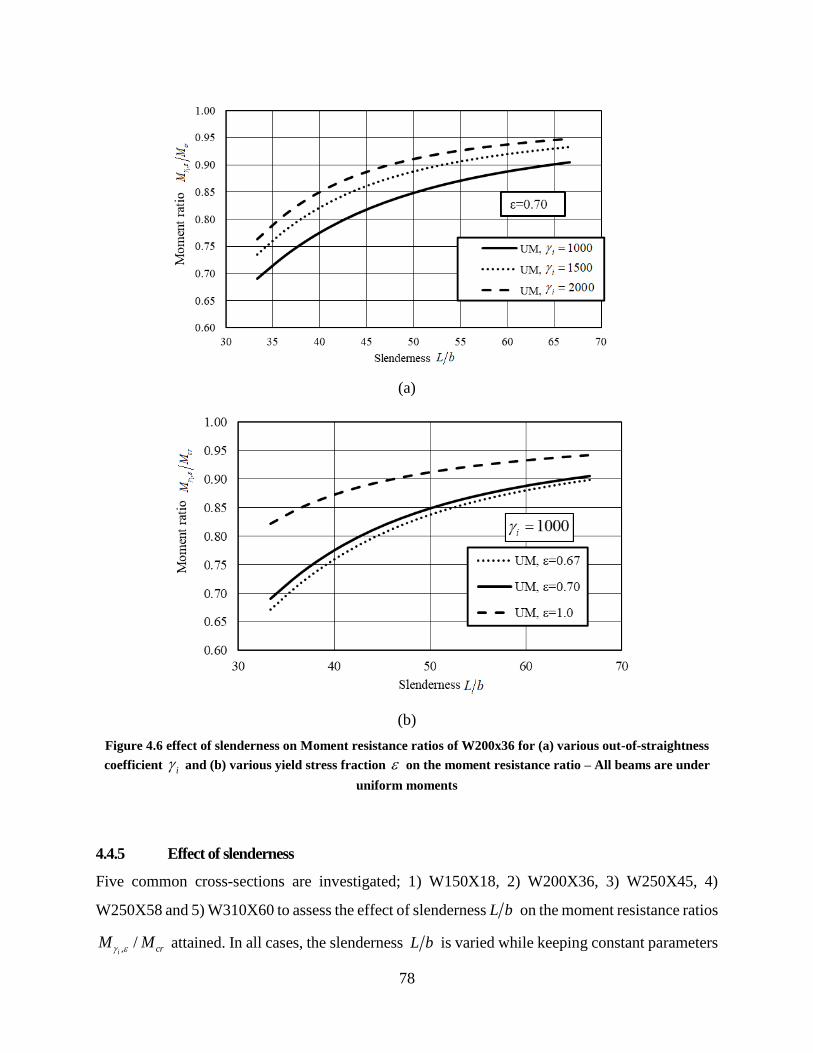
78
(a)
(b)
Figure 4.6 effect of slenderness on Moment resistance ratios of W200x36 for (a) various out-of-straightness
coefficient i and (b) various yield stress fraction on the moment resistance ratio – All beams are under
uniform moments
4.4.5 Effect of slenderness
Five common cross-sections are investigated; 1) W150X18, 2) W200X36, 3) W250X45, 4)
W250X58 and 5) W310X60 to assess the effect of slenderness L b on the moment resistance ratios
, /i crM M attained. In all cases, the slenderness L b is varied while keeping constant parameters
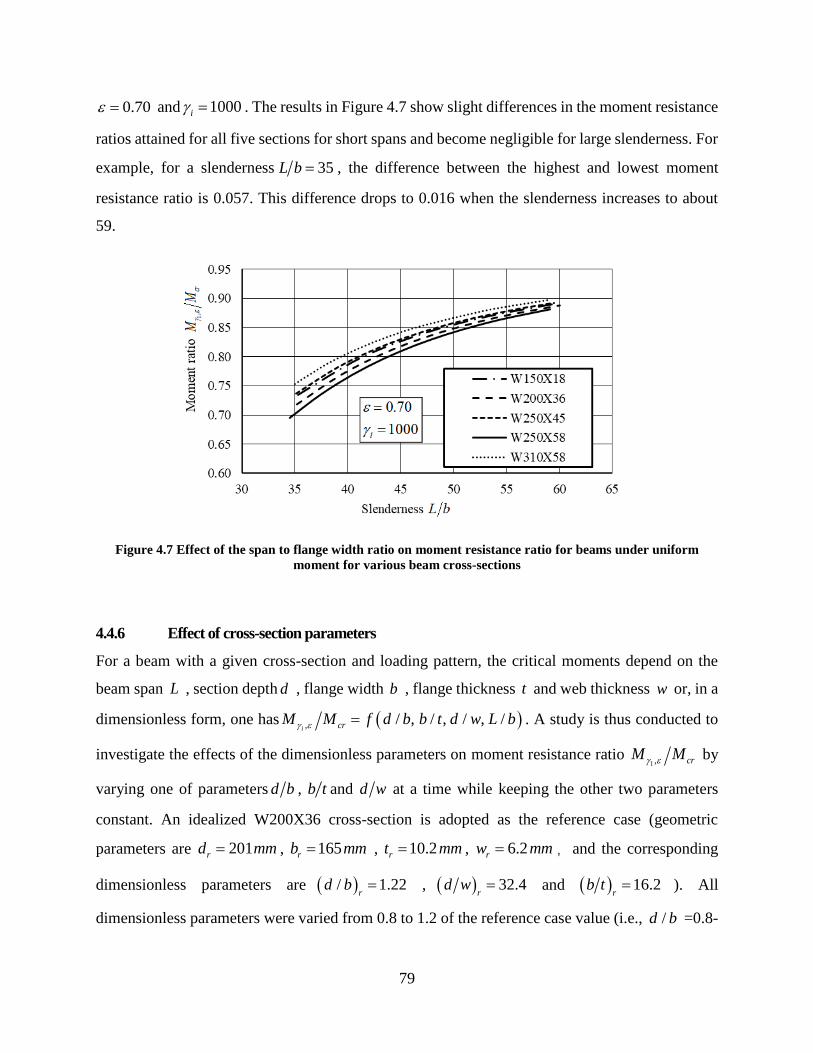
79
0.70 and 1000i . The results in Figure 4.7 show slight differences in the moment resistance
ratios attained for all five sections for short spans and become negligible for large slenderness. For
example, for a slenderness 35L b , the difference between the highest and lowest moment
resistance ratio is 0.057. This difference drops to 0.016 when the slenderness increases to about
59.
Figure 4.7 Effect of the span to flange width ratio on moment resistance ratio for beams under uniform
moment for various beam cross-sections
4.4.6 Effect of cross-section parameters
For a beam with a given cross-section and loading pattern, the critical moments depend on the
beam span L , section depth d , flange width b , flange thickness t and web thickness w or, in a
dimensionless form, one has , / , / , / , /i crM M f d b b t d w L b . A study is thus conducted to
investigate the effects of the dimensionless parameters on moment resistance ratio 1 , crM M by
varying one of parameters d b , b t and d w at a time while keeping the other two parameters
constant. An idealized W200X36 cross-section is adopted as the reference case (geometric
parameters are 201rd mm , 165rb mm , 10.2rt mm , 6.2rw mm ,and the corresponding
dimensionless parameters are / 1.22r
d b , 32.4r
d w and 16.2r
b t ). All
dimensionless parameters were varied from 0.8 to 1.2 of the reference case value (i.e., /d b =0.8-
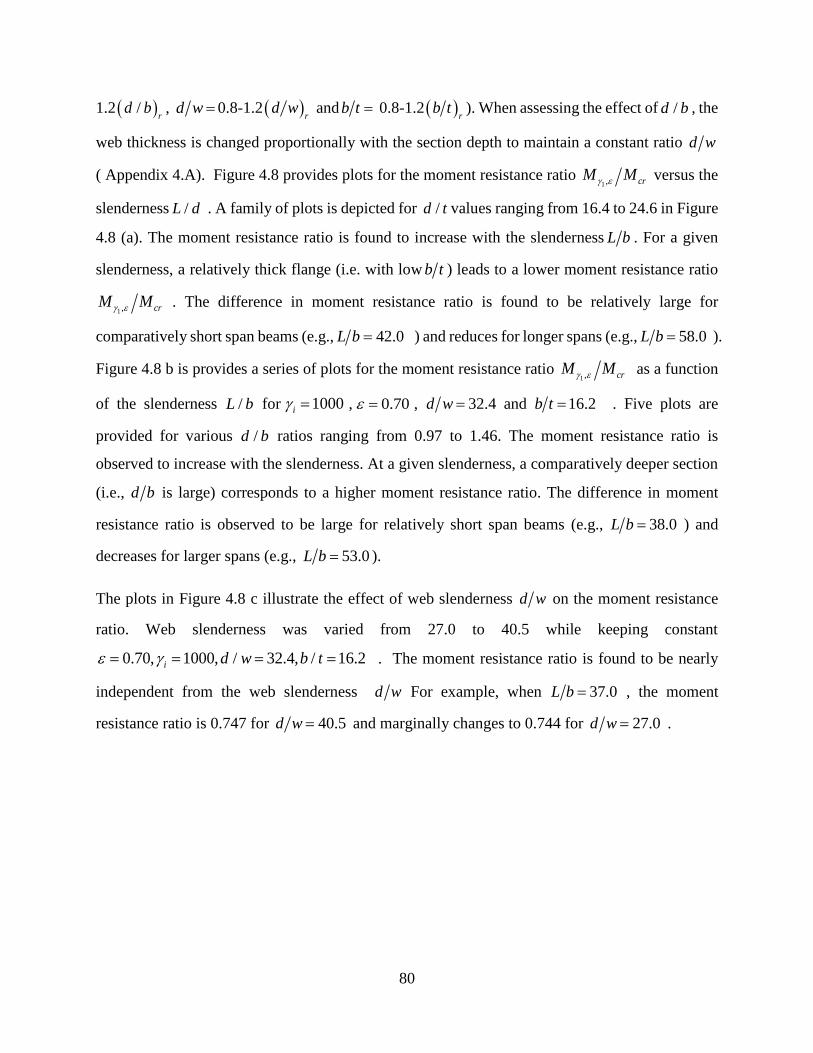
80
1.2 /r
d b , d w 0.8-1.2 r
d w and b t 0.8-1.2 r
b t ). When assessing the effect of /d b , the
web thickness is changed proportionally with the section depth to maintain a constant ratio d w
( Appendix 4.A). Figure 4.8 provides plots for the moment resistance ratio 1 , crM M versus the
slenderness /L d . A family of plots is depicted for /d t values ranging from 16.4 to 24.6 in Figure
4.8 (a). The moment resistance ratio is found to increase with the slenderness L b . For a given
slenderness, a relatively thick flange (i.e. with low b t ) leads to a lower moment resistance ratio
1 , crM M . The difference in moment resistance ratio is found to be relatively large for
comparatively short span beams (e.g., 42.0L b ) and reduces for longer spans (e.g., 58.0L b ).
Figure 4.8 b is provides a series of plots for the moment resistance ratio 1 , crM M as a function
of the slenderness /L b for 1000i , 0.70 , 32.4d w and 16.2b t . Five plots are
provided for various /d b ratios ranging from 0.97 to 1.46. The moment resistance ratio is
observed to increase with the slenderness. At a given slenderness, a comparatively deeper section
(i.e., d b is large) corresponds to a higher moment resistance ratio. The difference in moment
resistance ratio is observed to be large for relatively short span beams (e.g., 38.0L b ) and
decreases for larger spans (e.g., 53.0L b ).
The plots in Figure 4.8 c illustrate the effect of web slenderness d w on the moment resistance
ratio. Web slenderness was varied from 27.0 to 40.5 while keeping constant
0.70, 1000, / 32.4, / 16.2i d w b t . The moment resistance ratio is found to be nearly
independent from the web slenderness d w For example, when 37.0L b , the moment
resistance ratio is 0.747 for 40.5d w and marginally changes to 0.744 for 27.0d w .

81
(a)
(b)

82
(c)
Figure 4.8 . Effects of (a) flange thickness (b) section depth and (c) web thickness on moment resistance ratio
for W200x36 under uniform bending
4.4.7 Moment resistance ratios for other loading cases
Figure 4.9 a provides a comparison of the attained moment ratios ,i crM M for the beams
defined in Table 4.1 for three loading cases; 1) uniform bending moments (UM), 2) Mid-span point
load (PL) and 3) uniformly distributed load (UDL). The moment resistance ratios attained for the
uniform bending moment case are computed based on Eq.(4.20), while those for the cases of point
load (PL) and uniformly distributed loads (UDL) are determined from the present finite element
analysis.
A family of plots (Figure 4.9 a) is provided for the moment resistance ratio ,i crM M as a function
of the slenderness Y crM M for a yield stress fraction 0.70 and IOS coefficients
1000,1500,2000i . The moment resistance ratio ,i crM M is found to increase with the
slenderness Y crM M and with the out-of-straightness coefficient i (i.e., decreases with the
degree of out-of-straightness of the beam). For a given beam and an out-of-straightness coefficient,
the moment resistance ratio attained is lowest for the point load (PL) case, followed by the
uniformly loaded case (UDL) and is largest the case of uniform moment (UM). As a general
observation, the predicted moment resistance ratios for the three loading cases considered are
observed to differ largely for relatively low slenderness Y crM M but the difference decreases as

83
slenderness increases. For example, when the initial out of straightness coefficient is 1000i ,
the difference between the point load case (PL) and the uniformly distributed case (UDL) is 7.4%
when the slenderness is 1.38Y crM M and difference decreases to 26% when the slenderness
increases to 3.26Y crM M .
In Figure 4.9b, where 1000i is kept constant and yield stress fractions were varied, i.e.,
0.67,0.70,0.75 , it is found that an increase in the specified yield stress fraction corresponds to
a higher moment resistance ratio at a given slenderness Y crM M .
Figure 4.9 c depicts for the moment resistance ratio attained ,i crM M as a function of the
slenderness L b for a specified yield fraction 0.70 and out-of-straightness coefficients
1000,1500,2000i for a beam with a W200X36 cross-section with varying spans for the loading
cases UM, UDL, and PL. The moment resistance ratio ,i crM M is found to increase with the
slenderness L b . Increasing the out-of-straightness coefficient attains a high moment resistance
ratio ,i crM M . The difference in the attained moment resistance ratios ,i crM M between the
different loading cases is observed to slightly decrease with the slenderness L b . For example,
when the initial out of straightens coefficient is 1000i and the slenderness is 43.0L b , the
difference in moment resistance ratio between the PL and UDL cases is 7.1%. The difference
decreases to 5.7% when slenderness increases to 55.2.
A family of plots (Figure 4.9 d) is provided for the moment resistance ratio with the slenderness
for an initial-out of straightens coefficient 1000i or specified yield stress fractions of
0.67,0.70,0.75 . Again, it is found that moment resistance ratio increases with the slenderness.
Also, a higher specified yield stress fraction corresponds to a higher moment resistance ratio at a
given slenderness.

84
(a)
(b)

85
(c)
(d)
Figure 4.9 Moment resistance ratio for considered sections under uniform moment, point load at mid-span
and UDL for (a) out-of-straightness i 1000, 1500 and 2000, (b) yield stress fraction 0.67, 0.70 and
0.75. Moment resistance ratio for W200X36 for (c) out-of-straightness coefficients i 1000, 1500 and 2000,
(d) yield stress fractions 0.67, 0.70 and 0.75

86
4.4.8 Extension of the analytical solution to other loading cases
The trends of the three loading cases considered observed in Figure 4.9 but are offset given that
the critical moments differ due to the moment gradient effect. This observation suggests a possible
modification of Eq. (4.20) by replacing the uniform critical moment crmM by 2 crmM , in which 2
is a moment gradient factor. Thus, a modified form of Eq. (4.20) is proposed in the following
22 2
,
2 2 2 2 2 2
1 11 1 4
2 2 2 2
i Y Y Y Y Y
crm i y crm crm i y crm crm crm
M M M M M MEb Eb
M F L M M F L M M M
(4.21)
For the point load case (PL), the moment gradient factor based on FEA can be computed by
dividing the critical moment for a perfectly straight beam as predicted by the present eigenvalue
model, by that for the case of uniform moment, leading to 2 FEM 1.36. This value is close
to that provided by American Standards (ANSI/AISN 360-10), Australian Standards (AS 4100-
1998) and Eurocode Guide (EN 1993-1-1:2005) as discussed in (Hassan and Mohareb 2015), but
slightly higher than that based the Canadian standards (CAN/CSA S16-14) is 2 CSA 1.265.
Thus, the predictions of Eq. (4.21), based on moment gradients 2 2 1.265CSA and
2 1.360FEA will be compared to FEM results will be investigated.
For the uniform distributed load case (UDL), the moment gradient factor computed by the present
FEM is 2 1.13FEM , which is identical to that provided in Canadian standards (CAN/CSA
S16-14) and Eurocode Guide (EN 1993-1-1:2005) and closed to 2 1.17AS in the Australian
Standards (AS 4100-1998) and 2 1.14AISC in American Standards (ANSI/AISN 360-10).
Thus, the moment gradient 2 2 1.13CSA is adopted in Eq. (4.21) when predicting the
moment ratio ,i crM M for the UDL case.
The beams described in Table 4.1 are re-examined the cased of point load at mid-span (PL) and
uniform distributed load (UDL). The specified yield stress fraction 0.70 is kept constant in all
runs while the out-of-straightness coefficient i is taken as 1000, 1500, and 2000. The moment
resistance ratios ,i crM M as predicted the present finite element solution and those predicted

87
by Eq. (4.21) under the two loading cases are summarized in Table 4.4 to Table 4.6 for PL with
2 1.265 , PL with 2 1.36 , and UDL with 2 1.13 , respectively. Also provided is the
percentage difference in moment resistance ratios as predicted on the present finite element
solution and those based on Eq. (4.21) is calculated to evaluate the accuracy of the predictions of
Eq. (4.21).
For the point load (PL) case, Table 4.4 indicates that proposed Eq. (4.21) with
2 2 1.265CSA yield moment ratio predictions ,i crM M deviate from FEM predictions
with percentage differences ranging from 1.9% to 8.4% with an mean difference of 4.1%.
Improved moment ratio predictions are attained by adopting the more accurate moment gradient
2 2 1.36FEM in conjunction with Eq. (4.21) where the percentage difference between
both solutions range from 0.5% to 2.7% with a mean difference of 1.8%.
For the UDL case, Table 4.6 presents the prediction by Eq. (4.21) with 2 2 1.13CSA and
by the present FEM. The percentage difference is found to range from 0.5% to 2.1% with an
average of 1.0%.
Also, it is found that the percentage difference decreases with the increase of the initial out-of-
straightness i . For example, the maximum percentage difference for 1000i is found as 2.1%.
The corresponding value is 1.5% for the case with 2000i . Beams with comparatively larger
Y crM M attain a lower percentage difference. For instance, for W150X24 of which the
slenderness is 1.7Y crM M , the percentage difference is 2.1% for 1000i . On the contrary, for
W310X31 with 3.9Y crM M , the percentage difference is 0.8%.

88
Table 4.4 Percentage difference in predicted moment resistance ratio based on FEA critical moment and CSA critical moment approach f or Beams under
point load at mid-span ( 11.54yEb F L , 0.70 and 2 1.265 )
Section Span
Critical
moment
based on
FEA
Critical
moment
based on
CSA
Yield to
critical
moment
ratio
based on
FEA
(m) (kNm) (kNm) L/1000 L/1500 L/2000 L/1000 L/1500 L/2000 L/1000 L/1500 L/2000 L/1000 L/1500 L/2000
W150x24 5.37 42.5 39.7 1.4 30.3 32.1 33.3 0.712 0.755 0.782 0.771 0.812 0.837 8.4% 7.5% 7.0%
W200x42 8.74 90.8 84.7 1.5 67.7 71.9 74.4 0.746 0.792 0.820 0.801 0.842 0.868 7.4% 6.3% 5.8%
W200x36 8.68 69.3 64.5 1.7 53.8 57.0 59.0 0.777 0.823 0.852 0.827 0.867 0.892 6.4% 5.4% 4.6%
W150x18 5.37 23.0 21.5 1.8 18.1 19.2 19.9 0.787 0.834 0.862 0.836 0.876 0.900 6.2% 5.1% 4.4%
W200x31 7.05 56.9 53.0 1.8 45.0 47.6 49.2 0.790 0.836 0.865 0.838 0.878 0.901 6.0% 5.0% 4.2%
W250x45 7.79 100.1 93.3 1.9 79.4 84.0 86.8 0.793 0.839 0.867 0.840 0.880 0.903 5.9% 4.9% 4.2%
W250x39 7.74 76.2 71.0 2.1 62.1 65.6 67.5 0.815 0.860 0.886 0.857 0.895 0.917 5.2% 4.1% 3.5%
W200x27 7.00 40.9 38.0 2.1 33.4 35.2 36.3 0.817 0.862 0.889 0.859 0.896 0.918 5.1% 4.0% 3.3%
W200x22 5.37 30.9 28.7 2.2 25.3 26.7 27.5 0.820 0.865 0.892 0.862 0.900 0.921 5.2% 4.0% 3.2%
W150x14 5.26 14.2 13.2 2.3 11.7 12.3 12.7 0.826 0.870 0.896 0.865 0.902 0.923 4.8% 3.7% 3.0%
W250x28 5.37 45.8 42.7 2.3 38.1 40.1 41.2 0.830 0.874 0.899 0.869 0.905 0.925 4.7% 3.6% 2.9%
W150x13 5.26 12.1 11.2 2.4 10.1 10.6 10.9 0.835 0.877 0.902 0.871 0.907 0.927 4.4% 3.4% 2.8%
W250x33 7.68 54.2 50.4 2.4 45.3 47.7 49.0 0.836 0.879 0.904 0.873 0.908 0.928 4.4% 3.4% 2.7%
W310x45 8.74 89.8 83.6 2.5 75.3 79.0 81.3 0.838 0.880 0.905 0.874 0.909 0.929 4.3% 3.3% 2.6%
W200x19 5.37 22.7 21.1 2.5 19.1 20.0 20.6 0.839 0.881 0.906 0.875 0.910 0.930 4.3% 3.3% 2.6%
W200x21 7.00 26.4 24.5 2.6 22.2 23.4 24.0 0.843 0.885 0.909 0.878 0.912 0.932 4.1% 3.1% 2.5%
W250x25 5.37 35.3 32.8 2.6 29.7 31.2 32.1 0.843 0.886 0.910 0.879 0.914 0.933 4.3% 3.1% 2.5%
W310x33 5.37 54.9 51.1 2.6 46.3 48.6 49.9 0.844 0.886 0.910 0.879 0.914 0.933 4.2% 3.1% 2.5%
W310x39 8.68 70.3 65.3 2.7 59.7 62.6 64.2 0.849 0.890 0.913 0.882 0.916 0.934 3.9% 2.9% 2.4%
W250x24 7.63 31.2 28.9 3.1 26.8 28.0 28.7 0.860 0.899 0.921 0.889 0.922 0.940 3.4% 2.5% 2.0%
W310x31 8.63 46.0 42.8 3.3 39.8 41.6 42.5 0.865 0.903 0.924 0.893 0.924 0.941 3.2% 2.4% 1.9%
3.2% 2.4% 1.9%
8.4% 7.5% 7.0%
5.0% 4.0% 3.4%
0.01256 0.01249 0.01242
Min
Max
Mean
Stan Deviation
FEA moment (kNm) for
imperfectionMoment resistance fraction*
Moment resistance fraction
based on Mcr-CSA**
(ω2=1.265 )
Percentage difference***
Y crM M
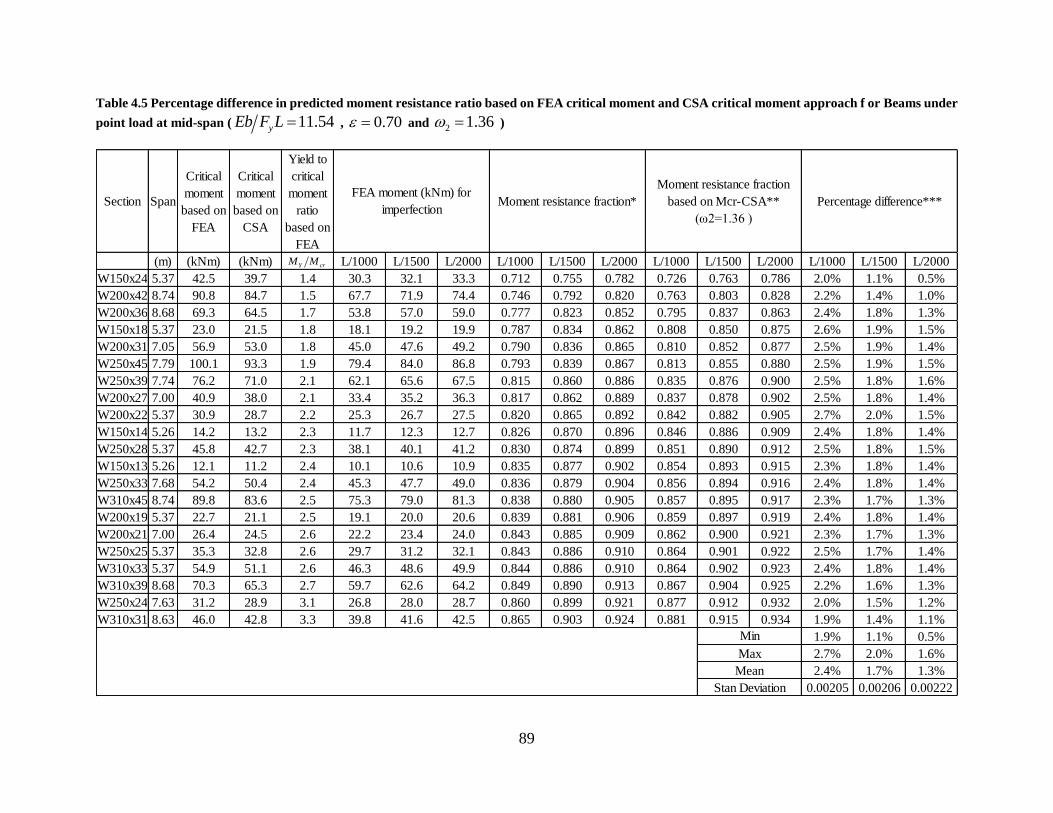
89
Table 4.5 Percentage difference in predicted moment resistance ratio based on FEA critical moment and CSA critical moment approach f or Beams under
point load at mid-span ( 11.54yEb F L , 0.70 and 2 1.36 )
Section Span
Critical
moment
based on
FEA
Critical
moment
based on
CSA
Yield to
critical
moment
ratio
based on
FEA
(m) (kNm) (kNm) L/1000 L/1500 L/2000 L/1000 L/1500 L/2000 L/1000 L/1500 L/2000 L/1000 L/1500 L/2000
W150x24 5.37 42.5 39.7 1.4 30.3 32.1 33.3 0.712 0.755 0.782 0.726 0.763 0.786 2.0% 1.1% 0.5%
W200x42 8.74 90.8 84.7 1.5 67.7 71.9 74.4 0.746 0.792 0.820 0.763 0.803 0.828 2.2% 1.4% 1.0%
W200x36 8.68 69.3 64.5 1.7 53.8 57.0 59.0 0.777 0.823 0.852 0.795 0.837 0.863 2.4% 1.8% 1.3%
W150x18 5.37 23.0 21.5 1.8 18.1 19.2 19.9 0.787 0.834 0.862 0.808 0.850 0.875 2.6% 1.9% 1.5%
W200x31 7.05 56.9 53.0 1.8 45.0 47.6 49.2 0.790 0.836 0.865 0.810 0.852 0.877 2.5% 1.9% 1.4%
W250x45 7.79 100.1 93.3 1.9 79.4 84.0 86.8 0.793 0.839 0.867 0.813 0.855 0.880 2.5% 1.9% 1.5%
W250x39 7.74 76.2 71.0 2.1 62.1 65.6 67.5 0.815 0.860 0.886 0.835 0.876 0.900 2.5% 1.8% 1.6%
W200x27 7.00 40.9 38.0 2.1 33.4 35.2 36.3 0.817 0.862 0.889 0.837 0.878 0.902 2.5% 1.8% 1.4%
W200x22 5.37 30.9 28.7 2.2 25.3 26.7 27.5 0.820 0.865 0.892 0.842 0.882 0.905 2.7% 2.0% 1.5%
W150x14 5.26 14.2 13.2 2.3 11.7 12.3 12.7 0.826 0.870 0.896 0.846 0.886 0.909 2.4% 1.8% 1.4%
W250x28 5.37 45.8 42.7 2.3 38.1 40.1 41.2 0.830 0.874 0.899 0.851 0.890 0.912 2.5% 1.8% 1.5%
W150x13 5.26 12.1 11.2 2.4 10.1 10.6 10.9 0.835 0.877 0.902 0.854 0.893 0.915 2.3% 1.8% 1.4%
W250x33 7.68 54.2 50.4 2.4 45.3 47.7 49.0 0.836 0.879 0.904 0.856 0.894 0.916 2.4% 1.8% 1.4%
W310x45 8.74 89.8 83.6 2.5 75.3 79.0 81.3 0.838 0.880 0.905 0.857 0.895 0.917 2.3% 1.7% 1.3%
W200x19 5.37 22.7 21.1 2.5 19.1 20.0 20.6 0.839 0.881 0.906 0.859 0.897 0.919 2.4% 1.8% 1.4%
W200x21 7.00 26.4 24.5 2.6 22.2 23.4 24.0 0.843 0.885 0.909 0.862 0.900 0.921 2.3% 1.7% 1.3%
W250x25 5.37 35.3 32.8 2.6 29.7 31.2 32.1 0.843 0.886 0.910 0.864 0.901 0.922 2.5% 1.7% 1.4%
W310x33 5.37 54.9 51.1 2.6 46.3 48.6 49.9 0.844 0.886 0.910 0.864 0.902 0.923 2.4% 1.8% 1.4%
W310x39 8.68 70.3 65.3 2.7 59.7 62.6 64.2 0.849 0.890 0.913 0.867 0.904 0.925 2.2% 1.6% 1.3%
W250x24 7.63 31.2 28.9 3.1 26.8 28.0 28.7 0.860 0.899 0.921 0.877 0.912 0.932 2.0% 1.5% 1.2%
W310x31 8.63 46.0 42.8 3.3 39.8 41.6 42.5 0.865 0.903 0.924 0.881 0.915 0.934 1.9% 1.4% 1.1%
1.9% 1.1% 0.5%
2.7% 2.0% 1.6%
2.4% 1.7% 1.3%
0.00205 0.00206 0.00222
FEA moment (kNm) for
imperfectionMoment resistance fraction*
Moment resistance fraction
based on Mcr-CSA**
(ω2=1.36 )
Percentage difference***
Min
Max
Mean
Stan Deviation
Y crM M
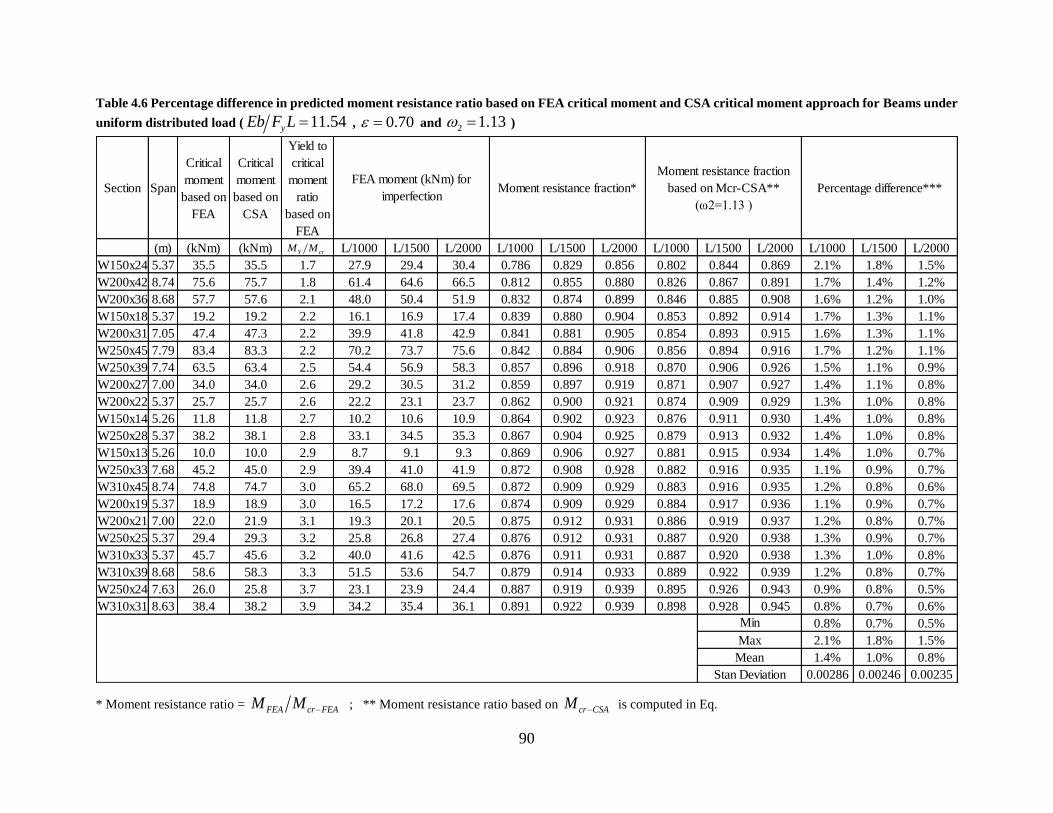
90
Table 4.6 Percentage difference in predicted moment resistance ratio based on FEA critical moment and CSA critical moment approach for Beams under
uniform distributed load ( 11.54yEb F L , 0.70 and 2 1.13 )
* Moment resistance ratio = FEA cr FEAM M ; ** Moment resistance ratio based on cr CSAM is computed in Eq.
Section Span
Critical
moment
based on
FEA
Critical
moment
based on
CSA
Yield to
critical
moment
ratio
based on
FEA
(m) (kNm) (kNm) L/1000 L/1500 L/2000 L/1000 L/1500 L/2000 L/1000 L/1500 L/2000 L/1000 L/1500 L/2000
W150x24 5.37 35.5 35.5 1.7 27.9 29.4 30.4 0.786 0.829 0.856 0.802 0.844 0.869 2.1% 1.8% 1.5%
W200x42 8.74 75.6 75.7 1.8 61.4 64.6 66.5 0.812 0.855 0.880 0.826 0.867 0.891 1.7% 1.4% 1.2%
W200x36 8.68 57.7 57.6 2.1 48.0 50.4 51.9 0.832 0.874 0.899 0.846 0.885 0.908 1.6% 1.2% 1.0%
W150x18 5.37 19.2 19.2 2.2 16.1 16.9 17.4 0.839 0.880 0.904 0.853 0.892 0.914 1.7% 1.3% 1.1%
W200x31 7.05 47.4 47.3 2.2 39.9 41.8 42.9 0.841 0.881 0.905 0.854 0.893 0.915 1.6% 1.3% 1.1%
W250x45 7.79 83.4 83.3 2.2 70.2 73.7 75.6 0.842 0.884 0.906 0.856 0.894 0.916 1.7% 1.2% 1.1%
W250x39 7.74 63.5 63.4 2.5 54.4 56.9 58.3 0.857 0.896 0.918 0.870 0.906 0.926 1.5% 1.1% 0.9%
W200x27 7.00 34.0 34.0 2.6 29.2 30.5 31.2 0.859 0.897 0.919 0.871 0.907 0.927 1.4% 1.1% 0.8%
W200x22 5.37 25.7 25.7 2.6 22.2 23.1 23.7 0.862 0.900 0.921 0.874 0.909 0.929 1.3% 1.0% 0.8%
W150x14 5.26 11.8 11.8 2.7 10.2 10.6 10.9 0.864 0.902 0.923 0.876 0.911 0.930 1.4% 1.0% 0.8%
W250x28 5.37 38.2 38.1 2.8 33.1 34.5 35.3 0.867 0.904 0.925 0.879 0.913 0.932 1.4% 1.0% 0.8%
W150x13 5.26 10.0 10.0 2.9 8.7 9.1 9.3 0.869 0.906 0.927 0.881 0.915 0.934 1.4% 1.0% 0.7%
W250x33 7.68 45.2 45.0 2.9 39.4 41.0 41.9 0.872 0.908 0.928 0.882 0.916 0.935 1.1% 0.9% 0.7%
W310x45 8.74 74.8 74.7 3.0 65.2 68.0 69.5 0.872 0.909 0.929 0.883 0.916 0.935 1.2% 0.8% 0.6%
W200x19 5.37 18.9 18.9 3.0 16.5 17.2 17.6 0.874 0.909 0.929 0.884 0.917 0.936 1.1% 0.9% 0.7%
W200x21 7.00 22.0 21.9 3.1 19.3 20.1 20.5 0.875 0.912 0.931 0.886 0.919 0.937 1.2% 0.8% 0.7%
W250x25 5.37 29.4 29.3 3.2 25.8 26.8 27.4 0.876 0.912 0.931 0.887 0.920 0.938 1.3% 0.9% 0.7%
W310x33 5.37 45.7 45.6 3.2 40.0 41.6 42.5 0.876 0.911 0.931 0.887 0.920 0.938 1.3% 1.0% 0.8%
W310x39 8.68 58.6 58.3 3.3 51.5 53.6 54.7 0.879 0.914 0.933 0.889 0.922 0.939 1.2% 0.8% 0.7%
W250x24 7.63 26.0 25.8 3.7 23.1 23.9 24.4 0.887 0.919 0.939 0.895 0.926 0.943 0.9% 0.8% 0.5%
W310x31 8.63 38.4 38.2 3.9 34.2 35.4 36.1 0.891 0.922 0.939 0.898 0.928 0.945 0.8% 0.7% 0.6%
0.8% 0.7% 0.5%
2.1% 1.8% 1.5%
1.4% 1.0% 0.8%
0.00286 0.00246 0.00235
Min
Max
Mean
Stan Deviation
FEA moment (kNm) for
imperfectionMoment resistance fraction*
Moment resistance fraction
based on Mcr-CSA**
(ω2=1.13 )
Percentage difference***
Y crM M

91
*** Percentage difference = cr CSA FEA cr FEA FEA cr FEAappxM M M M M M
92
4.4.9 Nominal moment resistance based on stress criterion
The solution provided by Eq. (4.21) accounts for the initial-out-of-straightness effect and should
replace the eigenvalue solution in the elastic buckling range. For medium span beams, inelastic
lateral torsional buckling will likely take place. For instance when, for a perfectly straight beam
with a class 3 cross-section with 0.67cr pM M , the Canadian standards assume that inelastic
lateral torsional buckling takes place and one needs to account for the effects of plasticity and
residual stresses, using the equation 1.15 1 0.28 /n Y Y crM M M M with a ceiling value of
n YM M which corresponds to pure yielding. An extension of the concept was proposed for the
displacement criterion under section 4.3.4.
In the present section, we adopt an alternative approach to account for plasticity and residual
stresses in the inelastic lateral torsional buckling range in a manner consistent with the column
resistance equations in CAN-CSA-S16 (2014), where the nominal resistance of a column nC takes
the form 1
21n yC AF
, yAF being the yield strength of the column, being the column
slenderness, and 1.34n is a constant that it intended to match the outcome of the inelastic
analysis and/or tests. An analogous equation is postulated here whereby the inelastic moment is
assumed to be obtained by 1
1n x yM S F
where Y x yM S F is the yield moment,
Y crM M is the slenderness ratio, and constant is to be obtained by matching the predictions
of the present FEA analysis. In a manner similar to the column equation, the proposed equation
approaches the yield moment Y x yM S F as the slenderness approaches zero ( 0 ). Constant
can be obtained by matching the attained moment ratios n YM M based on the FEM predictions
within the elastic range. However, it is cautioned that the extrapolation of the curve predictions
beyond the elastic domain is not recommended without conducting verifying the predictions of the
equation against inelastic analysis results that accounts for the effects of plasticity and residual
stresses, in addition to initial-of-straightness. As an illustration, a simply supported beam with a
W150x14 cross-section is considered with variable spans (Section class is 3 based on yield strength
of 350F MPa ). The moment ratio n YM M as predicted by the FEM is provided for a yield
stress fraction 0.7 and initial out-of-straightness coefficients of 1000,1500,2000i .
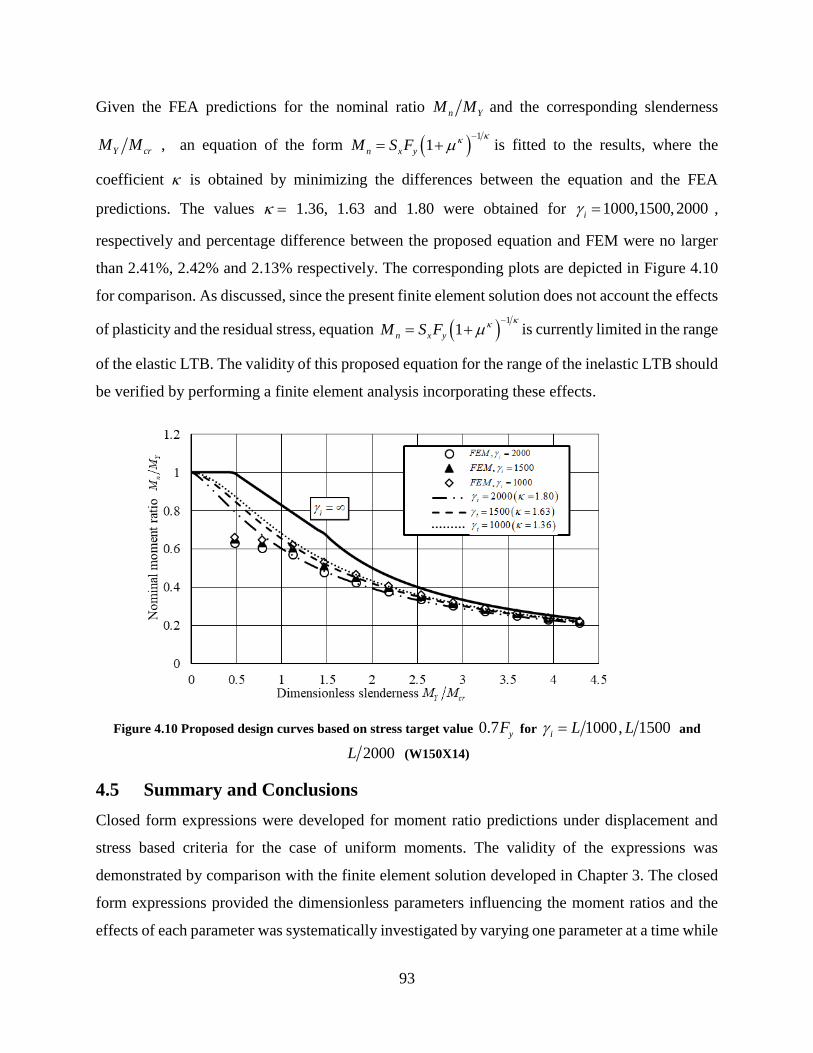
93
Given the FEA predictions for the nominal ratio n YM M and the corresponding slenderness
Y crM M , an equation of the form 1
1n x yM S F
is fitted to the results, where the
coefficient is obtained by minimizing the differences between the equation and the FEA
predictions. The values 1.36, 1.63 and 1.80 were obtained for 1000,1500,2000i ,
respectively and percentage difference between the proposed equation and FEM were no larger
than 2.41%, 2.42% and 2.13% respectively. The corresponding plots are depicted in Figure 4.10
for comparison. As discussed, since the present finite element solution does not account the effects
of plasticity and the residual stress, equation 1
1n x yM S F
is currently limited in the range
of the elastic LTB. The validity of this proposed equation for the range of the inelastic LTB should
be verified by performing a finite element analysis incorporating these effects.
Figure 4.10 Proposed design curves based on stress target value 0.7 yF for 1000, 1500i L L and
2000L (W150X14)
4.5 Summary and Conclusions
Closed form expressions were developed for moment ratio predictions under displacement and
stress based criteria for the case of uniform moments. The validity of the expressions was
demonstrated by comparison with the finite element solution developed in Chapter 3. The closed
form expressions provided the dimensionless parameters influencing the moment ratios and the
effects of each parameter was systematically investigated by varying one parameter at a time while
94
maintaining constant all other parameters. The closed form solutions for the moment ratio were
modified to extend their use to other loadings cases involving mid-span point loading uniformly
distributed loading. The accuracy of the modified equations was demonstrated by comparison
against numerical results based on the FEM solution developed in Chapter 3. Design curves
incorporating the effect of IOS in the elastic range were proposed by modifying the current design
equations in CAN/CSA S16-14 based on the parametric study results. The main findings of the
study are summarized as follows:
1. The predicted moment ratio based on the yield criterion solely depends on the ratio between the
IOS coefficient and the displacement threshold value. Thus, it is independent of the slenderness,
cross-section dimensions, and the loading conditions considered.
2. The closed form solution for the moment ratio predicted by the stress based criterion for beams
under uniform moments were found to be extendable to other loading cases considered (UDL and
PL) by adopting appropriate moment gradient factors.
3. Based on the stress criterion, the predicted moment ratio , /i crM M was shown to increase with
the IOS coefficient, yield stress fraction, yield-to-critical moment ratio, span-to-section-depth ratio,
flange-width-to-depth ratio and depth-to-flange-thickness ratio.

95
Appendix 4.A
Table 4.A.1 Cross-section geometry and properties for the parametric study on d b
d b t w Ix Sx Zx Iy Sy J Cw
0.97 160.8 165 10.2 4.96 2.03 2.52 2.78 7.64 9.26 1.18 4.94
1.1 180.9 165 10.2 5.58 2.65 2.93 3.25 7.64 9.26 1.22 6.36
1.22 201.0 165 10.2 6.2 3.37 3.35 3.72 7.64 9.26 1.26 7.71
1.34 221.1 165 10.2 6.82 4.21 3.8 4.24 7.64 9.26 1.33 9.33
1.46 241.2 165 10.2 7.44 5.16 4.28 4.76 7.64 9.26 1.42 11.1
(mm)
4
710
mm
3
510
mm
3
510
mm
4
610
mm
3
410
mm
4
510
mm
6
1010
mm
d b

96
5. Estimating critical moments for perfectly straight beams from the
lateral torsional response of initially crooked beams
5.1 Introduction
Chapters 3 developed an FEM solution that characterizes the nonlinear moment-lateral
displacement relationship for a beam with a given IOS and IAT pattern subjected to transverse
loads. The obtained relationships did not exhibit a distinct plateau corresponding to the critical
moment of a perfectly straight beam but approached the critical moment asymptotically from
below. When conducting experimental results beams with IOS and IAT, two questions arise: (a)
Can the nonlinear moment-lateral displacement obtained be used to predict the critical moment for
a perfectly straight beam? and (b) Can the nonlinear moment-lateral displacement be used to
characterize the magnitude of initial imperfections of the beam. The original work of Southwell
(1931) provided a basis to answer similar questions for simply supported columns with initial
crookedness. The present chapter aims to extend the findings of Southwell for beams with IOS
and IAT by developing a closed form solution for the nonlinear response of beams with IOS and
IAT under uniform moments and developing Southwell-like solutions. Since closed form solutions
cannot be developed for the cases involving variable moments, the FEM solution developed in
chapter 3 used then to produce nonlinear moment-lateral displacement relations for various IOS-
IAT scenarios, and the applicability of the Southwell-like solution is used to estimate the critical
moments. Comparisons are then performed with the critical moments obtained from the eigen-
value solutions. The numeric results suggest that the extended Southwell technique remains valid
for case of non-uniform moments.
5.2 Theoretical Background
5.2.1 Overview of the Southwell plot technique for column buckling
Consider a simply supported column with an initial out-of- straightness 0y z an elastic flexural
stiffness EI subjected to an axial load P . The equilibrium condition can be shown (e.g., Southwell
1931), to take the form
0 0EI y y Py (5.1)
97
in which, y z is the transverse deflection. By expressing the transverse deflection y z and
initial out-of-straightness 0y z as Fourier series, one obtains
1
0
1
sin
sin
m
m
m
m
m zy z w
L
m zy z w
L
(5.2)a,b
in which, mw and mw are the magnitudes of the transverse deflection and initial transverse out-of-
straightness corresponding to mode m . From Eqs. (5.2) by substituting into Eq. (5.1), one obtains
1, 1,2...
1
m
m m
wm
w P P
(5.3)
where mP is the mth critical load obtained from the eigenvalue solution for equilibrium equation
or a corresponding perfectly straight column. By setting 2z L into Eq. 5.2a, the additional
deflection at mid-span is obtained as
1 3 50 1 3 5
1 1
2 2 sin sin ...2
m m
m m
m m zy L y L w w w w w w w w
L
(5.4)
From Eq, (5.3) by substituting into Eq. (5.4). one obtains
3 51
1 3 5
...1 1 1
w ww
P P P P P P
(5.5)
As 1P P , the first term of Eq. (5.5) gains dominance and the contributions of subsequent terms
become comparatively negligible and one obtains
1
1 1
w
P P
(5.6)
Eq. (5.6) can be rearranged as
1
1 1
1 w
P P P
(5.7)

98
The above equation suggests that as the applied load P approaches the first critical load 1P , the
relationship between Y P and X becomes linear, and the slope 11/dY dX P provides
a basis to estimate the critical load 1P . The intersection of the linear relationship with the Y P
axis is 1 1w P and provides an estimate of the initial out-of-straightness amplitude 1w
corresponding to the first Fourier term.
5.2.2 Extension to lateral torsional buckling of beams under uniform moments
This section extends the Southwell plot technique, to beams with initial out-of-straightness (IOS)
and initial angle of twist (IAT) lateral torsional buckling. A close form solution is attainable only
for the case of uniform moments. Thus, a prismatic beam with initial out-of-straightness 0u z
and initial angle of twist 0 z under uniform moment M is considered. As discussed in Section
4.3.1, the initial out-of-straightness 0u z and initial angle of twist 0 z can be expressed as
2
0 0 21
1.0 sinT y
m
m crm
EI m zu z z
M L L
(5.8)
where m is the contribution of the mth eigen mode to the IOS and IAT 0 0
T
u z z . The
corresponding contribution of the mth eigen mode to the initial out-of-straightness of the
compression flange has been shown to be
2
0 , 2/ 2 1 / 2 sin
y
c m m m
crm
EIu z u z d z d m z L
M L
The corresponding additional lateral displacement cu z was found to be
, 0 ,
1 1
1
1c c m c m
m m crm
u z u z u zM M
(5.9)
where ,c mu z is the additional lateral displacement corresponding to mode m and is given by
, 0 ,
1, 1,2...
1c m c m
crm
u z u z mM M
(5.10)

99
As 1crM M , the first term of Eq. (5.9) gains dominance and the contributions of subsequent
terms become comparatively negligible and one obtains
0
1
1
1c c
cr
u z u zM M
(5.11)
By re-arranging Eq.(5.10), one obtains
0
1 1
1c c
c
cr cr
u z u zu z
M M M
(5.12)
Equation (5.12) is linear between cY u z M and cX u z in a manner similar to Eq. (5.7)
and the slope 11/ crdY dX M of the cu z M - cu z plot provides a basis to estimate the first
critical moment 1crM . Also, the intersection of the linear relationship with the cY u z M axis
is 0 1c cru z M which provides an estimate of the initial out-of-straightness amplitude associated
with the first buckling mode.
5.3 Extension of the Southwell plot technique to beams with non-uniform
moments
Since the findings of the previous section are confined to the case of beams under uniform
moments, it is of interest to determine whether similar patterns can be observed for the more
general case of non-uniform moments. Unlike the case of uniform moments, a closed form solution
is unattainable under non-uniform moments. As such, the problem will be investigated numerically
based on the FEM developed in Chapter 3.
A 7.80m span beam with a W250X45 cross-section is subjected to mid-span point load. Two cases
for the initial out-of-straightness are examined. In Case 1, the initial out-of-straightness is assumed
to be sum of the first, third and fifth modes, with equal amplitudes
1 3 5, , / 3000 1,1,1 2.6 1,1,1L mm . In Case 2, the initial out-of-straightness is assumed
to exclusively follow the first mode with amplitudes
1 3 5, , 3000,0,0 2.6,0,0L mm .The critical moments for the perfectly straight beam as
obtained from the eigenvalue analysis is 100.3 kNm which corresponds to a load of 51.4kN. Using

100
the present FEM analysis, the load is ramped from 0.1kN to 51.4kN with a 0.01kN increments to
obtain the non-linear load-lateral displacement relationship. The additional lateral displacement at
the compression flange is examined at mid-span point 2c cu u L . The analysis under Section
5.2.2 is postulated to hold true for the case of non-uniform moment and the validity of the
assumption will be examined by comparing the buckling moment predictions of the developments
of Section 5.2.2 to those based on the eigenvalue analysis. Thus, the critical moment crM is
obtained from the inverse of the slope of cY u M versus cX u plot and the intercept of the
relationship with cY u M axis is assumed to be equal to 0 1c cru M .Figure 5.1 presents the
cu M - cu relationship for the two IOS patterns considered.
The cu M - cu relations for both IOS patterns are observed to slightly deviate for low values for
the displacement cu . Initially, the difference between both curves is 9.5% at an applied moment of
0.2M kNm . As the applied moments increase, both relations approach one another, and when
the applied moments 66.0M kNm , the difference between both displacements reduces to 2.7%.
This case corresponds to the right-most point in Figure 5.1. When the applied moment further
increases to 87.8M kNm , the corresponding percentage difference decreases further to 0.9%
(not shown on Figure 5.1).
When conducting a lateral torsional buckling experiment on a beam with IOS, the loading is
ramped up and the corresponding lateral displacement is recorded. Thus, the quantities , c kM u
would be known for multiple points 1,2.... maxk k along the loading path. The data collected is
then used to determine k c kY u M versus k c k
X u . The computed ,k kX Y data within a
given test range r can then be used to conduct a linear regression analysis of the form
k r k rY A X B , where the regression coefficients ,r rA B depend on the regression range r and are
related to the critical moment and initial IOS through the relations
0
1 1
1, c
r r
cr crr r
uA B
M M
(5.13)

101
It is evident that the accuracy of the predictions of 1crM and 0 cu depends on the selected regression
range. In order to characterize the effect of regression range r on the predictions of 1crM and 0 cu ,
five ranges for applied moments are selected to conduct the regression analysis. These are 0.2-
19.5, 19.7-39.0, 39.2-58.5, 58.7-78.0, and 78.2-100.3 kNm. The critical moment predictions and
the IOS magnitude predictions are provided in Table 5.1. Column (7) indicates that the ratio of
critical moment predicted based on the regression to that based on the eigenvalue prediction to
range from 9.2% (for the lowest loading range considered of 0.2-19.5 kNm) down to 0.00% (for
the highest loading range considered of 78.2- 100.3 kNm).
For the IOS scenario corresponding to case 2, given that the higher mode amplitudes were chose
to vanish, it is observed that excellent predictions of the critical moments are obtained irrespective
of the range of loading used for the regression. For a regression range of 0.20-19.5 and 78.2-
100.3kNm, the predicted critical moment was 100.3 kNm, which coincide to that corresponding
to that based on an eigenvalue analysis within four significant digits.
In summary, the previous findings suggest that proposed extension of the Southwell plot technique
can be reliably used to predict the critical moments for a perfectly straight beam. For a beam with
general IOS pattern involving higher mode contributions, the accuracy of predictions of the
proposed method tends to quickly improve with the increase of the load range chosen for
regression. For the hypothetical case where the IOS imperfection is assumed to follow solely the
first mode, fast convergence towards the critical moment is observed and the use of data at low
range of loading is found to reliably predict the critical moment for a perfectly straight beam.
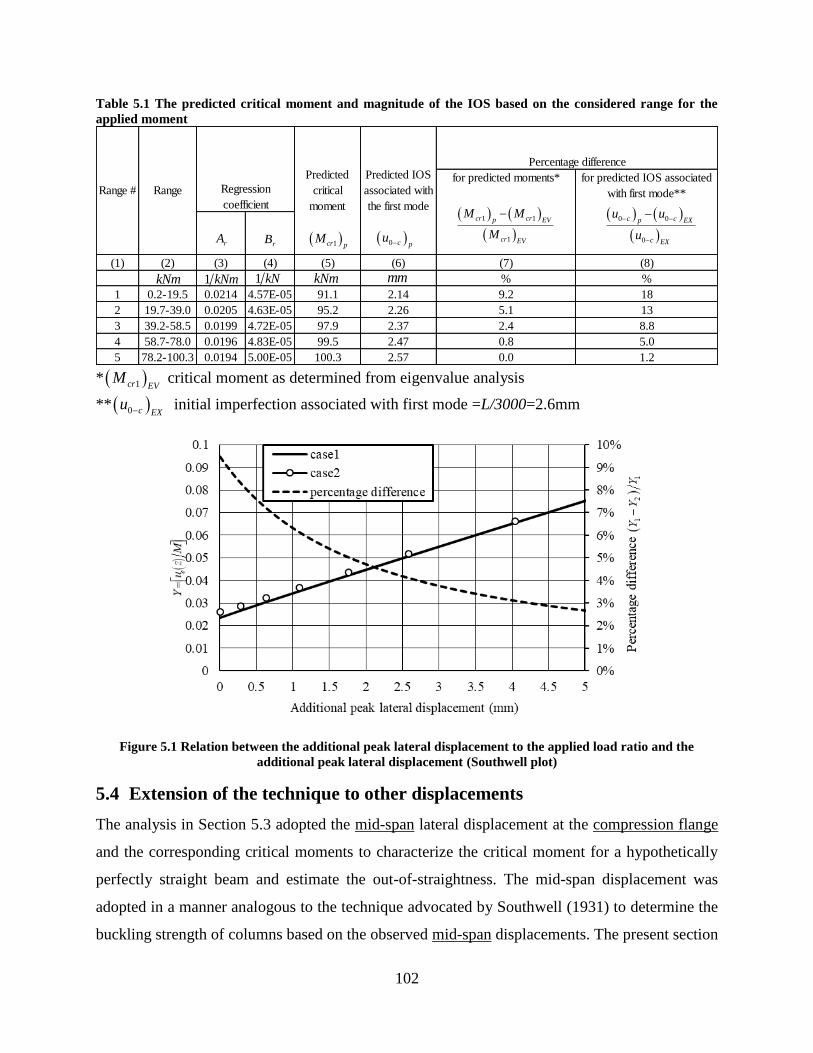
102
Table 5.1 The predicted critical moment and magnitude of the IOS based on the considered range for the
applied moment
* 1cr EV
M critical moment as determined from eigenvalue analysis
** 0 c EXu initial imperfection associated with first mode =L/3000=2.6mm
Figure 5.1 Relation between the additional peak lateral displacement to the applied load ratio and the
additional peak lateral displacement (Southwell plot)
5.4 Extension of the technique to other displacements
The analysis in Section 5.3 adopted the mid-span lateral displacement at the compression flange
and the corresponding critical moments to characterize the critical moment for a hypothetically
perfectly straight beam and estimate the out-of-straightness. The mid-span displacement was
adopted in a manner analogous to the technique advocated by Southwell (1931) to determine the
buckling strength of columns based on the observed mid-span displacements. The present section
(1) (2) (3) (4) (5) (6) (7) (8)
% %
1 0.2-19.5 0.0214 4.57E-05 91.1 2.14 9.2 18
2 19.7-39.0 0.0205 4.63E-05 95.2 2.26 5.1 13
3 39.2-58.5 0.0199 4.72E-05 97.9 2.37 2.4 8.8
4 58.7-78.0 0.0196 4.83E-05 99.5 2.47 0.8 5.0
5 78.2-100.3 0.0194 5.00E-05 100.3 2.57 0.0 1.2
for predicted moments* for predicted IOS associated
with first mode**
Percentage difference
Regression
coefficient
Range # Range
Predicted
critical
moment
Predicted IOS
associated with
the first mode
rArB
kNm kNm mm
1 1
1
cr crp EV
cr EV
M M
M
0 0
0
c cp EX
c EX
u u
u
1cr pM 0 c p
u
1 kNm 1 kN
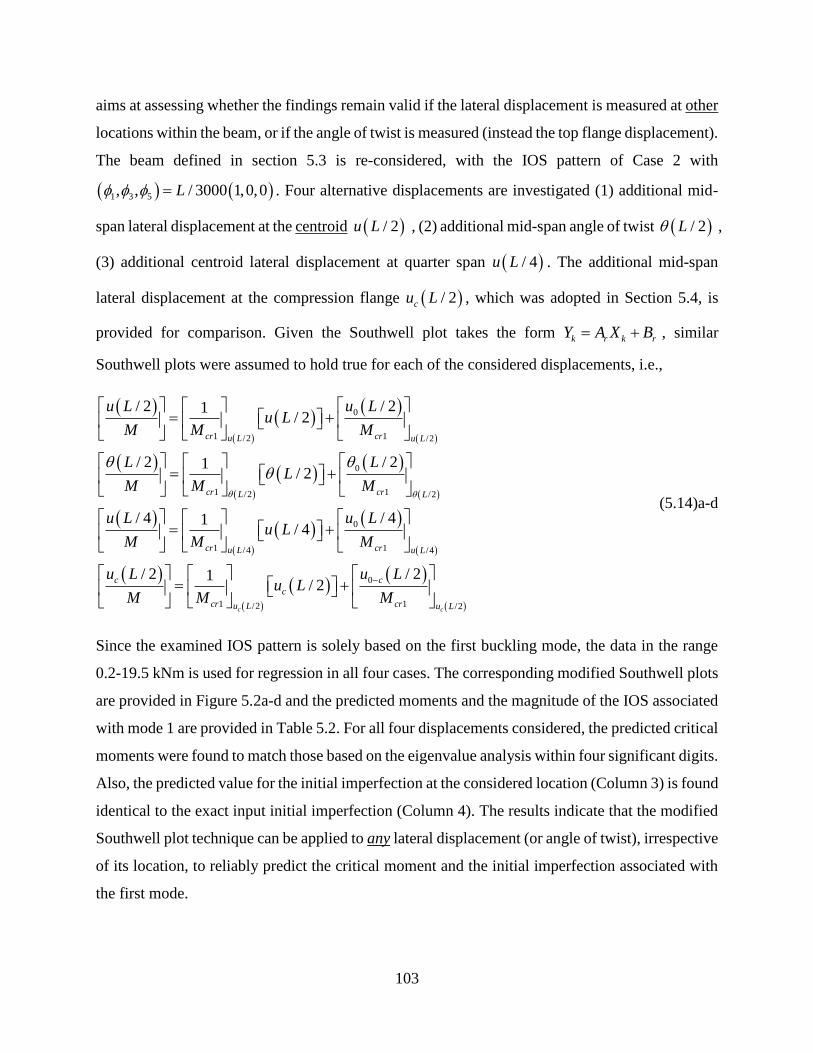
103
aims at assessing whether the findings remain valid if the lateral displacement is measured at other
locations within the beam, or if the angle of twist is measured (instead the top flange displacement).
The beam defined in section 5.3 is re-considered, with the IOS pattern of Case 2 with
1 3 5, , / 3000 1,0,0L . Four alternative displacements are investigated (1) additional mid-
span lateral displacement at the centroid / 2u L , (2) additional mid-span angle of twist / 2L ,
(3) additional centroid lateral displacement at quarter span / 4u L . The additional mid-span
lateral displacement at the compression flange / 2cu L , which was adopted in Section 5.4, is
provided for comparison. Given the Southwell plot takes the form k r k rY A X B , similar
Southwell plots were assumed to hold true for each of the considered displacements, i.e.,
0
1 1/2 /2
0
1 1/2 /2
0
1 1/4 /4
1 /2
/ 2 / 21/ 2
/ 2 / 21/ 2
/ 4 / 41/ 4
/ 2 1/ 2
c
cr cru L u L
cr crL L
cr cru L u L
c
c
cr u L
u L u Lu L
M M M
L LL
M M M
u L u Lu L
M M M
u Lu L
M M
0
1 /2
/ 2
c
c
cr u L
u L
M
(5.14)a-d
Since the examined IOS pattern is solely based on the first buckling mode, the data in the range
0.2-19.5 kNm is used for regression in all four cases. The corresponding modified Southwell plots
are provided in Figure 5.2a-d and the predicted moments and the magnitude of the IOS associated
with mode 1 are provided in Table 5.2. For all four displacements considered, the predicted critical
moments were found to match those based on the eigenvalue analysis within four significant digits.
Also, the predicted value for the initial imperfection at the considered location (Column 3) is found
identical to the exact input initial imperfection (Column 4). The results indicate that the modified
Southwell plot technique can be applied to any lateral displacement (or angle of twist), irrespective
of its location, to reliably predict the critical moment and the initial imperfection associated with
the first mode.

104
Table 5.2 Predicted critical moment and the magnitude of the IOS based on the considered displacement
a based on
2 2
1
3000sin , 2
1 2y cr
Lz L z L
EI h M L
b based on 2 2
1
3000sin , 2
2 cr y
Lz L z L
h M L EI
c based on 2 2
1
3000sin , 4
1 2y cr
Lz L z L
EI h M L
d based on 3000 sin , 2L z L z L
(a)
(b)
for predicted moments for predicted IOS
associated with first mode
(1) (2) (3) (4) (5) (6)
100.3 1.82mm 1.82mm a 0 0
100.3 0.0058rad 0.0058rad b 0 0
100.3 1.20mm 1.20mm c 0 0
100.3 2.59mm 2.60mm d 0 0.4%
DisplacementPredicted
moment
Predicted
IOS
IOS exact
value
Percentage difference
1 1
1
cr crp EV
cr EV
M M
M
p EX
EX
IOS IOS
IOS
/ 2u L
/ 2L
/ 4u L
/ 2cu L
kNm EX
IOS
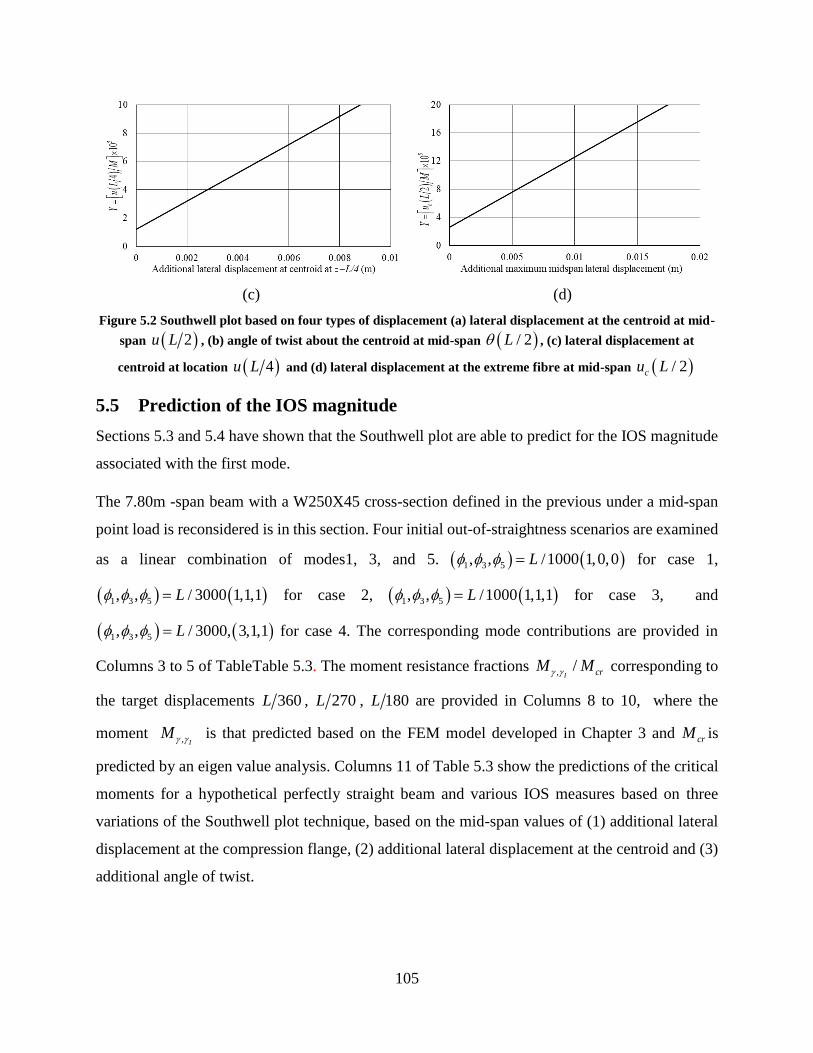
105
(c)
(d)
Figure 5.2 Southwell plot based on four types of displacement (a) lateral displacement at the centroid at mid-
span 2u L , (b) angle of twist about the centroid at mid-span / 2L , (c) lateral displacement at
centroid at location 4u L and (d) lateral displacement at the extreme fibre at mid-span / 2cu L
5.5 Prediction of the IOS magnitude
Sections 5.3 and 5.4 have shown that the Southwell plot are able to predict for the IOS magnitude
associated with the first mode.
The 7.80m -span beam with a W250X45 cross-section defined in the previous under a mid-span
point load is reconsidered is in this section. Four initial out-of-straightness scenarios are examined
as a linear combination of modes1, 3, and 5. 1 3 5, , /1000 1,0,0L for case 1,
1 3 5, , / 3000 1,1,1L for case 2, 1 3 5, , /1000 1,1,1L for case 3, and
1 3 5, , / 3000, 3,1,1L for case 4. The corresponding mode contributions are provided in
Columns 3 to 5 of TableTable 5.3. The moment resistance fractions , /I crM M corresponding to
the target displacements 360L , 270L , 180L are provided in Columns 8 to 10, where the
moment , IM is that predicted based on the FEM model developed in Chapter 3 and crM is
predicted by an eigen value analysis. Columns 11 of Table 5.3 show the predictions of the critical
moments for a hypothetical perfectly straight beam and various IOS measures based on three
variations of the Southwell plot technique, based on the mid-span values of (1) additional lateral
displacement at the compression flange, (2) additional lateral displacement at the centroid and (3)
additional angle of twist.

106
In all three cases, the results show that the Southwell plot accurately predicts the IOS associated
with the first buckling mode, as the percentage difference between the estimated IOS and the input
IOS nearly vanishes.
For cases where the IOS is based on a linear combination of multiple buckling modes (Cases 2-4),
the Southwell plot technique is found to predict IOS magnitude associated to the first buckling
mode (Column 15-17), rather than the total IOS amplitude. For example, in Cases 2-4, the
predicted displacement at the compression flange mid-span are 7.78, 2.59, and 7.79mm, which
respectively nearly match the first mode contributions of 7.79, 2.60, and 7.79mm. These values
generally differ from the corresponding total IOS values of 23.4, 7.79 and 13.0 mm.
Given the moment resistance fraction , /I crM M calculated from the present finite element
solution for threshold displacement values / 360, 270cu L L L and 180L (Columns 8- 10),
the predicted IOS / IL are computed from Eq. 4.10: 1I crM M . The resulting
predictions are provided in Columns 18-20 for displacement thresholds 360, 270cu L L and
180L , respectively. The corresponding percentage differences in Columns 21-23 range from to
0.4% respectively for case 1, suggesting that the equation 1I crM M is able to estimate
the first mode IOS contribution (in a manner similar to the Southwell plot since both methods
neglect the contributions of higher modes). In all cases considered, the Southwell plot technique
and Eq. (4.10) are unable to capture the contributions of the higher modes.

107
Table 5.3 Assessment of Southwell plot technique to estimate IOS
1 , 3 and 5 amplitudes of first, third, and fifth modes respectively to the IOS
*1
1i
crM M
(1) (2) (3) (4) (5) (6) (7) (8) (9) (10) (11) (12) (13) (14) (15) (16) (17) (18) (19) (20) (21) (22) (23)
cen
roid
IO
S a
t m
idsp
an (
mm
)
IAT
at m
idsp
an (
rad)
additio
nal
dis
pla
cem
ent =
L/3
60
additio
nal
dis
pla
cem
ent =
L/2
70
additio
nal
dis
pla
cem
ent =
L/1
80
1L/1000=
7.79L/1000 0 0 5.46 0.0175 0.735 0.787 0.848 100.3 7.79 5.46 0.0175 0.0% 0.0% 0.0% 7.80 7.81 7.76 -0.2% -0.2% 0.4%
23L/1000
=23.37
L/1000
=7.79L/1000 L/1000 5.46 0.0175 0.739 0.790 0.849 100.3 7.78 5.46 0.0174 0.1% 0.0% 0.6% 7.64 7.67 7.70 1.5% 1.9% 1.2%
3L/1000=
7.79L/3000 L/3000 L/3000 1.82 0.00583 0.893 0.917 0.944 100.3 2.59 1.82 0.0058 0.4% 0.0% 0.5% 2.59 2.61 2.57 -0.4% 0.3% 1.3%
45L/3000
=12.98L/1000 L/3000 L/3000 5.46 0.0175 0.737 0.788 0.848 100.3 7.79 5.46 0.0174 0.0% 0.0% 0.6% 7.72 7.76 7.76 0.4% 0.9% 0.4%
FEM predicted moment
ratio corresponding toIOS information IOS predicted by Equation*Southwell plot predictions
additio
nal
dis
pla
cem
ent =
L/3
60
additio
al d
ispal
cem
ent =
L/2
70
Additio
nal
dis
pla
cem
ent =
L
/180
critic
al m
om
ent (k
Nm
)
IO
S a
t ex
trem
e fi
bre
(m
m)
IO
S a
t ce
troid
(m
m)
IAT
(ra
d)
[(3)-
(12)]
/(3)
[(2)-
(20)]
/(2)
[(6)-
(13)]
/(6)
[(7)-
(14)]
/(7)
corresponding to
[(2)-
(19)]
/(2)
[(2)-
(18)]
/(2)
Cas
e
Pea
k I
OS
(γI
)(m
m)
Contribution of
1 3 5
1

108
5.6 Effect of higher modes on the response
Figure 5.3 (a) depicts the relation between the applied mid-span point load and the total lateral
displacement at the compression flange cu , as predicted by the present finite element solution,
for the four cases considered in Table 5.3. The plots for all four cases are found to asymptotically
approach from below the critical moment obtained predicted from the eigenvalue solution. While
cases 1 and 3 share the same total IOS magnitude 0 /1000cu L , a large difference is observed
between the predicted moment ratio for case 1 is distinctly higher than that of case 3 given that the
IOS contribution of the first mode in case 1 is three times higher than that of case 3. To the contrary,
Cases 1, 2 and 4 tend to approach one another as the lateral displacement increases, although they
happened to have different total IOS. This is due to the fact that the mode 1 contribution to the
IOS is equal in all three cases.
In Figure 5.3 (b), the relation between the applied mid-span point load and the additional peak
lateral displacement at the compression flange cu is provided for the all four cases. All four curves
are also found to asymptotically approach the critical load predicted by an eigenvalue solution
from below. Unlike Figure 5.3(a), the plots for cases 1, 2 and 4 are observed to nearly coincide
since they share a common IOS first mode contribution 1 1000 7.79L mm . In contrast, Case 3
has a lower IOS first mode contribution 1 3000 2.59L mm and thus approaches the eigen
value solution faster than the other thee plots. The results suggest that effect of the higher mode
contributions to IOS on the moments predicted reduces as the additional lateral displacements
decrease.
(a)
(b)
Figure 5.3 Relation between (a) the peak lateral displacement and (b) the additional peak lateral
displacement and the applied load for the examined four cases
109
5.7 Predicting the number of contributing modes
The previous sections suggest that the Southwell plot technique can predict only the magnitude of
the first buckling mode to the IOS. The present section proposes a technique to estimate the
contributions of all modes by assuming all modes contribute equally to the IOS. In Chapter 3, we
recall that the additional displacement at the compression flange cu was given by summing the
amplified IOS for each mode, resulting in the equation
1
sinc m
m crm
M m zu z
M M L
(5.15)
The exact IOS is assumed to be based on a linear combination of the first, third and fifth buckling.
In the absence of measurements suggesting otherwise, the contributions of three modes are
assumed equal, i.e.,
1 3 5 2 4, 0 (5.16)
From Eq. (5.16) by substituting into Eq. (5.15) and adopting 2z L , and solving for one
obtains
1,3,5
c crm
m
u M M M
(5.17)
Equation (5.17) is restricted for uniform moments. To extend its applicability to other loading
cases, the elastic critical moments ( 1,3,5,..)crmM m are first obtained from the Eigen solutions.
For a given moment M , the corresponding lateral displacement cu is then obtained from the FEM
developed in chapter 3. The terms on the right-hand side of Eq. (5.17) are known, which allows
the characterization of the contributions 1 3 5 of the three modes.
Eq. (5.17) is applied to the IOS pattern corresponding to Case 2 defined in section 5.5. The
percentage differences between the IOS predicted by Eq. (5.17) and the input IOS are provided in
Figure 5.4. The percentage difference between the predicted and input IOS is found to decreases
as the applied moments increase in a nearly linear manner. For example, the percentage difference
between the predicted and input IOS is 16.5% at a moment of 40 kNM and reduces to 6.10% at a
moment of 80kNm.

110
The previous example is based on the assumptions that (1) the number of the buckling modes n
contributing to the IOS is known, and (2) the buckling modes contribute equally to the IOS. For a
real beam, if the second assumption retained, it would be of interest to develop a technique to
estimate the number of contributing modes n to the IOS. Equation (5.15) is normalized by
dividing both sides by the maximum lateral displacement 2cu L , yielding
1
1
sin , 1,3,5...2
nc crm
nmc n
m crm
M
u z M M m zm n
Mu L L
M M
(5.18)
The normalized lateral displacement distribution 2c c nu z u L based on 1,3,5,...n modes
are compared to the lateral displacements at a relatively low value of the applied moment M (in
comparison to the critical moment). Here, the lateral displacements are obtained from the FEM
model, while for a real beam, the lateral displacement distribution would be experimentally
determined. Figure 5.5 provides a comparison between the normalized lateral displacements for
an applied moment M 39.2 kNm as predicted by Eq. (5.18) based on 1,3,5n . Overlaid on the
same plot is the FEA predicted additional lateral displacement based on the input IOS. Given that
in the present example, only modes 1, 3, and 5 were postulated to contribute to the IOS, the
predictions of Eq. (5.18) provide a very close approximation to the FEA predicted additional
lateral displacement when 5n , correctly predicting that, in this case, n should be taken as five.

111
Figure 5.4 Relation between the percentage difference between the predicted IOS and the input IOS and the
applied moment for case 2
Figure 5.5 Normalized lateral displacement versus normalized coordinate of case 2 under 39.2kNm and the
predicted shapes by
5.8 Summary and Conclusions
In this chapter, the theoretical background for the Southwell plot technique was reviewed and
extended to the elastic lateral torsional buckling problem. The modified Southwell plot technique
was extended for cases of non-uniform moments. The moment lateral displacement plots were
developed for various IOS scenarios based on the FEM developed in Chapter 3. The effect of the
higher modes on the accuracy of the critical moment and IOS predictions was investigated through
112
comparison of Southwell plot predictions to the critical moments predictions based on eigenvalue
solution and the input in IOS. A method to estimate the contribution of higher modes was provided
when the contributions of all modes are assumed equal. The main findings of the study are
summarized as follows:
1. The modified Southwell plot technique can predict the elastic critical moment for a perfectly
straight beam as well as the magnitude of the first mode contribution to the IOS.
2. When using the extended Southwell plot technique, using the data corresponding to larger
loads and displacement was shown to lead to more accurate critical moment predictions.
3. The technique is found applicable and valid for any lateral displacement (or angle of twist)
within the beam. Thus, the use of any displacement was found to reliably predict the critical
moments and contribution of the first buckling mode to the IOS.
4. A method was devised to estimate the contributions of all modes in situations where the analyst
believes that n modes contribute equally to the IOS.
113
6. Summary and Conclusions
6.1 Summary
1. A variational principle was developed in Chapter 3 for the lateral torsional analysis of beams
with initial out-of-straightness (IOS) and initial angle of twist (IAT) subjected to strong axis
bending. The variational principle was used to obtain the governing equations and boundary
conditions by evoking the stationary conditions. The governing equations were solved for a
simply supported beam under uniform moments to obtain a closed form solution for the load-
displacement relationship. The variational principle was then used to develop a finite element
formulation for crooked beams under general transverse loads and boundary conditions.
2. The validity of the finite element model was assessed through comparisons against the
ABAQUS models for the thin walled beam element B31OS, the shell S4R and closed form
solutions where applicable, and the present finite element model was found to reliably predict
the load-displacement relationship for beams with IOS.
3. The finite element model was used to investigate the effect of the IOS/IAT patterns and the
contribution of the higher modes on the load-displacement relationships of the initially crooked
beams.
4. Two types of design criteria were proposed based on the threshold displacement and threshold
stress values and applied in conjunction with load-displacement curves obtained from the
present FEM to propose elastic lateral torsional buckling moments that account for initial
imperfections.
5. Chapter 4 developed a closed form solution to determine the moment resistance fraction
, I crM M based on the displacement based criterion. The expression is limited to simply
supported beams under uniform moments. Numerical results were used to modify the
expression and extend it to accommodate other loading cases.
6. Another closed form solution was developed in chapter 4 to characterize the moment resistance
fraction ,I crM M based on the stress-based criterion. The parameters influencing the
moment resistance were identified and systematically investigated on members with common
cross-sections.
7. The moment ratios based on the displacement-based criterion were used to propose a modified
design curve design for the elastic critical moment resistance that could incorporate the IOS

114
effect into CAN/CSA S16-14 provisions. The moment ratios corresponding to the stress-based
criterion were also used to propose modified design curves by adopting a format similar to the
one used for columns in CAN/CSA S16-14.
8. A modified form of the Southwell plot technique was extended for the lateral torsional
buckling of simply supported beams under uniform moments, and then the technique was
numerically extended for other loading cases in Chapter 5. The technique was shown to be
valid for any load versus lateral displacement or versus angle of twist history within the beam.
9. Using the load-displacement relationship obtained from the present FEM, in conjunction with
the modified Southwell plot technique, the effect of the moment range on the accuracy of the
predicted critical moments was studied.
10. The Southwell plot technique was shown to be able to estimate only the IOS associated to the
first buckling mode. A method was proposed to predict the higher mode contributions to IOS,
under the assumption that the first n modes contribute equally to the IOS.
6.2 Conclusions
The main conclusions of the work are:
1. When initial imperfections are expresses as a linear combination of the buckling modes, the
most detrimental IOS contribution was shown to be associated with the first buckling mode.
The relative contributions of higher modes to the lateral displacement (or angle of twist) tend
to decrease as the applied loads approach the elastic critical loads.
2. For a specified initial out-of-straightness at the compression flange 0 cu , among the initial
out-of-straightness scenarios attempted for the tension flange within the range
0 0 0c t cu u u , the most adverse IOS pattern was found to correspond to the case
0 0t cu u , which maximizes the initial angle of twist. In particular, for a specified initial out-
of-straightness at the compression flange 0 cu , the assumption that the IOS follows the first
buckling mode is found to be less detrimental.
3. Based the displacement based design criterion, the LTB resistance of a beam is found solely
to depend on the magnitude of the initial imperfection and the threshold displacement specified
by the designer.

115
4. In contrast, the LTB resistance ,I crM M based on the stress based design criterion was
found to depend upon the IOS coefficient, yield stress fraction, yield-to-critical moment ratio,
span-to-section-depth ratio, flange-width-to-depth ratio and depth-to-flange-thickness ratio.
5. For an initially crooked beam under increasing moment, the normal stress ratio / yF induced
by minor axis bending and warping were found to increase at a higher rate than the normal
stress ratio due to major axis bending as the applied loads are increased.
6. The equation for predicting the moment resistance ratio , /I crM M based on the displacement
criterion, while developed for the case of uniform moments, was found to provide reliable
approximate results for non-uniform moments when appropriate moment gradient factors are
adopted to modify the critical moment crM .
7. A modified form of the Southwell plot technique was found to reliably predict the elastic
critical moment for a perfectly straight beam and the magnitude of the first buckling mode
contribution to the IOS, given the load-displacement data from the lateral torsional buckling
experiments (or analyses) on an initially crooked beam.
8. The accuracy of the modified Southwell plot technique is found to increase with the applied
load magnitudes. The predicted critical moment is found to be more accurate when using data
in the large moment range, as long as the specimen does not undergo yielding.
9. The modified Southwell technique is found to be valid for any displacement (or angle of twist)
within the beam and is able to capture the contribution of the first buckling mode.
6.3 Recommendations for Future Research
Possible extensions of the present study include
1. While the finite element solution developed in Chapter 3 is applicable for any loading and
boundary conditions, subsequent sections have focused solely on simply supported beams under
three loading patterns. It is recommended to use the model developed to extend the study to
other loading and boundary conditions.
2. The present developments were limited to doubly symmetric cross-sections. It is recommended
to extend the model to mono-symmetric cross-sections.
3. The present model is based on the Vlasov theory which neglects the effect of cross-section
distortion, shear deformation, and pre-buckling deformations. It is of interest to expand the work

116
to incorporate such effects by adopting thin-walled beam theories with more enriched
kinematics.
4. The present work was primarily aimed at characterizing the effect of initial out of straightness
on the elastic lateral torsional buckling resistance. It is of practical interest to extend the study
within the inelastic range by incorporating the effects of plasticity, and the contribution of the
residual stresses into the inelastic lateral torsional buckling range.
5. The present work was based on postulating initial out-of-straightness limits in line with
manufacturing tolerances. While the above approach is conservative, it is of practical interest
to supplement the information by measuring the initial out-of-straightness in real steel beams
to possibly determine more representative initial out-of-straightness values. For such beams, it
would be of interest to conduct full-scale testing to experimentally determine the load-lateral
displacement relations and assess the applicability of the modified Southwell plot technique
proposed in the present study.

117
Reference
[1] Ayrton, W. E., and Perry, F., (1886), On Struts, The Engineer, 62, 464
[2] Ariaratnam, S.T., (1963), The Southwell method for predicting critical loads of elastic
structures, Quart. Journ. Mech. And Applied Math., XIV (2), 137-153
[3] American Institute for Steel Construction (1966): Specification for the Design, Fabrication and
erection of structural Steel for Buildings, AISC, Chicago, Illinois
[4] American Institute for Steel Construction (1986): Manual of Steel Construction, Load and
Resistance Factor Design, AISC, Chicago, Illinois
[5] Australian Standard (1998): Steel Structures, ABCB, Homebush, NSW
[6] Aguero, A. and Pallares, F.J., (2007) Proposal to evaluate the ultimate limit state of slender
structures. Part 1: Technical aspects, Engineering Structures, 29, 483-497
[7] Ascione, F., (2014), Influence of initial geometric imperfections in the lateral buckling problem
of thin walled pultruded GFRP I-profiles, Composite Structures, 112, 85-99
[8] Aguero, A. and Pallares, F.J., (2015a), Equivalent geometric imperfection definition in steel
structures sensitive to lateral torsional buckling due to bending moment.” Engineering Structures,
96, 41-55
[9] Aguero, A. and Pallares, L., (2015b) Equivalent geometric imperfection definition in steel
structures sensitive to flexural and/or torsional buckling due to compression, Engineering
structures, 96, 160-177
[10] American institute of steel construction (2016): Specification for structural steel buildings,
AISC, Chicago, Illinois, America
[11] Barsoum, R. S., and Gallagher, R. H., (1970), Finite element analysis of torsional and
torsional-flexural stability problems, International Journal for Numerical Methods in Engineering,
2, 335-52
[12] Boissonnade, N. and Jaspart, J.-P., (2002), Improvement of the interaction formulae for beam
columns in Eurocode 3, Computers and Structures, 80, 2375-2385

118
[13] Canadian standard association (2014): Design of steel structures, CSA, Mississauga, Ontario,
Canada
[14] Canadian institute of steel construction (2016): Handbook of Steel Construction, CISC,
Willowdale, Ontario, Canada
[15] Dutheil, J., (1952), The theory of instability through disturbance of equilibrium. In: IABSE,
4th congress
[16] Dubina, D. and Ungureanu, V., (2002), Effect of imperfections on numerical simulation of
instability behaviour of cold-formed steel members, Thin-Walled Structures, 40, 239-262
[17] DIN 18800 (1988): German Standard Organization, Teil 1-Stahlbauten, Bemessung and
Konstrktion. Beth Verlag Gmbh, Berlin
[18] Eurocode 3 (1993): Design of steel structure. Part 1-1: General rules and rules for buildings,
ENV 1993-1-1
[19] European committee for standardization (2005): Design of steel structures-Part 1-1: General
rules and rules for buildings, Brussels
[20] Hasham, A.S. and Rasmussen, K. J. R., (1995), Member capacity of thin-walled I-sections in
combined compression and major axis bending, Structural stability and design: proceedings of the
international conference on structural stability and design, 1, 135-142
[21] Kala, Z. and Melcher, J., (2009), Material and geometrical characteristics of structural steels
based on statistical analysis of metallurgical products, Journal of civil engineering and
management, 15, 299-307
[22] Kala, Z., (2013), Elastic lateral-torsional buckling of simply supported hot-rolled steel I-
beams with random imperfections, 11th International Conference on Modern Building Material,
Structures and Techniques MBMST, 57, 504-514
[23] Massey, C., (1963), Elastic and inelastic lateral instability of I-beams, The Engineer, 216,
672-674
[24] Meck, H. R., (1977), Experimental evaluation of lateral buckling loads. Journal of the
Engineering Mechanics Division, 103, 331-337
119
[25] Maquoi, R., and Rondal, J., (1982), Sur la force portante des poutres colonnes, Annales des
travaux publics de Belgique, 5, 413-442
[26] Maquoi, R., Boissonnade, N., Muzeau, J. P., Jaspart, J.P., and Villette, M., (2001), The
interaction formulae for beam-columns: a new step of a yet long story. Proceeding of the 2001
SSRC Annual Technical Session and Meeting, 63-68
[27] Mandal, P, and Calladine, C. R., (2002), Lateral-torsional buckling of beams and the
Southwell plot, International Journal of Mechanical Sciences, 44, 2557-2571
[28] McCann, F., Wadee, M.A., and Gardner, L., (2013), Lateral stability of imperfect discretely
braced steel beams, Journal of Engineering Mechanics, 139, 1341-1349
[29] NBE-EA-1995 (1995): Estructuras de acero en edification, Servicio de pubilicaciones, Ed.
Ministerio de foment, Spain
[30] Nguyen, T.T., Chan, T.M., and Mottram, J.T., (2013), Influence of boundary conditions and
geometric imperfection on lateral-torsional buckling resistance of a pultruded FRP I-Beam by FEA,
Composite Structures, 100, 233-242
[31] Papadopoulos, V., Soimiris, G., and Papadrakakis, M., (2013), Buckling analysis of I-section
portal frames with stochastic imperfections, Engineering Structures, 47, 54-66
[32] Southwell, R. V., (1931), On the analysis of experimental observation in the problems of
elastic stability, Proceedings of the Royal Philosophical Society of London, 135(A), 601-616
[33] Standard association of Australia (1998): Steel structures, Homebush, NSW, Australia
[34] Szalai, J. and Papp, F., (2010), On the theoretical background of the generalization of Ayrton-
Perry type resistance formulas, Journal of constructional steel research, 66, 670-679
[35] Timoshenko, S. P. and Gere, J. M., (1961), Theory of elastic stability, McGraw-Hill, New
York
[36] Trahair, N. S. and Bradford, M. A., (1993), Flexural-Torsional buckling of structures, CRC
Press, Boca Raton, Florida
[37] Taras, A. and Greiner, R., (2010), New design curves for lateral-torsional buckling-Proposal
based on a consistent derivation, Journal of constructional steel research, 66, 648-663

120
[38] Vlasov, V. Z., (1961), Thin-walled elastic beams, 2nd edn, National science foundation,
Washinton
[39] Yoshida, H. and Maegawa, K., (1983), Ultimate strength analysis of curved I-beams, Journal
of Engineering Mechanics, 109, 192-214
[40] Yoshida, H. and Maegawa, K., (1984), Lateral instability of I-beams with imperfections,
Journal of Structural Engineering, 110
[41] Yu, C. and Schafer, B.W., (2006), Distortional buckling tests on cold-formed steel beams, J.
Struct. Eng, 132, 515-528