Effect of Technology-Enhanced Continuous Progress...
16
School Psychology Review, 2007, Volume 36, No. 3, pp. 453-467 Effect of Technology-Enhanced Continuous Progress Monitoring on Math Achievement Jim Ysseldyke University of Minnesota Daniel M. Bolt University of Wisconsin-Madison Abstract. We examined the extent to which use of a technology-enhanced con- tinuous progress monitoring system would enhance the results of math instruc- tion, examined variability in teacher implementation of the program, and com- pared math results in classrooms in which teachers did and did not use the system. Classrooms were randomly assigned to within-school experimental and control groups. Participating students were pre- and post-tested using two standardized, nationally normed tests of math achievement. When teachers implemented the continuous progress monitoring system as intended, and when they used the data from the system to manage and differentiate instruction, students gained signif- icantly more than those for whom implementation was limited or nil. Failure to take into account intervention integrity would have made it look like continuous progress monitoring did not enhance math results. School personnel are focused increas- ingly on improvement of the overall achieve- ment of their students, and there is a need and a requirement (under the provisions of the No Child Left Behind Act) to find ways to imple- ment evidence-based instructional practices. Lack of systematic, usable data on individual student performance and progress at the class- room level is a major bottleneck to improving teaching and learning. At the same time pub- lishers are producing comprehensive technol- ogy-enhanced progress monitoring systems that provide teachers with the data they need to differentiate instruction, group students on the basis of comparable goals, and manage or adapt instruction based on student perfor- mance (Edformation, 2004; Good & Kamin- ski, 2002; McGraw-Hill Digital Learning, 2002; Renaissance Learning, 1998a). It is ar- gued that such systems enable professionals to engage in data-driven instructional decision making and are effective in addressing the diversity of academic skills evidenced by the students now attending U.S. schools. School psychologists bring to schools considerable training and expertise in data-driven decision making and accountability (Ysseldyke et al., 2006), and one way in which they can apply The authors acknowledge the assistance of Michael Patterson of the Research Department at Renaissance Learning with data collection and manuscript editing. Correspondence regarding this article should be addressed to Jim Ysseldyke, School Psychology Program, University of Minnesota, 350 Elliott Hall, 75 East River Road, Minneapolis, MN 55455; E-mail: [email protected] Copyright 2007 by the National Association of School Psychologists, ISSN 0279-6015 453
Transcript of Effect of Technology-Enhanced Continuous Progress...

School Psychology Review,2007, Volume 36, No. 3, pp. 453-467
Effect of Technology-Enhanced Continuous ProgressMonitoring on Math Achievement
Jim YsseldykeUniversity of Minnesota
Daniel M. BoltUniversity of Wisconsin-Madison
Abstract. We examined the extent to which use of a technology-enhanced con-tinuous progress monitoring system would enhance the results of math instruc-tion, examined variability in teacher implementation of the program, and com-pared math results in classrooms in which teachers did and did not use the system.Classrooms were randomly assigned to within-school experimental and controlgroups. Participating students were pre- and post-tested using two standardized,nationally normed tests of math achievement. When teachers implemented thecontinuous progress monitoring system as intended, and when they used the datafrom the system to manage and differentiate instruction, students gained signif-icantly more than those for whom implementation was limited or nil. Failure totake into account intervention integrity would have made it look like continuousprogress monitoring did not enhance math results.
School personnel are focused increas-ingly on improvement of the overall achieve-ment of their students, and there is a need anda requirement (under the provisions of the NoChild Left Behind Act) to find ways to imple-ment evidence-based instructional practices.Lack of systematic, usable data on individualstudent performance and progress at the class-room level is a major bottleneck to improvingteaching and learning. At the same time pub-lishers are producing comprehensive technol-ogy-enhanced progress monitoring systemsthat provide teachers with the data they needto differentiate instruction, group students on
the basis of comparable goals, and manage oradapt instruction based on student perfor-mance (Edformation, 2004; Good & Kamin-ski, 2002; McGraw-Hill Digital Learning,2002; Renaissance Learning, 1998a). It is ar-gued that such systems enable professionals toengage in data-driven instructional decisionmaking and are effective in addressing thediversity of academic skills evidenced by thestudents now attending U.S. schools. Schoolpsychologists bring to schools considerabletraining and expertise in data-driven decisionmaking and accountability (Ysseldyke et al.,2006), and one way in which they can apply
The authors acknowledge the assistance of Michael Patterson of the Research Department at RenaissanceLearning with data collection and manuscript editing.
Correspondence regarding this article should be addressed to Jim Ysseldyke, School Psychology Program,University of Minnesota, 350 Elliott Hall, 75 East River Road, Minneapolis, MN 55455; E-mail:[email protected]
Copyright 2007 by the National Association of School Psychologists, ISSN 0279-6015
453

School Psychology Review, 2007, Volume 36, No. 3
those skills is by helping school personnelimplement continuous progress monitoringsystems.
When school psychologists talk aboutprogress monitoring, they often do so in thecontext of discussions of curriculum-based as-sessment (CBA; e.g., Tucker, 1985), curricu-lum-based measurement (CBM; e.g., Deno,1985; Hintze, Christ, & Keller, 2002; Shinn,1989), curriculum-based evaluation (e.g.,Howell & Morehead, 1987), problem solving(Tilly, 2002), or response to intervention(Batsche et al., 2005). Clearly, there is a focuson progress monitoring in the major applica-tions of response to intervention provisions,although the progress monitoring is used toidentify the extent to which instruction or in-tervention is working and to make changeswhen it is not (Salvia, Ysseldyke, & Bolt,2007). Such is the case in the Heartland (Iowa)Area Education Agency model (Grimes,Kums, & Tilley, 2006; Upah & Tilley, 2002),the Pennsylvania Instructional Support Teammodel (Kovaleski, 2003), the Ohio Instruc-tionally-Based Assessment model, and theMinneapolis Problem-Solving model (Mar-ston, Muyskens, Lau, & Canter, 2003). Withinprogress monitoring models, progress moni-toring tools are envisioned as a methodologyto be used to monitor student response toinstruction or response to instructional inter-ventions (Burns & Ysseldyke, 2005).
The alleged benefit of progress moni-toring systems, whether they be periodic(given frequently, typically weekly or bi-weekly) like the Dynamic Indicators of Ba-sic Early Literacy Skills (Good & Kamin-sky, 2002), AIMSweb (Edformation, 2004),and Yearly Progress Pro (McGraw-Hill Dig-ital Learning, 2002), or continuous (givenfrequently, often daily or hourly) like Ac-celerated MathTM (AM; Renaissance Learn-ing, 1998a), is that the systems can be usedto keep teachers aware of the performanceand progress of every student in their classand enable them to make changes in instruc-tion for students experiencing difficulty. Inthe sections that follow, we describe CBA,CBM, and progress monitoring or instruc-tional management systems.
CBA, CBM, and Progress MonitoringSystems
CBA Systems
CBA (sometimes referred to as "masterymeasurement") was defined by Tucker (1985)as a system of monitoring student progressthrough existing course content. Bums, Mac-Quarrie, and Campbell (2003) identify differ-ences between CBA and CBM, indicating thatthe definition of CBA generally has been mis-understood in the research literature "to be ageneric term for any technique measuring stu-dent skill in the given curriculum" (p. 4). Theyindicate that the architects of the original CBAmodel began using the term "Instructional As-sessment" (Kovaleski, Tucker, & Duffy,1995) to refer to an accuracy-based approach(e.g., focus on measuring percentage of knownto unknown material in computing instruc-tional level) first advocated by Gickling andThompson (1985). CBA was designed to as-sess "instructional needs of a student basedupon ongoing performance within the existingcourse content in order to deliver instructionas effectively as possible" (Gickling, Shane, &Croskery, 1989, pp. 344-345).
CBM Systems
CBM (sometimes referred to as "generaloutcomes measure") is a well-established, em-pirically based technology that can be used tomonitor student performance across time, andthat has been shown to be reliable and validfor enhancing the level of information educa-tors need to modify individual instruction forstudents (Black & Wiliam, 1998; Deno, 1985;Fuchs & Fuchs, 1988). A CBM system is a"standardized methodology that specifies pro-cedures for selecting test stimuli from stu-dents' curriculum, administering and scoringtests, summarizing the assessment informa-tion, and using the information to formulateinstructional decisions in the basic skills ar-eas" (Fuchs & Fuchs, 1988, p. 3). More spe-cifically, the performance of students acrossstandard tasks can then be used by teachers tomonitor progress and adapt instructional pro-grams as needed for each student individually
454

Technology-Enhanced Continuous Progress Monitoring
(Deno, 1985, 1986). The overall goal of thistype of instructional system is to frequentlyassess ongoing work, monitor individualprogress, provide informative feedback to stu-dents, adapt instruction as needed, and ulti-mately improve student overall performance.
CBM and CBA may be used on a fre-quent basis to determine specifically whatchildren know and do not know, to designinstruction that addresses skills in need ofadditional remediation, and to show progressin the local curriculum (VanDerHeyden &Bums, 2006).
Progress Monitoring and InstructionalManagement Systems
Recently, AM (Renaissance Learning,1998a) has shown promise as a technology-enhanced progress monitoring and instruc-tional management system. This system pro-vides a possible solution for managing thecomplex set of tasks faced by educators todaythat are nearly impossible to do without theassistance of technology. The intervention isbased on six "Renaissance principles": (a) in-creased time to practice essential skills; (b)match between student skill level and level ofinstruction; (c) direct and immediate feedbackto teachers and learners; (d) personalized goalsetting; (e) use of technology to process, store,and report information; and (f) universal suc-cess. We found the program attractive becauseit incorporated evidence-based principles ofeffective instruction as outlined by Ysseldykeand Christenson (Christenson & Ysseldyke,1989; Ysseldyke & Christenson, 1987a, 1987b,2002). The specific instructional components in-corporated include those listed in Table 1.
AM is relatively straightforward to im-plement. Students are pretested using a 15-mincomputer-adaptive test (STAR MathTM, Re-naissance Learning, 1998b) and, based ontheir performance, assigned to appropriate in-structional levels. The computer generates on-level practice exercises from an extensive da-tabase of items. Students respond to these ex-ercises and score them by scanning them.Then the computer provides immediate feed-back to the student and the teacher. Teachers
are provided with summary information de-tailing the quantity and quality of math per-formance for each student in their class. Theyuse this information to drive instruction, indi-vidualize instruction, adapt instruction, andgroup students for instruction. At face value,AM should work to enhance student mathoutcomes; it gives educational professionalsthe information they need and it incorporatesnearly all of the evidence-based componentsof effective instruction.
By using the AM software, teachers canmanage multiple instructional tasks (i.e.,matching practice items to students' skilllevel, providing a continuous stream of prac-tice items, monitoring individual and classprogress, and providing immediate feedbackon performance via numerous reporting fea-tures). Although much of this information ispresently available at a classroom level, it isoften unrealistic and unmanageable for teach-ers to organize without the assistance of com-puter technology. It is hypothesized that byusing computer technology educators will beable to organize classroom level informa-tion-heretofore unmanageable-into usefulindividual student level programming andtherefore enhance the performance of partici-pating students. It is also thought that it will benecessary to use technology to manage infor-mation if teachers and school psychologistsare to monitor the response of individual stu-dents to regular classroom instruction and tothe differentiated instruction that occurs whenspecific interventions are put in place for in-dividual students who evidence nonrespon-siveness to instruction (Salvia et al., 2007).
Effectiveness Studies
Most research on CBM has been at thelevel of individual students rather than atclassroom, school-wide, or district-wide lev-els. Fuchs, Fuchs, Hamlett, and Stecker (1997)showed that use of CBM data to demonstrateacademic growth to both students and teachersled to improved academic outcomes. VanDer-Heyden and Burns (2006) used school-wideCBA and CBM data to plan and deliver math-ematics instruction and to examine the extent
455

School Psychology Review, 2007, Volume 36, No. 3
Table 1Components of Effective Instruction
Component Description
Instructional match
Instructional expectations
Classroom environment
Instructional presentation
Cognitive emphasis
Motivational strategies
Relevant practice
Informed feedback
Academic engaged time
Adaptive instruction
Progress evaluation
Student understanding
The student's needs are assessed accurately, and instruction is matchedappropriately to the results of the instructional diagnosis.
There are realistic, yet high, expectations for both the amount and accuracyof work to be completed by the student, and these are communicatedclearly to the student.
There is a positive, supportive classroom atmosphere, and time is usedproductively.
Instruction is presented in a clear and effective manner, the directionscontain sufficient information for the student to understand the kinds ofbehaviors or skills to be demonstrated, and the student's understanding ischecked.
Thinking skills and learning strategies for completing assignments arecommunicated explicitly to the student.
Effective strategies for heightening student interest and effort are used withthe student.
The student is given adequate opportunity to practice with appropriatematerials and a high success rate.
The student receives relatively immediate and specific information on his orher performance or behavior; when the student makes mistakes,correction is provided.
The student is actively engaged in responding to academic content; theteacher monitors the extent to which the student is actively engaged andredirects the student when the student is unengaged.
The curriculum is modified within reason to accommodate the student'sunique and specific instructional needs.
There is direct, frequent measurement of the student's progress towardcompletion of instructional objectives; data on the student's performanceand progress are used to plan future instruction.
The student demonstrates an accurate understanding of what is to be doneand how it is to be done in the classroom.
to which this could lead to improved mathskills and scores on math tests. They used theScreening to Enhance Equitable Placementmodel (VanDerHeyden, Witt, & Naquin,2003; Witt, Daly, & Noell, 1999) and notedsignificant improvements in math perfor-mance. Researchers have found consistentlythat the provision of challenging material atthe right instructional level leads to improvededucational outcomes in reading (Bums, 2002;Gickling & Rosenfield, 1995) and math(Bums, 2002; Gickling et al., 1989).
There have been a number of studies onthe efficacy of AM as a continuous progress
monitoring and instructional managementtool. Spicuzza and Ysseldyke (1999) used AMto manage the math instruction of studentsenrolled in a summer school program man-dated because they had failed state tests. Re-sults indicated that students using AM showedan average gain of 5.75 normal curve equiva-lent units on the Northwest Achievement Lev-els Test, a district math achievement test, overthe summer. This was six times the rate ofgrowth they had shown over the prior schoolyear. Spicuzza et al. (2001) found that use ofAM resulted in gains for high-, middle-, andlow-functioning students, and that it also in-
456

Technology-Enhanced Continuous Progress Monitoring
creased the in-classroom incidence of behav-iors known to enhance academic outcomes(e.g., academic engaged time, immediate feed-back, checking for student understanding, andinstructional match). Ysseldyke, Spicuzza,Kosciolek, and Boys (2003) found that stu-dents enrolled in classrooms where the tech-nology-enhanced progress monitoring and in-structional management system was used as anenhancement, consistently outperformed stu-dents using only the Everyday Math curricu-lum (University of Chicago School Mathemat-ics Program, 2004). They reported that gainswere consistent for high-, middle-, and low-performing students and gains were greatestwhen teachers implemented the program to agreater degree and with the highest fidelity oftreatment. Spicuzza et al. (2003) found thatuse of a curriculum-based instructional man-agement system enhanced math achievementof students in urban schools.
Ysseldyke and Tardrew (in press) re-ported the results of a quasi-experiment ofdifferentiating math instruction for a group ofmore than 2,000 students. They reported thatstudents in AM classrooms experienced sig-nificantly greater gains in math compared tostudents in control classrooms. The differencein the gains in one semester ranged from 7percentile points in sixth grade to 14 percentilepoints in third and fourth grades. Gains wereexperienced across the achievement spectrumand consistent for low-, middle-, and high-achieving students. The gain for studentswhose teachers implemented the program witha high level of implementation integrity aver-aged 18 percentile points, about nine times thegain of control students.
Purpose of Study
The purpose of this study was to inves-tigate the effect of teacher use of AM to mon-itor the progress of students in elementary andmiddle school classrooms and to manage theirinstruction based on the results of the progressmonitoring. The extent to which adding theprogress monitoring system made it easier forteachers to differentiate instruction and en-hanced student math performance was of in-
terest. We conducted a randomized controlledexperiment to permit the strongest possibleinferences about effects of the implementationof the continuous monitoring system; how-ever, because of the inevitability of variabilityin implementation integrity, implementationwas monitored at the student level. This strat-egy leads to the following research questions:
1. Is there significant improvement on stan-dardized math tests for students in class-rooms implementing the progress moni-toring and instructional management sys-tem compared to control classrooms?
2. To what extent are there differences inimplementation of the progress monitor-ing and instructional management sys-tem in elementary versus middle schoolclasses?
3. What is the range of variability in im-plementation? To what extent do stu-dents whose teachers are high, moderateand low implementers of the continuousprogress monitoring system differ ingains on standardized math tests?
The latter two questions were intendedto investigate anticipated experimental effectsin a way that would allow a more direct con-nection of such effects to actual use of theprogress monitoring and instructional manage-ment system. Ultimately, our analytic ap-proach mimics the simultaneous use of "in-tent-to-treat" (student assigned to experimen-tal classroom) and "completer" (studentactually used AM as intended) analyses fre-quently used in social science interventionstudies in which participants frequently varyin the degree to which they implement theintended intervention.
Method
With the cooperation of RenaissanceLearning staff, the principals at schools whohad shown interest in the AM program (byrequesting a product quote in the last 18months), but who had not subsequently pur-chased the program, were contacted during thespring of 2003; those who were interested inparticipating in the study were sent an appli-
457
School Psychology Review, 2007, Volume 36, No. 3
cation. To apply, elementary schools had tohave at least three teachers per grade levelwilling to use the assessments, and middleschool teachers had to have at least two sec-tions (or classes) of students per content area.
In exchange for the significant dedica-tion required of potential participants, Renais-sance Learning offered schools the AM andSTAR Math assessments, the software librar-ies covering the school's range of grades(higher or lower if needed for advanced orlower functioning students and special state-or textbook-tagged libraries if available), andsupport materials including scanners, scancards, guides, and learning cards. Schoolswere also provided with unlimited access toRenaissance Learning's technical support toll-free number, and up to five on-site visits froma Renaissance Learning AM consultant.
Applicants were interviewed to deter-mine their willingness and ability to success-fully participate in the study. In selecting thesample, an attempt was made to represent atleast three different states, historically disad-vantaged groups, and schools receiving Title Ifunding. The initial sample selected by theresearchers for participation represented 8states and school districts and included 9schools with approximately 3,000 students in122 classrooms.
Despite the care taken in choosing thesample, it became evident early in the studythat one large, urban middle school was notable to dedicate the time and resources neededto use AM. Given the fact that the school as awhole did less than a month's worth of ex-pected work in AM over the course of theentire school year, the decision was made toexclude the school from the treatment versuscontrol analysis (it remains in the implemen-tation level analysis), which lowered the sam-ple by 22 classrooms and approximately 670students.
The continuous progress monitoringsystem (AM) was implemented in 8 schoolsin 7 school districts in 7 states. Forty-oneclassrooms were considered treatment class-rooms, and 39 classrooms were included in thecontrol group. An additional 20 classes wereclassified as "B" classrooms. These were ele-
mentary classes directed to implement AMonly during the second half of the school year,within the context of a multiple-baseline de-sign. Students from the B classes are onlyincluded in the implementation group analy-sis, and not the treatment versus control anal-ysis. In Table 2 we list the race-ethnicity andgender of the 1,880 students included in theinitial treatment versus control analysis. De-mographic characteristics are shown for eachschool and for those in the treatment and con-trol groups. The table also shows the state inwhich each school is located and the mathcurricula used.
The reader should note that the quantityof students listed in the demographic tablemight not match the numbers included in ourstatistical analyses. This is because studentssometimes were missing for pre- or post-tests,and when this was the case we excluded themfrom the specific analyses. For example, if astudent took both the pre- and post- STARMath Test, but missed the post-test for theTerra Nova, we retained the student in thesample, but excluded that student from thepre-post change score analysis for TerraNova.
Teachers in the 80 classroom settingswere randomly assigned to experimental andcontrol conditions. Different assignmentmethods were used for middle and elementaryschool participants. Given that elementaryteachers typically teach the same class of stu-dents, we randomly assigned the three teach-ers from each grade at each school to either theexperimental (use the progress monitoring andinstructional management system October toMay) or control (no use of the progress mon-itoring and instructional management system)conditions. The third group of elementaryschool teachers (which we called the B group)was assigned to begin using AM midwaythrough the school year, giving us a multiple-baseline design as well as greater anticipatedvariability across students in the amount ofAM implementation over the school year. Inthe middle schools, in which one teacher oftenteaches multiple sections of the same subject,classrooms of students were randomly as-signed to one of the two conditions: used or
458

Technology-Enhanced Continuous Progress Monitoring
.S0
r
.z
0
r~
00 rq "~ CIn0C" r C
0
'I)
;0
(U
'4-
0l
.z
- N -
N N
00 "I -N- 00
CI_
-D CY-C
00 00 Cl-C
en- r-0 W00
0
U
z
rr) r - ýn W) 'c00 W-
N 0 -
00 e I
00
00m
00Itr
rII 000C
C-0
0a
U
U
U
U)
U
0
0
-1 r- CON 0-
0 N- 00
0))
a
0)
00 0
r0)
0
0
0
U
0)
=0
0.0
to
-0)
0U
V) Ln
U
U
0)*00)
0) .0
00�
459

School Psychology Review, 2007, Volume 36, No. 3
did not use the progress monitoring and in-structional management system. Participatingteachers in middle schools taught at least oneexperimental group and one control group.
Those in the experimental conditionwere trained to use and expected to use thecontinuous progress monitoring and instruc-tional management system as an enhancementto their regular math curriculum, whereasthose in the control condition simply usedtheir regular math curriculum. AM can beused with any curricula because teachers havethe ability to only assign the AM objectivesthat align with what is being taught.
All students in the 80 classrooms werepretested with STAR Math, a computer-adap-tive mathematics achievement test, and withthe mathematics subtest of the Terra Nova(CTB/McGraw Hill, 2001) in October 2003.Teachers received training from RenaissanceLearning on how to test students using theSTAR Math assessment, as well as on how theresults of the assessment could be used toinform placement in AM. Teachers also re-ceived detailed instructions on testing studentswith the Terra Nova. Each teacher received anappropriate inventory of Terra Nova testingmaterials early enough to have time to reviewdirections and ask questions or request addi-tional materials if needed. Teachers weregiven a weeklong window in which to teststudents.
Two notable events occurred during thepretesting phase. One elementary school mis-understood the testing directions and only ad-ministered the STAR Math assessment to stu-dents in their experimental classrooms. Nostudents in the B or control classrooms werepretested with STAR Math, although all stu-dents did pretest with the Terra Nova. At asecond elementary school, a few teachers de-cided not to test some second-grade studentswith the STAR Math assessment. This schoolhas a high English as a second language pop-ulation, and the teachers determined that manyof the second-grade students' reading levelswere below that needed to read the test. Thesestudents were given the Terra Nova pretest.
Teachers in the experimental groupwere asked to use data from the STAR Math
pretest to make informed assignments of indi-vidual students or groups of students to spe-cific instructional libraries (levels) and to usethe instructional management system to trackstudent performance, assign work, and informboth the student and teacher of the accuracy ofthe work.
The goal of AM is to serve as a tool foreducators to help students master math objec-tives through continuous practice. Students donot sit in front of a computer and work mathproblems. When a teacher assigns an objectiveto a student, the software prints a paper copyof a practice assignment for the student tocomplete. The student finishes the practiceassignment, which is then scanned into andscored by the software. If the student's perfor-mance is satisfactory (5 out of 6 problemscorrect), the program indicates that he or she is"ready to test," and the teacher is able to printthe test for the student. If the student thenscores well enough on the test (4 out of 5problems correct), the objective is considered"mastered," and the program prints a practiceassignment for the next objective on the stu-dent's list. If the student is struggling with anobjective and needs more work, the programnotifies the teacher, who can then intervene.Students can master objectives through diag-nostic testing as well. This assignment is sim-ilar to a regular test, but can be printed by theteacher without the student completing anypractice work, an option many teachers finduseful for "testing out" advanced students.The program also includes a review featurethat provides students with additional practiceon previously mastered objectives, by mixingreview problems in with practice assignments.The software automatically keeps track ofthese data, so teachers are able to use them tomonitor progress.
During the course of the school year,each teacher using AM received three to fivevisits from a Renaissance Learning Math Con-sultant who guided the teachers on how toimprove their use of the progress monitoringsystem. Each teacher also had unlimited ac-cess to technical support. At the end of theyear (May), students took both STAR Mathand Terra Nova as post-tests.
460
Technology-Enhanced Continuous Progress Monitoring
We were able to use the data from AMin our analyses. We kept track of the numberof practice items, review items, and test itemsthat students attempted. We also counted thepercent correct they earned on the practiceitems, review items, test items, and the num-ber of objectives that students mastered.
Results
Our primary concern was to examinewhether the implementation of a progressmonitoring system would result in greater im-provement on standardized math test scoresfor students in experimental classrooms whencompared to those in similar classrooms notgiven the intervention. The B classrooms thatonly implemented AM during the latter half ofthe school year were not included in this initialanalysis.
In the course of this analysis, it becameevident that a better understanding of the in-tervention could be gained through furtheranalyses exploring the extent to which those inthe experimental condition actually imple-mented AM. It was necessary to formulate anindex of intervention integrity in order to ex-amine the extent to which student perfor-mance, progress, and outcomes differed as afunction of whether teachers used AM. Thisindex was formulated by using the data col-lected from natural implementation of the pro-gram to form three groups of students basedon the extent to which they actually partici-pated in the instructional program. The groupswere formed by counting the numbers of ob-jectives the students mastered. Working onand mastering objectives is a key componentof AM. Teachers use the reports provided bythe program to track student performance, andteachers are taught to expect the students toaccomplish four objectives per week, or ide-ally a year's worth of content in a school year.In addition, teachers are trained to work withstudents to set personalized goals (numbers ofobjectives to master) that are challenging andattainable. Given the centrality of masteringobjectives to proper program implementation,this metric provides a good indicator of the ex-tent to which the program is being implemented.
The overall range of objectives masteredwas 0-197. The distribution of this variableacross students demonstrated a strong positiveskew. We chose to define implementationgroups such that students with less than nineobjectives mastered were considered "non-implementers"; students with 10-36 objec-tives mastered were "low implementers"; andstudents with more than 36 objectives mas-tered were "high implementers." These cutpoints are somewhat arbitrary but were deter-mined on the basis of an inspection of thefrequency distributions and consultation withRenaissance Learning technical staff about thelevels of progress necessary to accomplish ayear's worth of objectives in a year as well asrates of progress considered high, moderate,and low. Use of actual student performancedata provided us with several advantages. Stu-dent performance data were used to determinethe extent of implementation of the programrather than student enrollment in classestaught by teachers assigned to implement theprogram. If we had considered all students asparticipants or nonparticipants based on theirassignment to classrooms of teachers whowere or were not in the experimental group,the fact that teachers did not implement theprogram with some students in the experimen-tal group would have been masked. In addi-tion, number of objectives mastered appears tofunction as an effective measure of implemen-tation. In AM, students start at an objectivelevel appropriately matched to their level ofability, making mastery of objectives more amatter of effort than achievement. Indeed, weobserved several classrooms in which all stu-dents in the class mastered a large number ofobjectives, despite possessing a wide range ofability.
All students were pretested in Octoberof the experimental year and post-tested inMay. Two dependent measures were used:STAR Math (Renaissance Learning, 1998b), acomputer-adaptive math test, and the mathsubtests of the Tera Nova (CTB/McGraw-Hill,2001), with scores on both tests considered interms of normal curve equivalents.
In comparing the experimental (progressmonitoring and instructional management sys-
461
School Psychology Review, 2007, Volume 36, No. 3
tem using AM) versus control (no AM) con-ditions, a linear regression analysis was con-ducted in which post-test scores were re-gressed onto (a) pretest scores, (b) dummyvariables related to main effects for experi-mental condition and school, and (c) productdummy variables that accounted for interac-tions between school and experimental condi-tion. A couple of important features of theregression model should be noted. First, pre-test scores were used as covariates, whichultimately allowed for the effects related toexperimental condition and school to be stud-ied in terms of residualized change in thepost-test score. One concern with using ordi-nary gain scores (i.e., postscore-prescore) asthe outcome in this analysis is the problem ofregression to the mean. The use of residual-ized change scores in the context of the currentanalysis helps address such effects, thus per-mitting a more meaningful aggregation acrossstudents that differed in terms of pretestscores. In effect, residualized change scorescan be conceptualized as follows:
Y - byx(X - Mx) - My
where
Y = observed post-test scorebyx = slope of the regression equation Y = a
+ bXX = observed pretest score
Mx = group mean of pretest scoresMy = group mean of post-test scores
Use of residualized change scores allows formore effective control of pretest differences inevaluating intervention effects.
Second, by adding school effect dummycodes and school by experimental conditionproduct variables to the regression model, ouranalysis also accounted for school effects re-lated to both the control and experimentalconditions. Controlling for school effects wasfound useful, as there are school-specific fac-tors that lead to differential gains in achieve-ment over the school year and thus representan important source of variance unrelated toexperimental condition. Given that the origi-nal design randomized classrooms within
schools, school can be viewed as a blockingvariable, thus making it natural to introduceschool as a control in the analyses. Likewise,interactions between school and experimentalcondition control for the potential of a differ-ential experimental effect across schools, asmight be attributed to differential implemen-tation of AM across schools. As mentionedearlier, a large proportion of the second-gradestudents at one elementary school were notgiven the STAR Math assessment during thepretesting phase because their teachers deter-mined that the students' reading levels weretoo low to take the test. It should be noted thatthis school serves primarily Hispanic students.For this reason, a decision was made to re-move the entire second grade at this schoolfrom our initial treatment versus control anal-ysis.
The results of the regression analyses withrespect to both the STAR Math and TerraNovastandardized tests are reported in Table 3. Themain effects of the experimental condition areevaluated by the condition (AM) coefficient,main effects related to school by the schoolcoefficient, and interaction effects by theAM X School coefficient. A significant maineffect for AM was observed for STAR Math,with an expected score change difference ofapproximately 5 score points (Cohen's effectsize = 0.37). By contrast, a significant maineffect was not found for TerraNova. Thestronger effects observed for STAR Math arenot unexpected because of the closer align-ment of AM with this assessment method;however, the nonsignificance of effects forTerraNova is unexpected. Perhaps most im-portant, substantial school effects were alsofound in this analysis, both in the form of maineffects and interaction effects. In each analy-sis, Nixon School served as the baseline con-dition, both for main effects and interactionswith experimental condition. For both theSTAR Math and TerraNova analyses, signifi-cant variability across schools is demonstratedboth in terms of main effects as well as inter-actions, as several coefficients of each type aresignificant in both analyses. One explanationfor these effects may be variability in imple-
462

Technology-Enhanced Continuous Progress Monitoring
Table 3Regression Analysis for Evaluation of Accelerated Math Effects,
Experimental versus Control Students, Controlling for School Effects
STAR Math TerraNova
Variable b SEb t b SEb t
Intercept 21.24 1.44 14.79* 16.09 1.38 11.66*Condition (AM) 5.37 1.70 3.15* 0.83 1.44 0.58Pretest score 0.73 0.02 34.55* 0.72 0.02 38.46*Jefferson 1.83 2.03 0.90 -0.78 1.72 -0.46Washington -8.23 2.29 -3.59* -7.76 1.98 -3.92*Reagan -9.56 2.03 -4.70* -1.15 1.62 -0.71Carter -6.07 2.38 -2.55* -3.72 2.16 -1.72Ford -2.01 2.21 -0.91 -0.41 1.78 -0.23Lincoln -8.07 1.98 -4.07* 1.18 1.62 0.73Clinton -7.04 1.59 -4.42* -6.67 1.37 -4.88*AM X Jefferson -0.01 2.96 -0.00 0.44 2.53 0.17AM X Washington -3.04 3.25 -0.93 -10.83 2.80 -3.86*AM X Reagan -4.27 2.82 -1.52 5.74 2.33 2.46*AM X Carter -10.48 3.44 -3.05* -0.27 3.04 -0.09AM X Ford a a a 1.68 2.58 0.65AM X Lincoln -2.31 2.81 -0.82 -2.06 2.34 -0.88AM X Clinton -3.72 2.37 -1.57 -3.64 2.01 -1.81
SFord was excluded from the interaction effects analysis because a large number of students did not pretest with STARMath.* p < .05.
mentation, the focus of the second researchquestion.
Thus, in regard to Research Question 2,we next examined the extent to which teachersdiffered in their implementation of the contin-uous monitoring and instructional manage-ment system. As noted, the classrooms orteachers in this study were randomly assignedto experimental (AM) and control (no AM)conditions. Those in the experimental groupwere asked to implement AM with all of thestudents in their classes. We were surprised tolearn that many teachers chose not to imple-ment the program with some students. Teach-ers did not implement the program at all for1046 of the 2645 (39.5%) students in the ex-perimental group. A follow-up analysis wasconducted in an effort to ascertain the extent towhich this failure to implement was system-atic. That is, we asked whether teachers chose
not to implement the program with specifickinds of students (e.g., girls, members of spe-cific racial or multicultural groups, low-func-tioning students, high-functioning students,and English language learner students). Therewas no systematic method for exclusion ofstudents. We intentionally did not compelteachers to implement the program, as it wasour desire to document what happens in anaturalistic implementation of an intervention.Therefore, we compared gain in achievementfor students who were high, low, and non-implementers.
Separate one-way analyses of variancewere performed to test for differences in post-test scores on STAR Math and TerraNovaacross the three implementation groups. Ineach analysis, pretest scores and school wereentered as covariates. In Table 4 we report themean residual STAR Math gain and mean
463

School Psychology Review, 2007, Volume 36, No. 3
Table 4Mean Residualized Gains for
Students with Varying Levels ofImplementation, Controlling for
School Effects
Implementation Level
Group No Low High
STAR Math NCEGrades 2-5 1.346 0.633 7.077Grades 6-8 -2.340 -1.658 4.213
Terra Nova NCEGrades 2-5 -1.209 -1.511 4.739Grades 6-8 -0.565 -0.360 2.092
Note. NCE = normal curve equivalent.
residual TerraNova gain for the entire year forstudents in the no-, low-, and high-implemen-tation groups, This is shown separately for stu-dents in Grades 2-5 and 6-8. For both outcomemeasures, there were significant differences be-tween groups for both Grades 2-5 (STAR Math,F[2, 777] = 9.289, p < .001; TerraNova, F[2,954] = 13.240, p < .001) and Grades 6-8(STAR Math, F[2, 994] = 18.354, p < .001;TerraNova, F[2, 1047] = 4.066,p < .019). Mostnotable are the consistently large and positivegains observed for the high-implementationgroups. Such results demonstrate the need forhigh implementation of AM (i.e., >36 objec-tives mastered) to achieve noticeable effects. Itshould be noted that the seemingly negativegains here are in part an artifact of using theresidualized gain scores in the analyses. A neg-ative value does not indicate that studentsachieved lower scores on the post-test comparedto the pretest. Rather, it indicates the magnitudeof their gain relative to the average gain made byall students, as the average gain always is set tozero.
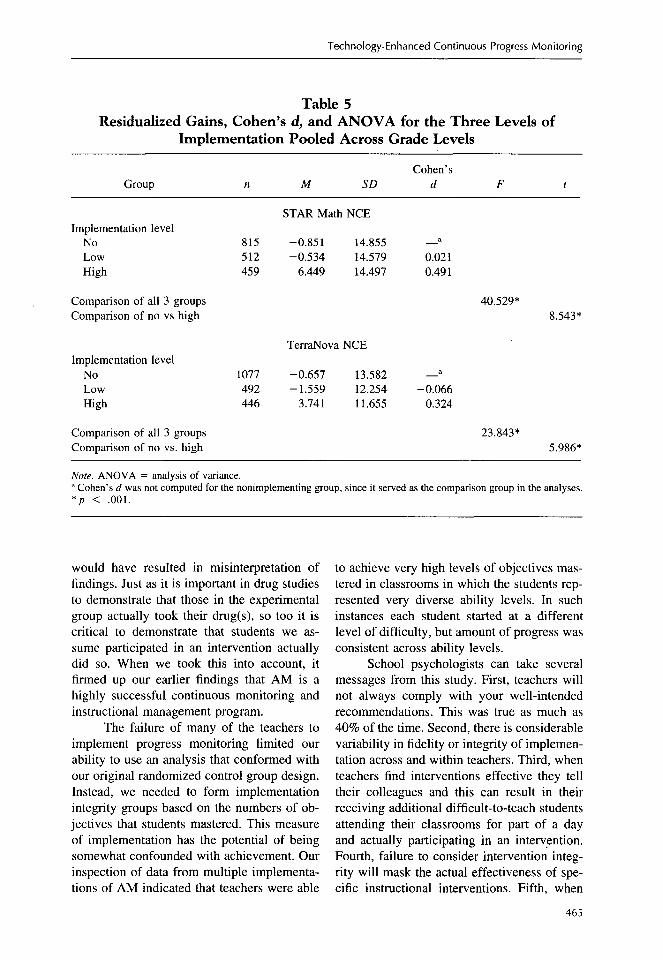
Results of one-way, within-subjects anal-yses of variance on STAR Math gain for theentire year and on TerraNova gain for the entireyear are shown in Table 5, here pooled acrossgrade levels, but again using pretest scores and
464
school as covariates. There was a significantdifference (p < .001) in the amount of gainevidenced by students in the no-, low-, and high-implementing groups on both the STAR MathTest and the TerraNova Achievement Test. Re-sults indicate that intervention integrity had asignificant effect on gain in math scores.
Discussion
Students whose teachers use continuousprogress monitoring and instructional manage-ment systems significantly outperformed thosewhose teachers solely use the math curriculabeing used in their district. Continuousprogress monitoring and data-driven decision-making enhances progress toward meetingstandards and results in higher test scores.This finding is consistent with the argument ofBlack and Wiliam (1998) that formative eval-uation and CBA are extremely powerful waysto move students toward standards mastery.
Intervention integrity is critical. Wewere surprised to learn that many teachers inthe experimental group chose not to imple-ment the progress monitoring system. This is alimitation of the study. Schmoker (1999)might have predicted as much. As he indi-cated, teachers are confronted with "initiativesdu jour," and unless there is explicit monitor-ing of implementation and some kind of re-ward for those who implement the initiatives,teachers do not do so. Goodlad, Klein, andassociates (1970) observed this same phenom-enon more than 30 years ago. They reportedthat "innovation is not enough, behind theclassroom door even teachers who think theyare implementing an innovation are often onlytwisting it right back into what they havealways done" ( Goodlad et al., 1970, p. 72).
As investigators look for evidence thatspecific kinds of instructional interventionsimpact student performance, it is critical thatthey take into account intervention integrity.We were able to illustrate that there is signif-icant difference in the extent to which teachersimplement instructional interventions as evi-denced in this study by the considerable vari-ability in magnitude of student engagementand work. Failure to take this into account
Technology-Enhanced Continuous Progress Monitoring
Table 5Residualized Gains, Cohen's d, and ANOVA for the Three Levels of
Implementation Pooled Across Grade Levels
Cohen'sGroup n M SD d F t
STAR Math NCEImplementation level
No 815 -0.851 14.855 a
Low 512 -0.534 14.579 0.021High 459 6.449 14.497 0.491
Comparison of all 3 groups 40.529*Comparison of no vs high 8.543*
TerraNova NCEImplementation level
No 1077 -0.657 13.582 aLow 492 -1.559 12.254 -0.066High 446 3.741 11.655 0.324
Comparison of all 3 groups 23.843*Comparison of no vs. high 5.986*
Note. ANOVA = analysis of variance.' Cohen's d was not computed for the nonimplementing group, since it served as the comparison group in the analyses.*p < .001.
would have resulted in misinterpretation offindings. Just as it is important in drug studiesto demonstrate that those in the experimentalgroup actually took their drug(s), so too it iscritical to demonstrate that students we as-sume participated in an intervention actuallydid so. When we took this into account, itfirmed up our earlier findings that AM is ahighly successful continuous monitoring andinstructional management program.
The failure of many of the teachers toimplement progress monitoring limited ourability to use an analysis that conformed withour original randomized control group design.Instead, we needed to form implementationintegrity groups based on the numbers of ob-jectives that students mastered. This measureof implementation has the potential of beingsomewhat confounded with achievement. Ourinspection of data from multiple implementa-tions of AM indicated that teachers were able
to achieve very high levels of objectives mas-tered in classrooms in which the students rep-resented very diverse ability levels. In suchinstances each student started at a differentlevel of difficulty, but amount of progress wasconsistent across ability levels.
School psychologists can take severalmessages from this study. First, teachers willnot always comply with your well-intendedrecommendations. This was true as much as40% of the time. Second, there is considerablevariability in fidelity or integrity of implemen-tation across and within teachers. Third, whenteachers find interventions effective they telltheir colleagues and this can result in theirreceiving additional difficult-to-teach studentsattending their classrooms for part of a dayand actually participating in an intervention.Fourth, failure to consider intervention integ-rity will mask the actual effectiveness of spe-cific instructional interventions. Fifth, when
465

School Psychology Review, 2007, Volume 36, No. 3
teachers implement continuous progress mon-itoring and use data derived from the monitor-ing to make instructional decisions for indi-vidual students, those students profit signifi-cantly.
References
Batsche, G., Elliott, J., Graden, J., Grimes, J., Kovaleski,J., Prasse, D., & Tilly, W. D. (2005). Response tointervention: Policy considerations and implementa-tion. Alexandria, VA: National Association of StateDirectors of Special Education.
Black, P. J., & Wiliam, D. (1998). Inside the black box:Raising standards through classroom assessment. PhiDelta Kappan, 80(2), 139-144.
Bums, M. K. (2002). Utilizing a comprehensive system ofassessment to intervention using curriculum-based as-sessments. Intervention in School and Clinic, 38, 8-13.
Bums, M. K., MacQuarrie, L. L., & Campbell, D. T.(1999). The difference between curriculum-based as-sessment and curriculum-based measurement: A focuson purpose and result. NASP Communique, 27(6), 18-19.
Bums, M. K., & Ysseldyke, J. E. (2005). Comparison ofexisting responsiveness-to-intervention models toidentify and answer implementation questions. Cali-fornia School Psychologist, 10, 9-20.
Christenson, S., & Ysseldyke, J. (1989). Assessing stu-dent performance: An important change is needed.Journal of School Psychology, 27, 409 -426.
CTB/McGraw-Hill (2001). Terra Nova. Monterrey, CA:CTB/McGraw-Hill.
Deno, S. L. (1985). Curriculum-based measurement: Theemerging alternative. Exceptional Children, 52, 219-232.
Deno, S. L. (1986). Formative evaluation of individualstudent programs: A new role for school psychologists.School Psychology Review, 15, 358-374.
Edformation. (2004). AIMSweb response to intervention.Edina: MN: Edformation (www.AIMSweb.com).
Fuchs, L. S., & Fuchs, D. (1988). Curriculum-based mea-surement: A methodology for evaluating and improv-ing student programs. Diagnostique, 14, 3-13.
Fuchs, L. S., Fuchs, D., Hamlett, C. C. & Stecker, P. M.(1991). Effects of curriculum-based measurement andconsultation on teacher planning and student achieve-ment in mathematics operations. American Educa-tional Research Journal, 28, 617-641.
Gickling, E. E., & Rosenfield, S. (1995). Best practices incurriculum-based assessment. In A. Thomas & J.Grimes (Eds.), Best practices in school psychology III(pp. 587-596). Bethesda, MD: National Association ofSchool Psychologists.
Gickling, E. E., Shane, R. L., & Croskery, K. M. (1989).Developing math skills in low-achieving high schoolstudents through curriculum-based assessment. SchoolPsychology Review, 18, 344-356.
Gickling, E. E., & Thompson, V. (1985). A personal viewof curriculum-based assessment. Exceptional Chil-dren, 52, 205-218.
Good, R., & Kaminski, R. (2002). Dynamic Indicators ofBasic Early Literacy Skills (DIBELS). Longmont, CO:Sopris West. Also available at www.dibels.uoregon.edu
466
Goodlad, J., Klein, M. F., & Associates. (1970). Behindthe classroom door. Worthington, OH: Charles A.Jones.
Grimes, J., Kurns, S., & Tilley, W. D. (2006). Sustain-ability: An enduring commitment to success. SchoolPsychology Review, 35, 224-244.
Hintze, J. M., Christ, T. J., & Keller, L. A. (2002). Thegeneralizability of CBM survey-level mathematics as-sessments: Just how many samples do we need?School Psychology Review, 31, 514-528.
Howell, K. W., & Morehead, M. K. (1987). Curriculum-based evaluation for special and remedial education.Columbus, OH: Merrill.
Kovaleski, J. F. (2003). The three tier model for identify-ing learning disabilities: Critical program featuresand system issues. National Research Center on Learn-ing Disabilities Responsiveness to Intervention Sym-posium, Kansas City, KS.
Kovaleski, J. F., Tucker, J. A., & Duffy, D. J. (1995,June). School reform through instructional support:The Pennsylvania Initiative (Part I). Communique,23(8), Insert.
Marston, D., Muyskens, P., Lau, M., & Canter, A. (2003).Problem-solving model for decision making with high-incidence disabilities: The Minneapolis experience.Learning Disabilities Research and Practice, 18(3),187-200.
McGraw-Hill Digital Learning. (2002). Yearly ProgressPro. Columbus, OH: Author.
Renaissance Learning. (1998a). Accelerated MathTM(computer program). Wisconsin Rapids, WI: Renais-sance Learning (http://www.renaissancelearning.com).
Renaissance Learning. (1998b). STAR Math. WisconsinRapids, WI: Renaissance Learning.
Salvia, J., Ysseldyke, J., & Bolt, S. (2007). Assessment: Inspecial and inclusive education. Boston, MA: Hough-ton-Mifflin.
Schmoker, M. (1999). Results: The key to continuousschool improvement. Alexandria, VA: Association forSupervision and Curriculum Development.
Shinn, M. R. (Ed). (1989). Curriculum-based measure-ment: Assessing special children. New York: GuilfordPress.
Spicuzza, R., & Ysseldyke, J. (1999). Using AcceleratedMathTM to enhance instruction in a mandated summerschool program. Minneapolis: University of Minne-sota.
Spicuzza, R., Ysseldyke, J., Kosciolek, S., Teelucksingh,E., Boys, C., & Lemkuil, A. (2003). Using a curricu-lum-based instructional management system to en-hance math achievement in urban schools. Journal forthe Education of Students Placed at Risk, 8, 247-265.
Spicuzza, R., Ysseldyke, J., Lemkuil, A., Kosciolek, S.,Boys, C., & Teelucksingh, E. (2001). Effects of usinga curriculum-based monitoring system on the class-room instructional environment and math achieve-ment. Journal of School Psychology, 39, 521-542.
Tilly, W. D., III. (2002). Best practices in school psychol-ogy as a problem-solving enterprise. In A. Thomas &J. Grimes (Eds.), Best practices in school psychologyIV (pp. 21-36). Bethesda, MD: National Association ofSchool Psychologists.
Tucker, J. A. (1985). Curriculum-based assessment: Anintroduction. Exceptional Children, 52, 199-204.

Technology-Enhanced Continuous Progress Monitoring
University of Chicago School Mathematics Program.(2004). Everyday mathematics. DeSoto, TX: S WrightGroup/McGraw-Hill.
Upah, K. R., & Tilly, W. D. (2002). Best practices indesigning, implementing, and evaluating quality inter-ventions. In A. Thomas & J. Grimes (Eds.), Best prac-tices in school psychology IV (pp. 483-501). Bethesda,MD: National Association of School Psychologists.
VanDerHeyden, A., & Bums, M. K. (2006). Examinationof the utility of various curriculum-based measures ofmathematics performance within a response to inter-vention model. Manuscript submitted for publication.
VanDerHeyden, A. M., Witt, J. C., & Naquin, G. (2003).Development and validation of a process for screeningreferrals to special education. School Psychology Re-view, 32, 204-227.
Witt, J. C., Daly, E., & Noell, G. (1999). Functionalassessments. Longmont, CO: Sopris West.
Ysseldyke, J. E., Bums, M. K., Dawson, M., Kelley, B.,Morrison, D., Ortiz, S., et al. (2006). School psychol-ogy: A blueprint for training and practice III. Be-thesda, MD: National Association of School Psychol-ogists.
Ysseldyke, J. E., & Christenson, S. L. (1987a). Evaluatingstudents' instructional environments. Remedial andSpecial Education, 8, 17-24.
Ysseldyke, J. E., & Christenson, S. L. (1987b). The in-structional environment system 2. Longmont, CO: So-pris West.
Ysseldyke, J. E., & Christenson, S. L. (2002). Functionalassessment of academic behavior: Creating successfullearning environments. Longmont, CO: Sopris West.
Ysseldyke, J. E., Spicuzza, R., Kosciolek, S., & Boys, C.(2003). Effects of a learning information system onmathematics achievement and classroom structure.Journal of Educational Research, 96, 163-174.
Ysseldyke, J. E., & Tardrew, S. (in press). Use of aprogress monitoring system to enable teachers to dif-ferentiate mathematics instruction. Journal of AppliedSchool Psychology.
Date Received: July 7, 2006Date Accepted: March 12, 2007
Action Editor: John Hintze E
467
Jim Ysseldyke, PhD, NCSP, is Emma Birkmaier Professor of School Psychology in theDepartment of Educational Psychology at the University of Minnesota. He specializes inresearch and development focused on enhancement of student competence and buildingthe capacity of systems to meet students' needs.
Daniel Bolt, PhD, is Associate Professor of Quantitative Methods in the Department ofEducational Psychology at the University of Wisconsin-Madison. He specializes instatistical methodology related to testing and measurement.

COPYRIGHT INFORMATION
TITLE: Effect of Technology-Enhanced Continuous ProgressMonitoring on Math Achievement
SOURCE: Sch Psychol Rev 36 no3 S 2007
The magazine publisher is the copyright holder of this article and itis reproduced with permission. Further reproduction of this article inviolation of the copyright is prohibited. To contact the publisher:http://www.nasponline.org/index2.html