Effect of surfactants and brine salinity and composition ...
191
Louisiana State University LSU Digital Commons LSU Doctoral Dissertations Graduate School 2012 Effect of surfactants and brine salinity and composition on spreading, weability and flow behavior in gas-condensate reservoirs Yu Zheng Louisiana State University and Agricultural and Mechanical College, [email protected] Follow this and additional works at: hps://digitalcommons.lsu.edu/gradschool_dissertations Part of the Petroleum Engineering Commons is Dissertation is brought to you for free and open access by the Graduate School at LSU Digital Commons. It has been accepted for inclusion in LSU Doctoral Dissertations by an authorized graduate school editor of LSU Digital Commons. For more information, please contact[email protected]. Recommended Citation Zheng, Yu, "Effect of surfactants and brine salinity and composition on spreading, weability and flow behavior in gas-condensate reservoirs" (2012). LSU Doctoral Dissertations. 1314. hps://digitalcommons.lsu.edu/gradschool_dissertations/1314
Transcript of Effect of surfactants and brine salinity and composition ...

Louisiana State UniversityLSU Digital Commons
LSU Doctoral Dissertations Graduate School
2012
Effect of surfactants and brine salinity andcomposition on spreading, wettability and flowbehavior in gas-condensate reservoirsYu ZhengLouisiana State University and Agricultural and Mechanical College, [email protected]
Follow this and additional works at: https://digitalcommons.lsu.edu/gradschool_dissertations
Part of the Petroleum Engineering Commons
This Dissertation is brought to you for free and open access by the Graduate School at LSU Digital Commons. It has been accepted for inclusion inLSU Doctoral Dissertations by an authorized graduate school editor of LSU Digital Commons. For more information, please [email protected].
Recommended CitationZheng, Yu, "Effect of surfactants and brine salinity and composition on spreading, wettability and flow behavior in gas-condensatereservoirs" (2012). LSU Doctoral Dissertations. 1314.https://digitalcommons.lsu.edu/gradschool_dissertations/1314
EFFECT OF SURFACTANTS AND BRINE SALINITY AND
COMPOSITION ON SPREADING, WETTABILITY AND FLOW
BEHAVIOR IN GAS-CONDENSATE RESERVOIRS
A Dissertation
Submitted to the Graduate Faculty of the
Louisiana State University and
Agricultural and Mechanical College
in partial fulfillment of the
Requirements for the degree of
Doctor of Philosophy
in
The Department of Petroleum Engineering
by
Yu Zheng
B.S., Shandong Institute of Mining Technology, 1994
M.S., Qingdao University of Science & Technology, 2004
December 2012

ii
DEDICATION
This work is dedicated to my husband, Haibo Cao; my son, Eric; and to my parents and parents-
in-law who always supported me.

iii
ACKNOWLEDGMENTS
I am deeply thankful to my advisor Dr. Rao for his wise guidance and able support. I
thank him for giving me the opportunity and freedom to do my research. I am also thankful to
Dr. Sears, Dr. White, Dr. Hughes, Dr. Radonjic and Dr. Larock for their kind acceptance to serve
on my examination committee and providing valuable suggestions during my dissertation.
This project is financially supported by the Louisiana Board of Regents through the
Board of Regents Support Fund (LEQSF (2006-09)-RD-B-03) and ConocoPhillips. Their
support is sincerely appreciated. I acknowledge Sasol North America Inc. and a major oil
company for providing the surfactants and the condensate sample.
I would like to show my thanks to my friends Dayanand Saini, Ruiz Paidin, Rahul
Gajbhiye, Paulina Mwangi and Bikash Saikia for providing the technical help and support during
this project whenever needed. I would like to thank Abdallah Kadadha, Fenelon Nunes,
Mauricio Toscano, and Mohamed Abdelrahim for their help in the laboratory. I am also indebted
to all the faculty member, staff and graduate students in the Craft and Hawkins Department of
Petroleum Engineering for their help and friendship. Finally, I would like to thank my family for
their encouragement, support and unconditional love.
iv
TABLE OF CONTENTS
DEDICATION ................................................................................................................................ ii
ACKNOWLEDGMENTS ............................................................................................................. iii
LIST OF TABLES ........................................................................................................................ vii
LIST OF FIGURES ....................................................................................................................... ix
ABSTRACT ................................................................................................................................. xiv
1. INTRODUCTION ................................................................................................................... 1
1.1 Problem Statement ........................................................................................................... 1
1.2 Objectives ......................................................................................................................... 4
1.3 Methodology .................................................................................................................... 5
2. LITERATURE REVIEW ........................................................................................................... 7
2.1 Productivity Loss in Gas Condensate Reservoirs ............................................................ 7
2.2 Remedial Methods for Gas Productivity .......................................................................... 9
2.3 Chemical Wettability Alteration .................................................................................... 12
2.4 Spreading Coefficient ..................................................................................................... 14
2.5 Surfactant ....................................................................................................................... 18
2.6 Bond Number ................................................................................................................. 22
2.7 Fines Migration .............................................................................................................. 23
2.8 Brine Salinity and Composition ..................................................................................... 25
2.8.1 Effect of Brine Salinity/Composition on Interfacial Tension ................................. 26
2.8.2 Effect of Brine Salinity/Composition on Wettability and Oil Recovery ................ 28
2.8.3 Mechanisms of Brine Salinity on Oil Recovery ..................................................... 33
3. EXPERIMENTAL APPARATUS AND PROCEDURES ....................................................... 37
3.1 Materials ......................................................................................................................... 37
3.1.1 Fluids....................................................................................................................... 37
3.1.2 Chemicals ................................................................................................................ 41
3.1.3 Rocks....................................................................................................................... 41
3.2 Experimental Apparatus ................................................................................................. 42
3.2.1 Ambient and High-Pressure High-Temperature Optical Cells ............................... 42
3.2.2 Coreflood Apparatus ............................................................................................... 45
3.3 Experimental Preparation and Cleaning ......................................................................... 46
3.3.1 Optical Cells and the Associated Apparatus Cleaning ........................................... 46
3.3.2 Core Cleaning ......................................................................................................... 47
3.3.3 Rocks Preparation ................................................................................................... 48
3.3.4 Surfactants Thermal Stability Screening ................................................................ 48
3.3.5 Density Meter Calibration....................................................................................... 50
3.3.6 Conductivity Meter and pH Meter .......................................................................... 52
3.4 Experimental Procedure ................................................................................................. 53

v
3.4.1 Interfacial Tension Measurement by Pendent Drop Method .................................. 53
3.4.2 Interfacial Tension Measurement by Capillary Rise Technique ............................. 55
3.4.3 Contact Angle Measurement................................................................................... 58
3.4.4 Surfactant Injection Procedure ................................................................................ 59
3.4.5 Coreflood Procedure ............................................................................................... 60
3.5 Coreflood Simulator ....................................................................................................... 63
4. RESULTS AND DISCUSSION .............................................................................................. 64
4.1 Wettability Determination of Condensate Reservoir at Ambient and Reservoir
Conditions ................................................................................................................................. 64
4.2 Interfacial Tension and Spreading Coefficient............................................................... 71
4.2.1 Interfacial Tension Calibration ............................................................................... 72
4.2.2 Interfacial Tension and Spreading coefficient at Ambient Conditions ................... 73
4.2.3 Interfacial Tension and Spreading coefficient at Reservoir Conditions ................. 75
4.3 Effect of Surfactants on Wettability ............................................................................... 78
4.3.1 During Anionic Surfactant Injection at Ambient Conditions ................................. 78
4.3.1.1 During 500 ppm Anionic Surfactant Injection .................................................... 79
4.3.1.2 During 1500 ppm Anionic Surfactant Injection .................................................. 85
4.3.2 During Nonionic Surfactant Injection at Ambient Conditions ............................... 88
4.3.2.1 During 500 ppm Nonionic Surfactant Injection .................................................. 89
4.3.2.2 During 3000 ppm Nonionic Surfactant Injection ................................................ 91
4.3.3 Summary of Results during Surfactant Injection at Ambient Conditions .............. 94
4.3.4 During Anionic Surfactant Injection at Reservoir Conditions ................................ 95
4.3.4.1 During 1500 ppm Injection ................................................................................. 95
4.3.4.2 During 500 ppm Injection ................................................................................. 101
4.3.4.3 During 3000 ppm Injection ............................................................................... 103
4.3.4.4 Summary of Results at Reservoir Conditions ................................................... 105
4.3.5 After Surfactant Injection at Ambient and Reservoir Conditions ......................... 107
4.4 Calculated Bond Number ............................................................................................. 112
4.5 Surfactant-Induced Flow Behavior at Ambient Conditions ........................................ 117
4.5.1 Relative Permeability and Wettability Measurements for Berea Rock-Condensate-
Synthetic Brine System ....................................................................................................... 117
4.5.2 Effect of Temperature on Condensate Recovery, Relative Permeability and
Wettability for Berea Rock-Synthetic Brine-Condensate ................................................... 122
4.5.3 Effect of Anionic Surfactant on Condensate Recovery and Gas Relative
Permeability ......................................................................................................................... 124
4.5.4 Effect of Anionic Surfactant on Relative Permeability and Wettability............... 127
4.5.5 Effect of Anionic Surfactant on Tertiary Recovery and Spreading Coefficient ... 130
4.5.6 Practical Implications of Surfactant Treatment .................................................... 132
4.6 Effect of Brine Salinity and Composition .................................................................... 133
4.6.1 Interfacial Tension in Condensate and Different Synthetic Brine Systems .......... 133
4.6.2 Measured pH in Condensate-Brine Systems ......................................................... 135
4.6.3 Effect of Brine Salinity/Composition and the pH of Brine on Wettability........... 136
4.6.4 Effect of Brine Salinity/Composition and the pH of Brine on Spreading ............ 139
4.6.5 Adhesion Number ................................................................................................. 143
4.6.6 Receding Contact Angle with Interfacial Tension in Multi-Component Brines .. 145

vi
4.6.7 Preliminary Analysis of Spreading Mechanism ................................................... 146
5. CONCLUSIONS AND RECOMMENDATIONS ................................................................. 153
5.1 Summary of Findings and Conclusions ....................................................................... 153
5.1.1 Effect of Surfactants on Wettability ..................................................................... 153
5.1.2 Effect of Surfactants on IFT and Spreading Coefficient ...................................... 154
5.1.3 Effect of Surfactants on Relative Permeability and Recovery .............................. 155
5.1.4 Effect of Brine Salinity ......................................................................................... 155
5.1.5 Key Mechanisms from Observed Results ............................................................. 156
5.2 Recommendations for Future Work ............................................................................. 157
REFERENCES ........................................................................................................................... 159
APPENDIX: HISTROY MATCH OF RECOVERY AND PRESSURE DROP AND RESULTS
OF RELATIVE PERMEABILITIES FROM COREFLOOD SIMULATOR ............................ 171
VITA ........................................................................................................................................... 175

vii
LIST OF TABLES
Table 1: Effect of Wettability and Spreading Coefficient on Gas Flood Oil Recovery in
Micromodels (Oren and Pinczewski, 1994) .......................................................................... 17
Table 2: Compositional Analysis of Condensate .......................................................................... 38
Table 3: Formation Brine Compositions....................................................................................... 39
Table 4: Types and Salinities of Multi-Component Brines .......................................................... 40
Table 5: Types and Salinities of Single-Salt Brines ..................................................................... 40
Table 6: Interfacial/Surface Tensions for Calibration Experiments ............................................. 73
Table 7: Interfacial Tensions and Spreading Coefficients at Ambient Conditions ...................... 73
Table 8: Results of Interfacial Tensions and Spreading Coefficients at 2264 psia and 210 °F and
Ambient Conditions............................................................................................................... 75
Table 9: Quantitative Drop Dynamic Behavior on Lower Substrate during 500 ppm Anionic
Surfactant Injection ............................................................................................................... 81
Table 10: Quantitative Drop Dynamic Behavior on Lower Substrate during 1500 ppm Anionic
Surfactant Injection ............................................................................................................... 88
Table 11: Quantitative Drop Dynamic Behavior on Lower Substrate during 500 ppm Nonionic
Surfactant Injection ............................................................................................................... 90
Table 12: Quantitative Drop Dynamic Behavior on Lower Substrate during 3000 ppm Nonionic
Surfactant Injection ............................................................................................................... 93
Table 13: Densities of 1500 ppm Anionic Surfactant Solution and Condensate at Reservoir and
Ambient Conditions............................................................................................................... 99
Table 14: Craig’s Rules of Thumb Used for Wettability Interpretation (Ayirala, 2002) ........... 117
Table 15: Summary of Experimental and Simulation Waterflood Results for Base Case (0 ppm)
at Both Room and Reservoir Temperatures ........................................................................ 119
Table 16: Summary of Waterflood Results, Oil-Water Interfacial Tensions and Contact Angles in
Berea Rock-Condensate-Synthetic Brine System at Various Anionic Surfactant
Concentrations ..................................................................................................................... 120
Table 17: Comparison of Experimental and Simulator Results for Waterflood in Berea Core at
Various Anionic Surfactant Concentrations ........................................................................ 124

viii
Table 18: Summary of Gasflood Results and Spreading Coefficient in Berea Rock-Condensate-
Synthetic Brine-Gas System at Various Anionic Surfactant Concentrations ...................... 125
Table 19: Interfacial Tensions and Spreading Coefficients for Brine/Surfactant-Condensate-Gas
Systems ................................................................................................................................ 131
Table 20: Interfacial Tension and pH of Condensate/Multi-Component Brine Systems ........... 133
Table 21: IFT and pH of Condensate/Single-Salt Brine System at Two Salinities .................... 134
Table 22: Effect of Brine Salinity (Multi-Component Brine) on Dynamic Contact Angles and
Adhesion Number ................................................................................................................ 137
Table 23: Effect of Brine Composition (Single-Salt Brine) on Dynamic Contact Angles and
Adhesion Number ................................................................................................................ 138

ix
LIST OF FIGURES
Figure 1: Phase Diagram of a Typical Retrograde Gas Reservoir (McCain, Jr. 1990) .................. 2
Figure 2: Schematic Depiction of the Spreading Coefficient ....................................................... 16
Figure 3: Oil-Water-Gas Distributions in O/G/W/R Systems ...................................................... 16
Figure 4: (a) Schematic Representation of the Growth of Aggregation for Various Regions of the
Adsorption Isotherm. (b) Orientation Model for the Conformation of Surfactant at the
Surfaces. A, B, C Indicate the Successive Stages of Adsorption (Somasundaran and Zhang,
2006) ...................................................................................................................................... 21
Figure 5: Schematic Description of the Equilibrium Drop between the Two Crystals ................ 23
Figure 6: Ambient DDDC Optical Cell Apparatus ....................................................................... 43
Figure 7: High-Pressure High-Temperature (HPHT) Optical Cell Apparatus ............................. 44
Figure 8: Schematic of Coreflood Apparatus Used for Berea Rock-Fluids System ..................... 45
Figure 9: Coreflood Apparatus ..................................................................................................... 46
Figure 10: Experimental Set up for Thermal Stability Test .......................................................... 49
Figure 11: Phase Behavior Pictures for 500 ppm Nonionic Surfactants TDA-12 and FC-4430
Solutions at 72 °F and 210 °F ................................................................................................ 50
Figure 12: Schematic of Pendent Drop Method for IFT Measurement ........................................ 55
Figure 13: Image of Capillary Rise in CH4-Brine System at 2264 psia and 210 °F Conditions
(3000 ppm Surfactant Solution) ............................................................................................ 56
Figure 14: Schematic of Capillary Rise Technique at Ambient Conditions ................................. 57
Figure 15: DDDC Procedures for Condensate-Brine-Quartz System at 2264 psia and 210 °F ... 65
Figure 16: DDDC Procedures for Condensate-Brine-Quartz System at Ambient Conditions ..... 65
Figure 17: DDDC Contact Angles and TPCL Movements for Condensate-Brine-Quartz Surface
at Ambient Conditions (Trial 1) ............................................................................................ 67
Figure 18: DDDC Contact Angles and TPCL Movements for Condensate-Brine-Quartz Surface
at Reservoir Conditions (2264 psia and 210 ºF) (Trial 1) ..................................................... 68
Figure 19: DDDC Contact Angles and TPCL Movements at 2264 psia and 210 °F (Trial 2) ..... 69

x
Figure 20: DDDC Contact Angles and TPCL Movements at 2264 psia and 210 °F (Trial 3) ..... 70
Figure 21: DDDC Contact Angles and TPCL Movements at Ambient Conditions (Trial 2) ....... 70
Figure 22: DDDC Contact Angles and TPCL Movements at Ambient Conditions (Trial 3) ....... 71
Figure 23: Images of Injecting CH4 into Condensate at Different Pressures and 210 °F ............. 76
Figure 24: Photographic Depiction of Condensate Drop Dynamic Behavior during the Injection
of 500 ppm Anionic Surfactant (SD= Small Drop) ............................................................... 80
Figure 25: Variations of Condensate Drop Dimensions with Time on Lower Substrate during 500
ppm Anionic Surfactant Injection .......................................................................................... 82
Figure 26: Variations of Dynamic Contact Angles with Time on Lower Substrate during 500
ppm Anionic Surfactant Injection .......................................................................................... 82
Figure 27: Variations of Dynamic Contact Angles with Time during 500 ppm Anionic Surfactant
Injection (at Time Steps: 646-698 s) ..................................................................................... 82
Figure 28: Photographic Depiction of Condensate Drop Dynamic Behavior during 1500 ppm
Anionic Surfactant Injection .................................................................................................. 86
Figure 29: Variations of Condensate Drop Dimensions vs. Time on Lower Substrate during 1500
ppm Anionic Surfactant Injection .......................................................................................... 87
Figure 30: Variations of Dynamic Contact Angles with Time on Lower Substrate during 1500
ppm Anionic Surfactant Injection .......................................................................................... 87
Figure 31: Photographic Depiction of Condensate Drop Dynamic Behavior during 500 ppm
Nonionic Surfactant Injection ................................................................................................ 89
Figure 32: Variations of Condensate Drop Dimensions with Time on Lower Substrate during 500
ppm Nonionic Surfactant Injection ........................................................................................ 91
Figure 33: Variation of Dynamic Contact Angle with Time on Lower Substrate during 500 ppm
Nonionic Surfactant Injection ................................................................................................ 91
Figure 34: Photographic Depiction of Condensate Drop Dynamic Behavior during 3000 ppm
Nonionic Surfactant Injection ................................................................................................ 92
Figure 35: Variations of Condensate Drop Dimensions with Time on Lower Substrate during
3000 ppm Nonionic Surfactant Injection ............................................................................... 93
Figure 36: Variation of Dynamic Contact Angle with Time for Condensate Drop on Lower
Substrate during 3000 ppm Nonionic surfactant Injection .................................................... 93
xi
Figure 37: Effect of Anionic Surfactant and Nonionic Surfactant on Advancing Contact Angle
and Interfacial Tension at Ambient Conditions ..................................................................... 95
Figure 38: Photographic Depiction of Condensate Drop Dynamic Behavior during the 1500 ppm
Anionic Surfactant Injection at 2264 psia and 210 °F ........................................................... 96
Figure 39: Variations of Condensate Drop Dimensions with Time on Lower Substrate during
1500 ppm Anionic Surfactant Injection at 2264 psia and 210 °F .......................................... 97
Figure 40: Variation of Advancing Contact Angle with Time for Condensate Drop on Lower
Substrate during 1500 ppm Anionic Surfactant Injection at 2264 psia and 210 °F .............. 97
Figure 41: Schematic of Surfactant Orientation Mechanism on Lower Substrate Surface ........ 100
Figure 42: Photographic Depiction of Condensate Drop Dynamic Behavior during the 500 ppm
Anionic Surfactant Injection at 2264 psia and 210 °F ......................................................... 101
Figure 43: Variations of Condensate Drop Dimensions with Time on Lower Substrate during the
500 ppm Anionic Surfactant Injection at 2264 psia and 210 °F .......................................... 102
Figure 44: Variation of Advancing Contact Angle with Time for Condensate Drop on Lower
Substrate during 500 ppm Anionic surfactant Injection at 2264 psia and 210 °F ............... 102
Figure 45: Photographic Depiction of Condensate Drop Dynamic Behavior during the 3000 ppm
Anionic Surfactant Injection at 2264 psia and 210 °F ......................................................... 104
Figure 46: Variations of Condensate Drop Dimensions with Time on Lower Substrate during the
3000 ppm Anionic Surfactant Injection at 2264 psia and 210 °F ........................................ 104
Figure 47: Variation of Advancing Contact Angle with Time for Condensate Drop on Lower
Substrate during 3000 ppm Anionic surfactant Injection at 2264 psia and 210 °F ............. 104
Figure 48: Effect of Anionic Surfactant on Interfacial Tension, Spreading Coefficient and
Advancing Contact Angle at Reservoir Conditions of 2264 psia and 210 °F ..................... 106
Figure 49: Effect of Anionic Surfactant on Advancing Contact Angle at Ambient and Reservoir
Conditions (2264 psia and 210 °F) ...................................................................................... 106
Figure 50: Dynamic Behavior of Condensate Drop on Lower Surface A after 1500 ppm Anionic
Surfactant Injection at 2264 psia and 210 °F ....................................................................... 108
Figure 51: Dynamic Behavior of Condensate drop on Lower Surface B after Surfactant Injection
at Ambient Conditions ......................................................................................................... 109
Figure 52: Schematic of Surfactant Orientation Mechanism on Lower Substrate Surface A .... 110
Figure 53: Schematic of Surfactant Orientation Mechanism on Lower Substrate Surface B .... 111
xii
Figure 54: Variation of Bond number with Time for Condensate Drop on Lower Substrate during
the 500 ppm Anionic Surfactant Injection at Ambient Conditions (right: at time steps 644-
656 s) ................................................................................................................................... 113
Figure 55: Variation of Bond number with Time for Condensate Drop on Lower Substrate during
the 1500 ppm Anionic Surfactant Injection at Ambient Conditions ................................... 114
Figure 56: Variation of Bond number with Time for Condensate Drop on Lower Substrate during
the 1500 ppm Anionic Surfactant Injection at 2264 psia and 210 °F .................................. 114
Figure 57: Variation of Bond Number with Time for Condensate Drop on Lower Substrate
during the 500 ppm Nonionic Surfactant Injection at Ambient Conditions ........................ 115
Figure 58: Variation of Bond Number with Time for Condensate Drop on Lower Substrate
during the 3000 ppm Nonionic Surfactant Injection at Ambient Conditions ...................... 115
Figure 59: History Match of Condensate Recovery for Base Case (0ppm, No Surfactant) ....... 118
Figure 60: History Match of Pressure Drop for Base Case (0ppm, No Surfactant) ................... 118
Figure 61: Oil-Water Relative Permeabilities for Base Case (0 ppm, No Surfactant) Obtained
from a Coreflood Simulator ................................................................................................. 119
Figure 62: Effect of Temperature on Relative Permeability ....................................................... 123
Figure 63: Effect of Temperature on Relative Permeability Ratios ........................................... 123
Figure 64: Effect of Temperature on Condensate Recovery ...................................................... 124
Figure 65: Effect of Anionic Surfactant Concentration on Recovery and Gas Relative
Permeability ......................................................................................................................... 126
Figure 66: Effect of Anionic Surfactant Concentration on Condensate Recovery ..................... 127
Figure 67: Effect of Anionic Surfactant Concentration on Relative Permeability Ratios .......... 128
Figure 68: Effect of Anionic Surfactant Concentration on Fractional Water Flow .................... 128
Figure 69: Interfacial Tension against pH in Condensate- Multi-Component Brine Systems ... 136
Figure 70: Interfacial Tension against pH in Condensate-Single-Salt Brine Systems ............... 136
Figure 71: Dynamic Contact Angle against pH in Condensate- Multi-Component Brines ....... 139
Figure 72: Dynamic Contact Angle against pH in Condensate-Single-Salt Brines .................... 139

xiii
Figure 73: Sessile Drop Contact Angle with Time for Condensate-Quartz-300 ppm Multi-
Component Brine ................................................................................................................. 140
Figure 74: Sessile Drop Contact Angle with Time for Condensate-93,300 ppm MgCl2 Brine-
Quartz .................................................................................................................................. 140
Figure 75: Variation of Sessile Drop Shape due to Spreading on the Solid Surface .................. 141
Figure 76: Adhesion Number against Receding Contact Angle in Multi-Component Brine
Systems ................................................................................................................................ 144
Figure 77: Adhesion Number against Receding Contact Angle in Single-Salt Brine Systems .. 144
Figure 78: Receding Contact Angle versus Condensate-Water Interfacial Tension in Multi-
Component Brine Systems .................................................................................................. 145
xiv
ABSTRACT
The well-known condensate blockage problem causes severe impairment of gas
productivity as the flowing bottom-hole pressure falls below the dew point in gas-condensate
reservoirs. Hence, this study attempts to investigate the concept of modifying the spreading
coefficient and wettability using low-cost surfactants in the near wellbore region, to prevent the
gas flow problems associated with condensate buildup. This study also examines the effect of
brine salinity and composition on wettability, spreading and adhesion in condensate buildup
regions, to evaluate the ability of brine salinity/composition for enhanced gas productivity in gas-
condensate reservoirs.
In this study, experiments were performed at both ambient and reservoir conditions using
reservoir fluids. Water-advancing and receding contact angles were measured using the Dual-
Drop-Dual-Crystal (DDDC) technique and sessile drop method to characterize reservoir
wettability and spreading behavior. Interfacial tension was measured using pendent drop shape
analysis (DSA) technique and capillary rise techniques. Anionic and nonionic surfactants and
nine multi-component brines varying in salinity as well as ten single-salt brines with two
different salinities were tested. Oil-water relative permeabilities were generated by history
matching condensate recovery and pressure drop data obtained from the coreflood experiments
using Berea sandstone core.
Wettability was altered from strongly oil-wet to intermediate-wet by the anionic
surfactant. The declining trend of spreading coefficient resulted from the presence of surfactants
indicating the possibility of enhanced gas productivity and condensate recovery by surfactants.
Coreflood results substantiated the wettability alteration to intermediate-wet induced by the
anionic surfactant and 82% improvement in gas relative permeability was obtained at ambient
xv
conditions. The variation of brine salinity and composition had little effect on wettability and
interfacial tension in condensate-brine system. However, large water-receding angles were
observed due to the condensate drop spreading on the quartz surface through changing brine
salinity and composition. This spreading behavior was more pronounced in high salinity brine
systems. This study thus demonstrates that surfactant-induced wettability alteration and
spreading coefficient reduction have the benefits for improving gas and condensate production
by mitigating the condensate blockage problem. This study also indicates the potential of
controlling the spreading behavior of condensate using low salinity brines.

1
1. INTRODUCTION
1.1 Problem Statement
Gas condensate reservoirs constitute a significant portion of oil reserves in the United
States, since they have been recognized as a special type different from the conventional crude
oil reservoirs in the 1930’s. With the development of drilling techniques, the applicable drilling
depth keeps increasing and more condensate reservoirs have been found and explored. The gas
condensates are composed mainly of lighter hydrocarbons thus considered more commercially
valuable than crude oil as the result of added revenue from the corresponding more refined
byproducts. Therefore, the importance of gas condensate reservoirs has been recognized widely,
and more attention is being paid in the oil and gas industry to enhance gas and condensate
recovery from gas condensate reservoirs for increased profits.
Gas condensates or retrograde gases are one of five types of reservoir fluids. The gas
condensate reservoirs initially contain single gas phase at reservoir conditions. However, these
reservoirs exhibit unexpected and complex thermodynamic behaviors as the reservoir pressure
drops. The phase diagram of a typical retrograde gas is shown in Figure 1. It can be seen that the
initial pressure of the gas condensate reservoir is above the dew point pressure (point 1), and
only a single gas phase exists in the reservoir. As the pressure goes below the dew point pressure
(point 2) due to isothermal depletion, liquid condensate from the gas is formed in the reservoir.
More condensate accumulates around the well bore due to the steep decline in fluid pressure near
the well bore region (point 3) as the operation continues. This unusual phenomenon of increasing
condensation with decreasing pressure is called “retrograde condensation” which results in
serious impediments to the flow of gas to the producing well. It has been eventually realized in
the industry as “condensate banking” or “condensate blockage”.

2
Figure 1: Phase Diagram of a Typical Retrograde Gas Reservoir (McCain, Jr. 1990)
The condensate banking has a detrimental effect on gas productivity and thus leads to a
significant loss of economic revenue. The Arun condensate field in Indonesia, for example,
displayed a 50% reduction in gas productivity with only about 1% of condensate buildup in the
wellbore regions (Afidick et al., 1994). The conventional methods, such as gas cycling and
methanol treatment, have been proposed to remedy this condensate banking problem after it
occurs. However, most of them are only temporary solutions with limit success because the
condensate banking forms again as production continue.
To date, waterflooding, a process of injecting water into oil reservoirs, is the most widely
used method of improved oil recovery. This process is accomplished either by maintaining
reservoir pressure at a high level or by sweeping the oil through the reservoir from an injection
well to a producing well. In the early years of waterflooding, it is mainly applied to many mature
onshore fields. With more development of offshore fields in the world, it has come to the
forefront and has been utilized to the offshore fields.
3
Water quality has been identified as a key element to be monitored based on the fact that
poor water quality can result in waterflooding failure and thus cause the economic loss. The ideal
water for waterflooding should be free from suspended solid particles and bacteria, compatible
with formation water and chemically interactive with compounds and elements present in the
formation. Aquifer water and seawater are the two main water sources used for waterflooding.
All of above characteristics of injection water have been concerned and developed in
waterflooding design for a long time in the petroleum industry. However, the composition of the
salt in the injection water has not been considered as an important factor on waterflooding
displacement efficiency as well as the possibility of increased oil recovery through manipulation
of the injection water composition. It has been observed that the composition of the brine can
have a significant effect on wettability and oil recovery. It has been also believed that brine
salinity, especially low brine salinity, can improve recovery of crude oil. Although various
suggestions of the mechanism behind the low salinity process have been proposed based on
increasing amounts of laboratory experiment results, the exact recovery mechanisms have not
been fully investigated and the mechanisms are still uncertain. In addition, there is very little
known about brine salinity/composition effects in gas-condensate reservoirs.
Therefore, this study aims to experimentally investigate the concept of modifying the
spreading coefficient, wettability and their influence on flow behavior using inexpensive
surfactants in the near wellbore region, to mitigate the condensate banking effect. Surfactant–
induced wettability alteration in condensate buildup regions can provide a permanent solution in
a cost-effective manner and improve gas productivity from gas condensate reservoirs. Spreading
coefficient determines the distribution of gas, water and oil in porous media and thus affects their
relative flow behavior. Using surfactants to alter the three phase interfacial tensions between gas-
4
water, gas-oil and oil-water results in the spreading coefficient modification and thus improve
the gas flow through the porous media. This is a new method that has not been explored to
prevent condensate accumulation for enhanced gas productivity in gas condensate reservoirs.
This study also focuses on the investigation of brine salinity and composition on wettability,
spreading and adhesion in condensate buildup regions, and thus evaluates their effects on
enhanced condensate recovery and gas productivity improvement in gas-condensate reservoirs.
Unlike the conventional approach-coreflooding used in previous literature, the experimental
study will be performed by using our unique advanced techniques to measure the fluid-fluid and
rock-fluids interactions. This will provide a better understanding of mechanisms of condensate
blockage and remediation and brine salinity effects.
1.2 Objectives
The objectives of this study are:
• To conduct the interfacial tension measurements between condensate-water, gas-water and
gas-condensate to determine the fluid spreading coefficients at both ambient conditions and
reservoir conditions.
• To perform the interfacial tension measurements between condensate-water, gas-water and
gas-condensate in the presence of surfactants (both anionic and nonionic types) to determine
the modified spreading coefficients at reservoir conditions as well as ambient conditions.
• To determine the wettability of a gas condensate reservoir by measuring dynamic contact
angles in rock-water-condensate system using Dual-Drop-Dual-Crystal (DDDC) technique at
both ambient and reservoir conditions.
• To experimentally investigate the wettability altering capability of anionic and nonionic
surfactants by measuring dynamic contact angles at ambient as well as reservoir conditions.

5
• To develop the Bond Number to interpret the dynamic condensate drop behavior on rock
surface.
• To conduct coreflood experiments to examine the effect of surfactants on wettability and
enhanced gas productivity and condensate recovery.
• To correlate the results of surfactant–induced wettability alterations derived from contact
angles with coreflood multiphase flow characteristics.
• To measure condensate-brine interfacial tensions to test the influence of brine salinity and
composition on oil-water IFT.
• To study the effect of brine salinity and composition on spreading, adhesion and wettability in
rock–brine–condensate system by measuring contact angles.
• To propose the mechanism for understanding the effect of surfactant and brine salinity and
composition on spreading and wettability.
1.3 Methodology
In this study, the condensate from an actual sandstone gas condensate reservoir that was
supplied by a major oil company, synthetic brine matching the formation brine in composition
and methane were chosen to conduct interfacial tension measurements using pendent drop
method by drop shape analysis (DSA) technique and capillary rise technique at both ambient and
reservoir conditions. Two types of surfactants, anionic and nonionic in various concentrations,
were selected to test at ambient conditions. The anionic surfactant has proved more effective in
reducing IFT and altering wettability in this condensate system in ambient-condition experiments,
and thus was used in both reservoir-condition (2264 psia and 210 °F) and coreflood experiments.
Nine multi-component synthetic brines varying in salinity (from de-ionized water to
125,000 ppm) and ten single salt (Na+, Ca
2+, Al
3+, etc.) synthetic brines were studied to

6
investigate the effect of brine salinity and composition on spreading, wettability and adhesion in
this condensate-brine system at ambient conditions. Interfacial tensions between condensate and
brines, water-advancing and receding contacts, and the pH of brine were measured in all nineteen
cases.
Dual-Drop-Dual-Crystal (DDDC) technique was used to measure water-advancing
contact angles to infer wettability and the alterations induced by surfactants and brine salinity
and composition. Sessile drop method was used to measure water-receding contact angles to
characterize spreading behavior in the condensate-brine system. Bond Number and Adhesion
Number were used to explain the dynamic behavior of the condensate drop on the rock surface
during the surfactant injection and understand the influence of the brine salinity/composition on
adhesion phenomenon in condensate-brine-rock system, respectively.
Berea sandstone core, condensate, synthetic brine and nitrogen were used to perform
coreflood experiments to examine the surfactant effect on gas relative permeability and
condensate recovery. A coreflood simulator was used to generate oil-water relative
permeabilities by history matching condensate recovery and pressure drop data obtained from the
coreflood experiments. Craig’s rules of thumb (Craig, 1971) were then applied to the relative
permeability curves provided by the simulator to interpret wettability and surfactant-induced
wettability alterations. The correlation and comparison of wettability and surfactant-induced
wettability alterations derived from contact angle measurement with coreflood results were then
made.

7
2. LITERATURE REVIEW
2.1 Productivity Loss in Gas Condensate Reservoirs
Gas condensate reservoirs suffer a rapid decline in well productivity as the flowing
bottom-hole pressure falls below the dew point in reservoirs during depletion. The formation of a
condensate phase occurs near the wellbore region, and the increasing condensate develops the
condensate banking or condensate blockage to impair the flow of gas to the well and thus
decrease gas productivity. Many researchers including Fussell (1973), Hinchman and Barree
(1985), Aziz (1985), Barnum et al. (1995) and Clark et al. (1985) have investigated the impact of
condensate blocking on productivity. Based on their studies, the productivity reduction caused by
this condensate buildup is pronounced. Several field examples of severe well productivity loss
owning to condensate banking are also well documented in the literature (Boom et al., 1996;
Afidick et al., 1994; Engineering, 1985; Duggan, 1972; Abel et al., 1970; Allen and Roe, 1950).
A well-known industrial case of the condensate banking effects is the Arun field in Indonesia,
one of the world’s giant retrograde gas reservoirs (Afidick et al., 1994). A maximum liquid
dropout of about 1.1% of this lean gas condensate reservoir caused the well productivity decline
by about 50% as the pressure dropped below the dew point pressure. And the worst example at
Cal Canal field in California showed that condensation even completely killed the gas well
(Engineering, 1985).
The loss of well productivity for gas condensate reservoirs can be attributed to fluid
properties, formation characteristics and the reduction in relative permeabilities in the vicinity of
the wellbore. Relative permeability effects on the loss of well productivity have been recognized
and studied over a wide range of conditions with synthetic fluids (Bang et al., 2006; Kumar,
2006; Ayyalasomayajula et al., 2003; Henderson et al. 2000) as well as with reservoir fluids

8
(Nagarajan et al., 2004; Mott et al., 2000). Other parameters such as fluid composition (Wheaton
and Zhang, 2000; Shi and Horne, 2008), capillary number and non-Darcy flow effects
(Bozorgzadeh and Gringarten, 2006; Kumar et al., 2006; Mohan et al., 2009) have also been
investigated to evaluate the impact of condensate buildup on gas well productivity.
Nagarajan et al. (2004) experimentally measured gas-condensate relative permeability
using three model fluids and two live reservoir fluids. The reservoir fluid results were
significantly different from the model fluid results. The gas and condensate relative permeability
using reservoir live fluids were found to be lower than those measured with model fluids,
indicating that possibly higher condensate saturation build-up was obtained in live fluid tests.
Hence, they believe that the live fluid data are more representative of the reservoir condition
flow and should be used in all reservoir flow calculations.
Shi and Horne (2008) developed a methodology to enhance the productivity of gas or
condensate from gas-condensate reservoirs by controlling the liquid composition which drops
out close to the well. They performed coreflood experiments as well as compositional numerical
simulations. Their study shows that composition and condensate saturation vary significantly as
a function of producing sequence.
Mohan et al. (2009) studied the impact of non-Darcy flow and condensate accumulation
on the productivity of a hydraulically fracture gas-condensate well. Two-level local-grid
refinement was used to simulate very small gridblocks which must correspond to the actual
fracture width to accurately model non-Darcy flow. Their simulation results show that
productivity improvement is overestimated by a factor on the order of two to three if non-Darcy
flow is neglected.

9
2.2 Remedial Methods for Gas Productivity
Several remedial methods have been proposed to remove the drop out liquid and recover
gas productivity decline from condensate banking. Generally, these methods can be grouped into
either decreasing the pressure drawdown and maintaining pressure above the dew point pressure
or changing the phase behavior of the gas condensate fluid.
Gas cycling or the injection of dry gases (N2, CO2, or CH4) to the gas condensate
reservoirs is one of methods, which has been used to vaporize condensate and increase the dew
point pressure and then maintain the reservoir pressure above the dew point pressure.
Luo et al. (2001) conducted coreflooding experiments to investigate the effect of
revaporization on the condensate recovery using the dry gas. They found that the dry gas can
vaporize both the intermediate and heavier (C20+) hydrocarbons. Also the cumulative
condensate recovery was improved by the dry gas injection.
Jamaluddin et al. (2001) experimentally investigated how injection of propane affected
the remediation of the liquid buildup in gas condensate reservoirs. Based on their study, both the
dew point pressure and the volume of condensed liquid were reduced and propane was proved to
vaporize condensate more efficiently than carbon dioxide.
Eikeland and Hansen (2007) simulated the reinjection process of dry gas into the Sleipner
Ty gas condensate field. From their simulation results, high condensate recovery was obtained
due to the dry gas injection. Also, the results showed that although the reservoir pressure has
been below the dew point pressure through all times, the re-injected gas has reduced the
condensate drop out in the reservoir and the reservoir pressure has been increased for the first
two years since the start of this reinjection process.
10
Al-Abri et al. (2009) performed an experimental investigation of supercritical CO2
injection (SCCO2), methane injection and the injection of CO2 and methane mixture on enhanced
natural gas and condensate recovery. Their work demonstrates that compare to the injection of
pure methane or methane-CO2 mixtures, supercritical CO2 injection provided favorable
condensate sweep efficiency and a delayed breakthrough due to less capillary instabilities and
better mobility ratios. The relative permeability curves to condensate also improved by injecting
SCCO2 resulting from a decrease in condensate-to-gas viscosity ratio.
Another method is hydraulic fracturing. This stimulating wells method has possibility to
reduce the pressure drawdown by increasing the flowing area through inducing a fracture,
resulting in less liquid condensate drop out near the well bore, thus delaying the condensate bank
formation and mitigating its effect (Settari et al., 1996; Mohan, 2005; Baig et al., 2005; Othman
et al., 2008).
Baig et al. (2005) studied the productivity and near wellbore behaviors of a fractured and
a non-fractured well in a low permeability gas condensate reservoir by using the reservoir
simulation model. The results demonstrated that the fractured well has a higher productivity than
the non-fractured well and the gas productivity could also be improved as the length of the
fracture increased up to a practical fracture half-length limit.
Othman et al. (2008) reported the production performance of the Angsi K-sand
hydraulically fractured gas condensate reservoir which is the first tight gas reservoir
development in Malaysia. The K-sand dew point is only about 100 psia below the initial pressure
and hence condensate drop out near the wellbore is expected to begin almost immediately after
the start of production. Also, this reservoir has low permeability (<0.01-3mD). The hydraulic
fracture stimulation performed in the well resulted in a fourfold increase in gas production rate,

11
indicating that the hydraulic fracturing improved the well productivity and mitigate the
detrimental effects of condensate dropout.
The solvent injection such as methanol has also been developed to be a remediation
method to enhance the gas productivity. Du et al. (2000) conducted coreflood experiments in low
permeability limestone cores to evaluate the use of methanol to restore the gas relative
permeability. Their results showed that the end-point gas relative permeability was increased by
a factor of 1.2 to 2.5 depending on the initial water saturation. A possible explanation for the
increased gas permeability is the miscible displacement of the condensate and water phases by
the methanol.
Al-Anazi et al. (2002) also experimentally examined the effect of methanol on
condensate blockage in both low permeability limestone cores and high permeability sandstone
cores. They found that methanol was effective in removing both condensate and water and
restored the gas productivity in both low and high permeability cores. Later, they (2005)
conducted a field test to investigate the effectiveness of methanol as a solvent for mitigating
condensate bank on the basis of laboratory results and a single well numerical simulation. The
methanol treatment was applied to a gas condensate well in the Hatter’s Pond field and the
results of their study proved that both gas and condensate production rates increased by a factor
of two over the first 4 months and by 50% thereafter.
Although the above-cited literatures showed that their remedial methods can help
mitigate the condensate bank and increase the gas productivity, all the methods have limited
application and are only temporary solutions to the condensate blockage as the condensate bank
forms again with time. During the dry gas injection (Luo et al., 2001), the mass transfer occurred
between the dry gas injected and the original gas condensate leading to a rise in dew point

12
pressure and earlier retrograde condensation and thus reducing the gas condensate recovery.
Hydraulically fractured wells (Othman et al., 2008) were still susceptible to the effect of
condensate drop out. The wells also suffered from proppant flow back problem which has
detrimental influence to the facilities and revenue loss due to increased maintenance and reduced
productivity. Hence hydraulic fracturing has not always been economically feasible or cost-
effective. The solvent method depends on the phase behavior of the mixture of the solvent and
the condensate. The removal of the condensate bank is temporary due to the re-formation of the
condensate bank. Thus, solvent treatments need to be repeated at time intervals after production
is restarted.
2.3 Chemical Wettability Alteration
The newly reported method for tackling the condensate blocking problem focused on
wettability alteration by using chemicals such as a polymer or surfactant. This approach provides
a long term strategy for restoration of well productivity by altering the wettability of rocks in the
near wellbore region of gas condensate reservoirs from strongly water-wet or oil-wet to
intermediate wet.
Li and Firoozabadi (2000) were the first to experimentally examine the wettability
alteration of the rock surface at room temperature by using polymers. They found that the
wettability of the rock changed from strongly liquid-wet to intermediate gas-wet resulting in the
increase the phase relative permeability and oil recovery. Their work was extended by Tang and
Firoozabadi (2002) to test the effect of the polymer chemicals on wettability alteration at
temperatures up to 90°C. The results showed that the liquid phase mobility was increased after
chemical treatment. Later, Fahes and Firoozabadi (2007) performed wettability alteration at a
higher temperature of 140°C and measured the effect of wettability alteration on increased liquid

13
mobility. Similar results obtained from their studies demonstrated that wettability alteration after
chemicals treatment led to increasing liquid mobility and thus improved gas productivity.
However, the drawbacks of all these studies are that they did experiment at low pressure and
none of them used gas condensate fluids. They simply employed normal decane and normal
tetradecane as the oil phase, distilled water or monovalent NaCl brine as the aqueous phase and
air as the gas phase in their experiments, and interpreted wettability alteration by measuring
receding contact angles at ambient conditions or from changes in relative permeability
characteristics. The experimental findings of Ayirala and Rao (2004) revealed that n-decane is
insensitive to wettability effect by using chemicals. Furthermore, the relative permeabilities are
“the composite effect of pore geometry, wettability, surface tension, fluid distribution and
saturation history” (Craig, 1971). Anderson (1987) suggested that since factors other than
wettability can affect relative permeability curves at the same time, it better to measure
wettability independently rather than to rely on Craig’s rules thumb to characterize wettability.
Therefore, the wettability interpretations from relative permeabilities may not be by
representative of true wettability alterations reported in their studies.
Kumar et al. (2006a, 2006b) experimentally investigated the improvement in gas and
condensate relative permeability by using fluorinated polymeric surfactants in methanol-water
mixtures at reservoir conditions with gas-condensate fluids. From their studies, steady state
relative permeability for gas and condensate was increased by a factor of 2 or 3 after surfactant
solution treatment over a temperature range of 145 to 275 ºF. However, they did not explain how
the chemicals affect the wettability of rocks.
Noh and Firoozabadi (2008) investigated the effect of wettability alteration on high-
velocity-flow coefficient in two phase gas/liquid flow in gas reservoirs. Steady-state two-phase

14
relative permeability tests were carried out in the chemical treated cores to determine the high-
velocity coefficients. Their results show that the high-velocity coefficient for gas/water flow
decreased significantly after the chemical treatment near the wellbore region; however, the
reduction in high-velocity coefficient for gas/oil flow was less pronounced. They believed that
the large reduction in high-velocity coefficient can result in significant improvement in well
deliverability.
Bang et al. (2009) used synthetic fluids to do coreflood experiments and treated both
Berea and reservoir sandstone cores by using a nonionic polymeric fluorinated surfactant in a
mixture of organic solvents at reservoir conditions. The measured wettability index indicated that
the wettability of the core was changed to neutral wet by the chemical treatment. Gas and
condensate relative permeability were increased by a factor of two. They (2010) also conducted
coreflood experiments to measure the effect of liquid (both water and condensate) blocking on
gas relative permeability. The alteration of wettability after the chemical treatment was evaluated
by measuring the USBM wettability index of treated cores. The results showed that the chemical
treatment altered the wettability of water-wet sandstone to neutral-wet or mixed-wet resulting in
increasing the gas relative permeability. Improvements in the gas relative permeability were a
factor of approximately two. In their work, they determined wettability alteration based on
imbibitions and drainage capillary curves or USBM wettability index but did not measure
contact angles.
2.4 Spreading Coefficient
Spreading coefficient is usually used to describe fluid-fluid interactions. It signifies the
imbalance of the fluid interfacial tensions acting along a single line which is the contact line

15
between fluid phases (Grattoni et al., 1997). Spreading coefficient can be either positive or
negative. For the water-oil-gas system, the oil spreading coefficient So can be defined as below:
(1)
where σwg is the water-gas surface tension, σow is the water-oil interfacial tension, and σog is the
oil-gas interfacial tension. The defining equation of the oil spreading coefficient is also displayed
in Figure 2.
Spreading coefficient determines the nature of distribution of the water, oil and gas
within reservoir rock pores, thus plays a key role in gas-water-oil relative flow behaviors,
recovery kinetics and the residual oil recovery. However, this role has to be considered in
association with the porous medium wettability. Hence, two wettability states of reservoir rocks,
water-wet and oil-wet, are presented here to elucidate how the oil spreading coefficient works in
the pore space. Figure 3 shows the distribution of water, oil and gas in the reservoir rock for two
wetting states. It can be seen from Figure 3 that on the water-wet rock surface if the spreading
coefficient is positive, it indicates that oil tends to form a spreading film between gas and water;
while the negative spreading coefficient results in the oil lenses floating on the gas-water
interface. On the oil-wet rock surface, a positive spreading coefficient suggests that oil tends to
isolate gas and water by spreading between them. And the negative spreading coefficient means
that both gas and water phases flow as discreet globules entrained in the oil phase. Similar fluids
distribution map has been presented by Vizika and Lombard (1996), and Grattoni et al (1997).
This behavior strongly affects flow properties in porous media and therefore has a strong
influence on the oil recovery process. Oren and Pinczewski (1992, 1994) presented their work
how the spreading coefficient affected oil-water flow dynamics in porous rocks with different
wettability states. They performed immiscible tertiary gas flooding in 2D glass micromodels

16
under strongly oil-wet and water-wet conditions to investigate these effects and the results are
summarized in Table 1. It can be seen from Table 1 that in a water-wet system oil recovery for
the positive spreading coefficient was significantly higher than that for the negative spreading
system; while the oil-wet system showed an opposite trend. In their study, they used air, refined
oil and distilled water as the fluids instead of the real reservoir fluids to examine the effect of
spreading coefficient.
Figure 2: Schematic Depiction of the Spreading Coefficient
Figure 3: Oil-Water-Gas Distributions in O/G/W/R Systems
G
W
R
R
W G
G W Oil Wet
Water Wet
Wettability
Positive So
Negative So
G
O
W
R
W
O
R
O
R
R
O
17
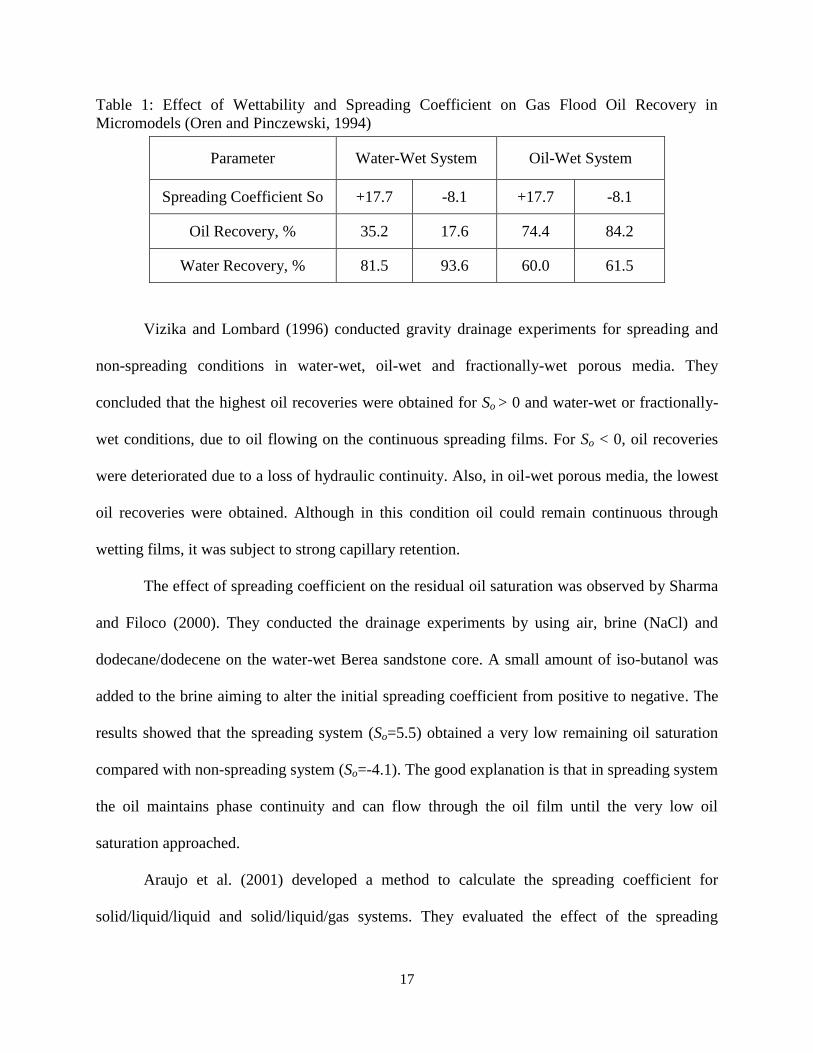
Table 1: Effect of Wettability and Spreading Coefficient on Gas Flood Oil Recovery in
Micromodels (Oren and Pinczewski, 1994)
Parameter Water-Wet System Oil-Wet System
Spreading Coefficient So +17.7 -8.1 +17.7 -8.1
Oil Recovery, % 35.2 17.6 74.4 84.2
Water Recovery, % 81.5 93.6 60.0 61.5
Vizika and Lombard (1996) conducted gravity drainage experiments for spreading and
non-spreading conditions in water-wet, oil-wet and fractionally-wet porous media. They
concluded that the highest oil recoveries were obtained for So > 0 and water-wet or fractionally-
wet conditions, due to oil flowing on the continuous spreading films. For So < 0, oil recoveries
were deteriorated due to a loss of hydraulic continuity. Also, in oil-wet porous media, the lowest
oil recoveries were obtained. Although in this condition oil could remain continuous through
wetting films, it was subject to strong capillary retention.
The effect of spreading coefficient on the residual oil saturation was observed by Sharma
and Filoco (2000). They conducted the drainage experiments by using air, brine (NaCl) and
dodecane/dodecene on the water-wet Berea sandstone core. A small amount of iso-butanol was
added to the brine aiming to alter the initial spreading coefficient from positive to negative. The
results showed that the spreading system (So=5.5) obtained a very low remaining oil saturation
compared with non-spreading system (So=-4.1). The good explanation is that in spreading system
the oil maintains phase continuity and can flow through the oil film until the very low oil
saturation approached.
Araujo et al. (2001) developed a method to calculate the spreading coefficient for
solid/liquid/liquid and solid/liquid/gas systems. They evaluated the effect of the spreading

18
coefficient on two-phase relative permeability, and found that in water wet condition, oil
recovery and relative permeability are higher for the positive spreading coefficient system than
those for the negative system.
Maeda and Okatsu (2008) experimentally investigated the pore scale thin oil film
drainage mechanism responsible for the mobilization of waterflood residual oil by immiscible
gas floods in the strongly water-wet oil reservoir. Two methods, micro pore film flow
experiment and 2 dimensional 3 phase micro flow simulation based on Lattice Boltzmann
Method (LBM) were used in their study. The results showed that oil recoveries for high positive
spreading coefficient systems were much higher than low positive spreading coefficient systems
in high pressure and high temperature conditions. The reason for this phenomenon is that in the
case of the high positive spreading coefficient value, the thin oil film was formed between gas
and water resulting in oil and water spreading and flowing easily in the reservoir and thus
enhancing the waterflood residual oil recovery by immiscible gas flood.
2.5 Surfactant
Surfactant is “an abbreviation for surface active agent and literally means active at
surface. The surface can be between solid and liquid, between air and liquid, or between a liquid
and a different immiscible liquid (Porter, 1994).” A surfactant is generally classified as anionic,
nonionic, cationic or amphoteric according to the presence of formally charged hydrophilic
groups in its head. In the surfactant molecule, there are two groups, a hydrophobic tail (water
hating) and a hydrophilic head (water liking), resulting in the adsorption of a surfactant at a
surface or interface. This surface/interface adsorption leads to pronounced physical changes,
reduces the surface/interfacial tensions and alters the wettability of a surface. Hence, surfactants

19
have been considered for application in enhanced or improved oil recovery (EOR or IOR)
process in the petroleum industry due to surfactant adsorption.
Mungan (1966) investigated the effect of interfacial tension on the displacement of a non-
wetting by a wetting liquid without changing wettability and found that decreasing IFT from 40
to 0.5 dyne/cm resulted in only 8.1% additional recovery after breakthrough. Hence, the key to
significant improvements in oil recovery by lowering oil-water interfacial tension for surfactant
processes when ignoring surfactant aided wettability alteration is to achieve ultra-low interfacial
tension e.g., < 10-2
mN/m (Klins, 1984; Schramm, 2000; Hirasaki, et al., 2008). Klins (1984)
studied the effect of capillary number on residual oil saturation and reported that four to six
orders of magnitude reduction in capillary number is required for significant improvements in oil
recovery. It has also been found that oil-water interfacial tension had to be reduced from 20-
30mN/m to values in the range of 0.001 to 0.01mN/m to obtain low values (less than 0.05) of
residual oil saturation (Hirasaki, et al., 2008).
Wettability alteration of porous reservoir rock with surfactant plays the next most
important role in improved oil recovery. Hirasaki and Zhang (2004) conducted spontaneous
imbibitions to evaluate anionic surfactant solutions for enhanced oil recovery in fractured oil-wet
carbonate formation. They reported that the wettability of the calcite plate was altered to
intermediate-wet or water-wet induced by alkaline anionic surfactant solution and thus oil
recovery of spontaneous imbibition was increased.
Rao et al. (2006) conducted coreflood experiments using low-cost surfactants to
investigate the impact of surfactants on wettability and relative permeability. From their study,
wettability alteration to intermediate or mixed wettability in the presence of nonionic and anionic

20
surfactants could significantly enhance oil recovery. Especially in surfactant-induced mixed
wettability cases, more than 90 percent oil recoveries were obtained.
Gupta and Mohanty (2010) experimentally studied the effect of temperature on surfactant
treatment in fractured carbonate formation. They concluded that even at high temperature (90°C)
surfactants could change the wettability from oil-wet to intermediate/water-wet condition and
high oil recovery (approximately 60% OOIP in 30 days) from surfactant solution imbibition was
obtained at very low surfactant concentrations (<0.1wt%).
A few of factors affect surfactant-induced wettability alteration. These include surfactant
structure, surfactant concentration, kinetics, pore surface composition, surfactant stability, co-
surfactants, electrolytes and PH, temperature, pore structure and surface roughness, and reservoir
structure (Schramm, 2000).
The primary mechanism of surfactant-induced wettability alteration has been studied and
well explained in the literature (Schramm, 2000; Somasundaran and Zhang, 2006). The
adsorption of surfactants on solid surface and the orientation surfactant assumes determine the
wettability of the mineral surface. Four characteristic regions of adsorption isotherm are
illustrated in Figure 4 (a).
In region I, individual surfactant molecules adsorb on the surface due to electrostatic
interaction between the surfactant head group and the charged mineral surface corresponding to
the low surfactant concentration. Region II indicates the onset of the surfactant aggregates
(called hemi-micelles or admicelles) at the surface through the lateral interaction of hydrophobic
chains which results in a marked increase in the slope of adsorption density. In region III, the
decrease in the adsorption slope demonstrates that the surface is electrically neutralized by the
sufficient adsorbed surfactant ions. A plateau adsorption takes place in Region IV, indicating the

21
approaching to the critical micelles concentration (CMC) of the surfactant and the completion of
bilayer coverage of the surface. Above the CMC, further increase in surfactant concentration
does not change the adsorption density.
(a) (b)
Figure 4: (a) Schematic Representation of the Growth of Aggregation for Various Regions of the
Adsorption Isotherm. (b) Orientation Model for the Conformation of Surfactant at the Surfaces.
A, B, C Indicate the Successive Stages of Adsorption (Somasundaran and Zhang, 2006)
The possibility of bilayered adsorption occurred above the CMC can restore wettability
of the surface. Zhang et al. (1997) investigated the adsorption behavior of n-dodecyl-β-d-
maltoside on the hydrophilic alumina surface and observed that the hydrophobicity of alumina
surface drops further as the adsorption reaches the plateau region (IV) and the minimum
hydrophobicity at this region possibly caused by the bilayer adsorption renders the surface
hydrophilic. The schematic effect of surfactant orientation on the wettability is shown in Figure 4
(b). The bilayer adsorption (C) clearly shows that the hydrophilic groups of the surfactant orient
towards the aqueous phase, which restores the surface to hydrophilicity. Austad and Standnes

22
(2003) performed spontaneous imbibitions experiments of aqueous surfactant solution into oil-
wet carbonates and also found that the adsorbed anionic surfactants such as ethoxylated
sulfonates onto the hydrophobic chalk surface formed a double layer creating a hydrophilic
surface at the low imbibition rate.
2.6 Bond Number
Bond number is defined as the ratio of gravity forces to capillary forces. In this study,
Bond number was used to quantitatively explain the condensate drop behavior on the surface.
There are two types of forms of the Bond number, in which type 1 form Eq. (2) is only uses
interfacial tension to represent the capillary force (Catchpole and Fulford, 1966; Hirasaki and
Zhang, 2004), while type 2 Eq. (3) considers both interfacial tension and contact angles, thus
uses the product of interfacial tension and the cosine of the contact angle for capillary forces
(Babadagli, 2003).
(2)
√
(3)
where NB' and NB* are the Bond number, σ is the interfacial tension in mN/m, θ is the contact
angle in degrees, ∆ρ is the density difference in g/cc, g is the acceleration due to gravity (cm/s2),
H is the height in cm, D is the drop diameter in cm, k is the permeability in cm2 and is the
porosity.
Ayirala et al. (2006) developed the type 2 form of the Bond number by replacing the term
of √
in Eq. (3) with (h-hi)d to better discuss their experimental results of surfactant injection.
From their study, they concluded that the Bond number including the contact angle term can
better explain the rock-fluid interaction. The developed type 2 Bond number is expressed in Eq.
(4) and the dimensions are depicted in Figure 5.

23
( )
(4)
where d and h are the diameter and the height of the drop on lower crystal at a given time t, in
cm, and hi is the initial height of equilibrium drop at time t=0 in cm.
Figure 5: Schematic Description of the Equilibrium Drop between the Two Crystals
Hirasaki and Zhang (2004) concluded that an oil drop on a solid surface immersed in
brine became unstable as the Bond number became unity or greater. In other words, the Bond
number is less than unity or one indicating that the drop should be stable on the surface. Hence,
in this study, the developed Bond number NB defined in Eq. (4) was used to quantitatively
discuss the dynamic behavior of condensate drop on the lower surface during surfactant injection
at both ambient and reservoir conditions. The Bond number NB' (in Eq. (2)) was also calculated
for the purpose of comparison.
2.7 Fines Migration
Formation fines are defined as “unconfined solid particles made up of clay minerals or
nonclay species deposited over geologic time or introduced during completion or drilling
operation” (Sarkar and Sharma, 1990). Fines are always found in sandstone reservoirs. It is
believed that the released fines migrating with flowing fluid can cause permeability reduction

24
and productivity decline during coreflood experiments. The main factors responsible for fines
migration are salinity, flow rate, pH, temperature, rate of salinity change and adsorption of
organic material from oil, which were investigated by several researchers.
Mungan (1965) experimentally investigated the effect of the pH and salinity change on
fines permeability reduction in both consolidated and unconsolidated sandstone cores. They
found that salinity and the pH change caused fines migration which blocked the pore passages
and thus resulted in permeability reduction.
Clementz (1977) conducted the laboratory tests on freshly cut, consolidated Berea
sandstone cores. The cores were treated by using a colloidal dispersion of heavy ends (asphaltene
and resin) in solvent. The surface of the clay minerals present in the treated cores was then
covered with heavy ends. Their results proved that formation clays were stabilized through
adsorption of petroleum heavy ends
Gruesbeck and Collins (1982) designed laboratory testing procedures to study the effect
of fines entrainment and deposition on permeability impairment. They reported that fines
entrainment and redeposition were mechanism that cause abnormal productivity decline on the
basis of their experimental results.
Khilar and Fogler (1983) carried out a number of experiments using Berea sandstone
cores to study the water sensitivity of sandstone. Their results showed that clay particles were
released only when the salt concentration falls below a critical salt concentration leading to
decreasing the permeability. The rate of reduction in permeability was found to decrease with
decreasing flow rate and temperature.
Valdya and Fogler (1992) performed coreflood experiments on Berea sandstone cores to
examine the influence of pH and ion exchange on formation damages caused by fines migration.

25
They believed that ionic condition of low salinity and high pH appeared to be detrimental to
formation permeability, resulting in fines migration and drastic damage. Also, salinity and pH
were interrelated and therefore had to be considered simultaneously during development of
injection strategies to minimize damage.
Additional factors including the presence of residual oil saturation (ROS), fractional flow
of oil and water, polarity of oil and core wettability were studied by Sarkar and Sharma (1990).
They conducted steady-state two-phase coreflood experiments to investigate the effect of these
factors on fines migration. They concluded that both oil saturation and the wetting nature of the
core significantly affected the extent and rate of permeability impairment. Wettability results
determined from endpoint relative permeabilities demonstrated that oil-wet cores sustained
slower and less damage than water-wet cores, because polar compounds present in the crude oil
adsorbed on dry rock surfaces and thus prevented fines release.
Although fines migration can cause permeability decline, they are also considered by
some researchers (Tang and Morrow, 1999; Lemon et al., 2011) as the mechanism for enhanced
oil recovery or improved sweep efficiency due to the alteration of injected water salinity or
composition. The details are discussed in the following section 2.8.3.
2.8 Brine Salinity and Composition
Brine salinity has been studied in the literature that it has a profound effect on the
interfacial tension, reservoir wettability and oil recovery. Saline water is classified into three
categories by US Geological Survey according to the salinity concentration level. The slightly
saline water has around 1000 to 3000 ppm of salt. Moderately saline water is roughly about 3000
to 10,000 ppm, and highly saline water is in the range of 10,000 to 35,000 ppm. Seawater has a
salinity of roughly 35,000 ppm, and it varies with location. Based on the fact that an optimal

26
salinity of the dissolved solids in the injection water may yield the highest oil recovery, the
application of suitable brine salinity is important to improve oil recovery in existing and future
water flooding projects.
2.8.1 Effect of Brine Salinity/Composition on Interfacial Tension
Among early studies on the effect of brine salinity on interfacial tension, Cai et al. (1996)
conducted the experiments to measure interfacial tensions of ten normal-alkanes + water/brine
and hydrocarbon mixture + water/brine systems by using a pendent drop instrument under high
pressure and temperature conditions. Three types of salts, sodium chloride, calcium chloride and
magnesium chloride were used in the experiments. They found that the presence of salt in the
aqueous phase increased the interfacial tension, and this increase depended on the salt
concentration but was insensitive to the salt species. The interfacial tension also slightly
increased with an increase of the molecular weight of the n-alkane.
Abdel-Wali (1996) investigated the effect of polar compounds and salinity on the
interfacial tension and wettability in rock/oil/brine systems. The polar compounds present in the
crude oil were varied by adding different amounts of oleic acid and actadecylamine to the crude
oil. The brine salinity was varied from 0 to 200,000ppm NaCl. Their results demonstrated that
the oil-brine interfacial tension was lowered to minimum value when oleic acid concentration
was 0.028gmol/l and brine salinity was 40,000ppm. Oleic acid was acting as an anionic
surfactant resulting in low interfacial tension. However, the interfacial tension increased as the
brine salinity increased from 40,000 to 200,000ppm NaCl because of decreasing the solubility
level of oleic acid in water.
Vijapurapu and Rao (2004) studied the effect of brine dilution and surfactant addition on
spreading and adhesion behavior of Yates crude oil on dolomite surface. The water-oil IFT

27
measured in their experiments initially decreased as the volume percent of brine in the mixture
decreased but increased with further diluting the reservoir brine with de-ionized water. Similar
behavior was found with synthetic brine. The critical spreading tension was defined as “the value
of interfacial tension at which the receding contact angle reaches to 90⁰” based on the
observation of the oil drop spreading on the solid surface when the IFT decreased below this
critical value. Hence, the critical brine concentration should be determined to maximize the oil
recovery based on IFT results.
Xu (2005) experimentally investigated the brine composition and salinity on interfacial
tension using live crude oil at reservoir conditions. Deionized water, NaCl brine, CaCl2 brine,
reservoir brine and 50% dilution of reservoir brine were tested. The dilution of reservoir brine
increased the value of IFT compared to the original reservoir brine IFT result. In addition, live
oil-brine IFT in the pure CaCl2 brine had the highest equilibrium value compared to the other
cases.
Hamouda and Karoussi (2008) presented contact angle and interfacial tension study on
chalk rocks at high temperature condition. In their study, IFT measurement were conducted
using a drop volume tensiometer with 0.005M stearic acid in n-decane/water containing 0.1M
concentration of sodium sulfate (NaSO4) or magnesium Chloride (MgCl2) to test the effect of the
ions in salt water. The results showed that IFT in the presence of magnesium ions was lower than
that of sulfate ions or distilled water in a range of temperature from 82.4 to 158°F.
Okasha and Al-Shiwaish (2009) investigated the effect of synthetic reservoir brine
salinity on interfacial tension of both dead and recombined oil in Arab-D carbonate reservoir. In
their study, the synthetic brine was prepared at three different TDS levels: 241,943, 107,906 and
52,346 ppm, and the experiments were conducted at various temperatures and pressures for both

28
dead and live oil systems. IFT values for both dead and live oil systems showed decreasing
trends as the brine salinity decreased at the same temperature and pressure conditions. IFT
decreased further with dead oil system compared to live oil system due to the effect of dissolved
gases in the live oil.
Alotaibi and Nasr-EL-Din (2009) measured the interfacial tension between n-dodecane
and brines (NaCl solutions) with various salt contents using Pendent Drop Apparatus. Their
results showed that lowering the NaCl concentration could not always reduce the interfacial
tension. There existed a critical salt concentration at which a minimum interfacial tension
between brine and oil could be obtained. They believed that this optimal salt concentration could
improve oil recovery.
2.8.2 Effect of Brine Salinity/Composition on Wettability and Oil Recovery
Wettability is a major and important factor controlling the location, flow and distribution
of fluids in a reservoir (Anderson, 1986a). More and more researchers believe that brine salinity,
especially low salinity brine, had significant impact on wettability and thus oil recovery based on
their laboratory studies conducted over a period of many years. One trend has appeared that the
low salinity injection can obtain high oil recovery. It has also been reported that low salinity
effects have been observed both in a secondary and tertiary flooding mode.
Tang and Morrow (1997) investigated the effect of brine salinity, oil composition and
temperature on wettability and oil recovery by spontaneous imbibitions and waterflooding using
Berea sandstone core. Salinity was varied by altering the concentration of total dissolved solids
of the synthetic brine in proportion. It was reported that salinity of the connate and invading
brines can have a major influence on wettability and oil recovery at reservoir temperature. Oil
recovery increased with a decrease in salinity and increase in displacement temperature. Also

29
addition of alkanes (pentane, hexane and decane) to crude oil reduced the water wetness and thus
increased oil recovery.
Sharma and Filoco (2000) performed centrifuge experiments to measure the drainage and
imbibition relative permeability in two- and three-phase systems. Three crude oils, NaCl brines
and Berea sandstone cores were used in the tests. (In drainage tests, crude oils were displaced by
air at connate water, and there was no impact on oil recovery.) The oil recovery increased
significantly with lowering the connate brine salinity in imbibition experiments. However, the
salinity of the injection brine had no significant influence on the oil recovery. Hence, the salinity
of the connate water was believed to be the primary factor controlling the oil recovery due to the
wettability alternation from water-wet conditions to mixed-wet conditions.
Bagci et al. (2001) studied the effect of brine composition on oil recovery by
waterflooding on limestone cores. The brines were NaCl, CaCl2, KCl and binary mixture of them
at two different concentrations of 2 and 5 wt%. From their study, the oil recovery increased with
decrease in salinity of injected water and the highest oil recovery was 35.5% of OOIP for 2%
KCl brine. Adjustment of the injected brine composition in waterflooding can provide a possible
and economically feasible approach to increase oil production. Wettability alteration was
mentioned as a reason for enhanced oil recovery in their study but without any further
explanation or evidence of wettability alteration.
HØgnesen et al. (2005) investigated spontaneous imbibition into preferential oil-wet
carbonates during a wettability alteration process. In their study, reservoir limestone, outcrop
chalk cores, seawater and formation water were used at high temperature conditions. The results
showed that sulfate present in the injection brine could act as a wettability modifying agent and
alter it from oil-wet to water-wet. The sulfate ion concentration increasing with an increase of

30
temperature resulted in improved oil recovery. However, this strategy has limitations with regard
to initial brine salinity and temperature.
Zhang et al. (2007) performed coreflooding experiments on consolidated reservoir cores
by injecting high salinity formation brine of 29,690 ppm, low salinity brine of 1479 ppm, and
two concentrations of sodium chloride (8000 and 1500 ppm). The mix-wet nature of cores was
established by adsorption from crude oil in the presence of connate water. Low salinity brine
injection increased oil recovery in both secondary and tertiary mode. Injection of 8000 ppm
NaCl solution as a tertiary process did not show any effect on oil recovery. However, lowering
NaCl salinity to 1500 ppm resulted in improved oil recovery, and thus an additional 4% OOIP
recovery was obtained.
Patil et al. (2008) presented results from coreflooding experiments carried out to evaluate
the potential of low salinity brine injection on EOR for Alaska North Slope as secondary
recovery mode. Representative ANS cores and formation fluid samples were used in the
coreflooding experiments. Injection brine salinities were varied from reservoir brine salinity of
22,000 TDS to 5500 TDS. Ultra low salinity (50-60 TDS) ANS lake water was also tested as a
potential source of low salinity waterflooding. The wettability of core samples was determined
using the Amott-Harvey wettability indices. Their study demonstrated that a decrease in injection
brine salinity at reservoir temperature caused a reduction in residual oil saturation up to 20% and
a slight increase in the Amott-Harvey wettability index and thus water-wetness of the core
samples. Oil recovery also increased from 40 to 68% as changing the water salinity from 22,000
TDS to ultralow salinity ANS lake water, indicating that ANS lake water could be considered as
a potential option for either waterflooding or dilution of the high salinity ANS reservoir brine.

31
Agbalaka et al. (2009) conducted coreflooding experiments to determine the recovery
benefits of low salinity waterflood (< 2 wt % NaCl) compared to high salinity waterflood (4 wt %
NaCl) and the role of wettability in any observed recovery benefit. Two sets of cores, Berea
sandstone core and MPU shaly sandstone core were used at low and high temperature and
pressure conditions. The results showed that low salinity waterflood had the potential for
improved oil recovery either for secondary recovery or tertiary recovery process. It was also
observed that heating injection brine could recover more oil than injecting brine of similar
salinity at ambient temperature. In addition, an increase in water-wetness of the core samples for
the decane/MPU core system by injecting low salinity brine caused a reduction in residual oil
saturation and increase in the oil recovery.
Ashraf et al. (2010) reported their laboratory investigation of the relationship between
rock wettability and oil recovery with low salinity water injection as secondary recovery process.
Coreflooding experiments have been conducted by using synthetic brines and n-decane at room
conditions on Berea sandstone cores with four different wettabilities ranging from water-wet to
oil-wet. Their results showed that for all the salinity brines, oil recovery increased as wettability
changed from water-wet to neutral-wet. Further alteration in wettability from neutral-wet to oil-
wet led to a decrease in oil recovery. Also, oil recovery was observed higher for low salinity
waterflooding than that for high salinity waterflooding when used as secondary recovery process.
Alotaibi et al. (2011) presented wettability study using low salinity water in sandstone
reservoirs. Outcrop rocks (Berea and Scioto sandstone rocks) and stock-tank crude oil samples
were used in all experiments. Synthetic formation brine, aquifer water, and seawater were
evaluated under high pressure conditions. Contact angle as well as zeta potential of sandstone
rocks and selected clay minerals was measured. On the basis of their results, they concluded that

32
low-salinity water altered the Berea sandstone wettability toward strongly water-wet conditions.
The surface charge of Scioto sandstone was strongly affected by low-salinity water and the zeta
potential of montmorillonite and chlorited clays was significantly decreased by low-salinity
water. Hence, low-salinity waterflooding could improve oil recovery.
Encouraged by the observed potential of low salinity waterflooding in enhanced oil
recovery at laboratory scale, several field trials have been carried out. The log-inject-log tests
successfully performed near the well bore region using four different salinity brines showed that
low salinity water injection significantly reduced residual oil saturation by 25 to 50% (Webb et
al., 2004). Exact mechanisms for the increased production were not well understood, but the
wettability alteration due to the low salinity water injection may be an important reason.
McGuire et al. (2005) used single well chemical tracer tests (SWCTT) in the Alaska field
to evaluate the low salinity water injection effect on remaining oil saturation. The SWCTT
results demonstrated that residual oil saturation was substantially decreased by low salinity water
injection. And the low salinity EOR benefits ranged from 6 to 12% OOIP, resulting in an
increase in waterflood recovery of 8 to 19%.
Robertson (2007) reported historical field evidence by using low-salinity waterflooding
to improve oil recovery. The results turned out that as the salinity ratio (the ration of the salinity
of the injection water to the salinity of the initial formation water) decreased, the oil recovery
tended to increase. It indicated that lower salinity floods tended to obtain higher oil recovery.
Seccombe et al. (2008) presented tertiary LoSalTM
EOR benefits at the Endicott field
located on the North Slope of Alaska. Single well chemical tracer tests (SWCTT) have also been
used in this field to quantify the low salinity water injection effect as tertiary process on residual

33
oil saturation. There is good agreement between coreflood results and SWCT tests. The
additional oil recovery is 26 percent obtained by low salinity waterflooding.
Skrettingland et al. (2011) evaluated the effect of low salinity (lowsal) waterflooding on
enhanced oil recovery at the Snorre field. They conducted both coreflood experiments and a
single-well chemical tracer-test (SWCTT) field pilot to measure the residual oil saturation after
seawaterflood and after lowsal flooding. Regarding their study, no significant changes in the
remaining oil saturation were shown in both laboratory measurements and a Snorre field test by
using low salinity waterflooding. Hence the potential for IOR by lowsal flooding is low for this
field case. The reason for this is believed to be that the initial wetting condition of Snorre field is
close to optimal so that even for high salinity water injection like seawater injection is also
efficient to improve oil recovery. Although this is a disappointed case, it provides further
evidence of consistency between laboratory and field tests, which helps to screen low-salinity
waterflooding candidates (Morrow and Buckley, 2011).
2.8.3 Mechanisms of Brine Salinity on Oil Recovery
As discussed above, the wettability alteration is believed to be the main mechanism for
brine salinity effect on oil recovery. The characteristics of the brine solution, including the pH,
types and concentrations of ions, were discussed as the main factors that can affect the
wettability. Other factors, such as the clay swelling/dispersion, fines migration, and multiple-
component ionic exchange (MIE), were also investigated as contributions to the oil recovery
enhancement.
Enhanced oil recovery ascribing to clay swelling was discussed to be the main cause by
several researchers (Smith, 1942; Martin, 1959). Based on the results of mineral oil recovery test

34
using fresh water injection, Bernerd (1967) concluded that the clay swelling and dispersion in the
sandstone rock, along with increased pressure drop, improved the oil production.
Tang and Morrow (1999) summarized that fines migration played a key role in the
sensitivity of oil recovery to brine salinity when they conducted coreflooding experiments on
Berea sandstone cores. It was observed that oil recovery increased with the decreasing of the
brine salinity. Fines, mainly kaolinite, were detached from the cores during low salinity
waterflood. As a result, they believed that the detachment and stripping of mobile mix-wet
fines/clays from the cores was the main mechanism for increasing the oil recovery. Lemon et al.
(2011) developed a model for particle detachment to describe waterflood with fines migration
and evaluate the effects of fines migration on waterflood sweep efficiency under a given
injection/production rate. From their study, fines migration due to the alteration of the injected
water composition were believed to increase waterflood sweep efficiency. The mechanism for
this was proposed that formation damage caused by mobilized fines in the swept zone tended to
make the permeability distribution across the breakthrough period more uniform. Hence, the
induced formation damage resulted in the breakthrough period increase and improved sweep
efficiency for a given volume of injected water. However, Lager et al. (2006) reported that no
fines migration has been observed at reduced or full reservoir condition of low salinity
waterflood experiments. These results question the relationship between fines migration and
improved oil recovery.
According to Lager et al. (2006), multiple-component ionic exchange (MIE) between
clay mineral surfaces and the injected brine was responsible for the improvement in oil recovery
using low salinity waterflooding. Effluent sample analysis after coreflood showed a sharp
decrease in Mg2+
, indicating that Mg2+
was strongly adsorbed at rock matrix. Thus, polar organic

35
compounds are believed to be desorbed and replaced with multivalent cations during the
injection of low salinity brine. In theory, desorption of polar compounds form the clay surface
results in an increase in oil recovery since the clay surface wettability is altered towards more
water-wet surface. They designed the coreflood experiments to test this mechanism, and the
results matched the predictions. This implied that the injection of low salinity water led to higher
oil recovery in the presence of multivalent cations in the connate brine because the bonds
holding oil in contact with the rock surface were broken which changes the wettability.
The MIE mechanism was discussed further in papers (Lager et al., 2008; Seccombe et al.,
2008). The sharp drop in Mg2+
concentration was observed, and it confirmed the self-sharpening
front inferred from the MIE mechanism (Seccombe et al., 2008). A non-sharpening front would
have resulted in a highly dispersed response where concentration would have decreased
gradually as observed in field tracers.
Nasralla et al. (2011) conducted the coreflood experiments to explain the mechanisms
involved when recovering oil with low salinity water injection. Coreflood experiments were run
in the secondary and tertiary modes to investigate the effect of water salinity (0, ~5000, ~55,000
and ~174,000mg/l) on oil recovery. They concluded that the oil recovery was improved by low
salinity water injection in secondary mode but was not impacted in tertiary mode. They believed
that cation exchange was responsible for higher oil recovery from low salinity water injection
because cation exchange reduced electrostatic attraction forces between crude oil and the rock
surface by altering the rock surface charge.
From the above review, it can be seen that the evaluations of brine salinity and
composition effects on wettability and oil recovery, in almost all previous research, were based
on the coreflood tests for crude oils. None of them performed an experimental investigation to

36
study brine salinity and composition effect near the condensate buildup region in gas-condensate
reservoirs. Also, the Amott-Harvey method was mainly used in their studies to characterize
wettability, but this method cannot accurately measure neutral wettability (Anderson, 1986b) nor
can it be used at reservoir pressures. Wettability determination from contact angle measurement
using real reservoir fluids is the best method to evaluate wettability (Anderson, 1986b).

37
3. EXPERIMENTAL APPARATUS AND PROCEDURES
The experiments conducted in this study include two systems, condensate-synthetic
reservoir brine containing surfactants and condensate-different synthetic brines. In the first
system, interfacial tension and contact angle measurements with or without surfactants were
performed under both ambient and reservoir conditions using the ambient and the high-pressure
high-temperature optical cells and the associated apparatus. The coreflood experiments were also
conducted to test the effect of surfactants on gas relative permeability at ambient conditions.
Hence, the fluids used in this first system are condensate, synthetic reservoir brine, methane and
nitrogen. And two types of surfactants, anionic and nonionic, were examined. The experiments
for the second system only involved interfacial tension and contact angle measurements at
ambient conditions. The ambient optical cell was used in this system. The pH of brines was also
measured. The fluids, therefore, used in this part are condensate and synthetic brines including
multi-component and single-salt brines. The details of experimental apparatus and procedure for
both systems are similar and thus are not discussed separately.
3.1 Materials
3.1.1 Fluids
The fluids used in this work were synthetic brines, condensate, methane and nitrogen.
The oil phase, condensate, supplied by a major oil company is clear and the specific gravity is
about 62°API. The composition of the condensate is presented in Table 2. The density and
viscosity of the condensate at 22 °C were 0.7340 g/cm3 and 1.0028 cp, respectively. The
properties of heptanes plus of Buckhorn crude oil are also listed in Table 2 (Sequeira, 2006). It
can be seen from Table 2 that the condensate sample contains 71.7 mole percent heptanes plus
(C7+). The molecular weight of the heptanes plus (C7+) fraction in the sample is 116.5 and its

38
specific gravity is 0.76. In contrast, the heptanes plus (C7+) fraction of stock tank Buckhorn
crude oil was about 91.3 mole percent with a molecular weight and specific gravity of 213.3 and
0.84, respectively. This condensate sample contains less heptanes plus (C7+), indicating the
condensate is low in heavy ends.
Table 2: Compositional Analysis of Condensate
Component Carbon No. Mole % Weight %
Methane C1 0.002 0.000
Ethane C2 0.045 0.013
Propane C3 0.896 0.377
i-Butane iC4 1.156 0.641
-Butane nC4 3.580 1.984
i-Pentane iC5 4.333 3.478
n-Pentane nC5 5.590 3.846
Hexane C6 12.722 10.455
Heptanes Plus C7+ 71.676 79.703
Total 100.000 100.000
Properties of Heptanes Plus (C7+) of Condensate C7+ of Buckhorn stock tank oil
Mole% 71.7 91.3
Molecular Weight 116.5 213.3
Specific Gravity @60/60°F 0.76 0.84
In this study, different synthetic brines were used including multi-component brines and
single-salt brines. Synthetic reservoir brine with 0.9995 g/cm3 density and 1.2298 cp viscosity at
22 °C was prepared which had the same composition as that of reservoir brine provided by the
company. The composition of reservoir brine is listed in Table 3. All brines were prepared by
adding salts into the deionized water and then evacuated for one hour before use to remove
dissolved gas. The salts were purchased from Fisher Scientific and had a purity of 99.9%.
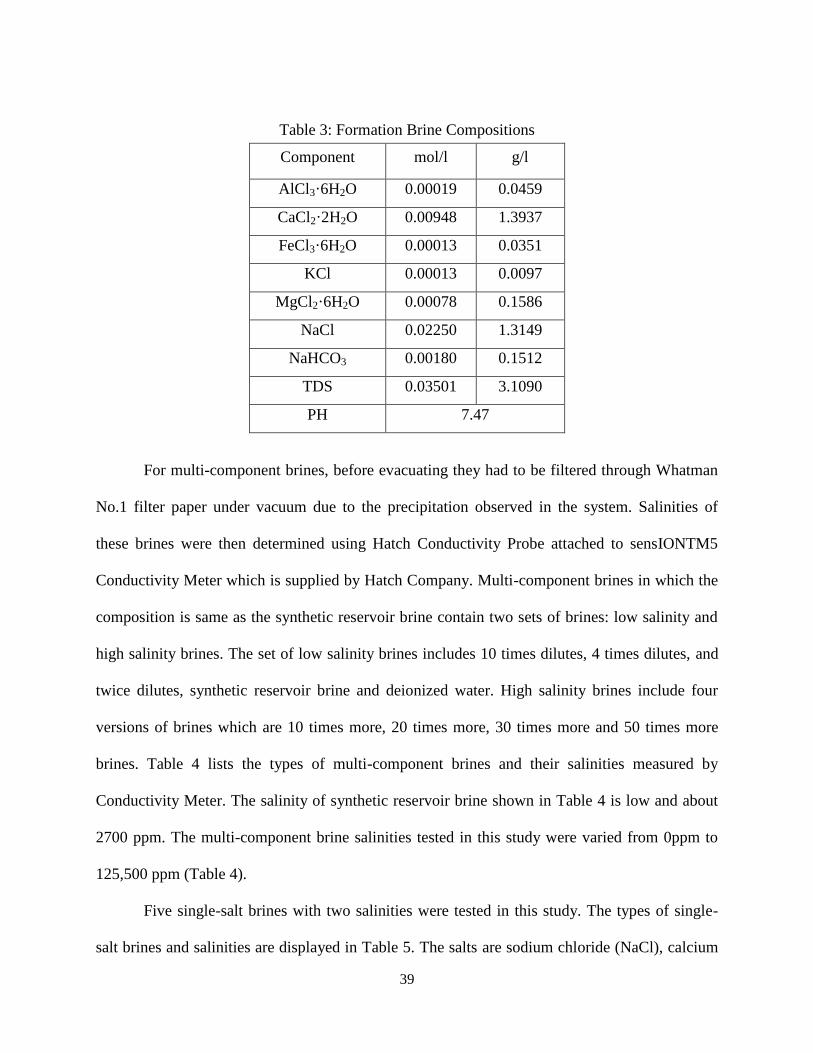
39
Table 3: Formation Brine Compositions
Component mol/l g/l
AlCl3·6H2O 0.00019 0.0459
CaCl2·2H2O 0.00948 1.3937
FeCl3·6H2O 0.00013 0.0351
KCl 0.00013 0.0097
MgCl2·6H2O 0.00078 0.1586
NaCl 0.02250 1.3149
NaHCO3 0.00180 0.1512
TDS 0.03501 3.1090
PH 7.47
For multi-component brines, before evacuating they had to be filtered through Whatman
No.1 filter paper under vacuum due to the precipitation observed in the system. Salinities of
these brines were then determined using Hatch Conductivity Probe attached to sensIONTM5
Conductivity Meter which is supplied by Hatch Company. Multi-component brines in which the
composition is same as the synthetic reservoir brine contain two sets of brines: low salinity and
high salinity brines. The set of low salinity brines includes 10 times dilutes, 4 times dilutes, and
twice dilutes, synthetic reservoir brine and deionized water. High salinity brines include four
versions of brines which are 10 times more, 20 times more, 30 times more and 50 times more
brines. Table 4 lists the types of multi-component brines and their salinities measured by
Conductivity Meter. The salinity of synthetic reservoir brine shown in Table 4 is low and about
2700 ppm. The multi-component brine salinities tested in this study were varied from 0ppm to
125,500 ppm (Table 4).
Five single-salt brines with two salinities were tested in this study. The types of single-
salt brines and salinities are displayed in Table 5. The salts are sodium chloride (NaCl), calcium
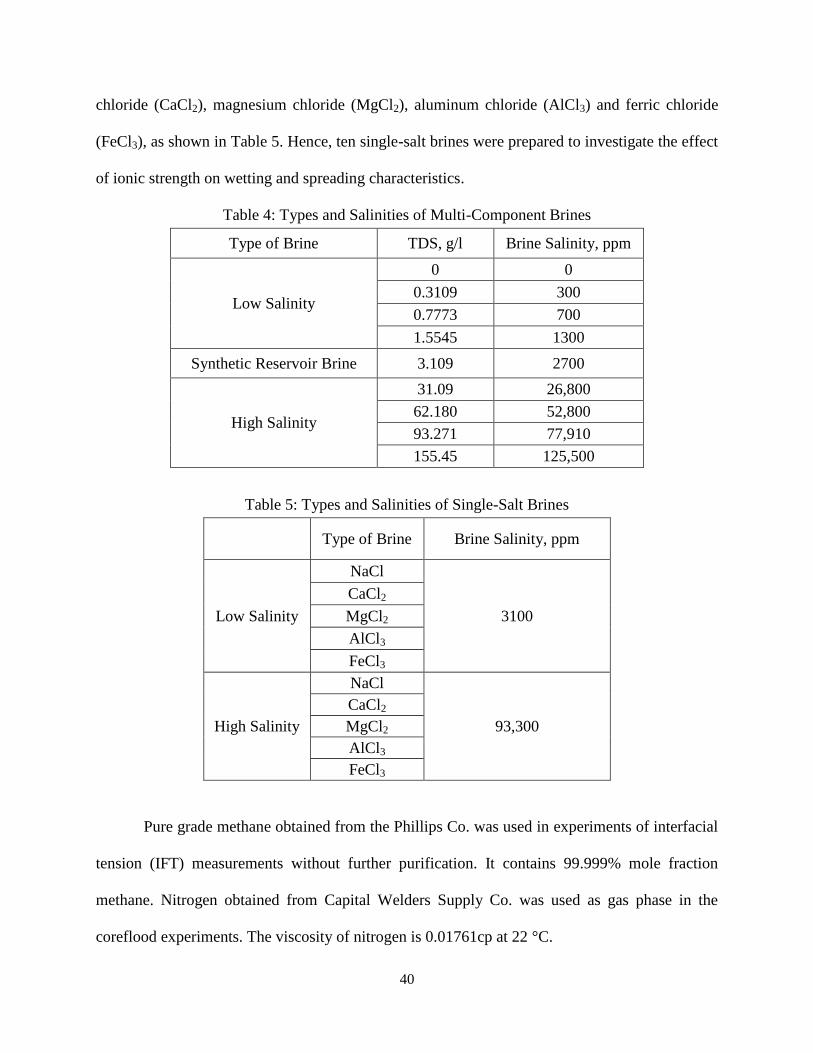
40
chloride (CaCl2), magnesium chloride (MgCl2), aluminum chloride (AlCl3) and ferric chloride
(FeCl3), as shown in Table 5. Hence, ten single-salt brines were prepared to investigate the effect
of ionic strength on wetting and spreading characteristics.
Table 4: Types and Salinities of Multi-Component Brines
Type of Brine TDS, g/l Brine Salinity, ppm
Low Salinity
0 0
0.3109 300
0.7773 700
1.5545 1300
Synthetic Reservoir Brine 3.109 2700
High Salinity
31.09 26,800
62.180 52,800
93.271 77,910
155.45 125,500
Table 5: Types and Salinities of Single-Salt Brines
Type of Brine Brine Salinity, ppm
Low Salinity
NaCl
3100
CaCl2
MgCl2
AlCl3
FeCl3
High Salinity
NaCl
93,300
CaCl2
MgCl2
AlCl3
FeCl3
Pure grade methane obtained from the Phillips Co. was used in experiments of interfacial
tension (IFT) measurements without further purification. It contains 99.999% mole fraction
methane. Nitrogen obtained from Capital Welders Supply Co. was used as gas phase in the
coreflood experiments. The viscosity of nitrogen is 0.01761cp at 22 °C.

41
3.1.2 Chemicals
In this study, two surfactants with trade names ALFOTERRA 123-4S and NOVEL TDA-
12 Ethoxylate supplied by Sasol North America Inc. were used. NTDA-12 is an isotridecanol
fatty alcohol ethoxylate nonionic surfactant. It is water-soluble hazy liquid with the specific
gravity (at 40 °C) of 1.01.
ALFO123-4S is a water-soluble anionic surfactant with an appearance of clear pale
yellow liquid. It is a monoalkyl branched propoxy sulfate and has 12-13 number of hydrophobic
carbons and 4 moles of propoxylation. Its mono branched alkyl hydrophobe allows for greater
interaction with the oil phase while maintaining good solubility. The family of ALFOTERRA
surfactants was also found to be a better anionic surfactant at wettability alteration on calcite
surfaces to intermediate wet compared to cationic surfactant (Seethepalli et al., 2004).
In preparing a solution for treatment, the required weight fraction surfactant was added to
the synthetic brine. Three surfactant concentrations of 500, 1500 and 3000 ppm were used in
experiments of contact angle measurements at both ambient and reservoir conditions. Two
concentrations (1500 ppm and 3000 ppm) were used in coreflood experiments at ambient
conditions. The viscosities of 1500 and 3000 ppm surfactant solutions were 1.118 and 1.2298 cp
at 22 °C, respectively.
3.1.3 Rocks
The selected gas condensate reservoir for this study is the Tahoe reservoir in the Gulf of
Mexico, approximately 140 miles east/southeast of New Orleans and 105 miles south of Mobile,
Alabama. The reservoir depth is about 10,000 feet subsea (White, et al, 1992). The initial
reservoir pressure was about 5000 psia and has fallen now to 2264 psia. The reservoir
temperature is 210 °F. The dew point pressure was reported to be about 4935 psia and the initial

42
producing gas-oil ratio (GOR) was 33,000 scf/STB. The reservoir is highly laminated, composed
of many layers of thin shale and sandstone, but only the sandstone layers contribute to gas
production. The reservoir porosity and connate water saturation are about 0.28 and 0.26,
respectively.
In our experiments, quartz and Berea sandstone core were chosen to represent the
sandstone reservoir rock. The quartz substrate for contact angle measurements and wettability
determination was purchased from Ward’s Nature Science. The glass substrates and the glass
capillary tube used in the capillary rise technique were obtained from the Glass Blowing Shop of
the Department of Chemistry at Louisiana State University. The types of glass used in the
experiments are all of the same material, namely borosilicate. The glass capillary tube, used in
IFT measurements, had an internal diameter of 0.106 cm.
Berea sandstone cores, 2 in diameter and 1ft long, were purchased from Cleveland
Quarries for use in the coreflood experiments. The permeability of the fresh cores ranged from
200 to 500 mD and their porosity was around 20%.
3.2 Experimental Apparatus
3.2.1 Ambient and High-Pressure High-Temperature Optical Cells
In this work, the ambient and the high-pressure high-temperature optical cells and the
associated apparatus were used for the experiments of interfacial tension (IFT) and contact angle
measurements under both ambient and reservoir conditions of 2264 psia and 210 °F.
Figure 6 shows the ambient optical cell (A) and its associated apparatus including light
source (B), goniometer (C) and video camera (D). The interior of the ambient optical cell was
coated with Teflon against corrosion and was saliently designed for measuring interfacial tension
(IFT) and contact angles. Two crystal holders, upper and lower, were positioned in the cell for

43
measuring contact angles. The upper crystal holder moves in the vertical direction, while the
lower one moves horizontally. In addition, the lower holder can be rotated around its horizontal
axis so that both of the crystal surfaces can be used for measuring contact angles. All parts of the
cell which would contact with the test fluid such as brine are made of Hastalloy C-276 to prevent
corrosion and consequent contamination of fluid samples during relatively long periods of time
required in the experiments. A capillary tube was inserted through the bottom of the cell, and its
height adjusted to meet the requirement in each experiment. The oil drop was injected by a
syringe which was connected with the capillary tubing.
Figure 6: Ambient DDDC Optical Cell Apparatus
(A: Ambient Optical Cell; B: Light Source; C: Goniometer; D: Video Camera)
The ambient optical cell is illuminated by light source (B). The video camera (D)
connected with a computer is used to record the image or video for IFT and contact angle
measurements. It can also provide direct visual observations of rock-fluid-fluid interfacial
behavior. The goniometer (C) is an optical instrument for measuring contact angles and distances.

44
DSA software from KRUSS Company is used to calculate the interfacial tension, and MB ruler
software is used to measure distances and angles.
The high-pressure high-temperature optical cell as well as its associated apparatus shown
in Figure 7 was used for the experiments under the reservoir conditions. This optical cell (A) has
been built to measure IFT and contact angle at elevated temperatures and pressures and its design
rating is 20,000 psi and 400 °F. The high-pressure high-temperature optical cell is similar to
above ambient optical cell but still has its unique features as described below.
The high-pressure high-temperature optical cell has four adjustable arms. The top one
and a side one are designed to hold crystals while the other side arm is used for holding the
calibration ball. The bottom arm is designed for mounting the needle tip which is used to inject
oil drops into the cell. All of the four arms can be rotated and moved in and out of the cell
chamber during high pressure tests.
Figure 7: High-Pressure High-Temperature (HPHT) Optical Cell Apparatus (A: HPHT Optical Cell; B: Light Source; C: Goniometer; D: Digital Video Camera; E: Oven; F: Image
Analysis System; G: Beam Splitter)

45
The oven (E) is used to provide the high temperature required for the optical cell. The
light source (B), goniometer (C) and digital video camera (D) as illustrated in Figure 7 are also
used in this high-pressure high-temperature apparatus much like with the ambient apparatus. The
beam splitter (G) is an optical glass used to enable the image observation for the digital camera
and the goniometer at the same time. The image analysis system including a computer which is
connected to the digital video camera and installed commercial software (DSA and MB Ruler) is
employed to record images or videos to determine IFT and measure contact angles.
3.2.2 Coreflood Apparatus
The schematic of experimental setup for conducting unsteady state relative permeabilties
measurements in this study is shown in Figure 8 and 9. A Berea sandstone core was placed in the
coreholder as displayed in Figure 8 and 9, and fluids in the transfer vessel were injected with a
constant rate through the pump at inlet, while the outlet pressure was maintained at atmospheric
pressure. A back-pressure regulator (BPR) was used for control the upstream flowing pressure
of the core only in gas flood step. The production burette and the wet test gas meter were used to
measure liquid volume and gas flow rate, respectively.
Figure 8: Schematic of Coreflood Apparatus Used for Berea Rock-Fluids System

46
Figure 9: Coreflood Apparatus
3.3 Experimental Preparation and Cleaning
3.3.1 Optical Cells and the Associated Apparatus Cleaning
The ambient optical cell was first cleaned with de-ionized water. After each experiment,
the inlet valve was opened to let some de-ionized water or brine in so that the oil floating at the
top can be drained out from the outlet valve, aiming to avoid the floating oil falling down to
touch and contaminate the cell’s Teflon interior. Afterwards, the ambient optical cell was
cleaned by toluene to dissolve all the crude oil, followed by acetone to dissolve all the toluene,
and finally deionized water (DIW) was used to remove any traces of acetone. Then the cell was
dried before beginning each experiment.
The high pressure in the high-pressure high-temperature optical cell after each
experiment was released and lowered to ambient pressure after which the fluids were drained
from the bottom of the cell. The optical cell was then disconnected from tubing and valves. The
cleaning procedure for HPHT optical cell is similar to that for above ambient optical cell by
47
using the same sequence of chemicals (toluene, acetone, and DIW). After drying with nitrogen,
the cell was heated by the oven to further evaporate any traces of DIW, toluene and acetone
before the start of the next experiment.
The other accessories for both optical cells including all glassware such as glass window,
syringe, tubing and valves were also cleaned by rinsing with toluene, followed by acetone, and
then rinsed well with de-ionized water. All the solvent cleaning steps were conducted in a well-
ventilated fume hood. The transfer vessels which were used to store synthetic brine and
surfactant solution were cleaned with a low concentration solution of an organic acid and then
flushed with de-ionized water. All of the apparatus was allowed to dry thoroughly before use.
3.3.2 Core Cleaning
The detailed core cleaning procedure has been discussed in elsewhere (Mwangi, 2010). A
sequence of solvents was used to clean the core after surfactant flood. First, methylene chloride
was injected into the core in both backward and forward directions about 2 pore volumes (PV).
Methylene chloride acted as a buffer between the brine and the cleaning fluids to prevent salts
precipitating from the brine. It was also a good organic solvent and could be used to remove part
of condensate. Isopropyl alcohol (IPA) was followed to inject to the core in the forward direction
about 2 PV to get rid of the connate water. Care should be taken in this step, because the pressure
drop increased dramatically from several hundred psi to around 2000 psi. The pressure drop
decreased as IPA broke through. The similar observation was reported during this IPA cleaning
step (Mwangi, 2010). The probable explanation is to be the interaction between IPA and the rock
grains.
Next, methylene chloride was re-introduced to the core in both directions about 2 PV to
displace IPA, followed by toluene. Toluene removed residual condensate from the core. It was
48
also injected about 2 PV in the forward and backward directions. The core was then cleaned
further by methylene chloride and brine. About 2 PV methylene chloride was flowed to displace
toluene, followed by 2 PV brine to flush methylene chloride. Injections of methylene chloride
and brine were performed in the forward and backward directions as well.
Finally, the core was evacuated for 3 to 4 hours by the vacuum pump. This last step
might help decrease the pressure drop of the core and remove the traces of methylene chloride.
After completion of this series of steps, the core was ready for absolute permeability test.
3.3.3 Rocks Preparation
The quartz rock sample was first cut into suitable pieces by a cutting machine, and then
its surface was polished using a grinding machine with four meshes of sandpapers. The polished
quartz sample was cleaned with toluene and acetone, and then soaked into a heated bath of
concentrated sulfuric acid for 30 minutes. All the samples were rinsed with deionized water after
cooling and dried completely in air prior to use.
The Berea sandstone cores were wrapped with a layer of Teflon tape and then placed
inside a Viton rubber sleeve. The Teflon tape was used to prevent fluids from interacting with
the sleeve. The Viton sleeve prevented fluids from contacting the hydraulic oil in the annulus.
3.3.4 Surfactants Thermal Stability Screening
The structural stability of the anionic and nonionic surfactants at high temperature has to
be tested for specific reservoir conditions although they were used in the experiments at ambient
conditions and did not show any cloudiness. Figure 10 displays the experimental equipment was
set up for testing surfactants thermal stability. Surfactants were mixed with synthetic brine at a
certain concentration. Surfactant solution was contained in a glass conical flask with a rubber
stopper which had a hole in the center as can be seen in Figure 10. The surfactant solution in the

49
flask in Figure 10 was nonionic TDA-12 at 500 ppm concentration as an example. A
thermometer was inserted through the hole of the stopper to measure the temperature of the
surfactant solution. The flask was placed on a magnetic heating panel, and a magnetic stirring
bar was also put in the flask to mix the surfactant solution to be heated evenly.
Figure 10: Experimental Set up for Thermal Stability Test
(A: Magnetic Heating Panel; B: Conical Flask; C: Thermometer)
The anionic surfactant, ALFOTERRA 123-4S, was a high performing surfactant at room
temperature and showed more effectiveness. When the 500 ppm and 3000 ppm concentrations of
this surfactant solution were heated up to 210 ºF (~99 ºC), both solutions still remained clear.
This demonstrates that this anionic surfactant has thermal stability and can be applied at reservoir
conditions.
Figure 11 displays phase behavior pictures for 500 ppm concentrations of two nonionic
surfactants TDA-12 and FC-4430 at room and reservoir temperature. It can be seen that the 500
ppm nonionic surfactant (NOVEL TDA-12 Ethoxylate) solution in brine formed a clear solution
at room temperature of 72 ºF (22 ºC). But the same solution turned cloudy at 197 ºF (87.8 ºC)

50
and it became a fully hazy liquid at reservoir temperature of 210 ºF, indicating that this nonionic
surfactant was not stable at high temperature. Therefore, this surfactant was rejected for the high
temperature application for this particular condensate reservoir.
Apart from the nonionic surfactant TDA-12, several other available nonionic surfactants
in our lab were also screened for high temperature condition. 500 ppm NOVEL TDA-3 and
TDA-6 Ethoxylate (from Sasol North Inc.) solution in brine formed cloudy solutions at room
temperature. They remained cloudy at reservoir temperature of 210 ºF. FC- 4430 and FC- 4432
nonionic surfactants from 3M Co. did not show any cloudiness at room temperature for 500ppm
concentration solution in brine, but the same solutions became cloudy at 92 ºF (33.3 ºC) as
shown in Figure 11. All of these nonionic surfactants were rejected for use in the experiments at
reservoir conditions as well.
Figure 11: Phase Behavior Pictures for 500 ppm Nonionic Surfactants TDA-12 and FC-4430
Solutions at 72 °F and 210 °F
3.3.5 Density Meter Calibration
The densities of fluids play a key role to obtain accurate fluid-fluid interfacial tensions
(IFT) or surface tension when the pendant drop method and capillary rise technique are used. In
this study, the DMA 4500 densitometer and density measuring cell DMA HP purchased from the

51
Anton Paar Company were used to measure the phase densities at ambient conditions and high
temperature high pressure conditions, respectively.
The DMA 4500 density meter offers not only density measurement at ambient conditions
but also the evaluation unit for DMA HP. And its maximum density deviation is 0.00010 g/cm3.
The DMA HP, the high pressure and high temperature density measuring cell which has to be
connected to the DMA 4500 to display the measuring parameters, is designed to measure the
density of gases and liquids at elevated pressures ranging from 0 to 10,000 psi and elevated
temperatures from +14 ºF to +392 ºF.
Before each measurement, the DMA 4500 was totally cleaned with toluene and acetone
and then blow dried with air. The DMA HP needs to be set at the specific temperature according
to the experiment requirement and then completely cleaned with toluene, acetone and blown dry
with nitrogen. The detailed procedure for using the DMA 4500 and DMA HP can be found in the
manual provided by the Anton Paar Company. Both of them have similar measuring procedure,
for example, activating the required method, ensuring that the measuring cell is clean and dry
and then introducing the sample in the measuring cell. But the difference between them is that
the temperature should first be set at often reservoir temperature for the DMA HP. In addition, a
syringe is used to inject the sample for DMA 4500, while a pump is used for DMA HP to
generate high pressures and inject the sample into the cell.
Two standard fluids pairs, air, degassed deionized water (DIW) and n-decane, degassed
DIW, were used to calibrate DMA 4500 at 20 ºC and DMA HP at reservoir temperature of
210 °F (~99 ºC), respectively. After calibration, a value of 0.99820 g/cm3 was obtained for DIW
by DMA 4500. It showed good agreement with the published value of 0.99821 g/cm3 from the
National Institute of Standards and Technology (NIST) website.

52
The calibration of the DMA HP density cell was performed at pressures of 2264 and
4935 psia which correspond to the current reservoir pressure and initial reservoir pressure. After
density adjustment at 210 ºF, the densities of DIW and n-decane were then measured at both
pressure conditions. The density of 0.68613 g/cm3 at 2264 psia for n-decane and 0.97432 g/cm
3
density of DIW at 4935 psia were also in good agreement with the value of 0.68610 g/cm3 and
0.9743 g/cm3 provided by NIST website. Both calibration results reveal that DMA 4500
densitometer and DMA HP density cell can accurately measure densities of unknown fluid
samples at ambient conditions as well as reservoir conditions.
3.3.6 Conductivity Meter and pH Meter
The salinity and pH of brine are believed to be very important in determining the
wettability because they strongly influence the surface charge on the rock surface and fluid
interfaces, which in turn affect the adsorption of surfactants in crude oil (Anderson, 1986). In this
study, the salinity and pH were determined using a Conductivity Meter and a pH meter.
The pH measurements were conducted by an Orion 9157BN pH electrode (0~14 pH)
connected with a Thermo Orion pH meter (model 420A plus) purchased from Thermo Scientific.
Three pH buffers (4.01, 7.00 and 10.01) were also purchased from Thermo Scientific to calibrate
the pH meter before pH is measured. At least two of them were selected for calibration
depending on the sample pH range. In other words, the two chosen buffers should bracket the
sample pH for better accuracy.
Brine salinity was measured using Hatch Conductivity Probe attached to sensIONTM
5
Conductivity Meter supplied by Hatch Company. The designed measurement range of
Conductivity Meter for TDS/salinity is 0~50,000 mg/L (as NaCl)/0~42 ppt. The temperature can

53
vary from -10 to 105 ºC. The accuracy of the meter is ±0.5% of full scale for TDS and ±0.1 ppt
(-2 to 35 ºC) for salinity.
Before use the Conductivity Meter, the calibration was performed using the known
standards which were chosen in the expected range of the samples. In this study, two sodium
chloride (NaCl) standard solutions having conductivity of 1000±10 μS/cm (500±5 mg/L TDS)
and 18,000±50 μS/cm (9000±25 mg/L TDS) were used to calibrate the meter for low and median
brine salinity measurement. Salinity standard solution (35.0 ppt as salinity, 0.450 molal KCl,
53.0 mS/cm Conductivity at 25 ºC) was used for high salinity calibration.
It is noteworthy here that for very high brine salinity which exceeds the maximum
salinity of 42 ppt of the Conductivity Meter, the salinity measurement was performed using
several times dilute of high salinity brine which would be in the range of the meter.
The calibrations for both pH meter and Conductivity meter were followed the procedure
of the manual provided by the company.
3.4 Experimental Procedure
3.4.1 Interfacial Tension Measurement by Pendent Drop Method
In this study, to obtain spreading coefficients, interfacial tensions (IFT) between three
systems condensate-water, methane-water and condensate-methane were needed to be
determined. Pendent drop method was mainly employed for measuring interfacial tensions.
Commercial DSA software was used to calculate interfacial tensions from the drop images. The
procedures of interfacial tension measurement carried out in both ambient and HTHP optical
cells are described as below.
Ambient-condition experiments including interfacial tension (IFT) measurements and
dynamic contact angle measurements were performed at atmospheric pressure and room

54
temperature (23 ± 2°C or 74 ± 3°F) in the ambient optical cell. Heavy liquid such as brine or
surfactant containing brine was taken in a large container, which was kept at a sufficient height
above the cell to allow liquid to flow through plastic tubing by gravity. Thoroughly cleaned
ambient optical cell was gradually filled up with this heavy fluid. Some fluid was allowed to
drain from the outlet valve to ensure that there was no air bubbles trapped in the ambient cell.
The inlet valve was then closed and the outlet was kept open during the entire time of the
experiment. The light fluid such as condensate or gas was injected into the ambient optical cell
using the syringe. The syringe piston was moved slowly to increase the pendent drop volume
until the drop volume reached the maximum before leaving the tip of the needle.
The cleaned and sealed high-pressure-high-temperature (HPHT) optical cell was initially
filled with denser fluid (synthetic brine or condensate) and then the cell pressure was increased
close to reservoir pressure. The cell was left alone for several minutes to check for leaks in the
system. The optical cell was then heated by the oven. Care was taken to monitor the pressure as
the cell temperature was increased to reservoir temperature of 210 ºF. The light fluid (condensate
or gas) was then introduced through the injection tip by using a hand pump into the clean HPHT
optical cell. The pump handle was moved slowly to obtain the maximum pendant drop volume.
A condensate drop in the synthetic brine at reservoir conditions serves as an example to
illustrate this process of using the pendant drop technique to obtain the IFT in Figure 12. The
fourth picture of Figure 12 shows the biggest condensate drop achieved. The images at this
particular moment were captured and saved. This DSA software program is thus run to calculate
the interfacial tension (IFT) values by fitting the experimentally measured drop contour to the
theoretical curve based on Young-Laplace equation which relates the drop profile to the

55
interfacial tension. This procedure of IFT measurement is repeated for 10~15 pendent drop
images to obtain an average value of IFT.
Figure 12: Schematic of Pendent Drop Method for IFT Measurement
3.4.2 Interfacial Tension Measurement by Capillary Rise Technique
In the fluid-fluid systems in the presence of surfactant, an oil or gas pendant drop was
difficult to form due to low interfacial tensions. Sometimes the drop could not be stabilized at the
capillary tip and quickly escaped through the surfactant solution. Therefore, at these conditions,
the capillary rise technique was adopted to replace the pendent drop technique to measure the
interfacial tensions. The capillary rise technique is a simple and accurate method to measure low
interfacial /surface tensions. The formula for calculating interfacial tensions from this technique
is given by
(5)
where: σ is interfacial tension in mN/m, Δρ is density difference between the two fluids in g/cm3,
R is radius of tube in cm, h is the height of capillary rise in cm, g is gravitational acceleration in
980 cm/sec2, θ is contact angle in º and gc is conversion factor (1
).
Figure 13 shows an example image of capillary rise in methane-brine system with 3000
ppm surfactant at reservoir conditions of 2264 psia and 210 °F. From Eq. (5) and Figure 13, both
the capillary rise and contact angle have to be measured to calculate the IFT. It is worth to state

56
here that for the gas-water system the contact angle is very small. Hence, the contact angle was
assumed to be zero for calculating IFT. The following procedure was used to measure capillary
rise in this work at both ambient and reservoir conditions.
Figure 13: Image of Capillary Rise in CH4-Brine System at 2264 psia and 210 °F Conditions
(3000 ppm Surfactant Solution)
The particular quantity of surfactant solution in brine was firstly taken in the glass
beaker at ambient conditions. Figure 14 depicts the process of capillary rise technique to obtain
the capillary rise height used at ambient conditions. An amount of oil was added to the aqueous
phase. The two liquids were thoroughly mixed with a glass stirring rod. After settling for one
hour, the solution clearly separated into two immiscible phases with the denser phase (brine) at
the bottom, while the lighter fluid (oil) on the top. A glass capillary tube with the diameter of
0.106 cm was then carefully inserted into the beaker below the interface of the two fluids. An
adjustable stand was used to fix the position of the capillary tube so that the capillary tube is
totally immersed in the two liquid fluids and the bottom end of the capillary tube did not touch
the bottom of the beaker as shown in Figure 14. Subsequently, the denser fluid (surfactant
solution) would rise in the capillary until the weight of the column of fluid balanced the pressure
difference across the meniscus interface. The meniscus was stabilized for 20 minutes to obtain

57
the height. The beaker was placed between the light source B and the video camera D which
were shown in Figure 6. The image of the capillary rise was captured by the DSA software. And
the stabilized height was measured using the software MB ruler.
Figure 14: Schematic of Capillary Rise Technique at Ambient Conditions
The equilibrium contact angles for capillary rise technique were measured in the ambient
optical cell (Figure 6). A clean and aged glass substrate was carefully placed in the lower
horizontal crystal holder of the ambient optical cell. The surfactant solution was also taken in the
elevated larger container and allowed to flow into the cell by gravity. After the cell was full of
the solution, some solution was allowed to discharge from the top of the cell to ensure no air
bubbles were trapped in the cell. Then the oil (condensate) drop was placed on the glass substrate
by using the syringe from the bottom of the cell. Both valves were closed and the cell was set
aside for 24 hours to age the oil drop for oil-solution-glass substrate interactions to achieve
equilibrium. The equilibrium contact angle was then measured using the MB ruler software.
A glass capillary tube with a diameter of 0.106 cm was carefully placed in the HPHT
optical cell and held in horizontal position by using the lower crystal holder. Once the pressure
and temperature of the cell filled with surfactant solution achieved the reservoir conditions of
2264 psia and 210 °F, condensate or methane was injected into the HPHT cell to replace some
R
h
Brine
ρL
Oil
ρo θ

58
amount (about one third volume of the cell) of surfactant solution from the bypass tubing line
located on top of the cell. The interface between the two immiscible phases could be observed,
and the system was settled for 30 minutes to reach equilibrium at reservoir pressure and
temperature. The capillary tube was then rotated to vertical position by the lower crystal holder.
Subsequently, the denser fluid (surfactant solution) would rise in the capillary until the weight of
the column of fluid balanced the pressure difference across the meniscus interface as shown in
Figure 13. The meniscus was stabilized for 20 minutes to obtain the capillary rise. The image of
the capillary rise was captured by the DSA software and its stabilized height was measured using
the software MB ruler. The height of the capillary rise was then obtained by calibration against a
standardized length.
The densities of condensate and surfactant solutions at ambient conditions and reservoir
conditions were measured by Anton Paar DMA 4500 density meter and DMA HP density cell,
respectively. The measured capillary rise height, fluid densities and contact angles (≈0 for
methane) were substituted into Eq. (5) to calculate the interfacial tensions.
3.4.3 Contact Angle Measurement
In this study, Dual-Drop-Dual-Crystal (DDDC) technique, which overcomes the poor
reproducibility and long test duration of other conventional contact angle techniques (Rao and
Girard, 1996; Rao, 2003), was used to measure dynamic contact angles and thus determine the
wetting nature in rock-oil-water systems. The sessile drop method was used to measure water-
receding contact angles to determine the spreading of oil on the rock surface immersed in brine.
The sequence of experimental steps is briefly described below.
Two clean crystals were mounted, one in the lower horizontal holder and the other in the
upper vertical holder. After the cell was filled with brine, two separate condensate drops were
59
placed on the two crystals and aged for 24 hours as sessile drops to achieve the initial uniformity
of oil-exposed areas on both quartz surfaces. The receding contact angles of these two sessile
drops on both surfaces were measured at starting time (~0 hr) and 24 hr.
Then the lower crystal was flipped over, the two condensate drops were mingled into one
big drop by lowering the upper crystal. The water-advancing and receding contact angles were
created by sliding the lower crystal sideways. All of the contact angles were measured at
different times until they showed negligible change. The movement of the three-phase contact
line (TPCL) was also monitored at different times to further analyze the behavior of condensate
drop on the lower crystal. This procedure is repeated until at least two successive shifts yield
similar water-advancing contact angles.
3.4.4 Surfactant Injection Procedure
Anionic and nonionic surfactants were used to test their effects on the wettability for this
condensate-brine-quartz case in the experiments at ambient conditions, and anionic surfactant
was also tested at reservoir conditions. The surfactant injection experiments were carried out at
three surfactant concentrations of 500, 1500 and 3000 ppm.
At the end of the aforementioned DDDC contact angle measurements to determine the
reservoir wettability, the condensate drop was allowed to stay between the two substrates as it
was and then brine containing the surfactant at specified concentration was injected into the cell.
For ambient-condition cases, the surfactant solution was introduced to the optic cell by gravity
flow. The quantity of the surfactant solution used was more than three times the volume of the
cell to totally replace the normal brine previously contained in the cell. While for reservoir
condition cases, the constant rate pump was employed to inject the surfactant solution to the
HPHT optical cell at a rate of 11cc/min. The surfactant solution in the transfer vessel was heated
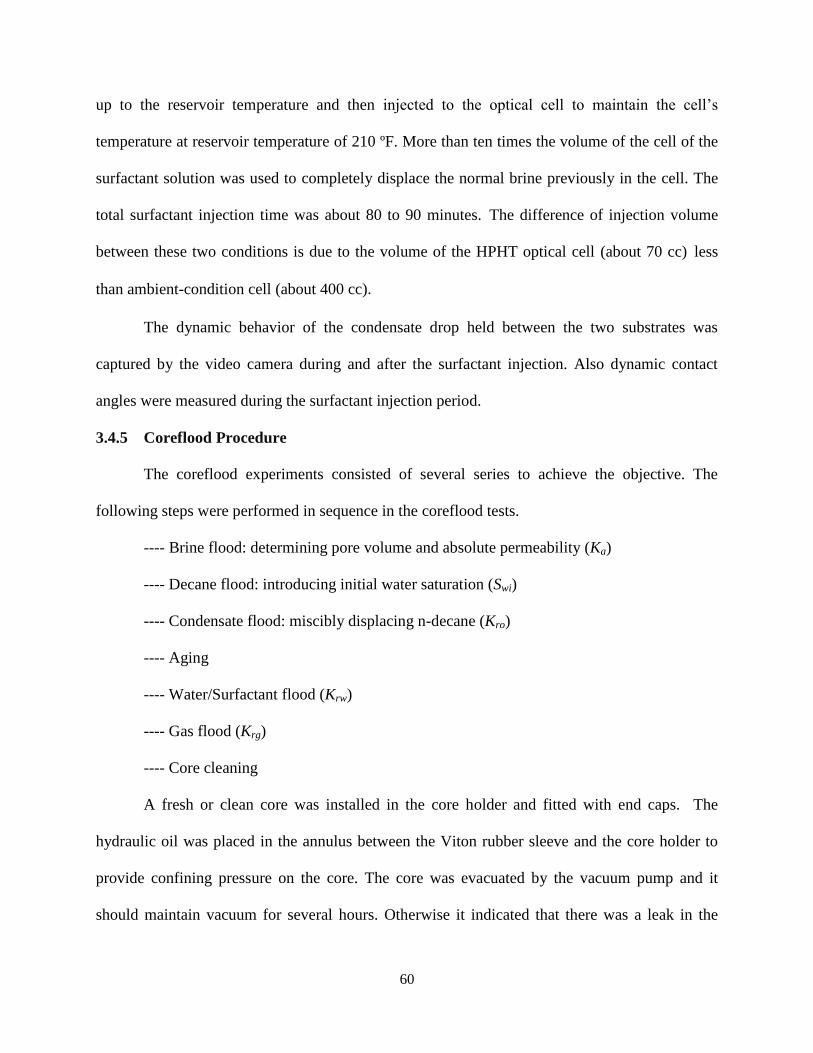
60
up to the reservoir temperature and then injected to the optical cell to maintain the cell’s
temperature at reservoir temperature of 210 ºF. More than ten times the volume of the cell of the
surfactant solution was used to completely displace the normal brine previously in the cell. The
total surfactant injection time was about 80 to 90 minutes. The difference of injection volume
between these two conditions is due to the volume of the HPHT optical cell (about 70 cc) less
than ambient-condition cell (about 400 cc).
The dynamic behavior of the condensate drop held between the two substrates was
captured by the video camera during and after the surfactant injection. Also dynamic contact
angles were measured during the surfactant injection period.
3.4.5 Coreflood Procedure
The coreflood experiments consisted of several series to achieve the objective. The
following steps were performed in sequence in the coreflood tests.
---- Brine flood: determining pore volume and absolute permeability (Ka)
---- Decane flood: introducing initial water saturation (Swi)
---- Condensate flood: miscibly displacing n-decane (Kro)
---- Aging
---- Water/Surfactant flood (Krw)
---- Gas flood (Krg)
---- Core cleaning
A fresh or clean core was installed in the core holder and fitted with end caps. The
hydraulic oil was placed in the annulus between the Viton rubber sleeve and the core holder to
provide confining pressure on the core. The core was evacuated by the vacuum pump and it
should maintain vacuum for several hours. Otherwise it indicated that there was a leak in the

61
core system. Once the core was ready, the inlet valve was open and the outlet valve was kept
close, synthetic brine was then injected to the core at a very low flow rate 0.5 cc/min. When the
core was completely saturated with brine, a rapid increase in the core pressure could be observed.
At this point, the volume of injected brine was measured and the pore volume (PV) of the core
could be calculated by subtracting the dead volume from the injected volume. Next, brine was
then flowed at three different flow rates of 2, 4, 6 cc/min through the core, and the stabilized
pressure drops for each flow rate were recorded to obtain the absolute permeability (Ka) to brine
based on Darcy’s law.
After the absolute permeability test, the core was first flooded with n-decane at 2cc/min
rate to decrease the water saturation to an initial or irreducible value. When brine production
could not be clearly observed in the effluent (about 5 to 6 PV n-decane injection) indicating the
initial water saturation (Swi) was achieved, condensate was then injected to miscibly displace n-
decane for about 1.5 to 2 PV, after which the endpoint permeability to oil (condensate) was
determined at the flow rates of 2, 3 and 4 cc/min. The core was then aged for 3~5 days to obtain
the natural wettability. All the relative permeabilities (Kro, Krw and Krg) reported in this study are
normalized with respect to this endpoint effective oil permeability (Ko) computed in this step.
Water (brine or brine containing surfactant) displacement tests were conducted after
aging the core at initial water saturation to produce oil (condensate), determine recovery and oil-
water relative permeabilities. Before conducting this procedure, the inlet and outlet lines were
flushed and empty to ensure the correct interpretation of the production history. The volume of
condensate in these lines could not be taken into account because it was produced from the lines
not from the core itself. The flood rate was 2 cc/min and total injection was about 3 to 5 PV,
following which the endpoint permeability to brine (Krw) at residual oil saturation (ROS) was

62
carried out at flow rates 3 and 4 cc/min. During the water flood period, the pressure drop across
the core, the breakthrough time and oil and brine productions were recorded against time. Also,
water-oil (condensate) relative permeabilities, wettability, and waterflood oil (condensate)
recovery of the core were determined in this step.
The following step is gas (nitrogen) flood. As shown in Figure 7, a back-pressure
regulator (BPR) was used in the upstream for gas injection to maintain the constant gas pressure
at the outlet of the transfer vessel and thus provide a constant gas rate. The injected gas pressure
was maintained around 250 psi by the back-pressure regulator. The wet test gas meter was used
in the downstream to measure the real gas rate. Likewise, the gas endpoint permeability (Krg)
was determined at the pump flow rates of 8, 10 and 12 cc/min. And condensate and water
productions were measured during the gas flood, as well as the pressure drop across the core and
the breakthrough time.
It is worth noting here that the core was not cleaned between the base case (0 ppm
surfactant flood) and the first surfactant treatment (3000 ppm) case. In other words, after
completion of the base case, the core was just flooded with condensate to blow out the gas and
bring back the initial water saturation and then was used to perform 3000 ppm surfactant flood.
However, after the 3000 ppm surfactant flood case, the core had to be thoroughly cleaned
followed by section 3.3.2 cleaning procedure and restored to its initial conditions before the start
of the next test—1500 ppm case because surfactant was left in the core.
To avoid appreciable influence of capillary forces on the waterflood behavior that causes
the end effects and the spreading of the displacement front, Rapoport and Leas scaling criterion
for linear displacement tests, as expressed in follow, has been used to calculate the stable
volumetric flow rates for use in the experiments (Rapoport and Leas, 1953).

63
Lμu ≥ 1 (6)
where L is the core length in cm, μ is the displacing phase viscosity in cP, and u is the flow rate
per unit cross-sectional area in cm/min.
According to this criterion, the calculated minimum fluid velocity is about 0.54 cc/min
(32.4 cc/hr). Hence, the waterflood investigations in above series were conducted at a flood rate
of 2 cc/min which ensures the independence of oil recovery on flow rate and core length.
3.5 Coreflood Simulator
A simulation of water (brine or surfactant solution) flood process subsequently was
performed using the procedure reported by Okazawa (1983) to determine relative permeabilities.
In this simulation model, the analytical approach of JBN (Johnson et.al, 1959), which is based on
the assumption of negligible capillary pressure effects, was used to generate relative
permeabilities. The experimental production and pressure drop histories were provided in the
model and relative permeabilities were thus calculated by minimizing the sum of squares of the
weighted deviations of the calculated data from the experimental histories. Craig’s rules of
thumb (Craig, 1971) were used to interpret the relative permeability curves to infer wettability
and its alterations. This is a simple approach to determine the wettability alone from the
differences in oil-water relative permeability curves because fluid flow through porous media
depending on several parameters such as wettability, rock pore structure, fluid-fluid interfacial
tension, fluids saturations and their history, etc (Craig, 1971). Anderson (1987) also point out,
“Because factors other than wettability can have a similar influence on relative permeability
curves, it is preferable to make independent measurements of wettability rather than to rely
solely on Craig’s rule of thumb to evaluate wettability.”

64
4. RESULTS AND DISCUSSION
The results of this study have been divided and discussed in the following six sections.
The initial wettability of the representative condensate reservoir measured by DDDC technique
is discussed in the first section. Interfacial tensions (IFT) and spreading coefficients in the
presence and absence of surfactants are given in the following section. The third section
describes the effect of surfactants on wettability. In this section, the experimental results were
subdivided into two sections- during surfactant injection and after surfactant injection for better
analysis. The Bond number calculations are discussed in the fourth section to quantitatively
explain the condensate drop behavior on the crystal surface. For the first four sections, the
experiments were conducted under both ambient and reservoir conditions. The fifth section
presents the effect of surfactants on flow behavior in Berea core at ambient conditions. How
brine salinity and brine composition have influenced wettability and spreading are explained in
the sixth section along with some discussion of the mechanisms involved.
4.1 Wettability Determination of Condensate Reservoir at Ambient and Reservoir
Conditions
Figure 15 and Figure 16 display the photographic sequence of the DDDC experiments
conducted on the quartz substrate to measure contact angles in this condensate-brine system at
reservoir conditions of 2264 psia and 210 °F as well as ambient conditions. From Figure 15 and
16, it can be seen that for this condensate fluids on quartz reservoir the wettabilities measured at
both conditions are similar. The experiments were initiated with two separate condensate drops
aging on the two smooth quartz surfaces immersed in synthetic reservoir brine under 2264 psia
and 210 °F or room conditions, as shown in pictures A of Figure 15 or G of Figure 16. The lower
substrate was slowly rotated after 24 hours and some of the drop was observed to float away
from the lower surface while the rest of the drop was left behind on the surface with large contact

65
angles indicating an area that seemed to be oil-wet (picture B in Figure 15 and H in Figure 16).
The reason for this observation is that the buoyancy force of the full condensate drop was
stronger than the cohesion force in the condensate drop but weaker than the adhesion force at the
condensate/substrate interface.
Figure 15: DDDC Procedures for Condensate-Brine-Quartz System at 2264 psia and 210 °F
Figure 16: DDDC Procedures for Condensate-Brine-Quartz System at Ambient Conditions

66
The upper substrate was then brought down to contact this part of condensate drop on the
lower substrate and the two drops merged into one big drop (pictures C of Figure 15 and I of
Figure 16). At this point, four equilibrium receding angles and initial contact line positions, for
example reservoir-condition case, Li and Ri, between the lower left and right corners of the
condensate drop from the left edge of the lower substrate were measured. Then the lower
substrate was shifted horizontally toward the right side in the reservoir condition case, thereby
creating the water-advancing contact angle and water-receding contact angle with this lateral
substrate movement. Pictures D, E and F of Figure 15 are the depiction of the repeated shift
progress of the experiment. The lower right and left contact angles represent the water-advancing
angle and receding angle, respectively. And for ambient-condition case, it should be noted here
that the lower substrate was moved to the left side, thus the lower left contact angle is the water-
advancing angle while the right one is the receding angle as displayed in Figure 16.
The measured dynamic contact angles are plotted against contact time in Figure 16 and
Figure 17 for both conditions. In reservoir-condition case, three-phase contact line (TPCL)
movements were normalized by the distance between the lower right corner of the condensate
drop and the left edge of the lower substrate divided by the measured initial contact line position
Li; While three phase contact line (TPCL) movements for ambient-condition case were
normalized by the distance between the lower left corner of the condensate drop and the right
edge of the lower substrate divided by the measured initial contact line position Ri. Normalized
TPCL (R/Li or L/Ri) distances are also plotted in Figure 16 and 17.

67
Figure 17: DDDC Contact Angles and TPCL Movements for Condensate-Brine-Quartz Surface
at Ambient Conditions (Trial 1)
After mingling the two drops, the initial four angles, upper left and right angles, and
lower advancing and receding angles were measured for zero contact time. At another 10
minutes, for example ambient-condition case, the first slight shift of the lower substrate created
the lower advancing angle of 97º and the lower receding angle of 28º on the lower surface as can
be seen in Figure 17. And the TPCL slightly moved on the lower surface. After 10 minutes the
lower substrate was shifted for the second time, and the advancing angle increased to about 109º.
The TPCL movement was not observed. The third and fourth sideways shifts were executed on
the lower substrate, resulting in an increase of the low water-advancing contact angle up to about
152º. Until this contact time (40 min), the TPCL still retained at the same position and did not
move, as indicated in Figure 17.
The following shift was made at a contact time of 50 minutes and an interesting
observation was made. The TPCL slightly moved on the lower substrate surface in response to
the reduction of lower advancing angle as can be seen in Figure 17. The lower advancing angle
0.0
0.2
0.4
0.6
0.8
1.0
1.2
1.4
1.6
1.8
0
20
40
60
80
100
120
140
160
180
0 10 20 30 40 50 60 70 80
No
rmal
ize
d T
PC
L M
ove
me
nt
(L/R
i)
Dyn
amic
Co
nta
ct A
ngl
e, d
eg
Contact Time, min
lower advacing lower receding TPCL movement
152°

68
decreased to 141º. The last shift was attempted at 60 minutes, and the lower advancing angle
repeated to reach the high value of 151º along with unchanged position of the TPCL. This
implies that adhesion force was very strong at condensate/substrate interface in this condensate-
brine-quartz case. At the same time, a strongly adhering condensate drop as displayed in picture
L of Figure 16 was left on the lower substrate surface. The measured peak lower advancing angle
of 152º shown in Figure 17 demonstrates that the condensate strongly attaches to the quartz
surface and therefore this system shows a strongly oil-wet nature at ambient conditions.
Figure 18: DDDC Contact Angles and TPCL Movements for Condensate-Brine-Quartz Surface
at Reservoir Conditions (2264 psia and 210 ºF) (Trial 1)
For reservoir-condition case, the observation was similar to ambient-condition case. The
measured lower water-advancing angle approached the peak value of 155º after several
horizontal shifts and the TPCL slightly moved on the lower surface, as illustrated in Figure 18.
This indicates that adhesion force of oil with the solid surface was stronger than cohesion and
hence cohesive failure occurred in the condensate drop resulting in the drop slightly moving on
0.5
1.5
2.5
3.5
4.5
5.5
6.5
60
80
100
120
140
160
180
0 20 40 60 80
No
rmal
ize
d T
PC
L M
ove
me
nt
Dyn
amic
Co
nta
ct A
ngl
e, d
eg
Contact Time, min
lower advacing lower receding TPCL movement
155⁰
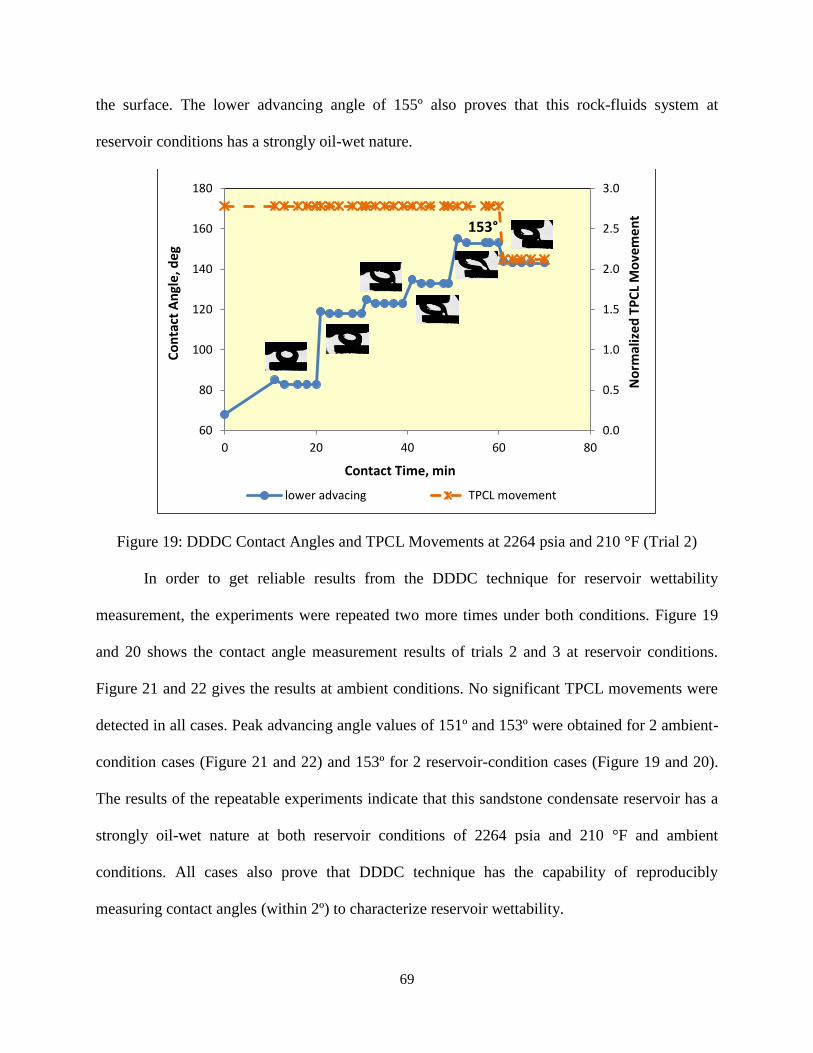
69
the surface. The lower advancing angle of 155º also proves that this rock-fluids system at
reservoir conditions has a strongly oil-wet nature.
Figure 19: DDDC Contact Angles and TPCL Movements at 2264 psia and 210 °F (Trial 2)
In order to get reliable results from the DDDC technique for reservoir wettability
measurement, the experiments were repeated two more times under both conditions. Figure 19
and 20 shows the contact angle measurement results of trials 2 and 3 at reservoir conditions.
Figure 21 and 22 gives the results at ambient conditions. No significant TPCL movements were
detected in all cases. Peak advancing angle values of 151º and 153º were obtained for 2 ambient-
condition cases (Figure 21 and 22) and 153º for 2 reservoir-condition cases (Figure 19 and 20).
The results of the repeatable experiments indicate that this sandstone condensate reservoir has a
strongly oil-wet nature at both reservoir conditions of 2264 psia and 210 °F and ambient
conditions. All cases also prove that DDDC technique has the capability of reproducibly
measuring contact angles (within 2º) to characterize reservoir wettability.
0.0
0.5
1.0
1.5
2.0
2.5
3.0
60
80
100
120
140
160
180
0 20 40 60 80
No
rmal
ized
TP
CL
Mo
vem
en
t
Co
nta
ct A
ngl
e, d
eg
Contact Time, min
lower advacing TPCL movement
153°

70
Figure 20: DDDC Contact Angles and TPCL Movements at 2264 psia and 210 °F (Trial 3)
Figure 21: DDDC Contact Angles and TPCL Movements at Ambient Conditions (Trial 2)
15.2
15.7
16.2
16.7
17.2
17.7
18.2
18.7
19.2
19.7
20.2
90
100
110
120
130
140
150
160
170
0 20 40 60 80
No
rmal
ize
d T
PC
L M
ove
me
nt
Ad
van
cin
g C
on
tact
An
gle
, de
g
Contact Time, min
lower advacing TPCL movement
153°
0.2
0.4
0.6
0.8
1
1.2
1.4
1.6
1.8
2
2.2
60
80
100
120
140
160
180
0 10 20 30 40 50 60
No
rmal
ize
d T
PC
L M
ove
men
t(L/
Ri)
Ad
van
cin
g C
on
tact
An
gle,
deg
Contact time, min
Lower advacing TPCL movement
151°

71
Figure 22: DDDC Contact Angles and TPCL Movements at Ambient Conditions (Trial 3)
4.2 Interfacial Tension and Spreading Coefficient
Interfacial tensions (IFT) with and without surfactants were measured at both ambient
conditions and reservoir conditions. At ambient conditions, two kinds of surfactants, anionic and
nonionic, at the concentration levels of 500, 1500, and 3000 ppm were used to test their
capabilities of modification in interfacial tensions and spreading coefficient. The results
demonstrated that the reduction in interfacial tension induced by the nonionic surfactant was
higher than that by the anionic surfactant. In other words, the anionic surfactant exhibits high
effectiveness in reducing interfacial tension.
Furthermore, these two surfactants were screened for their thermal stability at reservoir
temperature 210 ºF (~99 ºC) (described in Section 3.3.5). The result also showed that the
nonionic surfactant was unstable and formed a cloudy liquid at reservoir temperature hindering
the visual observation of the drop. However, the anionic surfactant was stable and could be
0
0.2
0.4
0.6
0.8
1
1.2
1.4
1.6
1.8
30
60
90
120
150
180
0 15 30 45 60 75 90 105 120 135 150 165
No
rmal
ize
d T
PC
L M
ove
me
nt
(L/R
i)
Ad
van
con
g C
on
tact
An
gle
, d
eg
Contact Time, min
lower advacing TPCL movement
153°

72
applied at reservoir conditions. Hence, only the anionic surfactant was used at reservoir
conditions. The following sections give the results of interfacial tension (IFT) and spreading
coefficient obtained under both conditions.
4.2.1 Interfacial Tension Calibration
To ensure the accuracy of IFT measurements, calibration experiments were performed by
using the pendant drop method by DSA technique before starting any IFT measurements in
condensate-brine-methane systems. Known standard fluid pairs were used to examine the optical
cell, DSA software, and the various experimental procedures.
In this study, because water-oil, gas-water and gas-oil interfacial tensions were needed to
determine spreading coefficients, several known standard fluid pairs had to be selected to
conduct calibration experiments corresponding to water-oil, gas-water and gas-oil systems. For a
water-oil system, the standard fluid pair of n-decane and de-ionized water was chosen to carry
out the calibration. Methane with de-ionized water (DIW) and n-decane with air were used to
calibrate gas-water and gas-condensate system. The images of ten to fifteen drops or bubbles
were captured during the experiments to obtain the average interfacial tension. The IFT
calibration results are listed in Table 6. It can be seen from Table 6 that the results of interfacial
tensions in the calibration experiments are in good agreement with the published values reported
by other workers (Hough et al., 1951; Jennings and Newman, 1971, DSA software database by
Kruss Company). Also, the low standard deviations strongly implied low variation in the
measurements and this provided a strong evidence of the reliability, precision and accuracy of
the equipment in our laboratory.
Capillary Rise technique was calibrated with a known low-IFT standard fluid pair of de-
ionized water (DIW) and n-butanol. In this calibration experiment, the inner diameter of glass
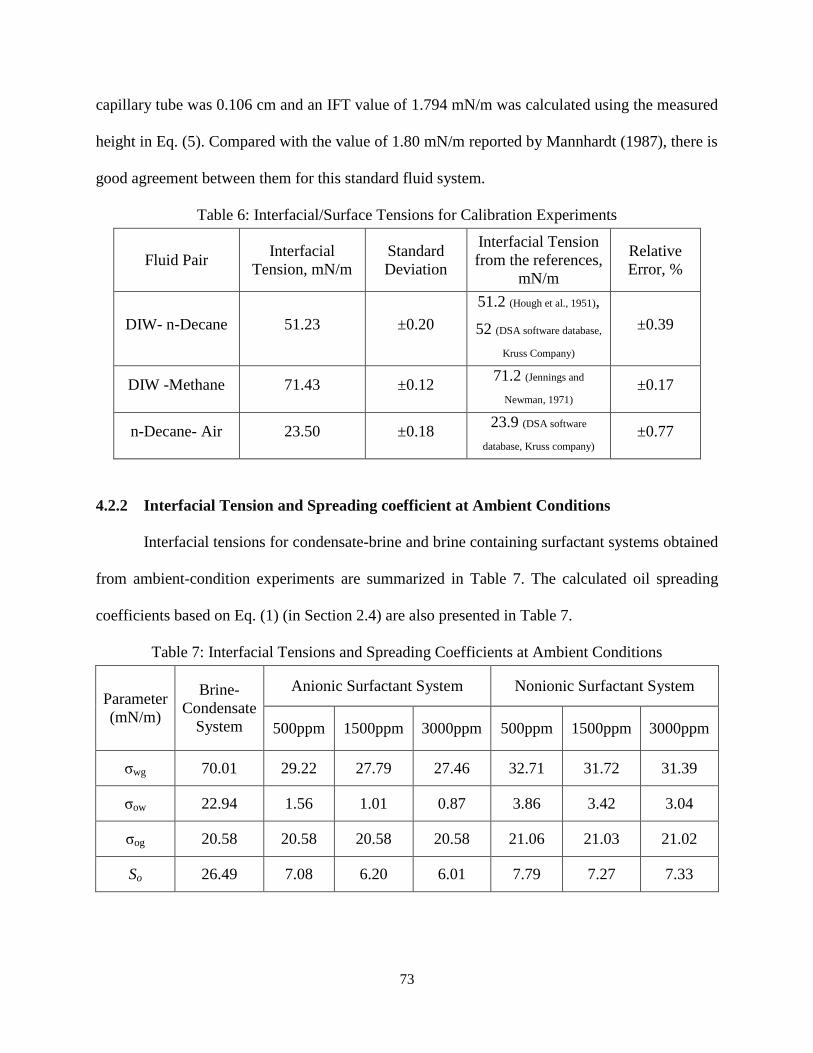
73
capillary tube was 0.106 cm and an IFT value of 1.794 mN/m was calculated using the measured
height in Eq. (5). Compared with the value of 1.80 mN/m reported by Mannhardt (1987), there is
good agreement between them for this standard fluid system.
Table 6: Interfacial/Surface Tensions for Calibration Experiments
Fluid Pair Interfacial
Tension, mN/m
Standard
Deviation
Interfacial Tension
from the references,
mN/m
Relative
Error, %
DIW- n-Decane 51.23 ±0.20
51.2 (Hough et al., 1951),
52 (DSA software database,
Kruss Company)
±0.39
DIW -Methane 71.43 ±0.12 71.2 (Jennings and
Newman, 1971) ±0.17
n-Decane- Air 23.50 ±0.18 23.9 (DSA software
database, Kruss company) ±0.77
4.2.2 Interfacial Tension and Spreading coefficient at Ambient Conditions
Interfacial tensions for condensate-brine and brine containing surfactant systems obtained
from ambient-condition experiments are summarized in Table 7. The calculated oil spreading
coefficients based on Eq. (1) (in Section 2.4) are also presented in Table 7.
Table 7: Interfacial Tensions and Spreading Coefficients at Ambient Conditions
Parameter
(mN/m)
Brine-
Condensate
System
Anionic Surfactant System Nonionic Surfactant System
500ppm 1500ppm 3000ppm 500ppm 1500ppm 3000ppm
σwg 70.01 29.22 27.79 27.46 32.71 31.72 31.39
σow 22.94 1.56 1.01 0.87 3.86 3.42 3.04
σog 20.58 20.58 20.58 20.58 21.06 21.03 21.02
So 26.49 7.08 6.20 6.01 7.79 7.27 7.33

74
It can be seen from Table 7 that interfacial tensions decreased after using these two
surfactants for water-gas and water-condensate systems. But as the surfactant’s concentration
increased from 500 ppm to 3000 ppm, interfacial tensions decreased slightly, for example, from
3.86 mN/m to 3.04 mN/m in the nonionic surfactant containing brine systems. Also, comparing
the anionic surfactant with the nonionic surfactant in the same solvent-brine systems, this anionic
surfactant is more effective than the nonionic surfactant in reducing interfacial tensions. As an
example, low IFT of 1.56 mN/m was obtained by using 500 ppm anionic surfactant in contrast to
3.86 mN/m by 500 ppm nonionic surfactant. However, for condensate-methane systems,
interfacial tensions showed no change or a slight increase by using both surfactants. The anionic
surfactant used in this study could not be dissolved in the condensate. In other words, this
anionic surfactant has no effect on the interfacial tensions between condensate-methane and
hence the same interfacial tension of 20.58 mN/m as shown in Table 7 was used. All of the data
suggest that surfactants have their individual characteristics in different solvents thereby
affecting the interfacial tensions to different extents.
Once interfacial tensions were determined, the oil spreading coefficient can be calculated
according to Eq. (1) (Section 2.4). The calculated spreading coefficients are also presented in
Table 7. In this particular condensate case, all the oil spreading coefficients determined from the
experiments at ambient conditions are positive as displayed in Table 7. It also can be seen from
Table 7 that the calculated spreading coefficients were reduced from original 26.49 mN/m to the
average value of about 7 mN/m after the surfactants application. For anionic surfactant systems,
the oil spreading coefficient decreases as the surfactant concentration is increased from 500 ppm
to 3000 ppm. The declining trend of the oil spreading coefficient demonstrated that there is a
possibility that the spreading coefficient could be changed from positive to negative, indicating

75
that the surfactants could enhance oil recovery in this strongly oil-wet system at ambient
conditions.
4.2.3 Interfacial Tension and Spreading coefficient at Reservoir Conditions
Table 8 presents the results of interfacial tensions in condensate-brine and brine
containing anionic surfactant systems at reservoir conditions of 2264 psia and 210 °F. Ambient-
condition results were also listed in Table 8 for clearly comparing with reservoir-condition
results. The concentration of 0 ppm represents the brine-condensate-gas system in the absence of
anionic surfactant.
Table 8: Results of Interfacial Tensions and Spreading Coefficients
at 2264 psia and 210 °F and Ambient Conditions
Parameter
(mN/m)
0 ppm 500 ppm 1500 ppm 3000 ppm
Reservoir
conditions
Ambient
conditions
Reservoir
conditions
Ambient
conditions
Reservoir
conditions
Ambient
conditions
Reservoir
conditions
Ambient
conditions
σwg 43.87 70.01 34.80 29.22 12.70 27.79 10.07 27.46
σow 9.10 22.94 1.22 1.56 Low* 1.01 Low* 0.87
σog miscible* 20.58 miscible* 20.58 miscible* 20.58 miscible* 20.58
So 34.77 26.49 33.58 7.08 12.70 6.20 10.07 6.01
* The value of 0 was given to calculate the spreading coefficients.
From Table 8, it can be seen that for 0 ppm system, interfacial tensions for water-oil-gas
(σwg, σow and σog) at reservoir conditions are lower than those at ambient conditions, especially
for interfacial tensions between condensate and methane (σog). At ambient conditions, the
methane-condensate system has higher interfacial tension (σog =20.58 mN/m) as shown in Table
6. However, at reservoir conditions of 2264 psia and 210 °F, it was observed that methane had
developed miscibility with condensate during the experiments. Figure 23 shows the images
captured from the video of the experiments for methane and condensate at reservoir temperature
210 °F and different pressures (1450, 1650, 1750, 2000 psi).
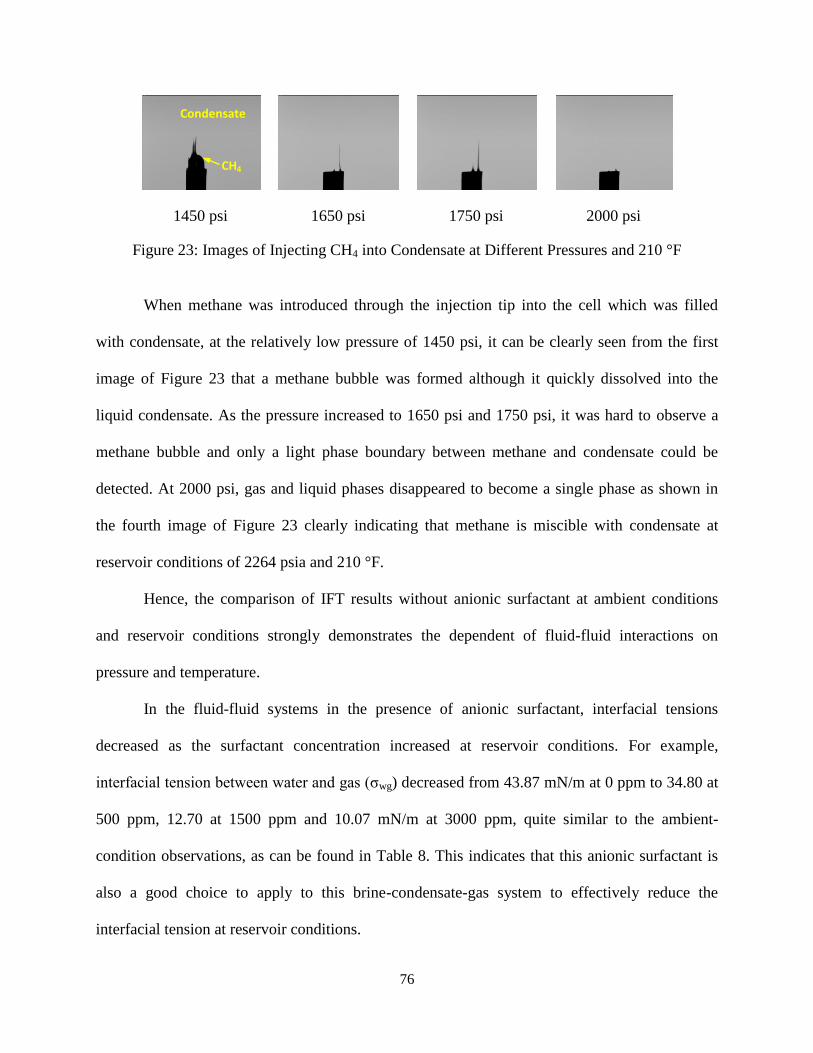
76
1450 psi 1650 psi 1750 psi 2000 psi
Figure 23: Images of Injecting CH4 into Condensate at Different Pressures and 210 °F
When methane was introduced through the injection tip into the cell which was filled
with condensate, at the relatively low pressure of 1450 psi, it can be clearly seen from the first
image of Figure 23 that a methane bubble was formed although it quickly dissolved into the
liquid condensate. As the pressure increased to 1650 psi and 1750 psi, it was hard to observe a
methane bubble and only a light phase boundary between methane and condensate could be
detected. At 2000 psi, gas and liquid phases disappeared to become a single phase as shown in
the fourth image of Figure 23 clearly indicating that methane is miscible with condensate at
reservoir conditions of 2264 psia and 210 °F.
Hence, the comparison of IFT results without anionic surfactant at ambient conditions
and reservoir conditions strongly demonstrates the dependent of fluid-fluid interactions on
pressure and temperature.
In the fluid-fluid systems in the presence of anionic surfactant, interfacial tensions
decreased as the surfactant concentration increased at reservoir conditions. For example,
interfacial tension between water and gas (σwg) decreased from 43.87 mN/m at 0 ppm to 34.80 at
500 ppm, 12.70 at 1500 ppm and 10.07 mN/m at 3000 ppm, quite similar to the ambient-
condition observations, as can be found in Table 8. This indicates that this anionic surfactant is
also a good choice to apply to this brine-condensate-gas system to effectively reduce the
interfacial tension at reservoir conditions.
Condensate
CH4

77
Note that in Table 8, at high surfactant concentrations of 1500 and 3000 ppm the values
of 12.70 and 10.07 mN/m of IFT (σwg) at reservoir conditions are much lower than 27.79 and
27.46 mN/m at ambient conditions. However, for low concentration of 500 ppm, the IFT
between gas and water (σwg) of 34.80 mN/m at reservoir conditions is higher than 29.40 mN/m at
ambient conditions. Also, there is no significant difference between the gas/water IFT values of
27.79 mN/m at 1500 ppm and 27.46 mN/m at 3000 ppm at ambient conditions, however, the
sharp decrease in IFT (σwg) from 34.80 to 10.07 mN/m at reservoir conditions still can be clearly
noticed as the surfactant concentration increased from 500 ppm to 3000 ppm. The one possible
explanation for these differences between both test conditions is that methane at reservoir
conditions of 2264 psia and 210 °F exhibits strong supercritical properties and it behaves more
liquid-like resulting in lower IFT. The other reason is that 500 ppm concentration is not
sufficient for the surfactant to be effective at reservoir conditions. In other words, the availability
of sufficient amount of surfactant molecules in the bulk solution contributes to the reduction of
the interfacial tension. This implies that surfactant characteristics also depend on pressure and
temperature.
All of the reservoir-condition oil spreading coefficients calculated from fluid-fluid
interfacial tensions were positive for this particular condensate case but decreased with
increasing surfactant concentration as shown in Table 8. The calculated spreading coefficients
were reduced one order of magnitude in the presence of anionic surfactant except in the 500 ppm
reservoir-condition case. The spreading coefficient at 500 ppm is 33.58 mN/m close to the
original value (0 ppm) of 34.77 mN/m. This is also attributed to methane supercritical properties
at reservoir conditions and surfactant properties which were affected by high temperature and
high pressure. Similar to ambient-condition results, the declining tendency in oil spreading

78
coefficient induced by surfactants also suggests the potential of enhanced oil recovery in this
strongly oil-wet system at reservoir conditions.
4.3 Effect of Surfactants on Wettability
For better analyzing the experimental visual observations and results, this section has
been divided into two sections—during surfactant injection and after surfactant injection. Three
surfactant concentrations of 500, 1500, 3000 ppm were tested in the experiments at both ambient
and reservoir conditions. The following “during surfactant injection” section contains ambient-
condition cases—two anionic surfactant cases (500 ppm and 1500 ppm) and two nonionic
surfactant cases (500 ppm and 3000 ppm) and reservoir-condition anionic surfactant cases (500
ppm, 1500 ppm and 3000 ppm) to elucidate the dynamic behavior of the condensate drop
between two substrates during surfactant injection period and how surfactants affected
wettability.
In addition, the weakly oil-wet state in which contact angles range from 115 to 135° and
strongly oil-wet state (135 ~ 180°) were defined in this study to better describe condensate drop
behavior on the solid surface.
4.3.1 During Anionic Surfactant Injection at Ambient Conditions
From Table 7, it can be seen that the interfacial tension measured between condensate
and synthetic brine without surfactants is 22.94 mN/m. It is reduced by one to two orders of
magnitude when three levels of concentration 500, 1500, 3000 ppm of the anionic surfactant
were used in the system. The total surfactant injection time is about 80 min at ambient conditions.
During this anionic surfactant injection period, the dynamic behavior of the condensate drop
between upper and lower substrates was similar for all these three surfactant concentrations. In
general, it was observed that the drop was moving on the lower substrate and then floated away

79
to the upper surface to finally end up at the top of the cell. This process happened fast and it took
only a few minutes to complete after starting anionic surfactant injection. The following sections
give a detailed discussion on the basis of experimental observations and results in the two cases
of 500 ppm and 1500 ppm brine containing surfactant.
4.3.1.1 During 500 ppm Anionic Surfactant Injection
Figure 24 illustrates the effect of 500 ppm brine containing anionic surfactant on the
dynamic behavior of the condensate drop with time during certain time steps of the surfactant
injection. The contact diameter on the lower surface, drop height and dynamic contact angles of
the condensate drop on the lower substrate surface at different times are summarized in Table 9.
Figure 25 depicts the change of the contact diameter and height of the drop with time during the
500 ppm anionic surfactant injection. The measured advancing and receding contact angles
varied with time are displayed in Figure 26 and Figure 27.
It can be seen from Figure 24 that the big condensate drop moved rapidly (picture at t= 0s
to t= 26.84 s) on the lower surface and it took only about 26 seconds after surfactant injection to
float away to the upper substrate surface. The drop on the upper surface quickly remained
suspended at the top of the cell, leaving little evidence of condensate interaction on the upper
surface as is seen in pictures corresponding to 26.84, 41.681 and 80.082 s in Figure 24. Through
the duration of 0 to 80.082 s, the contact diameter of the drop decreased as the drop varied from
the big drop to the small drop on the lower surface (Figure 24 and Table 9). And the reduction in
interfacial tension by the anionic surfactant is the main reason for decreasing the drop diameter
during this period. The measured advancing angles fluctuated around 155° and the wetting state
remained strongly oil-wet during this time, as can be seen in Table 9 and Figure 24.

80
0 s
θa = 151°
23.08 s
θa = 141° 23.44 s
23. 76 s
θa = 161° 23.92 s 26.84 s
41.681 s 80.082 s (SD)
θr = 154°
451.361 s
θa = 151° 461.921 s
462.241 s
θa = 160° 462.321 s
462.441s
462.76 s (SD1)
θr = 153°
651.16 s
θa = 136°
654.12 s
θa = 119°
655.44 s
θa = 126° 655.52 s
655.60 s 655.68 s (SD2)
θr = 141°
670.96 s
θa = 117°
673.32 s
θa = 119°
675.32 s
θa = 132° 675.56 s
675.68 s 675.76 s (SD3)
θr = 141°
692.801 s
θa = 114°
697.441 s
θa = 117°
697.801 s
θa = 136° 697.881 s
Figure 24: Photographic Depiction of Condensate Drop Dynamic Behavior during the Injection
of 500 ppm Anionic Surfactant (SD= Small Drop)

81
Table 9: Quantitative Drop Dynamic Behavior on Lower Substrate during 500 ppm Anionic
Surfactant Injection
Time, s
Dynamic Contact
Angle, ° Height,
cm
Contact Diameter
(Lower Surface),
cm
NB NB' Advancing
θa
Receding
θr
0 151 0.333 0.416 0.00 23.83
23.080 141 0.333 0.287 0.00 16.46
23.440 148 0.333 0.287 0.00 16.46
23.760 161 0.333 0.287 0.00 16.46
23.840 163 0.333 0.256 0.00 14.64
80.082 154 0.056 0.252 13.38 2.42
451.361 151 0.080 0.231 11.48 3.17
457.841 153 0.118 0.207 8.62 4.19
462.241 160 0.190 0.204 5.34 6.66
462.441 153 0.047 0.222 12.28 1.79
646.080 149 0.041 0.204 11.95 1.43
651.160 136 0.059 0.157 10.30 1.59
654.120 119 0.088 0.134 11.65 2.01
655.040 126 0.115 0.130 8.33 2.57
655.440 140 0.133 0.130 5.86 2.97
655.480 147 0.142 0.130 5.11 3.17
655.600 141 0.032 0.140 9.36 0.76
670.960 117 0.056 0.122 12.81 1.17
673.320 119 0.066 0.120 11.38 1.37
675.320 132 0.100 0.112 6.72 1.91
675.560 147 0.118 0.112 4.95 2.26
675.680 141 0.024 0.117 7.99 0.48
692.801 114 0.047 0.085 10.31 0.68
694.961 117 0.056 0.084 8.77 0.80
697.441 136 0.075 0.084 5.15 1.08
697.801 146 0.092 0.084 4.18 1.32
697.881 140 0.021 0.089 6.20 0.32
* Δρ of 0.26295 g/cm3 and σ of 1.5 mN/m were used in the Bond number calculations
NB and NB' were calculated using following equations:
( )

82
Figure 25: Variations of Condensate Drop Dimensions with Time on Lower Substrate during 500
ppm Anionic Surfactant Injection
Figure 26: Variations of Dynamic Contact
Angles with Time on Lower Substrate during
500 ppm Anionic Surfactant Injection
Figure 27: Variations of Dynamic Contact
Angles with Time during 500 ppm Anionic
Surfactant Injection (at Time Steps: 646-698 s)
Further analysis still focused on the small condensate droplet (SD) left behind on the
lower surface as the surfactant continued to be injected into the cell. The small drop did not start
0.00
0.05
0.10
0.15
0.20
0.25
0.30
0.35
0.40
0.45
0 200 400 600 800
Dro
p C
har
acte
rist
ic L
engt
h ,
cm
Time, s
drop height
drop diameter
100
105
110
115
120
125
130
135
140
145
150
155
160
165
170
100
105
110
115
120
125
130
135
140
145
150
155
160
165
170
0 200 400 600 800
Re
ced
ing
Co
nta
ct A
ngl
e, d
eg
Ad
van
cin
g C
on
tact
An
gle
, de
g
Time, s
Advancing Angle Receding Angle
area expanded in Fig. 22
Strongly Oil-Wet
Weakly Oil-Wet
Intermediate Wet
100
105
110
115
120
125
130
135
140
145
150
155
160
165
170
100
105
110
115
120
125
130
135
140
145
150
155
160
165
170
630 650 670 690 710 730
Re
ced
ing
Co
nta
ct A
ngl
e, d
eg
Ad
van
cin
g C
on
tact
An
gle
, de
g
Time, s
Advancing Angle Receding Angle
Drop Collapsing
Strongly Oil-Wet
Weakly Oil-Wet
Intermediate Wet
Drop Rising
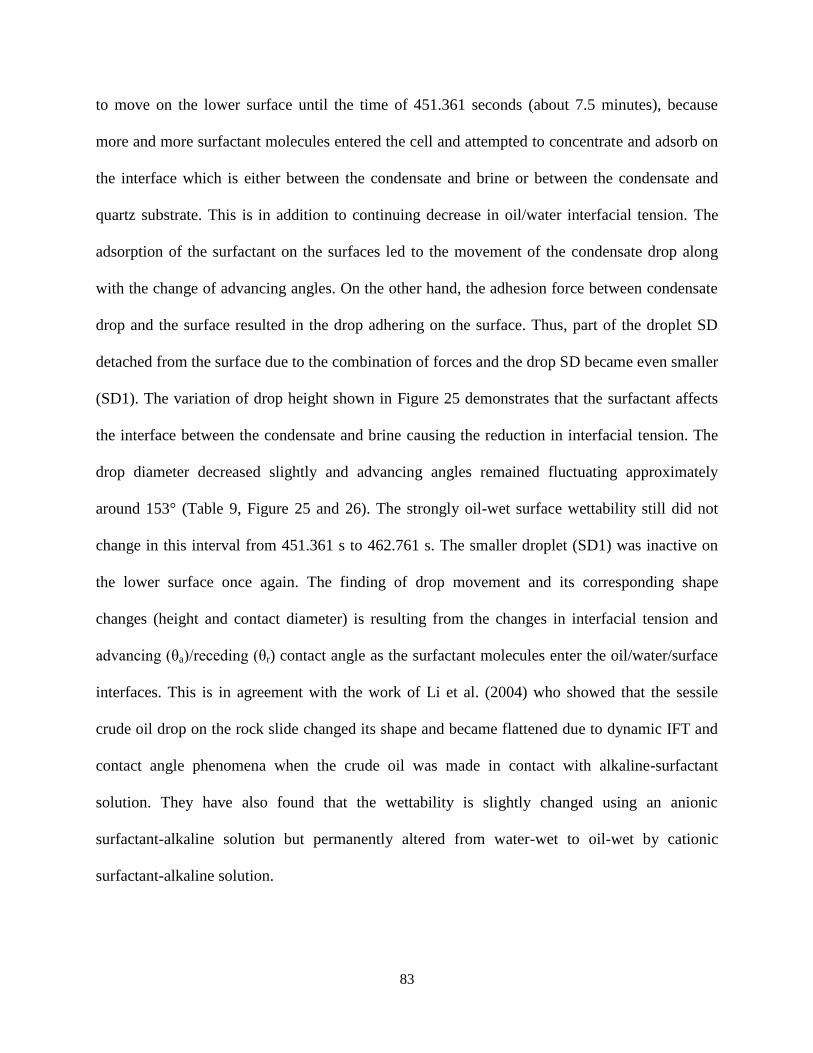
83
to move on the lower surface until the time of 451.361 seconds (about 7.5 minutes), because
more and more surfactant molecules entered the cell and attempted to concentrate and adsorb on
the interface which is either between the condensate and brine or between the condensate and
quartz substrate. This is in addition to continuing decrease in oil/water interfacial tension. The
adsorption of the surfactant on the surfaces led to the movement of the condensate drop along
with the change of advancing angles. On the other hand, the adhesion force between condensate
drop and the surface resulted in the drop adhering on the surface. Thus, part of the droplet SD
detached from the surface due to the combination of forces and the drop SD became even smaller
(SD1). The variation of drop height shown in Figure 25 demonstrates that the surfactant affects
the interface between the condensate and brine causing the reduction in interfacial tension. The
drop diameter decreased slightly and advancing angles remained fluctuating approximately
around 153° (Table 9, Figure 25 and 26). The strongly oil-wet surface wettability still did not
change in this interval from 451.361 s to 462.761 s. The smaller droplet (SD1) was inactive on
the lower surface once again. The finding of drop movement and its corresponding shape
changes (height and contact diameter) is resulting from the changes in interfacial tension and
advancing (θa)/receding (θr) contact angle as the surfactant molecules enter the oil/water/surface
interfaces. This is in agreement with the work of Li et al. (2004) who showed that the sessile
crude oil drop on the rock slide changed its shape and became flattened due to dynamic IFT and
contact angle phenomena when the crude oil was made in contact with alkaline-surfactant
solution. They have also found that the wettability is slightly changed using an anionic
surfactant-alkaline solution but permanently altered from water-wet to oil-wet by cationic
surfactant-alkaline solution.

84
After another 3 minutes (at 651.16 s), the droplet SD1 took action on the lower substrate
again owing to the continuous injection of the surfactant. A similar phenomenon occurred as
before with droplet SD. SD1 then disintegrated into the smallest droplet SD2. In the same way
SD2 repeated the whole process as SD1 did. Finally, it further reduced up to the smaller droplet
SD3 and SD3 continued to duplicate the performance of the droplet SD2. The difference
between SD1, SD2 and SD3 is that SD1 took shorter time 46.721 seconds (from 651.16 s to
697.881s of Figure 24) to transform to SD2 and SD3 due to the increase in the surfactant
concentration in the cell. This repeatable and cyclical behavior of the condensate drop on the
lower substrate can be clearly observed in Figure 24. It indicates that the surfactant activity at the
solid surface does not start immediately, but affects the surface wettability gradually as the
surfactant molecules diffuse to and interact at oil/rock interface.
The diameter of the droplet showed a decreasing trend with time in Figure 25. This
means that the three-phase contact line did move on the lower surface. Carefully checking the
diameter data in Table 9, it can be seen that the diameter of the droplet did not reduce at certain
times. For instance, the diameter of 0.140 cm at 655.60 s is larger than 0.130 cm at 654.44 s. The
possible explanation for this is that the gravity force exerted on the droplet pulled it down against
the surface. The droplet has to be stretched and spread on the surface causing its diameter to
increase. Corresponding to this spreading action, the contact angle switches to the receding angle
at these particular times as shown in Table 9. Since the oil drop is spreading on the surface that
was oil wet, the receding angles are also quite high. This leaving action of the drop allows more
surfactant molecules to enter the oil/rock interface enabling further wetting alteration.
Also, it is worth noting here that the advancing contact angles distinctly changed during
the period of 651.156 s to 697.881 s. Figure 27 gives the detailed plot of the advancing angles

85
with time in this short period. From Figure 27, the advancing contact angles cyclically changed
three times as the droplet SD1 disintegrated to the smallest droplet SD3. The advancing angles
varied from 149° to 119° for the first time. And the angles changed from the high values of 147°
and 146° to the low values of 117° and 114° for the last two times. The alteration of advancing
angles proves that the preferentially strongly oil-wet quartz surface has been changed to weakly
oil-wet or intermediate-wet by the 500 ppm surfactant treatment. The similar dynamic behavior
of crude oil was observed on the rock surface during surfactant injection into the oil-wet
fractured reservoir (Ayirala et al., 2006), and the reservoir wettability was believed to alter from
an initially strongly oil-wet state to less oil-wet or intermediate wet state induced by the
surfactant.
4.3.1.2 During 1500 ppm Anionic Surfactant Injection
The photographic sequence of condensate drop behavior on the lower surface at certain
time steps for 1500 ppm anionic surfactant injection, recorded by the video camera from the
experiment, is given in Figure 28. And Table 10 describes the changes of the dynamic contact
angles (advancing and receding), diameter and height of the condensate drop during this period.
Variations of condensate drop characteristic lengths (diameter and height) and dynamic contact
angles are plotted against contact time in Figure 29 and 30, respectively.
It is clear to see that the drop contact diameter on the lower substrate changed
significantly from 0.755 cm at 0 s to 0.260 cm at 32.636 s as shown in Figure 28, 29 and Table
10. It indicates the significant movement of the three phase contact line on the lower surface due
to surfactant injection. Also, the measured advancing contact angles altered from 145° to 110°
(Table 10 and Figure 29). The time of 32.636 seconds consumed to complete this process is
much faster than 670.96 seconds (about 11 minutes) in the 500 ppm surfactant injection. This
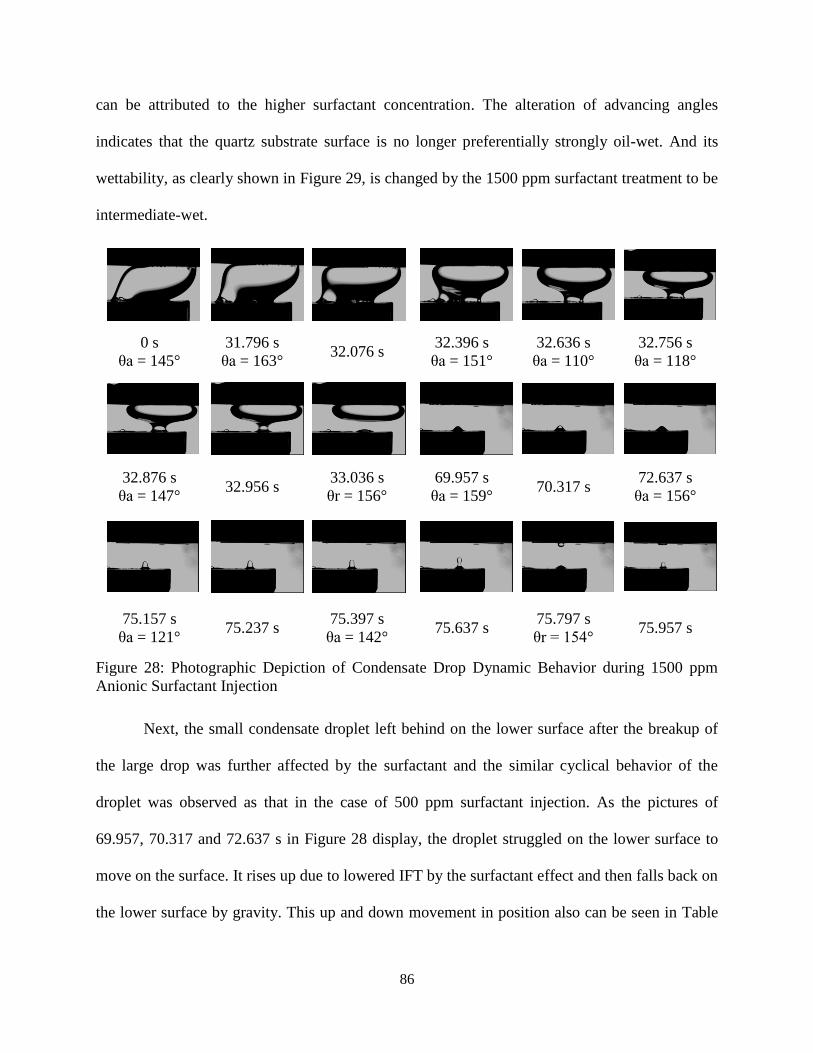
86
can be attributed to the higher surfactant concentration. The alteration of advancing angles
indicates that the quartz substrate surface is no longer preferentially strongly oil-wet. And its
wettability, as clearly shown in Figure 29, is changed by the 1500 ppm surfactant treatment to be
intermediate-wet.
0 s
θa = 145°
31.796 s
θa = 163° 32.076 s
32.396 s
θa = 151°
32.636 s
θa = 110°
32.756 s
θa = 118°
32.876 s
θa = 147° 32.956 s
33.036 s
θr = 156°
69.957 s
θa = 159° 70.317 s
72.637 s
θa = 156°
75.157 s
θa = 121° 75.237 s
75.397 s
θa = 142° 75.637 s
75.797 s
θr = 154° 75.957 s
Figure 28: Photographic Depiction of Condensate Drop Dynamic Behavior during 1500 ppm
Anionic Surfactant Injection
Next, the small condensate droplet left behind on the lower surface after the breakup of
the large drop was further affected by the surfactant and the similar cyclical behavior of the
droplet was observed as that in the case of 500 ppm surfactant injection. As the pictures of
69.957, 70.317 and 72.637 s in Figure 28 display, the droplet struggled on the lower surface to
move on the surface. It rises up due to lowered IFT by the surfactant effect and then falls back on
the lower surface by gravity. This up and down movement in position also can be seen in Table

87
10 and Figure 29 because the droplet contact diameter first decreased and then increased but its
height followed the reverse trend. At the same time, the advancing contact angle alternated to the
receding angle owing to the alteration of water /oil interface on the surface.
The subsequent dynamic behavior of the condensate droplet was similar to that in the 500
ppm surfactant injection case. With the increase of the surfactant concentration, the droplet was
impelled to action again on the lower substrate. And this time it did not fail to change itself and
disintegrate into a smaller droplet (the picture of 75.157 s through the picture 75.957 s in Figure
28). The measured advancing angles range from 160° to 121° revealed the alteration of the
wettability from strongly oil-wet to weakly oil-wet (see Figure 30). As before, this process kept
repeated for several times (Figures not shown) as more and more surfactant solution was injected
and finally only a trace of condensate was left on the lower surface.
Figure 29: Variations of Condensate Drop
Dimensions vs. Time on Lower Substrate
during 1500 ppm Anionic Surfactant Injection
Figure 30: Variations of Dynamic Contact
Angles with Time on Lower Substrate during
1500 ppm Anionic Surfactant Injection
0
0.1
0.2
0.3
0.4
0.5
0.6
0.7
0.8
31.5 36.5 41.5 46.5 51.5 56.5 61.5 66.5 71.5 76.5
Dro
p C
har
acte
rist
ic L
en
gth
, cm
Time, s
drop diameter
drop height
100
105
110
115
120
125
130
135
140
145
150
155
160
165
170
175
100
105
110
115
120
125
130
135
140
145
150
155
160
165
170
175
31.5 36.5 41.5 46.5 51.5 56.5 61.5 66.5 71.5 76.5
Re
ced
ing
Co
nta
ct A
ngl
e, d
eg
Ad
van
cin
g C
on
tact
An
gle
, de
g
Time, s
Advancing Angle Receding Angle
Strongly Oil-Wet
Weakly Oil-Wet
Intermediate Wet

88
Table 10: Quantitative Drop Dynamic Behavior on Lower Substrate during 1500 ppm Anionic
Surfactant Injection
Time, s
Dynamic Contact
Angle, ° Height,
cm
Contact Diameter
(Lower Surface),
cm
NB NB' Advancing
θa
Receding
θr
0 145 0.326 0.755 0.00 42.28
31.796 163 0.326 0.755 0.00 42.28
32.076 155 0.326 0.727 0.00 40.71
32.396 151 0.326 0.595 0.00 33.31
32.636 110 0.326 0.260 0.00 14.53
32.756 118 0.076 0.256 23.44 3.34
32.876 147 0.098 0.251 11.70 4.25
32.956 160 0.118 0.236 8.97 4.80
33.036 156 0.029 0.243 13.57 1.20
69.957 159 0.053 0.190 9.54 1.73
70.137 158 0.059 0.174 8.58 1.76
72.637 156 0.055 0.185 9.44 1.74
75.157 121 0.092 0.144 10.59 2.28
75.237 134 0.098 0.144 8.08 2.43
75.397 142 0.108 0.144 6.84 2.66
75.637 160 0.136 0.144 4.98 3.37
75.797 154 0.035 0.162 9.01 0.97
* Δρ of 0.26298 g/cm3 and σ of 1.5 mN/m were used in the Bond number calculations
NB and NB' were calculated using following equations:
( )
4.3.2 During Nonionic Surfactant Injection at Ambient Conditions
In the three concentrations of 500, 1500, 3000 ppm of the nonionic surfactant cases, the
slight movement of the condensate drop on the lower substrate was observed in two cases of
lower concentrations 500 ppm and 1500 ppm surfactant injection. And for the highest
concentration of 3000 ppm surfactant solution, the drop did change its location on the lower
surface and floated away to the upper surface. However, part of the drop on the upper surface

89
strongly attached to the upper surface and did not dislodge. Two cases 500 ppm and 3000 ppm
surfactant solutions are given as the examples to elucidate the process when the surfactant
solutions were injected into the cell.
4.3.2.1 During 500 ppm Nonionic Surfactant Injection
The photographic sequence of condensate drop behavior on the lower surface is shown in
Figure 31 for 500 ppm nonionic surfactant injection. And in Table 11 is presented the variations
of the advancing contact angle, contact diameter and height of the condensate drop and Bond
Number with contact time. Figure 32 and 33 illustrate the plots of condensate drop characteristic
length (diameter and height) and advancing contact angle verse time.
0 s 18.441 s 33.401 s 59.802 s
133.400 s 193.081 s 264.962 s 358.991 s
481.00 s 489.641 s 656.020 s 778.961 s
Figure 31: Photographic Depiction of Condensate Drop Dynamic Behavior during 500 ppm
Nonionic Surfactant Injection
An obvious and direct observation from Figure 31 is that the condensate drop seemed
stable between the two quartz substrates and no smaller droplet was formed during the surfactant
injection period. In fact, a slight change of the drop position on the lower surface was found as
shown in Table 11 and Figure 32. The diameter of the condensate drop decreased from initial
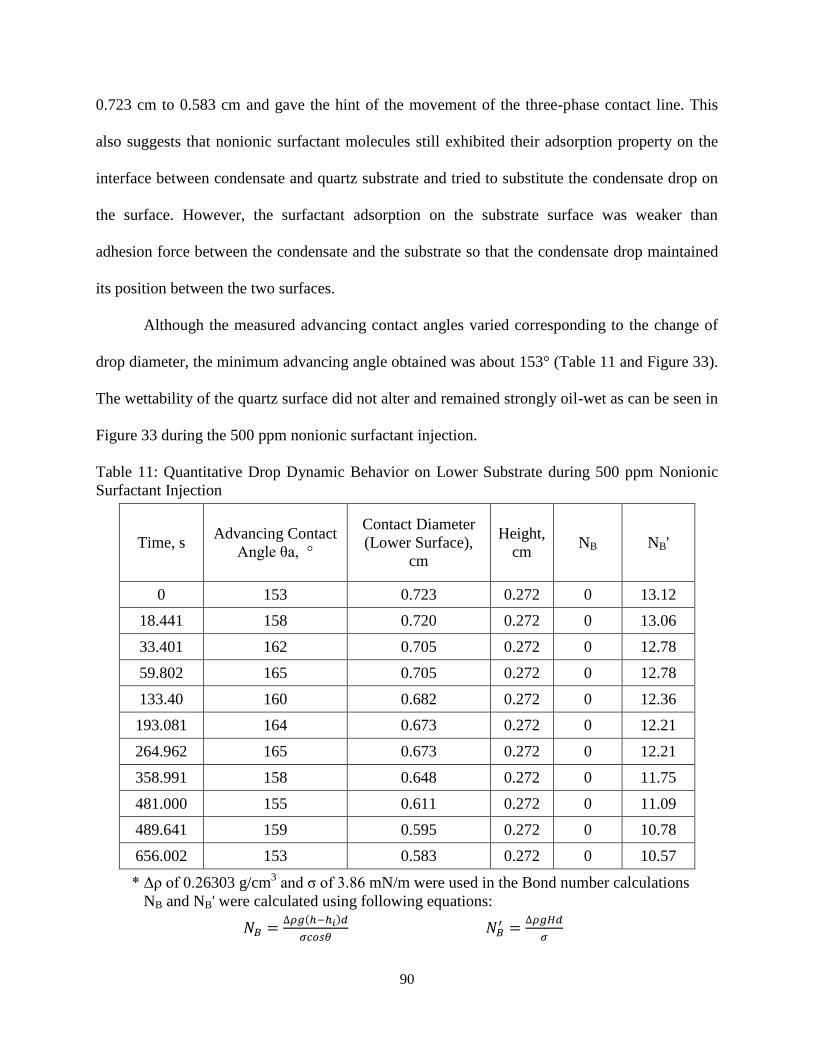
90
0.723 cm to 0.583 cm and gave the hint of the movement of the three-phase contact line. This
also suggests that nonionic surfactant molecules still exhibited their adsorption property on the
interface between condensate and quartz substrate and tried to substitute the condensate drop on
the surface. However, the surfactant adsorption on the substrate surface was weaker than
adhesion force between the condensate and the substrate so that the condensate drop maintained
its position between the two surfaces.
Although the measured advancing contact angles varied corresponding to the change of
drop diameter, the minimum advancing angle obtained was about 153° (Table 11 and Figure 33).
The wettability of the quartz surface did not alter and remained strongly oil-wet as can be seen in
Figure 33 during the 500 ppm nonionic surfactant injection.
Table 11: Quantitative Drop Dynamic Behavior on Lower Substrate during 500 ppm Nonionic
Surfactant Injection
Time, s Advancing Contact
Angle θa, °
Contact Diameter
(Lower Surface),
cm
Height,
cm NB NB'
0 153 0.723 0.272 0 13.12
18.441 158 0.720 0.272 0 13.06
33.401 162 0.705 0.272 0 12.78
59.802 165 0.705 0.272 0 12.78
133.40 160 0.682 0.272 0 12.36
193.081 164 0.673 0.272 0 12.21
264.962 165 0.673 0.272 0 12.21
358.991 158 0.648 0.272 0 11.75
481.000 155 0.611 0.272 0 11.09
489.641 159 0.595 0.272 0 10.78
656.002 153 0.583 0.272 0 10.57
* Δρ of 0.26303 g/cm3 and σ of 3.86 mN/m were used in the Bond number calculations
NB and NB' were calculated using following equations:
( )
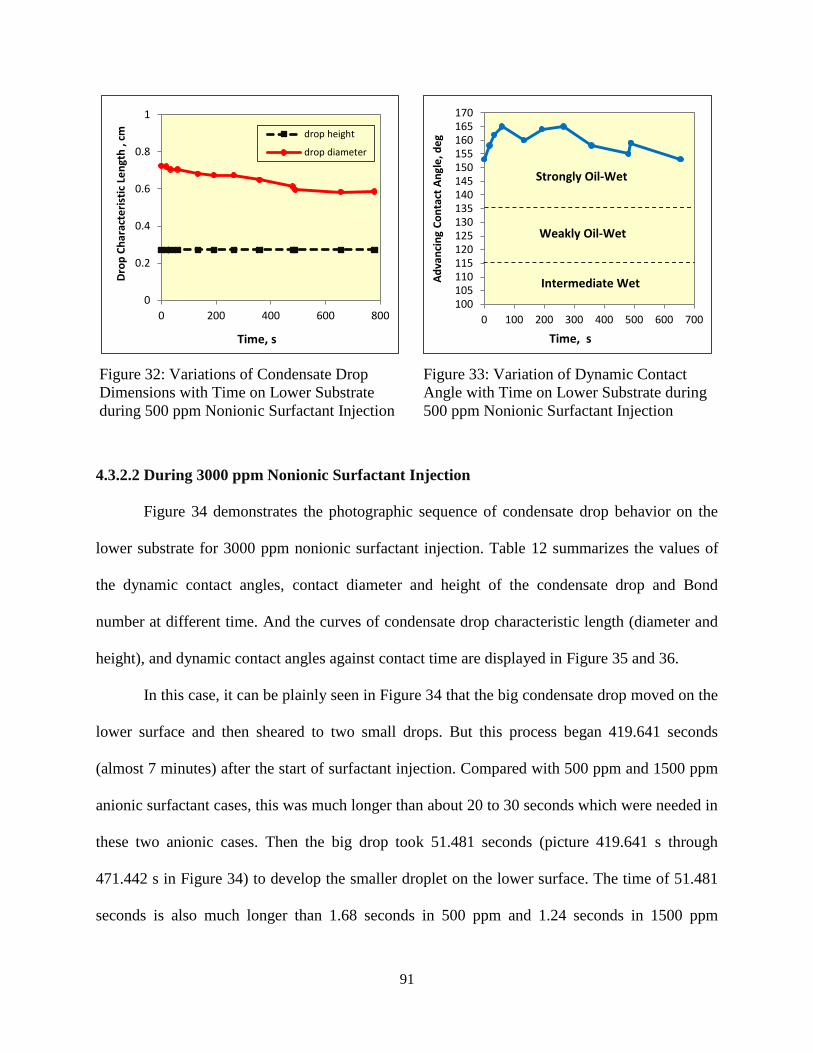
91
Figure 32: Variations of Condensate Drop
Dimensions with Time on Lower Substrate
during 500 ppm Nonionic Surfactant Injection
Figure 33: Variation of Dynamic Contact
Angle with Time on Lower Substrate during
500 ppm Nonionic Surfactant Injection
4.3.2.2 During 3000 ppm Nonionic Surfactant Injection
Figure 34 demonstrates the photographic sequence of condensate drop behavior on the
lower substrate for 3000 ppm nonionic surfactant injection. Table 12 summarizes the values of
the dynamic contact angles, contact diameter and height of the condensate drop and Bond
number at different time. And the curves of condensate drop characteristic length (diameter and
height), and dynamic contact angles against contact time are displayed in Figure 35 and 36.
In this case, it can be plainly seen in Figure 34 that the big condensate drop moved on the
lower surface and then sheared to two small drops. But this process began 419.641 seconds
(almost 7 minutes) after the start of surfactant injection. Compared with 500 ppm and 1500 ppm
anionic surfactant cases, this was much longer than about 20 to 30 seconds which were needed in
these two anionic cases. Then the big drop took 51.481 seconds (picture 419.641 s through
471.442 s in Figure 34) to develop the smaller droplet on the lower surface. The time of 51.481
seconds is also much longer than 1.68 seconds in 500 ppm and 1.24 seconds in 1500 ppm
0
0.2
0.4
0.6
0.8
1
0 200 400 600 800
Dro
p C
har
acte
rist
ic L
en
gth
, cm
Time, s
drop height
drop diameter
100105110115120125130135140145150155160165170
0 100 200 300 400 500 600 700
Ad
van
cin
g C
on
tact
An
gle
, de
g
Time, s
Strongly Oil-Wet
Weakly Oil-Wet
Intermediate Wet

92
anionic surfactant cases, respectively, implying that the anionic surfactant is more effective than
the nonionic surfactant in reducing interfacial tension and altering wettability.
0 s 293.00 s 419.641 s 425.121 s 430.041 s
438.081 s 454.282 s 466.002 s 468.962 s 471.122 s
471.442 s 477.962 s 778.002 s 4707.760 s
Figure 34: Photographic Depiction of Condensate Drop Dynamic Behavior during 3000 ppm
Nonionic Surfactant Injection
Furthermore, Figure 35 displays the sharp change of the drop characteristic length from
0.381 cm to 0.039 cm for diameter and from 0.317 cm to 0.013 cm for height. This indicates the
three-phase contact line moving significantly on the lower substrate. However, the distinct
change of the condensate drop location resulted from the increase of the surfactant concentration
and the adhesion of the condensate to the quartz surface still tends to be stronger than the
surfactant adsorption. Thus, the small droplet on the lower surface did not rise up and float away
to the upper surface like that observed in the cases of the anionic surfactant, and the droplet
seems to be stable on the surface (in the pictures of 477.962 s and 778.002 s of Figure 34).
However, the surfactant molecules still influenced the droplet as more surfactant entered the cell.
This led to the diameter and height of the droplet slightly changing during this period as shown
in Table 12 and Figure 35.

93
Table 12: Quantitative Drop Dynamic Behavior on Lower Substrate during 3000 ppm Nonionic
Surfactant Injection
Time, s Advancing contact
angle θa, °
Contact Diameter
(Lower Surface),
cm
Height,
cm NB NB'
0 151 0.381 0.317 0 10.25
293.000 163 0.381 0.317 0 10.25
419.641 157 0.350 0.317 0 9.42
425.121 160 0.338 0.317 0 9.08
430.041 162 0.338 0.317 0 9.08
438.081 164 0.321 0.317 0 8.62
454.282 162 0.296 0.317 0 7.95
466.002 162 0.280 0.317 0 7.53
468.962 164 0.280 0.042 6.79 1.00
471.122 166 0.268 0.042 6.43 0.96
471.442 151 0.081 0.025 2.29 0.17
477.962 155 0.079 0.025 2.29 0.17
778.002 155 0.073 0.024 2.30 0.15
4707.760 159 0.039 0.013 1.08 0.04
*Δρ of 0.26316 g/cm3 and σ of 3.04 mN/m were used in the Bond number calculations.
NB and NB' were calculated using following equations:
( )
Figure 35: Variations of Condensate Drop
Dimensions with Time on Lower Substrate
during 3000 ppm Nonionic Surfactant
Injection
Figure 36: Variation of Dynamic Contact
Angle with Time for Condensate Drop on
Lower Substrate during 3000 ppm Nonionic
surfactant Injection
0
0.1
0.2
0.3
0.4
0.5
0.6
0 200 400 600 800
Dro
p C
har
acte
rist
ic L
en
gth
, cm
Time, sec
drop diameter
drop height
100
105
110
115
120
125
130
135
140
145
150
155
160
165
170
0 100 200 300 400 500 600 700 800
Ad
van
cin
g C
on
tact
An
gle
, de
g
Time, sec
Strongly Oil-Wet
Weakly Oil-Wet
Intermediate Wet

94
The measured advancing contact angles also changed in response to the dynamic
condensate drop behavior from the maximum value of 166° to the minimum 151° (Table 12 and
Figure 36). It is observed from Figure 36 that no transition exists between strongly oil-wet and
weakly oil-wet. The quartz surface still retained the strongly oil-wet nature during the 3000 ppm
nonionic surfactant injection.
4.3.3 Summary of Results during Surfactant Injection at Ambient Conditions
Both the anionic and nonionic surfactants at three concentrations of 500, 1500 and 3000
ppm were examined at ambient conditions to investigate their wettability altering capability by
measuring dynamic contact angles for this condensate reservoir. Figure 37 shows the effect of
anionic and nonionic surfactants on interfacial tensions between condensate and synthetic brine
and advancing contact angles. It can be seen from Figure 37 that interfacial tension was reduced
by two orders of magnitude by the anionic surfactant and only one order of magnitude by the
nonionic surfactant. Advancing contact angles measured in different concentrations of nonionic
surfactant systems were higher than those in anionic surfactant systems. Larger advancing
contact angles (>150°) shown in Figure 37 indicates that even using the high concentration (3000
ppm) of the nonionic surfactant could not alter the strong oil wettability. However, in all three
anionic surfactant concentration cases, the wettability of the quartz surface was changed from
strongly oil-wet to intermediate-wet as can be found in Figure 37. Hence, the anionic surfactant
is more effective than the nonionic surfactant to alter the wettability in this condensate reservoir
case.
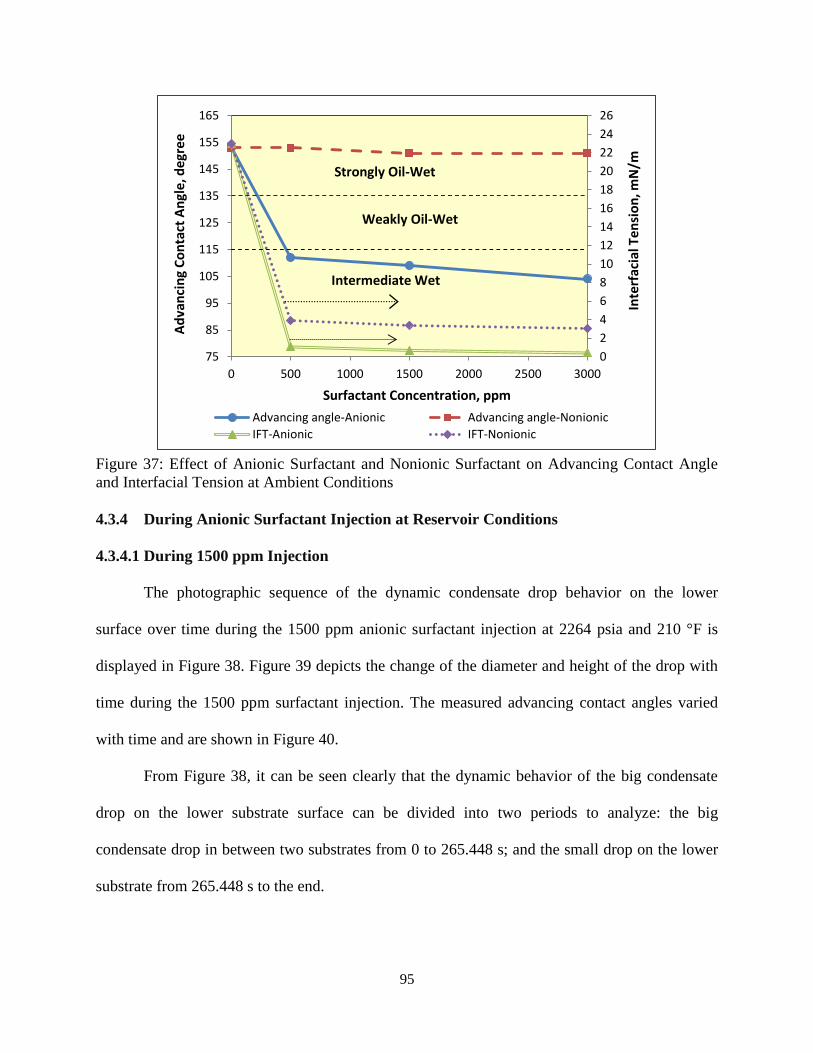
95
Figure 37: Effect of Anionic Surfactant and Nonionic Surfactant on Advancing Contact Angle
and Interfacial Tension at Ambient Conditions
4.3.4 During Anionic Surfactant Injection at Reservoir Conditions
4.3.4.1 During 1500 ppm Injection
The photographic sequence of the dynamic condensate drop behavior on the lower
surface over time during the 1500 ppm anionic surfactant injection at 2264 psia and 210 °F is
displayed in Figure 38. Figure 39 depicts the change of the diameter and height of the drop with
time during the 1500 ppm surfactant injection. The measured advancing contact angles varied
with time and are shown in Figure 40.
From Figure 38, it can be seen clearly that the dynamic behavior of the big condensate
drop on the lower substrate surface can be divided into two periods to analyze: the big
condensate drop in between two substrates from 0 to 265.448 s; and the small drop on the lower
substrate from 265.448 s to the end.
0
2
4
6
8
10
12
14
16
18
20
22
24
26
75
85
95
105
115
125
135
145
155
165
0 500 1000 1500 2000 2500 3000
Inte
rfac
ial T
ensi
on
, mN
/m
Ad
van
cin
g C
on
tact
An
gle,
deg
ree
Surfactant Concentration, ppm
Advancing angle-Anionic Advancing angle-Nonionic
IFT-Anionic IFT-Nonionic
Intermediate Wet
Weakly Oil-Wet
Strongly Oil-Wet

96
Figure 38: Photographic Depiction of Condensate Drop Dynamic Behavior during the 1500 ppm
Anionic Surfactant Injection at 2264 psia and 210 °F
In the first period (0-265.448 s), the big condensate drop in between two substrates
underwent movement on the lower surface, forming the drop neck and shearing into two small
drops — slightly larger drop on the upper surface and smaller drop on the lower surface, quite
similar to the observation at ambient conditions presented earlier. As more and more surfactant
entered the cell, the upper condensate drop spread on the surface, floated away to the top of the
optical cell due to the reduced interfacial tension (less than 1.22 mN/m) and then left a trace of
condensate on the upper surface as shown in pictures at 128.711 to 265.448 s of Figure 38. The
drop diameter measured in this period decreased from initial 0.51 cm to 0.25 cm as shown in
Figure 39, indicating the movement of three phase contact line (TPCL) on the lower surface. The
advancing contact angle corresponding to this period of drop movement (Figure 40) changed

97
from 153° to 120°. This demonstrates the wettability alteration from initially strongly oil-wet to
intermediate wet.
Figure 39: Variations of Condensate Drop
Dimensions with Time on Lower Substrate
during 1500 ppm Anionic Surfactant Injection
at 2264 psia and 210 °F
Figure 40: Variation of Advancing Contact
Angle with Time for Condensate Drop on
Lower Substrate during 1500 ppm Anionic
Surfactant Injection at 2264 psia and 210 °F
Next period (from 265.448 s to the end), the dynamic behavior of the small condensate
drop on the lower surface from 332.682 s to 415.031 s was also similar to the observations at
ambient conditions discussed earlier. The small condensate drop on the lower surface kept rising
up until the last part of the drop dislodged from the rest while the reminder collapsed back on the
lower surface forming a smaller droplet, as displayed in pictures at 332.682 s through 415.031 s
of Figure 38. This dynamic behavior of the condensate drop is the result of the combination of
forces. Surfactant molecules adsorbed on the interface which was either between condensate and
brine or between condensate and quartz substrate surface. This adsorption on the interface led to
the movement of the drop on the surface and a decrease in cohesion force within the condensate
phase. The buoyancy force was stronger than the cohesion force but still weaker than adhesion
force resulting in part of the condensate drop leaving from the surface. The variation of the drop
0
0.1
0.2
0.3
0.4
0.5
0.6
0 100 200 300 400 500
Dro
p C
har
acte
rist
ic L
en
gth
, cm
Time, s
drop height
drop diameter
100
105
110
115
120
125
130
135
140
145
150
155
160
165
170
0 50 100 150 200 250 300 350 400 450 500
Ad
van
cin
g C
on
tact
An
gle
, de
g
Time, s
Weakly Oil-Wet
Strongly Oil-Wet
Intermediate Wet

98
height from low (0.067 cm) to high (0.203 cm) and then to low value (0.40 cm) and the
movement of TPCL in this period as shown in Figure 39 also demonstrate that surfactant
molecules affect the interfaces between condensate and brine as well as that between brine and
rock surface and reduce the cohesive force within the condensate phase. The corresponding
contact angle form 153° to 132° measured in this period (Figure 40) indicates the wettability
altered from strongly oil-wet to weakly oil-wet.
Compared with the case of 1500 ppm anionic surfactant injection at ambient conditions,
it took longer (287 seconds from 128.711s to 415.031s in Figure 38) for the small drop on the
lower surface to rise up and disintegrate into a smaller droplet in the second period at reservoir
conditions. The same process took about 34 seconds at ambient conditions. Also, at reservoir
conditions this drop “rising-collapsing-rising” process only occurred once but, at ambient
conditions, it happened several times until the whole drop floated away from the surface. Hence,
at ambient conditions, the cycling dynamic behavior of the condensate drop on the lower surface
was clearly observed especially in the case of 500 ppm surfactant injection. The one possible
reason is that this anionic surfactant activity on the surface at reservoir conditions is less
effective compared with its property at ambient conditions. The wettability was altered from
strongly oil-wet to intermediate-wet at ambient conditions however at reservoir conditions the
reservoir still has a weakly oil-wet nature even at a surfactant concentration of 1500ppm.
The other reason is the density difference (Δρ) between condensate and brine containing
surfactant solution. Table 13 lists the densities of 1500 ppm brine containing surfactant and
condensate at both reservoir and ambient conditions. From Table 13, the condensate density of
0.89420 g/cm3 at reservoir conditions due to compressibility of condensate is higher than
0.73439 g/cm3 at ambient conditions; on the contrary, the density of 1500 ppm surfactant

99
solution at reservoir conditions is lower than that at ambient conditions. Therefore, the density
difference (Δρ) at reservoir conditions is about 0.0777 g/cm3
less than the difference of 0.265
g/cm3 at ambient conditions. The higher condensate density at reservoir conditions of 2264 psia
and 210 °F indicates a stronger cohesion within the condensate phase. When the small drop
disintegrated into the smaller droplets, it was difficult for the buoyancy force to exceed cohesion
force due to the high density of condensate although surfactant molecules continued to affect the
fluid-fluid and rock-fluids interface.
Table 13: Densities of 1500 ppm Anionic Surfactant Solution and Condensate at Reservoir and
Ambient Conditions
Density, g/cm3 Reservoir Conditions Ambient Conditions
ρ1500ppm 0.97192 0.99953
ρcondensate 0.89420 0.73439
Δρ 0.07772 0.26514
Another interesting observation can be seen from Figure 38 that the smaller condensate
drop on the lower quartz surface started moving on the surface from the left side to the right side
starting from the time step of 332.682 s. Especially from the time step of 414.464 s to the
511.828 s in Figure 38, it can be clearly found moving on the surface until it was blocked from
being seen by the crystal holder. A possible explanation for this phenomenon, firstly, is due to
the low density difference between condensate and surfactant solution as explained in the above
paragraph. Secondly, the orientation of surfactant molecules on the lower surface influences the
dynamic behavior of the condensate drop. Figure 41 illustrates the schematic orientation of
surfactant molecules on the surface. As shown in Figure 41, the condensate drop was not located
in the center of the lower substrate. The space on the surface to the left of the drop is smaller
than the right space. In other words, more space on the right side of the quartz surface was

100
exposed to the brine. After surfactant injection, for the surface of the right-side of the condensate
drop, a water-wet nature led to the surfactant molecules arranging themselves with hydrophobic
tail away from the surface as shown in Figure 41. For the surface on the left-side of the drop, the
surfactant orientation is also depicted in Figure 41. The left side of the substrate was exposed to
the condensate drop because the condensate drop was placed close to the left edge of the quartz
substrate. As the surfactant was introduced into the cell, on the left side of the lower surface, the
surfactant molecules were oriented with the hydrophilic heads away from the surface due to the
oil-wet nature of the surface. The small drop rose on the surface due to a large Bond number
(Figure 56 in Section 4.4) but it could not float away owing to the small density difference
between brine containing surfactant and condensate. It collapsed on the surface but not on the
previous position because on the left side of the drop the surfactant molecules repelled it while
on the right side they attracted it. Another possibility is the Marangoni flow effect caused by the
interfacial tension gradient across the condensate drop phase. This created a force difference
leading to the condensate drop moving on the surface from the left to the right in the manner of
alternately rising and collapsing. Also, on the path in which the drop moved, a trace of
condensate was left as can be seen in pictures 485.402 s through 511.828 s of Figure 38, which is
caused by oil-wet nature of the surface.
Figure 41: Schematic of Surfactant Orientation Mechanism on Lower Substrate Surface
Hydrophilic
head Repulsion
Oil film Water film
Attraction
Oil
Hydrophobic
tail

101
4.3.4.2 During 500 ppm Injection
Figure 42 illustrates the effect of 500 ppm brine containing anionic surfactant on the
dynamic behavior of the condensate drop with time during the surfactant injection period at
reservoir conditions of 2264 psia and 210 °F. Variation of condensate drop characteristic length
(diameter and height) and dynamic contact angles are plotted against contact time in Figure 43
and Figure 44, respectively.
Figure 42: Photographic Depiction of Condensate Drop Dynamic Behavior during the 500 ppm
Anionic Surfactant Injection at 2264 psia and 210 °F
In this 500 ppm surfactant injection case, it can be seen from Figure 42 that the big
condensate drop moved on the lower quartz surface after starting to introduce anionic surfactant
to the system. An obvious observation from Figure 42 is that before this large drop broke into
two smaller drops (time step 290.954 s), the advancing contact angles were still large although
the three phase contact line moved on the lower surface. This is evidenced by large values of the
measured advancing contact angles and drop diameters in Figure 43 and Figure 44, respectively.
In other words, during this period from 0 s to 290.954 s, a reduction in interfacial tension from

102
initial 9.10 at 0 ppm to 1.22 mN/m at 500 ppm (Table 6) between condensate and brine caused
by the surfactant is the main reason for the movement of TPCL.
Figure 43: Variations of Condensate Drop
Dimensions with Time on Lower Substrate
during the 500 ppm Anionic Surfactant
Injection at 2264 psia and 210 °F
Figure 44: Variation of Advancing Contact
Angle with Time for Condensate Drop on
Lower Substrate during 500 ppm Anionic
surfactant Injection at 2264 psia and 210 °F
After the time step 290.954 s, the big drop sheared into two smaller drops as shown in
picture at 291 s of Figure 42. The small condensate drop on the upper surface spread on the
upper surface and floated away to the top of the optical cell. On the upper surface at last only a
trace of condensate was left (see pictures 291 s through 501.457 s in Figure 42).
However, from Figure 42, another small condensate drop located on the lower surface
appeared stable on the surface for 3.5 minutes (291 s to 501.457 s). There was no obvious
process of alternate drop rising and collapsing similar to what occurred in the case of 1500 ppm
surfactant injection. However, as more surfactant molecules were injected into the HPHT optical
cell, the phenomenon of the small drop moving on the surface from the left to the right (579.402
s to 687.043 s of Figure 42) similar to that in1500 ppm case was observed. The reasons for this
0
0.1
0.2
0.3
0.4
0.5
0.6
0.7
0.8
0 100 200 300 400 500
Dro
p C
har
acte
rist
ic L
en
gth
, cm
Time, s
drop height
drop diameter
100
105
110
115
120
125
130
135
140
145
150
155
160
165
170
0 50 100 150 200 250 300 350
Ad
van
cin
g C
on
tact
An
gle
, de
g
Time, s
Strongly Oil-Wet
Intermediate Wet
Weakly Oil-Wet

103
movement are the same as in the previous 1500 ppm case: low density difference, surfactant
molecules orientation on the surface and the Marangoni flow effect.
Although the measured advancing contact angles also varied with time, the minimum
advancing angle obtained was about 153° (Figure 44). The wettability of the quartz surface was
not altered and remained strongly oil-wet as displayed in Figure 44 during the 500 ppm anionic
surfactant injection at reservoir pressure 2264 psia and temperature 210 °F. In the same
concentration case at ambient conditions, it did change the wettability from strongly oil-wet to
weakly oil-wet or intermediate wet. This indicates that this surfactant is less effective in altering
wettability at reservoir conditions and its surface active properties were affected by pressure and
temperature. It also further emphasized the facts that rock-fluid interactions depend on pressure
and temperature and that such measurement should be made at reservoir conditions.
4.3.4.3 During 3000 ppm Injection
The photographic sequence of condensate drop behavior on the lower surface is
demonstrated in Figure 45 for 3000 ppm anionic surfactant injection. Figure 46 and 47 illustrate
the plots of condensate drop characteristic length (diameter and height) and advancing contact
angle versus time.
In this 3000 ppm case, the experimental procedure of the surfactant injection was slightly
different from above two cases. After completing DDDC experiment, the lower substrate was
moved back laterally instead of immediately injecting surfactant into the HPHT optical cell, as
shown in pictures “After DDDC” and 0 s of Figure 45. This movement created the equilibrium
receding angle equaled to 65°. Then the 3000 ppm surfactant solution was introduced to the cell.

104
Figure 45: Photographic Depiction of Condensate Drop Dynamic Behavior during the 3000 ppm
Anionic Surfactant Injection at 2264 psia and 210 °F
Figure 46: Variations of Condensate Drop
Dimensions with Time on Lower Substrate
during the 3000 ppm Anionic Surfactant
Injection at 2264 psia and 210 °F
Figure 47: Variation of Advancing Contact
Angle with Time for Condensate Drop on
Lower Substrate during 3000 ppm Anionic
surfactant Injection at 2264 psia and 210 °F
From Figure 45, the big condensate drop quickly broke into two small drops especially
after the drop neck was formed at time step 250.004 second and it took only 0.3 second (from
250.004 s to 250.337 s) due to higher surfactant concentration. During this period, the drop
0
0.05
0.1
0.15
0.2
0.25
0.3
0.35
0.4
190 210 230 250 270
Dro
p C
har
acte
rist
ic L
en
gth
, cm
Time, s
drop diameter
drop height
100
105
110
115
120
125
130
135
140
145
150
155
160
165
249.6 249.8 250 250.2 250.4
Ad
van
cin
g C
on
tact
An
gle
, de
g
Time, s
Weakly oil-wet
Strongly oil-wet
Intermediate wet

105
moved on the lower surface resulting in a movement of TPCL (corresponding to a decrease of
drop height and diameter) and a change of advancing contact angles as can be seen in Figure 46
and 47. The alteration of advancing angles indicates that the quartz substrate surface is no longer
preferentially strongly oil-wet by nature. And its wettability clearly shown in Figure 47 is altered
by the 3000 ppm surfactant treatment to be intermediate-wet or weakly oil-wet.
After the time step of 250.337 s, the small drop on the upper surface spread on the upper
surface and floated away to the top of the optical cell as well due to the low interfacial tension
induced by the surfactant. Obviously alternate drop rising and collapsing was not observed for
the smaller droplet on the lower surface. And this small droplet behaved in a similar manner to
the before mentioned 500 and 1500 ppm cases. It moved on the lower surface from the left to the
right as shown in pictures 270.715 s to 286.931 s of Figure 45. This movement is also attributed
to low density difference, surfactant molecules orientation on the surface and the Marangoni
flow effect.
4.3.4.4 Summary of Results at Reservoir Conditions
The anionic surfactant at three concentrations of 500, 1500 and 3000 ppm was tested to
investigate its wettability altering capability by measuring dynamic contact angles for this
particular condensate reservoir at reservoir conditions (2264 psia and 210 °F). The effect of this
anionic surfactant on interfacial tensions (condensate-water and CH4-water), spreading
coefficient and advancing contact angles at reservoir conditions is plotted in Figure 48. It can be
seen from Figure 48 that in the low concentration (500 ppm) case the values of IFT, spreading
coefficient and advancing contact angle are much higher than those in the 1500 ppm and 3000
ppm cases. This indicates that this anionic surfactant at low concentration has less influence on
both fluid-fluid interactions and rock-fluid interactions at reservoir conditions.
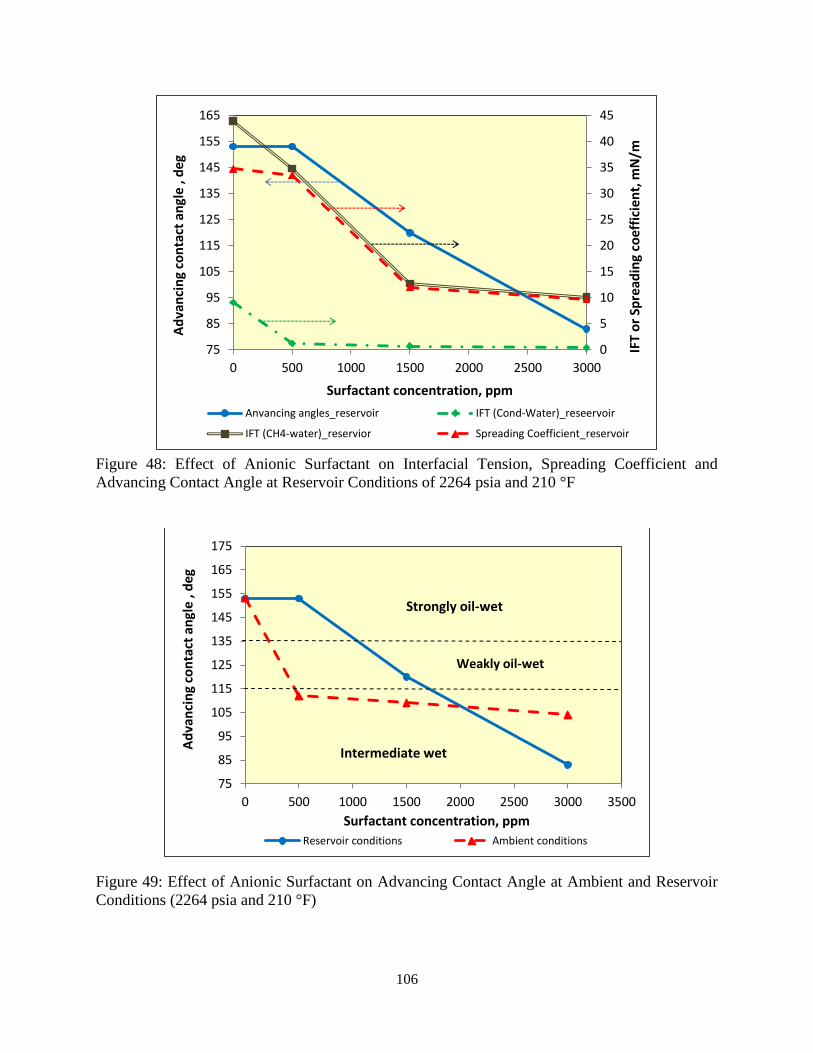
106
Figure 48: Effect of Anionic Surfactant on Interfacial Tension, Spreading Coefficient and
Advancing Contact Angle at Reservoir Conditions of 2264 psia and 210 °F
Figure 49: Effect of Anionic Surfactant on Advancing Contact Angle at Ambient and Reservoir
Conditions (2264 psia and 210 °F)
0
5
10
15
20
25
30
35
40
45
75
85
95
105
115
125
135
145
155
165
0 500 1000 1500 2000 2500 3000
IFT
or
Spre
adin
g co
effi
cien
t, m
N/m
Ad
van
cin
g co
nta
ct a
ngl
e , d
eg
Surfactant concentration, ppm
Anvancing angles_reservoir IFT (Cond-Water)_reseervoir
IFT (CH4-water)_reservior Spreading Coefficient_reservoir
75
85
95
105
115
125
135
145
155
165
175
0 500 1000 1500 2000 2500 3000 3500
Ad
van
cin
g co
nta
ct a
ngl
e ,
de
g
Surfactant concentration, ppm
Reservoir conditions Ambient conditions
Weakly oil-wet
Strongly oil-wet
Intermediate wet

107
Figure 49 shows the comparison of the effect of the anionic surfactant on advancing
contact angles at ambient and reservoir conditions. As can be seen in Figure 49, at ambient
conditions, in all three surfactant concentration cases, the reservoir wettability was altered from
strongly oil-wet to weakly oil-wet or intermediate-wet. However, at reservoir conditions, the low
concentration 500 ppm of anionic surfactant solution was not found to change reservoir
wettability. As the surfactant concentrations increased to 1500 and 3000 ppm, it was clearly
observed from Figure 49 that the anionic surfactant altered the wettability of quartz surfaces
from strongly oil-wet to weakly oil-wet or intermediate-wet. The difference between these two
conditions indicates that the effectiveness of the anionic surfactant on altering wettability at
reservoir conditions is less than that at ambient conditions for this particular reservoir case. This
proves that surfactants exhibit their specific characteristics at different pressure and temperature
conditions. It also demonstrates that rock-fluids interactions depend on pressure and temperature
as well.
4.3.5 After Surfactant Injection at Ambient and Reservoir Conditions
After surfactant injection, the optical cell was full of the specific concentration of brine
containing surfactant at ambient and reservoir conditions of 2264 psia and 210 °F. At both
conditions, in all three anionic surfactant solution cases, almost nothing or only a trace of
condensate drop was found staying on the upper and lower quartz surfaces. For the two lower
concentrations (500 and 1500 ppm) nonionic surfactant cases at ambient conditions, the
condensate drop kept staying between the two surfaces, and the only difference between the
original drop and the final drop is the drop shape due to surfactant effect. For the highest
concentration (3000 ppm) nonionic surfactant case, a very small condensate droplet can be
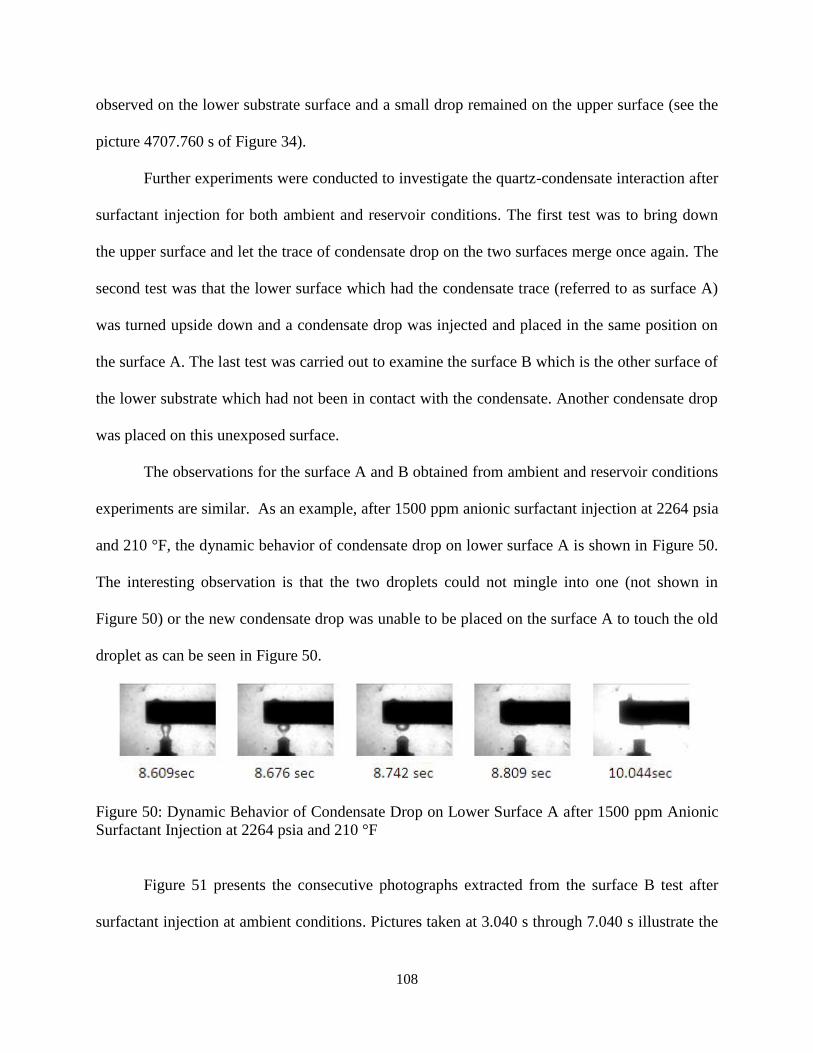
108
observed on the lower substrate surface and a small drop remained on the upper surface (see the
picture 4707.760 s of Figure 34).
Further experiments were conducted to investigate the quartz-condensate interaction after
surfactant injection for both ambient and reservoir conditions. The first test was to bring down
the upper surface and let the trace of condensate drop on the two surfaces merge once again. The
second test was that the lower surface which had the condensate trace (referred to as surface A)
was turned upside down and a condensate drop was injected and placed in the same position on
the surface A. The last test was carried out to examine the surface B which is the other surface of
the lower substrate which had not been in contact with the condensate. Another condensate drop
was placed on this unexposed surface.
The observations for the surface A and B obtained from ambient and reservoir conditions
experiments are similar. As an example, after 1500 ppm anionic surfactant injection at 2264 psia
and 210 °F, the dynamic behavior of condensate drop on lower surface A is shown in Figure 50.
The interesting observation is that the two droplets could not mingle into one (not shown in
Figure 50) or the new condensate drop was unable to be placed on the surface A to touch the old
droplet as can be seen in Figure 50.
Figure 50: Dynamic Behavior of Condensate Drop on Lower Surface A after 1500 ppm Anionic
Surfactant Injection at 2264 psia and 210 °F
Figure 51 presents the consecutive photographs extracted from the surface B test after
surfactant injection at ambient conditions. Pictures taken at 3.040 s through 7.040 s illustrate the
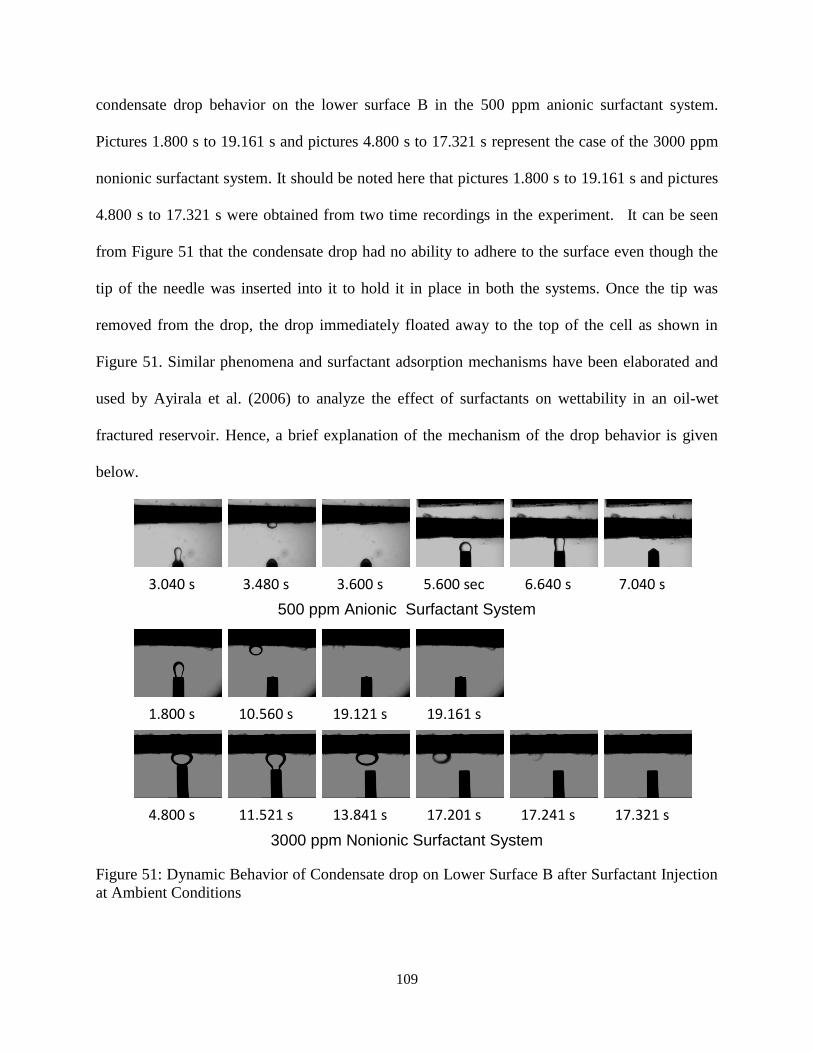
109
condensate drop behavior on the lower surface B in the 500 ppm anionic surfactant system.
Pictures 1.800 s to 19.161 s and pictures 4.800 s to 17.321 s represent the case of the 3000 ppm
nonionic surfactant system. It should be noted here that pictures 1.800 s to 19.161 s and pictures
4.800 s to 17.321 s were obtained from two time recordings in the experiment. It can be seen
from Figure 51 that the condensate drop had no ability to adhere to the surface even though the
tip of the needle was inserted into it to hold it in place in both the systems. Once the tip was
removed from the drop, the drop immediately floated away to the top of the cell as shown in
Figure 51. Similar phenomena and surfactant adsorption mechanisms have been elaborated and
used by Ayirala et al. (2006) to analyze the effect of surfactants on wettability in an oil-wet
fractured reservoir. Hence, a brief explanation of the mechanism of the drop behavior is given
below.
3.040 s 3.480 s 3.600 s 5.600 sec 6.640 s 7.040 s
500 ppm Anionic Surfactant System
1.800 s 10.560 s 19.121 s 19.161 s
4.800 s 11.521 s 13.841 s 17.201 s 17.241 s 17.321 s
3000 ppm Nonionic Surfactant System
Figure 51: Dynamic Behavior of Condensate drop on Lower Surface B after Surfactant Injection
at Ambient Conditions

110
The surface A was initially exposed to condensate and a film of condensate was formed
on the surface. Figure 52 schematically displays the proposed mechanism of this phenomenon
for the second test of surface A. After surfactant injection, surfactant molecules adsorbed on this
film and orientated themselves with the hydrophobic tails in the condensate film and the
hydrophilic heads away from the surface as shown in Figure 52. When the new condensate drop
was introduced into the cell for the second test, surfactant molecules oriented themselves on the
condensate surface in the same way as they did on the lower surface A (Figure 52). As the drop
approached the surface, an electrostatic repulsion force took place between the hydrophilic heads
of surfactant molecules adsorbed on condensate drop and the rock surface began to wet. This led
to the drop being unable to come in contact with the surface. And the same mechanism can be
applied to the first test of surface A. Also, due to the repulsion between hydrophilic heads of
surfactant molecules absorbed on the two rock surfaces, it was impossible for the two condensate
drops to mix together.
Figure 52: Schematic of Surfactant Orientation Mechanism on Lower Substrate Surface A
Figure 53 illustrates the possible mechanism of surfactant action on the surface B. The
surface B was not previously occupied by condensate. It was clean and only exposed to the brine
containing surfactant. Hence, the surface initially had been covered with a thin water film and its
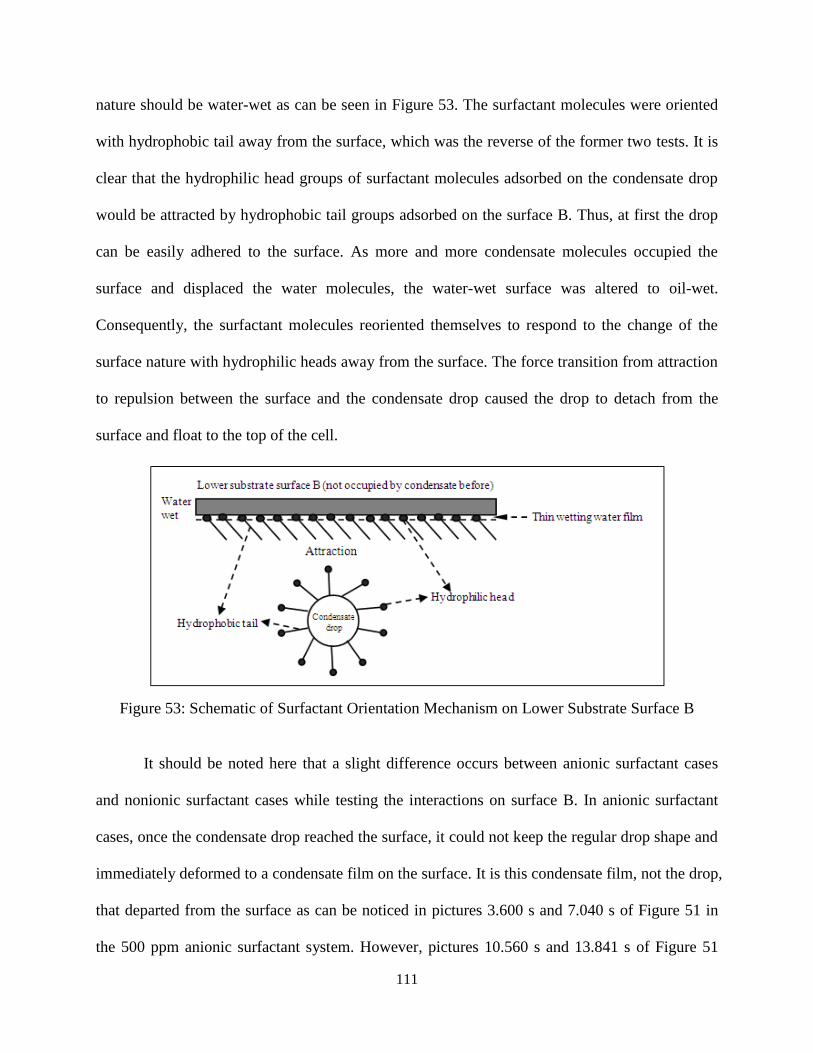
111
nature should be water-wet as can be seen in Figure 53. The surfactant molecules were oriented
with hydrophobic tail away from the surface, which was the reverse of the former two tests. It is
clear that the hydrophilic head groups of surfactant molecules adsorbed on the condensate drop
would be attracted by hydrophobic tail groups adsorbed on the surface B. Thus, at first the drop
can be easily adhered to the surface. As more and more condensate molecules occupied the
surface and displaced the water molecules, the water-wet surface was altered to oil-wet.
Consequently, the surfactant molecules reoriented themselves to respond to the change of the
surface nature with hydrophilic heads away from the surface. The force transition from attraction
to repulsion between the surface and the condensate drop caused the drop to detach from the
surface and float to the top of the cell.
Figure 53: Schematic of Surfactant Orientation Mechanism on Lower Substrate Surface B
It should be noted here that a slight difference occurs between anionic surfactant cases
and nonionic surfactant cases while testing the interactions on surface B. In anionic surfactant
cases, once the condensate drop reached the surface, it could not keep the regular drop shape and
immediately deformed to a condensate film on the surface. It is this condensate film, not the drop,
that departed from the surface as can be noticed in pictures 3.600 s and 7.040 s of Figure 51 in
the 500 ppm anionic surfactant system. However, pictures 10.560 s and 13.841 s of Figure 51

112
show that the condensate drop still can maintain the regular drop shape in the 3000 ppm nonionic
surfactant system. The drop moved fast on the surface and finally left the lower surface B. A
good explanation for this observation is that these two types of surfactants have different effects
on brine-condensate interfaces. In other words, different interfacial tensions in these two systems
cause the different behavior of the condensate drop. As shown in Table 5, the IFT in the anionic
system are lower than those in the nonionic system. Lower interfacial tensions in anionic systems
contribute to the deformation of the condensate drop. Therefore, surface active properties of
surfactant molecules at the brine-condensate interface and the rock- liquid (brine or condensate)
interface control the ability of the condensate drop on the rock surface.
Finally, the absent of wettability reversals to native wettability state during the
experiments and the reduction in IFT with increasing surfactant concentration at all
concentrations showed that the concentration of the surfactant did not approach the critical
micelle concentration (CMC) due to the absence of significant bilayer adsorption of the
surfactant on the rock surface. It can be concluded that all the surfactant concentrations used in
this work were below the CMC of the surfactant at both ambient and reservoir conditions.
4.4 Calculated Bond Number
The calculated Bond Number NB and NB' based on Eq. (4) and Eq. (2) for the four
ambient-condition cases were given in Table 7, 8, 9 and 10. Figure 54 and 55 show the Bond
Numbers, NB and NB', of the ambient-condition cases during 500 ppm and 1500 ppm anionic
surfactant injection. And the right plot in Figure 54 displays the variation of both the Bond
numbers with time at the time steps 644-656 s. The trends of Bond Number NB and NB'
computed for three 500, 1500 and 3000 ppm reservoir-condition cases are similar. Therefore,
1500 ppm anionic surfactant case at reservoir conditions as an example was discussed here and
the plots of the Bond number NB and NB' against time for this case are shown in Figure 56.

113
As can be seen in Figure 54, both the Bond numbers, NB and NB', show the cyclical
trends. It provides the evidence that the surfactant gradually affects the dynamic behavior of
condensate drop on the surface. Significant difference between NB and NB' as shown in right
picture of Figure 54 is that the Bond number NB calculated using contact angle is larger than NB'
which does not use the contact angle. Especially at the time 655.60 s, NB' approached a value of
0.76 (less than unity), but NB is 9.36 much higher than unity. Based on the conclusion of
Hirasaki and Zhang (2004), the condensate drop should be stable if considering the NB' of 0.76.
However, the movement of the drop on the surface could still be visually observed in Figure 24
after 655.60 seconds. This condensate drop dynamics could be better described by the Bond
number NB, since it was more than unity indicating the unstable drop on the surface.
Figure 54: Variation of Bond number with Time for Condensate Drop on Lower Substrate during
the 500 ppm Anionic Surfactant Injection at Ambient Conditions (right: at time steps 644-656 s)
0
2
4
6
8
10
12
14
16
18
20
22
24
26
0 200 400 600 800
Bo
nd
Nu
mb
er
Time, sec
NB
NB'
0
1
2
3
4
5
6
7
8
9
10
11
12
13
644 646 648 650 652 654 656 658
Bo
nd
Nu
mb
er
Time, s
NB
NB'

114
Figure 55: Variation of Bond number with Time for Condensate Drop on Lower Substrate during
the 1500 ppm Anionic Surfactant Injection at Ambient Conditions
Figure 56: Variation of Bond number with Time for Condensate Drop on Lower Substrate during
the 1500 ppm Anionic Surfactant Injection at 2264 psia and 210 °F
From Figure 55 and 56, it can be seen that the trends of the Bond numbers NB and NB' for
both ambient conditions and reservoir conditions at 1500 ppm anionic surfactant injection cases
0
4
8
12
16
20
24
28
32
36
40
44
48
0 20 40 60 80
Bo
nd
Nu
mb
er
Time, s
NB'
NB
0123456789
101112131415
0 100 200 300 400 500
Bo
nd
Nu
mb
er
Time, s
NB
NB'

115
are similar to the case of 500 ppm surfactant injection at ambient conditions. The Bond number
NB' is equal to 0.97 (less than 1) but NB is 9.07 at the time of 75.797 seconds as shown in Figure
55 and Table 8 for ambient-condition 1500 ppm case; while the Bond number NB' of reservoir-
condition 1500 ppm case, for example, is 0.74 (<1) at time step 128.711 s (in Figure 56) and NB
is 7.15 at the same time step. According to the values of the Bond Number NB (greater than 1), it
indicates an unstable state on the surface. This is consistent with the visual observations recorded
during the experiments. From Figure 28 and Figure 38, it can be found that the drop rose up
once again after 0.16 second for the ambient-condition case and 204 seconds for the reservoir-
condition, respectively. It clearly points out that still some more time is needed for the
condensate drop to stabilize on the lower substrate. This confirms that the criterion that the drop
should be stable at Bond numbers less than unity appears to be true only for the Bond number
formulation including contact angle term.
Figure 57: Variation of Bond Number with
Time for Condensate Drop on Lower
Substrate during the 500 ppm Nonionic
Surfactant Injection at Ambient Conditions
Figure 58: Variation of Bond Number with
Time for Condensate Drop on Lower
Substrate during the 3000 ppm Nonionic
Surfactant Injection at Ambient Conditions
0
2
4
6
8
10
12
14
0 200 400 600 800
Bo
nd
Nu
mb
er
Time, s
NB
NB'
0123456789
1011
0 1000 2000 3000 4000 5000
Bo
nd
Nu
mb
er
Time, s
NB
NB'

116
Figure 57 and 58 illustrate the variation of the Bond Number NB and NB' against contact
time at ambient conditions during 500 ppm and 3000 ppm nonionic surfactant injection. From
Table 9 and Figure 57, the Bond number NB is equal to zero since the drop is always in
equilibrium between the two substrates during injecting 500 ppm nonionic surfactant solution.
This indicates that the condensate drop is stable on the surface. However, in this case the Bond
number NB' has opposite characteristics. It always has a higher value (more than 10) as shown in
Table 11 and Figure 31 indicating the drop’s instability on the surface. This is not true because
until the surfactant injection process was accomplished (about 80 minutes) the drop was
observed in Figure 31 to be still on the surface just as it was in 778.961 s. This confirms that NB'
(without contact angle) is not represented of the phenomenon occurring.
For 3000 ppm ambient-condition nonionic surfactant injection case, it can be noticed
from Table 12 and Figure 58 that after the time step 468.692 s the Bond number NB' is less than
unity suggesting that the droplet is stable on the surface; nevertheless, the values of NB are larger
than one which indicates that the drop is unstable during this period (from 468.692 s and 778.002
s) and needs more time to become stable. This is proved by the later observations in Figure 34
that until the time step 4707.760 s (about 79 minutes) the Bond number NB becomes close to the
unity (1.08), indicating that the droplet should be stable on the lower substrate. After 80 minutes
surfactant injection, the droplet became a very small drop and appeared stationary on the lower
surface as can be seen in Figure 34.
Hence, these two nonionic surfactant injection cases give the further evidence that the
Bond number formulation containing contact angle provides a better characterization of dynamic
capillary/gravity phenomenon.1
1 The material in Chapter 4.1-4.4 was previously presented at the conferences: SPE/DOE Improved Oil Recovery Symposium held in Tulsa, OK,
USA, April 24-28, 2010, and SPE International Symposium on Oilfield Chemistry held in The Woodlands, Texas, USA, April 11-13, 2011.

117
4.5 Surfactant-Induced Flow Behavior at Ambient Conditions 2
Unsteady state relative permeability measurements were conducted before and after
surfactant treatment to investigate the effects in gas relative permeability and oil (condensate)
recovery in Berea sandstone rock-condensate-synthetic brine system. Surfactant-induced
wettability effect was also investigated by using the relative permeability measurements, mainly
oil-water relative permeability ratio and fractional flow curves.
Initial water saturation, residual oil saturation and endpoint relative permeabilities were
measured through coreflood experiments along with pressure and recovery profiles. These were
then history matched using a coreflood simulator to obtain the relative permeability and oil-water
relative permeability ratio curves. The history match of recovery and pressure drop obtained
from the simulator as well as the resulting relative permeability curve is shown in Appendix.
Craig’s rules of thumb in Table 14 were applied to interpret wettability changes in this study.
Table 14: Craig’s Rules of Thumb Used for Wettability Interpretation (Ayirala, 2002)
Criterion Water-wet Oil-wet
Initial water Saturation, Swi >0.25 <0.15
Water saturation at cross-over point >0.5 <0.5
Endpoint relative permeability to water at Sor <0.3 >0.5
Endpoint relative permeability to oil at Swi >0.95 <0.7~0.8
4.5.1 Relative Permeability and Wettability Measurements for Berea Rock-Condensate-
Synthetic Brine System
The history match of condensate recovery and pressure drop obtained from a coreflood
simulator (See section 3.5) during the waterflood in the absence of surfactant (0 ppm) in Berea
2 The material in Chapter 4.5 was previously presented at the conference: SPE Annual Technical Conference and Exhibition held in Denver,
Colorado, USA, October 30-November 2, 2011.
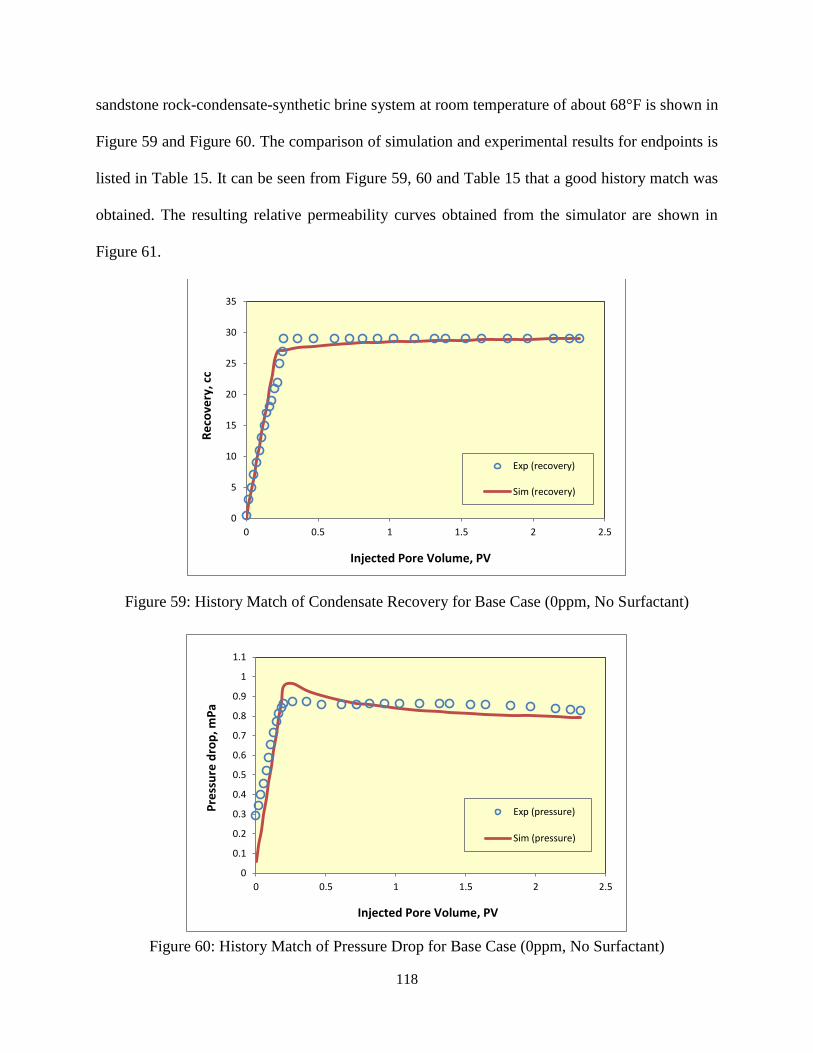
118
sandstone rock-condensate-synthetic brine system at room temperature of about 68°F is shown in
Figure 59 and Figure 60. The comparison of simulation and experimental results for endpoints is
listed in Table 15. It can be seen from Figure 59, 60 and Table 15 that a good history match was
obtained. The resulting relative permeability curves obtained from the simulator are shown in
Figure 61.
Figure 59: History Match of Condensate Recovery for Base Case (0ppm, No Surfactant)
Figure 60: History Match of Pressure Drop for Base Case (0ppm, No Surfactant)
0
5
10
15
20
25
30
35
0 0.5 1 1.5 2 2.5
Re
cove
ry, c
c
Injected Pore Volume, PV
Exp (recovery)
Sim (recovery)
0
0.1
0.2
0.3
0.4
0.5
0.6
0.7
0.8
0.9
1
1.1
0 0.5 1 1.5 2 2.5
Pre
ssu
re d
rop
, mP
a
Injected Pore Volume, PV
Exp (pressure)
Sim (pressure)

119
Figure 61: Oil-Water Relative Permeabilities for Base Case (0 ppm, No Surfactant) Obtained
from a Coreflood Simulator
Table 15: Summary of Experimental and Simulation Waterflood Results for Base Case (0 ppm)
at Both Room and Reservoir Temperatures
Temperature
(°F)
Recovery
(%OOIP)
Experimental Simulation
Swi Sor Kro Krw Swi Sor Kro Krw
Sw (X-
Over
point)
68 35.8 0.372 0.403 1.0 0.109 0.363 0.401 1.0 0.103 0.52
210 40.6 0.465 0.326 1.0 0.143 0.46 0.321 1.0 0.135 0.63
According to Craig’s rules of thumb (Table 14), the relative high initial water saturation
of 0.363 (>0.25), low endpoint water relative permeability 0.103 (<0.3), high endpoint oil
relative permeability of 1.0 (>0.95), and the slightly higher crossover point water saturation 0.52
(>0.5) in Figure 61 for this base case (0 ppm, no surfactant) indicate the weakly water-wet
characteristics of this Berea rock-condensate-synthetic brine system.
Table 16 presents the oil (condensate)-water interfacial tensions (IFT) and the advancing
contact angles measured using DDDC technique for this rock-fluids system at various anionic
0
0.2
0.4
0.6
0.8
1
0
0.2
0.4
0.6
0.8
1
0 0.1 0.2 0.3 0.4 0.5 0.6 0.7 0.8 0.9 1
Krw
Kro
Water saturation (Sw), frac
Kro
Krw

120
surfactant concentrations. As shown in Table 16, the advancing contact angle of 153° was
obtained for the quartz-condensate-synthetic brine system in the absence of surfactant, which
indicates the strong initial oil-wet nature of the system. Thus the wettability inferred from the
contact angle measurements is significantly different from that derived from the corefloods. This
discrepancy between them appears to be due to insufficient aging time on rough rock (core)
surfaces and the pore structure change caused by fines migration as explained below.
Table 16: Summary of Waterflood Results, Oil-Water Interfacial Tensions and Contact Angles in
Berea Rock-Condensate-Synthetic Brine System at Various Anionic Surfactant Concentrations
Surfactant
Concentration
(ppm)
Recovery (%OOIP) IFT (σow) (mN/m)
Advancing
Contact Angles
(degree)
0 35.8 22.94 153
1500 59.1 1.01 109
3000 51.8 0.87 104
In DDDC contact angle experiments, smooth quartz surfaces were used to measure the
water-advancing contact angle. The aging time of 24 hours was sufficient to attain solid-fluids
equilibrium and the system showed a strongly oil-wet state. However, in coreflood experiments,
Berea rock is not only rough but also mineralogically heterogeneous.
The chemical composition of Berea sandstone cores, which is provided by the supplier’s
(Cleveland Quarries) website, consists mainly of silica (about 93%). Alumina (Al2O3) in the core
is about 3.86% and the remaining 3% constitutes ferric oxide, ferrous oxide, magnesium oxide
and calcium oxide. The composition of Berea cores shows the presence of impurities. Although
the non-silica minerals only account for about 7% in Berea cores, their structure is loose with
large surface area resulting in roughness and heterogeneity on the rock surface.

121
The roughness of rock surface can affect both contact angle and wetting state.
Vijapurapu et al. (2002) reported that the water-advancing contact angles on silica-based
surfaces showed a declining trend with increasing surface roughness and the water-advancing
contact angle decreased from 166° on smooth glass to 58° on rough quartz for Yates crude oil
system. Thus, roughness of pore walls of Berea rock appears to be the main reason for the
observed results. This also demonstrates that more aging time should be given to reach solid-
fluids equilibrium in coreflood experiments to account for the effect of surface roughness.
Furthermore, during the single-phase experimental period, when the core was initially
saturated with synthetic brine (low salinity of about 3100 ppm, Table 3 in section 3.1.1) and flow
was established with brine to measure the absolute permeability, a small amount of light yellow
fine solid particles has been observed to be entrained in the flowing fluids and transported
through the core to the production burette. This experimental observation gives evidence that
fines migration occurred in this sandstone core. Fines migration in the single-phase flow has
been studied by several researchers (Mungan, 1965, Gruesbeck and Collins, 1982, Khilar and
Fogler, 1983, and Sarkar and Sharma, 1990). And fines migration was believed to be the most
important mechanism of permeability reduction in porous media due to clay particles dislodging
from the pore walls, migrating in the flowing direction and then blocking the pore throats. It was
also believed by some researchers that fines migration played a key role in enhanced oil recovery
for low salinity brine flood (Tang and Morrow, 1999). In addition, the strong impact of rock pore
structure on relative permeability resulting in an apparent contrast between the DDDC results
and the coreflood results was also proved by the other two published cases - Crossfield Cardium
sandstone oil reservoir system and Beaverhill Lake carbonate oil reservoir system reported in the
literature (Rao, 2002). This shows the limitations of interpreting wettability from relative

122
permeability using Craig’s rules of thumb to discern wettability. It also confirms the suggestion
by Anderson (1987) that it is preferable to measure wettability independently rather than to rely
on Craig’s relative permeability rules alone to characterize wettability.
4.5.2 Effect of Temperature on Condensate Recovery, Relative Permeability and
Wettability for Berea Rock-Synthetic Brine-Condensate
Before performing surfactant flood experiments, the effect of temperature on relative
permeability and wettability was tested for base case (0 ppm surfactant case). When the initial
conditions of the core were ready for waterflood step, the core was aged at reservoir temperature
of 210 °F for 3 to 5 days. Then the waterflood experiment was conducted to investigate the
temperature effect. Table 15 also summarized experimental and simulation results obtained from
waterfloods performed using Berea sandstone, which was aged at reservoir temperature. A good
history match was also given by the coreflood simulator as can be seen in Figure A4-A6 of
Appendix. The effects of temperature on relative permeability and relative permeability ratios
are shown in Figure 62 and Figure 63, respectively. The effect of temperature on condensate
recovery is presented in Figure 64.
It can be seen from Figure 62 and Table 15 that as the aging temperature is increased
from room temperature 68 °F to reservoir temperature 210 °F, the cross-over point (x-axis) water
saturation is shifting from the left (0.52) to the right (0.63). Also, from Figure 63, it clearly can
be seen that the relative permeability ratio (Krw/Kro) curves are gradually shifting to the right.
Both of these observations indicate that the wettability of this rock-fluids system is altered from
weakly water-wet to water-wet.
Furthermore, as can be seen in Table 15 and Figure 64, the oil (condensate) recovery
increased from 35.8% at room temperature to 40.6% at reservoir temperature. The two tests were
conducted quite similarly except for the aging temperature between them. Hence, this marginal

123
increment of about 5% in oil recovery could be attributed to slight wettability alteration from a
state of weakly water-wet to a water-wet state caused by the elevated temperature. This further
substantiates the importance of the proper conditions for coreflood experiment.
Figure 62: Effect of Temperature on Relative Permeability
Figure 63: Effect of Temperature on Relative Permeability Ratios
0
0.2
0.4
0.6
0.8
1
0
0.2
0.4
0.6
0.8
1
0 0.1 0.2 0.3 0.4 0.5 0.6 0.7 0.8 0.9 1
Krw
Kro
Water saturation (Sw), frac
Kro (68F)
Krw (68F)
Kro (210F)
Krw (210F)
1.00E-06
1.00E-04
1.00E-02
1.00E+00
1.00E+02
1.00E+04
1.00E+06
0 0.2 0.4 0.6 0.8 1
Krw
/Kro
Water Saturation (Sw), frac
68F
210F

124
Figure 64: Effect of Temperature on Condensate Recovery
4.5.3 Effect of Anionic Surfactant on Condensate Recovery and Gas Relative
Permeability
The summary of experimental and simulation results including recovery, saturation and
endpoint relative permeabilities for waterflood of condensate in Berea rock at various anionic
surfactant concentrations is shown in Table 17. The crossover points of relative permeability
curves are also included in Table 17. A good history match given by the simulator still can be
seen in Figure A7-A12 of Appendix.
Table 17: Comparison of Experimental and Simulator Results for Waterflood in Berea Core at
Various Anionic Surfactant Concentrations
Cases Recovery
(%OOIP)
Experimental Simulation
Swi Sor Kro Krw Swi Sor Kro Krw
Sw (X-
Over
Point)
0ppm 35.8 0.372 0.403 1.0 0.109 0.363 0.401 1.0 0.103 0.52
1500ppm 59.1 0.469 0.217 1.0 0.094 0.460 0.207 1.0 0.0943 0.64
3000ppm 51.8 0.341 0.318 1.0 0.105 0.340 0.313 1.0 0.0989 0.54
0
5
10
15
20
25
30
35
40
45
50
0 0.5 1 1.5 2 2.5
Rec
ove
ry ,%
OO
IP
Injected Pore volume, PV
68F
210F

125
Table 18: Summary of Gasflood Results and Spreading Coefficient in Berea Rock-Condensate-
Synthetic Brine-Gas System at Various Anionic Surfactant Concentrations
Cases
(ppm) Krg
Krg
Improvement
(%)
Condensate
Recovery
(%OOIP)
Water
Recovery
(%)
Liquid
Recovery
(%)
SLrg Sorg
0 0.135 / 8.64 41.6 30.23 0.698 0.349
1500 0.246 82.2 10.22 50.2 46.51 0.535 0.128
3000 0.194 43.7 3.53 61.5 48.06 0.519 0.233
The results for the tertiary gas displacements in this system at various surfactant
concentrations are presented in Table 18. The improvement listed in the third column of Table 18
is calculated as the ratio of the difference of gas relative permeability after the surfactant
treatment (1500 ppm and 3000 ppm) cases and untreated case (0 ppm) to the untreated (0 ppm)
gas relative permeability. Liquid recovery in Table 18 is the ratio of the total liquid (water and
condensate) volume to the pore volume of the core. The water volume produced in this gasflood
process over the water volume left in the core at the end of waterflood is defined as the water
recovery. SLrg and Sorg represent the residual liquid saturation and residual condensate saturation
in the core at the end of gasflood. Figure 65 depicts the effect of anionic surfactant concentration
on oil (condensate) recoveries which were normalized against their respective original oil
(condensate) in place (OOIP) and gas relative permeability.
From Figure 65 and Table 17, it can be seen that the condensate recovery increased from
35.8% OOIP at 0 ppm surfactant concentration to the highest value of 59.1% OOIP at the 1500
ppm concentration and then decreased to 51.8 % at 3000 ppm concentration, indicating that
surfactant treatment is beneficial for enhanced condensate recovery. Also, the gas relative
permeability shows a similar trend as can be seen in Figure 65 and Table 18. In other words, it
increased to the maximum value of 0.246 at 1500 ppm and then declined to 0.197 at 3000 ppm.

126
The improvements in gas relative permeability after surfactant treatment shown in Table 18 are
82.2% at 1500 ppm and 43.7% at 3000 ppm. This also demonstrates the benefit of surfactant
treatment from improving gas flow.
Figure 65: Effect of Anionic Surfactant Concentration on Recovery and Gas Relative
Permeability
In addition, it can be clearly noted in Figure 65 that the highest oil recovery and gas
relative permeability were obtained at low surfactant concentration (1500 ppm). This is a very
important result because the application of low surfactant concentrations in the field can make
the treatment more cost-effective.
Compared with the 1500 ppm surfactant treatment case, a slight drop in condensate
recovery and the reduction in the improvement in gas relative permeability were obtained at
3000 ppm surfactant concentration as shown in Figure 65 and Table 18. One of the possible
explanations is that oil/water emulsion was formed during 3000 ppm surfactant solution
injection. This emulsion was not observed until about 4.2 PV brine containing surfactant was
flooded into the core. Also, this emulsion did not break up after one week, suggesting it was
0
0.1
0.2
0.3
0.4
0
20
40
60
80
0 500 1000 1500 2000 2500 3000 3500
Gas
Re
lati
ve P
erm
eab
ility
Re
cove
ry, %
OO
IP
Surfactant Concentration, ppm
Oil recovery
Krg

127
stable. However, no emulsion was found during the entire 1500 ppm surfactant flood. The other
possible reason is that this higher concentration (3000 ppm) appears to be near critical micelle
concentration (CMC) of the surfactant. The bilayer surfactant adsorption probably occurred and
led to partial wettability reversal towards the native wettability state (Somasundaran and Zhang,
2006), and thus reduced the oil recovery.
4.5.4 Effect of Anionic Surfactant on Relative Permeability and Wettability
The ratios of oil-water relative permeabilities in this study are used to interpret the
wettability changes induced by the anionic surfactant. This method has been used in the
published literature to infer wettability states (Anderson, 1987; Rao, et al, 1992). Figure 66
depicts the condensate recovery history at various surfactant concentrations. The effect of
surfactant concentration on water-oil relative permeability is represented by the variations in
relative permeability ratios (Krw/Kro) as displayed in Figure 67. Figure 68 shows the effect of the
anionic surfactant on fractional water flow.
Figure 66: Effect of Anionic Surfactant Concentration on Condensate Recovery
0
10
20
30
40
50
60
70
0 0.5 1 1.5 2 2.5 3 3.5 4 4.5 5
Re
cove
ry, %
OO
IP
Injected pore volume, PV
0 ppm
1500 ppm
3000 ppm
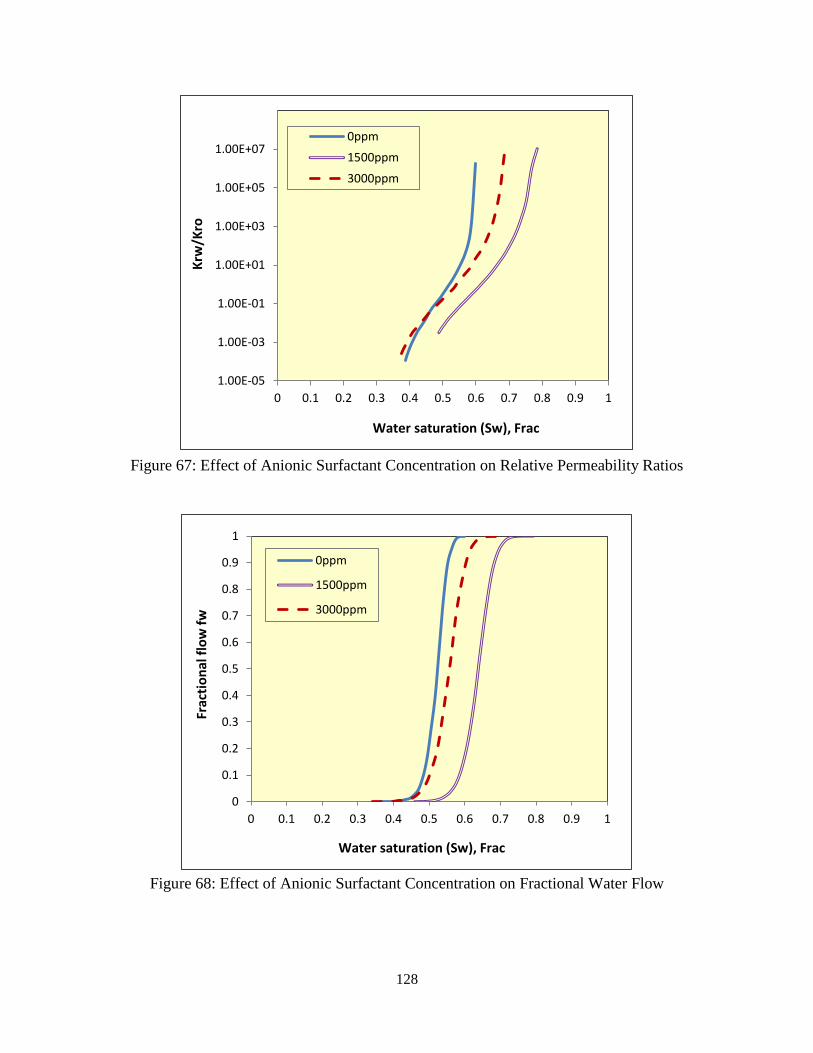
128
Figure 67: Effect of Anionic Surfactant Concentration on Relative Permeability Ratios
Figure 68: Effect of Anionic Surfactant Concentration on Fractional Water Flow
1.00E-05
1.00E-03
1.00E-01
1.00E+01
1.00E+03
1.00E+05
1.00E+07
0 0.1 0.2 0.3 0.4 0.5 0.6 0.7 0.8 0.9 1
Krw
/Kro
Water saturation (Sw), Frac
0ppm
1500ppm
3000ppm
0
0.1
0.2
0.3
0.4
0.5
0.6
0.7
0.8
0.9
1
0 0.1 0.2 0.3 0.4 0.5 0.6 0.7 0.8 0.9 1
Frac
tio
nal
flo
w f
w
Water saturation (Sw), Frac
0ppm
1500ppm
3000ppm

129
It can be seen from Figure 66 that there is no significant condensate production after
breakthrough for 0 ppm case and the condensate recovery is about 35.8% OOIP. However,
corresponding to 1500 and 3000 ppm surfactant treatment cases, both condensate recoveries of
45.3% and 38.8% exceed the recovery of 35.8% in the base case at breakthrough time. After
breakthrough, the recovery of 1500 ppm case, as an example, is gradually increased by more
than 20% over 0 ppm case at 4PV water injection as shown in Figure 66.
From the plot of water-oil relative permeability ratio (Krw/Kro) against water saturation
(Figure 67), it can be observed that oil-water relative permeability ratio curves are gradually
shifting to the right after using surfactant. This kind of relative shift to the right in relative
permeability ratio curves is indicative of a change in the rock wettability from water-wet to
intermediate wet induced by this anionic surfactant (Rao, et al. 1992, 2006). In addition, it should
be noted that, there is a smaller rightward shift in relative permeability ratio curves for 3000 ppm
case compared to 1500 ppm case. This resulted from two opposite effects: one is due to
formation of oil-water emulsion which shifts the relative permeability curves to the left; the other
is the development of intermediate wet nature which shifts the relative permeability curves to the
right. And Figure 67 shows the final rightward shift for 3000 ppm case, clearly indicating that
surfactant-induced wettability alteration to intermediate wet seems to have overcome the effect
of the oil/water emulsion. A similar shift from left to right can be noticed in the fractional water
flow curves as shown in Figure 68. The advancing Contact angle measured in the presence of the
surfactant changed from 153° at 0 ppm to 109° at 1500 ppm and 104° at 3000 ppm (Table 16).
This corroborates well with surfactant flood results that the wettability was altered to
intermediate wet in this rock-fluids system.

130
The oil-water interfacial tensions measured with this anionic surfactant decreased from
22.94 mN/m at 0 ppm to 1.01 at 1500 ppm and 0.87 mN/m at 3000 ppm as can be seen in Table
16. This indicates that about two orders of magnitude reduction in oil-water interfacial tension
caused by anionic surfactant was obtained in this condensate system. Lowering of interfacial
tension can increase the oil recovery, however, significant improvements in oil (condensate)
recovery caused by oil-water interfacial tension reduction require four to five orders of
magnitude reduction in interfacial tension (Klins, 1984). Mungan (1966) investigated the effect
of interfacial tension on the displacement of a nonwetting by a wetting liquid without changing
wettability and found that decreasing IFT from 40 to 0.5 dyne/cm resulted in only 8.1%
additional recovery after breakthrough. In contrast, additional higher condensate recovery of
about 20% after breakthrough (Figure 66) was observed due to surfactant usage in this Berea
rock-condensate-brine system. Therefore, the wettability alteration to intermediate wettability is
the principal mechanism responsible for significant enhanced oil recovery in this system.
4.5.5 Effect of Anionic Surfactant on Tertiary Recovery and Spreading Coefficient
Immiscible gas (N2) was flooded into the core after the brine flood or surfactant flood
process. In all cases, the water phase was first observed to flow out of the core implying that gas
first displaced water, because water saturation in the core was high caused by the preceding
waterflood. The oil (condensate) was next displaced by gas, and gas breakthrough occurred
shortly after oil breakthrough. Similar observations can be found elsewhere and the double-
drainage mechanism was considered to be responsible for these phenomena (Oren and
Pinczewski, 1994).
The condensate recovery for this tertiary process also approached the maximum value of
10.2% OOIP at 1500 ppm and the lowest condensate recovery of 3.5% OOIP was obtained for
3000 ppm treatment (Table 18). The reduction in this tertiary recovery at 3000 ppm is still

131
primarily associated with high surfactant concentration and formation of oil-water emulsion in
previous waterflood step. During the gas flood for 3000 ppm treatment case, the collected water
phase displaced by gas in the production burette was observed to show a slightly cloudy
appearance. It indicates that small amount of oil was dispersed as small droplets in water phase
and formed oil-in-water emulsion and thus reduced the collected condensate volume in the
production burette.
Water and liquid recoveries increased while residual liquid saturation decreased as the
surfactant concentration increased from 0 ppm to 3000 ppm, as shown in Table 18. In other
words, more liquid including condensate and water were produced from the core after surfactant
treatment, implying that condensate blockage and the water accumulation near the well bore
region were mitigated. This further substantiates that surfactant treatment can effectively
improve gas relative permeability in this Berea rock-fluids system by remedying the condensate
buildup and blockage near the wellbore.
Table 19: Interfacial Tensions and Spreading Coefficients for Brine/Surfactant-Condensate-Gas
Systems
System σwg , mN/m σow , mN/m σog, mN/m So, mN/m
0ppm 70.01 22.94 20.58 26.49
1500ppm 27.79 1.01 20.58 6.20
3000ppm 27.46 0.87 20.58 6.01
Table 19 gives the measured interfacial tensions in brine (with or without the anionic
surfactant)-condensate-gas systems. The calculated oil spreading coefficients based on Eq. (1)
(Section 2.4) are also listed in Table 19. It shows that oil spreading coefficient for all three cases
is positive although it decreased from 26.49 mN/m at 0 ppm to 6.01 mN/m at 3000 ppm,
indicating that the spreading coefficient remained positive throughout. Therefore, surfactant-

132
induced wettability alteration appears to have a more pronounced influence on improving gas
relative permeability than the spreading coefficient in this Berea rock-fluids system.
4.5.6 Practical Implications of Surfactant Treatment
Historically, condensate liquids have been considered more valuable than the gas because
the condensates are composed mainly of light hydrocarbons. This price differential made gas
cycling a common practice. Gas cycling or the injection of dry gases (N2, CO2 or CH4) was
applied to the gas condensate reservoirs to remedy the condensate blockage problems. In this
method, the reservoir pressure was maintained above the dew point pressure owing to the
vaporization of condensate by gas injection, leading to an increase in gas productivity (Luo et al.,
2001; Eikeland and Hansen, 2007; Al-Abri et al., 2009). A CO2 huff-n-puff injection was
investigated and found that it could improve gas well productivity (Zhang et al., 2006; Odi,
2012). Although this remedial technique can reduce the impairment effects of condensate
buildup around the well, it has limited and short-term success because the condensate bank forms
again with time when the pressure near the wellbore falls below the dew point pressure.
However, injecting surfactant into the wellbore zone or huff-n-puff surfactant injection
can provide long-term strategy for increased productivity due to surfactant-induced wettability
alteration. In the oil-wet reservoirs, surfactant-induced wettability alteration to either weakly oil-
wet or intermediate wet is beneficial for field implementation. Due to lowering of the adhesion
forces between the liquid condensate and the rock surface which, in turn, would enable the gas
phase to flow more easily though the pores displacing the condensate ahead of it. The removal of
liquid bank through this process also results in the improvement in gas relative permeability and
gas productivity. It should be recognized, of course, that the surfactant type (ability to cause

133
favorable wettability alteration), surfactant concentration and determination of original reservoir
wettability are critical in determining the economic success of this process in the field.
4.6 Effect of Brine Salinity and Composition3
4.6.1 Interfacial Tension in Condensate and Different Synthetic Brine Systems
Interfacial tensions for multi-component (low and high salinity) brine/condensate systems
obtained from experiments are summarized in the Table 20. In this study, synthetic reservoir
brine with totally dissolved solids (TDS) of 2700 ppm is also in the range of the low salinity
water. Table 21 gives the measured interfacial tensions in single-salt brine/condensate systems at
two salinities (3100 and 93,300 ppm).
Table 20: Interfacial Tension and pH of Condensate/Multi-Component Brine Systems
Type of Brine Brine Salinity, ppm Interfacial Tension, mN/m pH
Low Salinity
0 29.79 7.1
300 27.60 6.0
700 27.28 6.0
1300 32.80 7.40
Synthetic Reservoir
Brine 2700 33.92 7.34
High Salinity
26,800 33.65 7.11
52,800 25.67 6.8
77,910 32.02 6.22
125,500 26.28 6.5
From Table 20, it can be seen that the interfacial tension between condensate and
different salinity multi-component brines varied from about 26 mN/m to 34 mN/m. The highest
interfacial tension of 34 mN/m occurs in condensate/synthetic reservoir brine case and the lowest
of around 26 mN/m in 52,800 ppm brine case. In general, the interfacial tensions in low salinity
3 The material in Chapter 4.6 was previously presented at the conference: 8th International Symposium on Contact Angle Wettability and
Adhesion held at Université Laval, Québec City, Québec, Canada, 13-15 June, 2012.

134
brine cases (0~2700 ppm) appears to be slightly more than those in high salinity brine cases
(26,800 ppm ~125,500 ppm) as shown in Table 20.
Table 21: IFT and pH of Condensate/Single-Salt Brine System at Two Salinities
Type of Brine Brine Salinity,
ppm
Single
Component
used
Interfacial
Tension, mN/m pH
Low Salinity 3100
NaCl 28.03 6.3
CaCl2 33.66 5.5
MgCl2 33.40 5.6
AlCl3 29.02 3.2
FeCl3 28.92 2.6
High Salinity 93,300
NaCl 27.61 7.1
CaCl2 33.39 5.8
MgCl2 32.73 5.3
AlCl3 27.66 2.5
FeCl3 27.09 2.2
For single-salt brine/condensate systems at two salinity levels, it can be found from Table
21 that the interfacial tension varied from the lowest of about 27 mN/m in condensate/93,300
ppm AlCl3 brine case to the highest of about 34 mN/m in condensate/3100 ppm CaCl2 brine
case. Low salinity single-salt brine/condensate cases generally have slightly higher interfacial
tensions compared to high salinity single-salt brine/condensate cases. Also, in divalent cation
(Ca2+
, Mg2+
) brine/condensate cases, the higher interfacial tensions of about 33mN/m were
obtained (Table 21) for both low salinity and high salinity cases in contrast with monovalent
cation (Na+) and trivalent cation (Al
3+, Fe
3+) brine/condensate cases.
Therefore, the interfacial tensions in these nineteen cases did not show any significant
difference due to brine composition changes and varied from 26 mN/m to 34 mN/m.

135
4.6.2 Measured pH in Condensate-Brine Systems
Measured pH using Thermo Orion pH meter (model 410 A plus) purchased from Thermo
Scientific for multi-component brine systems and single-salt brine at two salinities systems are
also listed in Table 20 and Table 21.
From Table 20, it can be seen that the pH measured in multi-component brine systems is
around 6 to 7, indicating a neutral condition. However, in single-salt brine systems, pH varies
from neutral (6~7) in low and high salinity Na+ brine cases to weak acid about 5.5 in divalent
cation (Ca2+
, Mg2+
) brine cases and then to acid (2~3) in trivalent cation (Al3+
, Fe3+
) brine cases
as clearly shown in Table 21. The increasing acidity of brine with increasing cationic valence (+1
to +3) can be attributed to the chemical nature of these cations present in solution.
The plots of interfacial tension against the pH of brine in different multi-component brine
systems and single-salt brines at two salinity levels systems are given in Figure 69 and Figure 70.
In different saline multi-component brine systems, there is no apparent trend in the interfacial
tensions which can be observed in Figure 69. Interfacial tensions were distributed randomly from
26 to 34 mN/m in the neutral pH conditions (6~7). Interfacial tensions in single-salt brine at
3100 and 93,300 ppm systems showed an initial increase and a later decrease with increasing pH
as may also be seen in Figure 70. The peak interfacial tension of around 34 mN/m exists at
weakly acidic conditions which correspond to divalent cation (Ca2+
, Mg2+
) brine (3100 ppm and
93,300 ppm) systems. Under neutral (Na+ brine) and slightly strong acidic (Al
3+ and Fe
3+ brine)
conditions, the values of interfacial tension are close to about 27~29 mN/m.
Although measured pH either kept at almost neutral conditions in different salinity multi-
component brine systems or varied from neutral to acidic conditions in single-salt brine systems,
interfacial tensions in all nineteen cases were in the range of 26 to 34 mN/m demonstrating no
significant difference among all the cases. Hence, no general trend or direct observation and
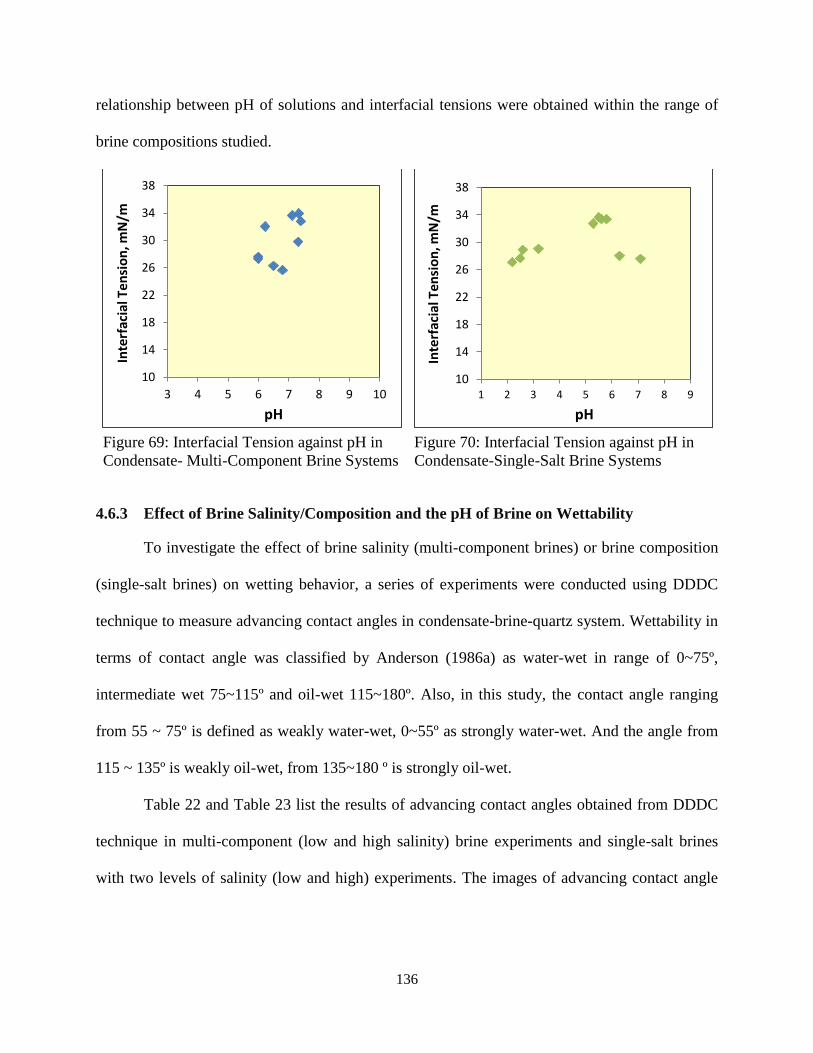
136
relationship between pH of solutions and interfacial tensions were obtained within the range of
brine compositions studied.
Figure 69: Interfacial Tension against pH in
Condensate- Multi-Component Brine Systems
Figure 70: Interfacial Tension against pH in
Condensate-Single-Salt Brine Systems
4.6.3 Effect of Brine Salinity/Composition and the pH of Brine on Wettability
To investigate the effect of brine salinity (multi-component brines) or brine composition
(single-salt brines) on wetting behavior, a series of experiments were conducted using DDDC
technique to measure advancing contact angles in condensate-brine-quartz system. Wettability in
terms of contact angle was classified by Anderson (1986a) as water-wet in range of 0~75º,
intermediate wet 75~115º and oil-wet 115~180º. Also, in this study, the contact angle ranging
from 55 ~ 75º is defined as weakly water-wet, 0~55º as strongly water-wet. And the angle from
115 ~ 135º is weakly oil-wet, from 135~180 º is strongly oil-wet.
Table 22 and Table 23 list the results of advancing contact angles obtained from DDDC
technique in multi-component (low and high salinity) brine experiments and single-salt brines
with two levels of salinity (low and high) experiments. The images of advancing contact angle
10
14
18
22
26
30
34
38
3 4 5 6 7 8 9 10
Inte
rfac
ial T
ensi
on
, mN
/m
pH
10
14
18
22
26
30
34
38
1 2 3 4 5 6 7 8 9
Inte
rfac
ial T
ensi
on
, mN
/m
pH

137
for all the cases as displayed in Table 22 and Table 23 were extracted from the experiments
using a digital video camera.
Table 22: Effect of Brine Salinity (Multi-Component Brine) on Dynamic Contact Angles and
Adhesion Number
Type of
Brine
Brine
Salinity,
ppm
Receding Contact Angle
(from Sessile Drop), deg
Advancing
Contact Angle
(from DDDC)
θa, deg
Adhesion
Number, Na θr, 0hr θr, 24hr
Low
Salinity
0 60 72
164
1.270
300 62 96
165
0.861
700 43 58
149
1.387
1300 60 71
155
1.232
Synthetic
Reservoir
Brine
2700 87 98
166
0.831
High
Salinity
26,800 65 70
155
1.248
52,800 90 102
162
0.743
77,910 116 120
167
0.474
125,500 96 108
163
0.647
It can be seen from Table 22 that for nine brine salinity cases including synthetic
reservoir brine big advancing contact angles varied from 149 to 166º by DDDC contact angle
measurement were obtained, indicating a strongly oil-wet nature for all the cases. This can be
visually observed in Table 22. The images of advancing contact angles clearly demonstrated the
strong adhesion of the condensate drop on the quartz surface forming large water-advancing
contact angles as the low quartz crystal was horizontally shifted to the left side.

138
As may be also seen in Table 23, in single-salt brine at low salinity (3100 ppm) systems
the measured advancing contact angles using DDDC technique varied from 138 to 163º. And
they changed from 144 to 164º in high salinity (93,300 ppm) single-salt brine cases. Therefore, a
strongly oil-wet behavior was also presented in single-salt brine at two salinity levels (3100 and
93,300 ppm). The images of advancing contact angle in Table 23 obtained from the experiments
also provided the visual evidence of oil-wet nature in all single-salt cases.
Table 23: Effect of Brine Composition (Single-Salt Brine) on Dynamic Contact Angles and
Adhesion Number
Type of
Brine,
ppm
Component
Receding Contact
Angle (from Sessile
Drop), deg
Advancing
Contact Angle
(from DDDC)
θa, deg
Adhesion
Number, Na θr,
0hr θr, 24hr
Low
Salinity
(3100)
NaCl 82 109
160
0.614
CaCl2 90 103
159
0.709
MgCl2 104 112
163
0.582
AlCl3 53 67
150
1.257
FeCl3 45 52
138
1.359
High
Salinity
(93,300)
NaCl 88 107
164
0.669
CaCl2 87 99
159
0.812
MgCl2 87 107
160
0.647
AlCl3 89 95
153
0.804
FeCl3 61 82
144
0.948

139
Hence, both brine salinity (multi-component brine) and brine composition (single-salt
brine) did not show a pronouncing effect on the wetting characteristics in this condensate-brine-
quartz rock system.
The curves of dynamic contact angles (advancing and receding angle) varied with
measured pH in both different salinity multi-component brine and single-salt brine systems are
presented in Figure 71 and Figure 72. Under neutral pH conditions or weakly/strongly acidic
conditions, the advancing contact angles for all nineteen cases as shown in Figure 71 and Figure
72 are large, fluctuating in the range of about 140 to 165º. This demonstrates that the pH of brine
has no distinct impact on the advancing contact angles and the wettability in this condensate–
brine–quartz rock system.
Figure 71: Dynamic Contact Angle against
pH in Condensate- Multi-Component Brines
Figure 72: Dynamic Contact Angle against
pH in Condensate-Single-Salt Brines
4.6.4 Effect of Brine Salinity/Composition and the pH of Brine on Spreading
Sessile drop method was used in this study to measure water-receding contact angles in
condensate-brine-quartz system to explore the effect of brine salinity (multi-component brines)
or brine composition (single-salt brines) on spreading behavior. The results of receding contact
20
40
60
80
100
120
140
160
180
20
40
60
80
100
120
140
160
180
5 5.5 6 6.5 7 7.5 8 8.5
Re
ced
ing
Co
nta
ct A
ngl
e,
de
g
Ad
van
cin
g C
on
tact
An
gle
, de
g
pH Advancing angle Receding angle
20
40
60
80
100
120
140
160
180
20
40
60
80
100
120
140
160
180
0 1 2 3 4 5 6 7 8 9
Re
ced
ing
Co
nta
ct A
ngl
e,
de
g
Ad
van
cin
g C
on
tact
An
gle
, de
g
pH Advancing angle Receding angle

140
angle and the images of receding contact angle at 24 hr for both multi-component brine system
and single-salt brine system are also displayed in Table 22 and Table 23. Receding contact
angles at 0 hr and 24 hr in both Tables mean the measured angles at the times of just placing the
condensate drop on the crystal surface and aging the drop for 24 hours, respectively.
For this representative condensate-brine-quartz system, the most interesting observation
is the large water-receding contact angles like 109º (3100 ppm NaCl brine) obtained for all
nineteen cases as can be seen in Table 22 and Table 23. It also can be found in both Tables that
the initial water-receding angles were smaller than those after 24 hours aging. This indicates the
spreading of the condensate drop on the quartz surface against brine.
0hr, θr=62º
(d/di=1.0,
h/hi=1.0)
2min, θr=77º
(d/di=1.09,
h/hi=0.86)
5min, θr=83º
(d/di=1.11,
h/hi=0.84)
3hr, θr=96º
(d/di=1.22,
h/hi=0.82)
24hr, θr=96º
(d/di=1.22,
h/hi=0.82)
Figure 73: Sessile Drop Contact Angle with Time for Condensate-Quartz-300 ppm Multi-
Component Brine
0hr, θr=87º
(d/di=1.0,
h/hi=1.0)
3min, θr=99º
(d/di=1.08,
h/hi=0.92)
15min, θr=101º
(d/di=1.11,
h/hi=0.85)
19hr, θr=103º
(d/di=1.126,
h/hi=0.83)
24hr, θr=107º
(d/di=1.129,
h/hi=0.82)
Figure 74: Sessile Drop Contact Angle with Time for Condensate-93,300 ppm MgCl2 Brine-
Quartz
The examples of the drop spreading process with time are depicted in Figure 73 and
Figure 74, where drop profiles were captured by the digital video system at short intervals during

141
the experiments of a condensate drop resting on a smooth quartz surface immersed in 300 ppm
synthetic multi-component brine and 93,300 ppm MgCl2 brine. In both Figures, receding contact
angles measured by sessile drop method, the dimensionless diameter/height of the sessile drop
which is defined by the ratio of the drop diameter/height to the initial (0 hr) diameter/height of
the sessile drop were also given. Figure 75 illustrates the variation of drop shape due to
spreading on the solid surface based on image analysis of the photographs of Figure 73 and
Figure 74.
Figure 75: Variation of Sessile Drop Shape due to Spreading on the Solid Surface
An increase in dimensionless drop diameter and reduce in dimensionless drop height as
can be clearly observed in Figure 73 and Figure 74 prove that the drop was spreading on the
surface. As soon as the condensate drop was placed on the quartz surface it began to spread on
the surface creating a pancake-like appearance with large receding angles such as 107º in 93,300
ppm MgCl2 brine case (Figure 74) even up to 120º in 77,910 ppm brine case (Table 22). This
phenomenon is schematically displayed in Figure 75. In some cases, this spreading process
occurred so fast that it only took a few minutes the receding angles changed from initial small

142
angle to the big one. For example, in the 300 ppm brine case, the initial receding angle of 62º
altered to 83º in five minutes as shown in Figure 73. Further, in some cases, after a few hours
such as 3 hours in 300 ppm brine case, the spreading process approached stabilization and the
angle was stable at the value of 96º; while in other cases, it took slightly longer time to reach
equilibrium. In 93,300 ppm MgCl2 brine case, as an example, after 19 hours of aging on the
quartz surface, the condensate drop still slowly spread on the surface as indicated by a receding
contact angle changing from 103º at 19 hr to 107º at 24 hr (Figure 74).
As can be seen from Table 22, in low salinity (less than 2700 ppm) and medium salinity
(26,800 ppm) multi-component brine cases, sessile drop experiments showed that the receding
angles varied from 58º to 98º. However, in high salinity multi-component brine cases, the
receding contact angles were in the range of 102º to 120º. Hence, the receding contact angles
obtained in high salinity multi-component brine systems were larger than those in low and
medium salinity multi-component brine systems.
In single-salt brine at low salinity (3100 ppm) system, the large equilibrium receding
contact angles (103~112°) were obtained for Na+, Ca
2+ and Mg
2+ brines; while 52° and 67° of
receding angles were obtained corresponding to Al3+
and Fe3+
brines as can be seen in Table 23.
And the equilibrium receding angles obtained for all the single-salt brines at high salinity of
93,300 ppm systems were ranged from 82° to 107°.
Receding contact angles against measured pH in multi-component brine cases and single-
salt brine cases also plotted in Figure 71 and Figure 72. Either larger (120°) or smaller (58°)
receding contact angles obtained under neutral conditions (6~7 of pH) in multi-component brine
system as shown in Figure 71 implies the insignificant effect of the pH of brine on the receding
contact angles and spreading in this condensate–brine–quartz rock system. However, the smaller
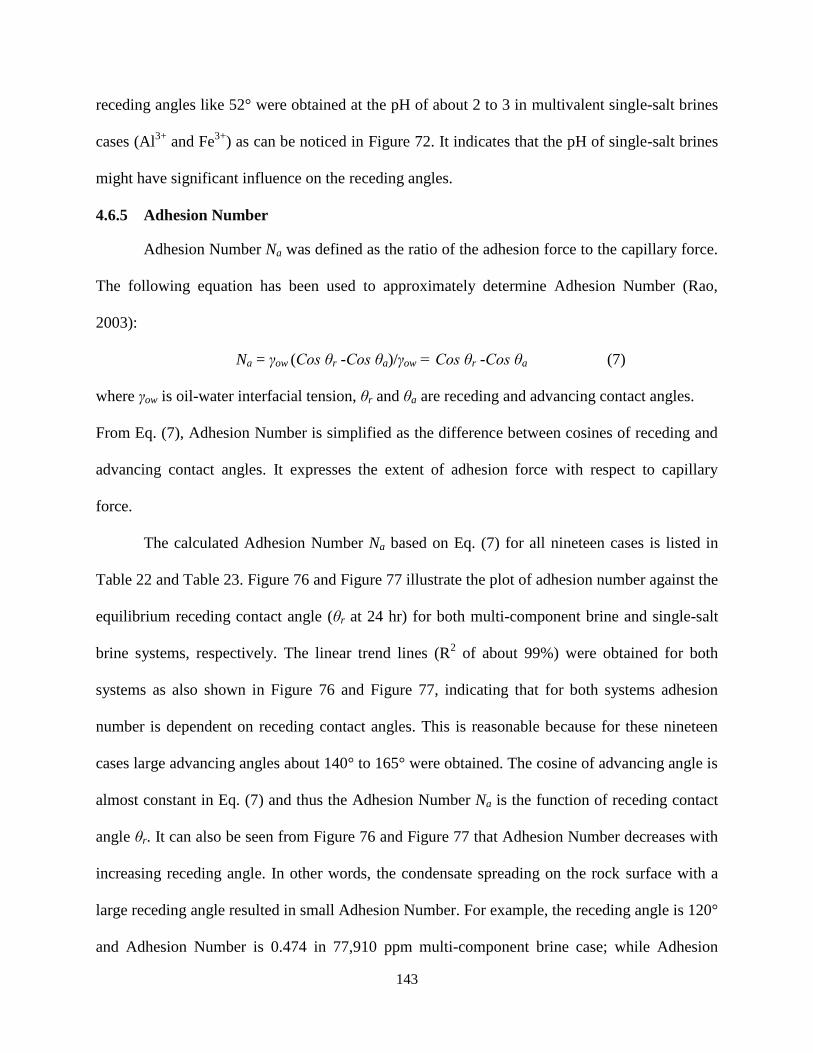
143
receding angles like 52° were obtained at the pH of about 2 to 3 in multivalent single-salt brines
cases (Al3+
and Fe3+
) as can be noticed in Figure 72. It indicates that the pH of single-salt brines
might have significant influence on the receding angles.
4.6.5 Adhesion Number
Adhesion Number Na was defined as the ratio of the adhesion force to the capillary force.
The following equation has been used to approximately determine Adhesion Number (Rao,
2003):
Na = γow (Cos θr -Cos θa)/γow = Cos θr -Cos θa (7)
where γow is oil-water interfacial tension, θr and θa are receding and advancing contact angles.
From Eq. (7), Adhesion Number is simplified as the difference between cosines of receding and
advancing contact angles. It expresses the extent of adhesion force with respect to capillary
force.
The calculated Adhesion Number Na based on Eq. (7) for all nineteen cases is listed in
Table 22 and Table 23. Figure 76 and Figure 77 illustrate the plot of adhesion number against the
equilibrium receding contact angle (θr at 24 hr) for both multi-component brine and single-salt
brine systems, respectively. The linear trend lines (R2 of about 99%) were obtained for both
systems as also shown in Figure 76 and Figure 77, indicating that for both systems adhesion
number is dependent on receding contact angles. This is reasonable because for these nineteen
cases large advancing angles about 140° to 165° were obtained. The cosine of advancing angle is
almost constant in Eq. (7) and thus the Adhesion Number Na is the function of receding contact
angle θr. It can also be seen from Figure 76 and Figure 77 that Adhesion Number decreases with
increasing receding angle. In other words, the condensate spreading on the rock surface with a
large receding angle resulted in small Adhesion Number. For example, the receding angle is 120°
and Adhesion Number is 0.474 in 77,910 ppm multi-component brine case; while Adhesion
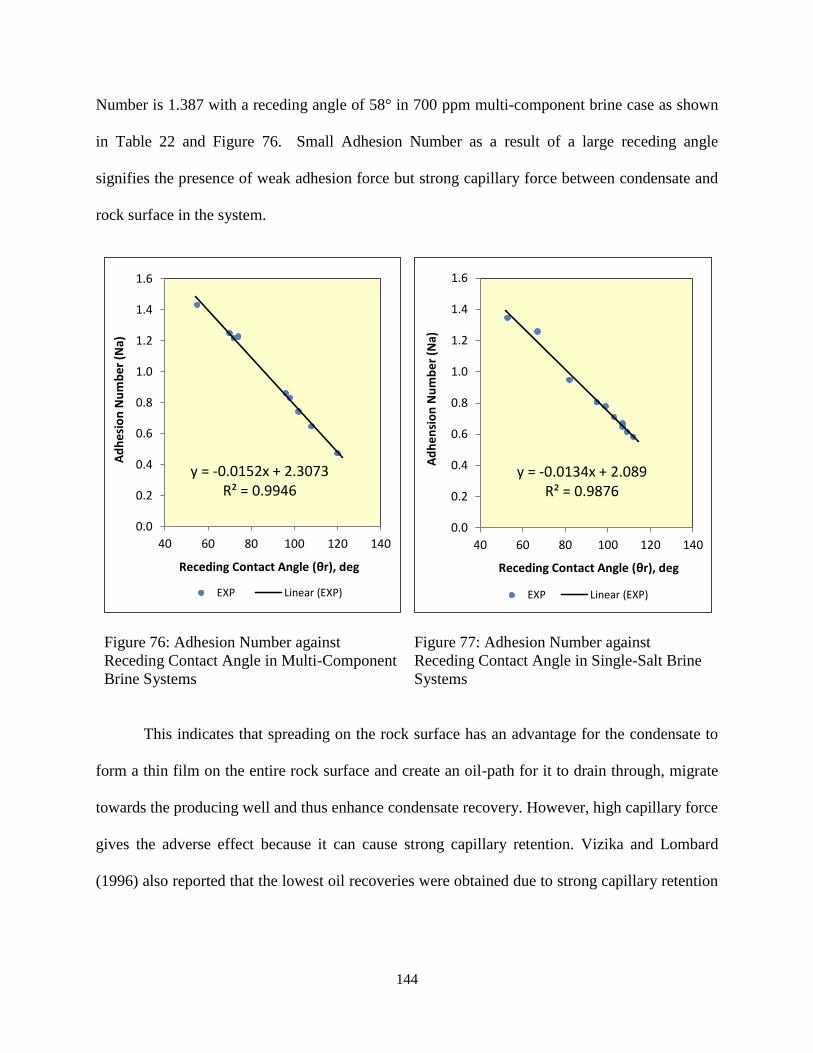
144
Number is 1.387 with a receding angle of 58° in 700 ppm multi-component brine case as shown
in Table 22 and Figure 76. Small Adhesion Number as a result of a large receding angle
signifies the presence of weak adhesion force but strong capillary force between condensate and
rock surface in the system.
Figure 76: Adhesion Number against
Receding Contact Angle in Multi-Component
Brine Systems
Figure 77: Adhesion Number against
Receding Contact Angle in Single-Salt Brine
Systems
This indicates that spreading on the rock surface has an advantage for the condensate to
form a thin film on the entire rock surface and create an oil-path for it to drain through, migrate
towards the producing well and thus enhance condensate recovery. However, high capillary force
gives the adverse effect because it can cause strong capillary retention. Vizika and Lombard
(1996) also reported that the lowest oil recoveries were obtained due to strong capillary retention
y = -0.0152x + 2.3073 R² = 0.9946
0.0
0.2
0.4
0.6
0.8
1.0
1.2
1.4
1.6
40 60 80 100 120 140
Ad
he
sio
n N
um
be
r (N
a)
Receding Contact Angle (θr), deg
EXP Linear (EXP)
y = -0.0134x + 2.089 R² = 0.9876
0.0
0.2
0.4
0.6
0.8
1.0
1.2
1.4
1.6
40 60 80 100 120 140
Ad
he
nsi
on
Nu
mb
er
(Na)
Receding Contact Angle (θr), deg
EXP Linear (EXP)

145
in oil-wet porous media, although in this condition oil remained continuous through wetting
films.
4.6.6 Receding Contact Angle with Interfacial Tension in Multi-Component Brines
Figure 78 displays the plot of receding contact angle with interfacial tension in multi-
component brine system.
Figure 78: Receding Contact Angle versus Condensate-Water Interfacial Tension in Multi-
Component Brine Systems
The receding contact angles distribute randomly against condensate-water interfacial
tensions as shown in Figure 78. Also, the dilution of multi-component brines did not cause
significant IFT change as discussed in the preceding section. Large interfacial tension (about
26~34 mN/m shown in Figure 78) obtained demonstrates the high surface energy resulting in
much more stabilization of condensate in condensate/multi-component brine systems. When the
IFT of oil decreased below Zisman-type critical spreading tension (Zisman, 1964), the oil spread
on the solid surface with high receding contact angles (Vijapurapu and Rao, 2004). This
phenomenon is referred to Zisman-type plot and Zisman-type spreading characteristic. However,
Zisman-type plot and Zisman-type spreading characteristic were not observed in this study. The
0
15
30
45
60
75
90
105
120
135
150
20 25 30 35 40
Wat
er-
rece
din
g co
nta
ct a
ngl
e, d
eg
Oil-Water Interfacial Tension, mN/m

146
probable reason is that, compared to crude oil, the condensate has less heavy ends (Table 2) and
thus has the stronger stability in brine, resulting in interfacial tension of condensate above the
critical spreading tension induced by brine dilution.
4.6.7 Preliminary Analysis of Spreading Mechanism
In this study, contact angle data obtained from the sessile drop experiments showed that
the condensate drop spread on the quartz surface with large receding contact angles. This raises a
question as to whether the condensate drop was spread on a film of water wetting the quartz
surface or was it spreading on the quartz surface itself by de-stabilizing the water film. Hence,
the stability of thin wetting water films on the rock surface is the key to analyze the three-phase
(rock-condensate-brine) interactions.
The presence of thin wetting water films and their stability has a profound effect on
spreading, adhesion and wettability of a surface by a fluid in competition with another fluid. The
stability of the thin wetting films of water on the rock surface is affected by several factors such
as brine composition, brine pH, electrostatic potential on the rock surface, the applied capillary
pressure and temperature (Derjaguin et al., 1978; Hall et al., 1983; Hirasaki, 1991; Gupta and
Sharma, 1991; Rao, 1999). The stability of thin films is expressed in terms of disjoining pressure,
which is the force that tends to disjoin or separate two interfaces. A negative disjoining pressure
means attraction between two interfaces.
Disjoining pressure results from intermolecular or interionic forces described by the
DLVO theory, which has been applied to the colloid systems to explain their stability (Derjaguin
et al., 1987, 1989). In this theory, three interfacial forces, including double layer repulsion or
attraction, London van der Waals attraction, and poorly characterized short-range “non-DLVO”
forces such as hydration and steric repulsion, were considered to take effect together on
interfaces between rock and fluids (Ryan and Elimelech, 1996). The electrical double layer

147
forces arise from the overlap of diffuse clouds of ions (double layer) that accumulate near
charged surfaces to balance the surface charge. They will be either repulsive or attractive
depending on the charges of interacting surfaces and their strength can be affected by chemistry
of surrounding solution. For example, if the interacting surfaces are like-charged, the double
layer forces will be repulsive and vice versa. The van der Waals forces caused by electrostatic
attraction between temporary fluctuating dipoles in the molecules are long-range forces and
always attractive. They exist between all matter and thus are an important component of the
surface forces in thin films. The van der Waals forces strongly depend on the nature of
interacting material and will not be affected by surrounding solutions. The short-range “non-
DLVO” repulsive forces are not well understood so far, however, it is believed that these forces
are intermolecular structural forces and often attributed to some form of hydration or steric
repulsion. The short-range repulsive forces are also believed to be very strong at separation
distances less than a few nanometers (Ryan and Elimelech, 1996).
For silica, the surface becomes negatively charged when the pH is increased above 2 to
3.7, while calcite does not become negatively charged until the pH is greater than 8 to 9.5.
Hence, in water near neutral pH, silica is negatively charged and tends to adsorb organic bases,
while calcite is positively charged and tends to adsorb organic acids (Anderson, 1986a). The
negatively charged quartz surface is attributed to the dissociation of silanol groups and forms
electrical double layer with H+ and OH
- from water (Iler, 1979):
SiOH↔ SiO- + H
+
Electric double layers are also formed at the interface between an aqueous phase and an
oil (condensate) phase. Some researchers have shown that the charge on oil/brine interface
depends on brine pH and it appears that the adsorption of OH- ions gives rise to a significant
148
surface-charge density if the oil phase has no polar constituent (Hall et al., 1983; Takamura and
Chow, 1985; Buckley et al., 1989). In terms of their findings, at low pH, oil has positive charges
(dominated by ionized bases); while oil charge reduces as pH increases until it approaches zero
at the isoelectric point and then transfers to strongly negative at high pH values (dominated by
ionized acids). This charge alteration from positive to negative has been found in many oils and
the isoelectric point occurs at the pH range of 2 to 6 dependent on oil composition.
In this study, during the sessile drop experiments, the quartz surface (silica) was first
immersed in aqueous phase. The hydrophilic nature of quartz surface causes the formation of
stable thin water films on the surface. Further, according to the above findings, if the pH of the
aqueous solution is in the range of 5 to 7, the quartz/water interface is negatively charged and
condensate/brine interface also has negative charges. As a consequence, the electrostatic
repulsion arising from similar electric charge and potential at interacting interfaces would take
place between quartz surface and condensate drop in terms of the DLVO theory. And the thin
water film on the quartz surface is stabilized by the repulsive forces.
From the observations of the sessile drop experiments, in low salinity (3100 ppm) single-
salt Na+, Ca
2+ and Mg
2+ brine cases, the oil (condensate) drop immediately adhered to the surface
and then spread on the quartz surface as it was placed on the surface, resulting in a large receding
contact angle such as 109° in Na+ brine case and 112° in Mg
2+ brine case (Table 23). These
phenomena of condensate drops adsorbing and spreading on the surface indicate that the thin
water films on the surface were destabilized due to changes in surface forces. In low salinity
Na+, Ca
2+ and Mg
2+ brines, the pH varied from 5.5 to 6.3 (Table 21), suggesting the repulsive
forces between the like-negatively charged quartz/brine and oil/brine interfaces. But in the
presence of cations of Na+, Ca
2+, Mg
2+ in aqueous phase, the cations can shield the same

149
negative charges of condensate drops and quartz surfaces and thus compact the double layers
formed between them. The net repulsive interaction forces and potential between condensate
drops and quartz surfaces then decrease. Meanwhile, the attractive London-van der Waals forces
become more dominant compared to the double layer repulsion forces. The excess van der Waals
attraction results in the rupture of the thin wetting films and thus adsorption of the condensate
drop on the quartz surface. Similar observations were found in the work of Cao et al. (2009,
2010) where colloid (virus) adsorption on the sand grains was increased with the addition of the
monovalent NaCl salt.
In addition, for divalent cations of Ca2+
, Mg2+
, except van der Waals attractive forces,
cation bridges formed between like-charged condensate drop and quartz surface are also
responsible for attracting the condensate drop on the surface (Buckley et al., 1998).
It can be seen from Table 22 that in the deionized water (DIW) without any ions (0 ppm,
pH=7.1in Table 20) the receding contact angle measured is about 72°, smaller than those in low
salinity (3100 ppm) single-salt Na+, Ca
2+ and Mg
2+ brine cases. The spreading behavior was also
found not to be as dramatic compared with these three cases. This is the consequence of the
electrostatic repulsive forces between the condensate/DIW and DIW/quartz interfaces due to
similar negative charges on both interfaces.
An unexpected observation could be noticed in the low salinity (3100 ppm) multivalent
(Al3+
and Fe3+
) brine cases. It was slightly difficult to place the condensate drop on the quartz
surface during the experimental process. When the drop touched the surface, it flew away from
the surface. After several repeats, the condensate drop was finally put on the surface but it did
not spread on the surface like a pancake which occurred in Na+, Ca
2+, Mg
2+ cases. And low
receding angles of about 67° and 52° for Al3+
and Fe3+
brine cases were obtained as shown in

150
Table 23. The pH values for these two brines, shown in Table 21, are 3.2 and 2.6 suggesting
acidic conditions, which are caused by the hydrolysis of cations of Al3+
and Fe3+
in water.
Multivalent Al3+
and Fe3+
are hydrated cations which first attract H2O molecules and form
hydration and then hydrolyze in water to produce H3O+. This acid hydrolysis gives the low pH
values. The reactions for hydration and hydrolysis of Al3+
and Fe3+
are given in below.
Hydration: Fe3+
+ 6H2O Fe(H2O)63+
or Al3+
+ 6H2O Al(H2O)63+
Hydrolysis: Fe(H2O)63+
(aq) + H2O(l) H3O+
(aq) + Fe(H2O)5(OH2+
)(aq)
Al(H2O)63+
(aq) + H2O(l) H3O+
(aq) + Al(H2O)5(OH2+
)(aq)
Although cations Al3+
and Fe3+
can provide more positive charges to balance the opposite
charged interacting interfaces, the short-range repulsive forces owing to hydration of these
strongly hydrated cations based on the DLVO theory are more pronounced than van der Waals
attractive forces between condensate drops and quartz surfaces. The net repulsion accounts for
the stability of the thin water films on the surface and thus causes low receding contact angles.
This is in agreement with the work of Pashley (1984) who pointed out that the presence of more
strongly hydrated trivalent ions augments the short-range repulsion.
In high salinity (93,300 ppm) single-salt Na+, Ca
2+, Mg
2+ brine cases, the large receding
angles of about 99° to 107°, as shown in Table 23, were obtained, similar to the observations of
the low salinity (3100 ppm) cases. However, in high salinity multivalent Al3+
and Fe3+
brine
cases, the experimental observations are different from those in low salinity brine cases.
Condensate did spread on the quartz surface and the large receding angles of 82° for Fe3+
and
94° for Al3+
were also obtain in these two brines as can be seen in Table 23. Overall, in all of
high salinity single-salt brines, large receding contact angles obtained indicate the destabilization
of the thin wetting films on the quartz surface. Hall et al. (1983) investigated the dependence of

151
the wetting-film thickness on electrolyte concentration and pore size, and found that wetting-film
thickness decreased as the electrolyte concentration in brine increased according to their
calculations from overlapping electrical double-layer theory. In other words, at higher electrolyte
concentrations, the electric potential between the interacting interfaces is decreased, and this
reduces the repulsive force between them, destabilizing the films of smaller thickness. These
findings of Hall et al. (1983) support that in high salinity single-salt brine cases, the
concentration of ions becomes a dominant factor responsible for the decrease in the repulsion
between condensate drops and quartz surfaces. This reduced repulsion results in the rupture of
the thinner wetting films, spreading of the drop on the surface and thus large receding contact
angles.
In multi-component brine systems, the pH for low and high salinity multi-component
brines is about 6 to 7, almost neutral conditions. The receding contact angle results (Table 22)
show that although the condensate/brine/ quartz rock interactions in multi-component brine
systems are more complex than those in single-salt brine systems, the spreading behavior of
condensate drop in high salinity brines is more distinct than that in low brine salinity brines.
In high salinity multi-component brine cases (52, 800 ppm, 77,910 ppm and 125,500
ppm), it can be obviously observed from Table 22 that large receding angles of 102°~120° were
obtained from the experiments. This agrees with the results in high salinity single-salt brine
cases, which also have large receding angles. The high concentration of ions in these brines is
also crucial to be in charge of the rupture of the thin aqueous films on the surface and large
receding angles.
The receding contact angles varied from 58° to 98° in low salinity (300~2700 ppm)
multi-component brine cases and 70° in medium salinity (26,800 ppm) multi-component brine

152
case. The results are more complex than those in low salinity single-salt brines. In the cases with
small receding contact angles, the repulsive forces between the condensate drop and quartz
surface are predominant causing the stability of the thin wetting films on the surface; while the
attraction is more striking in large receding angle cases. The mechanism of the fluctuating
repulsive and attractive forces may be the cause for the uncertainties of the poorly characterized
short-range “non DLVO” forces in the presence of strongly hydrated multivalent cations of Al3+
and Fe3+
in low salinity multi-component brines.
The underlying mechanism accounting for the variation of the receding angles in multi-
component brine systems, especially in low salinity brines cannot be elucidated simply by
contact angle measurements. Other experimental measurements such as zeta-potential, acid and
base number should be further investigated to explore and fully understand the key mechanisms
behind the spreading behavior observed in multi-component brine systems.

153
5. CONCLUSIONS AND RECOMMENDATIONS
5.1 Summary of Findings and Conclusions
Surfactants and brine salinity and composition were tested in this study to evaluate their
effect on interfacial tension, fluid-fluid spreading coefficient, wettability and relative
permeability to mitigate condensate blockage problems in gas-condensate reservoirs. The
significant conclusions of this study are summarized below.
5.1.1 Effect of Surfactants on Wettability
1. The reservoir wettability was determined through measuring contact angles using the DDDC
technique. The advancing contact angles of 151° and 153° at ambient and reservoir
conditions demonstrated that this representative sandstone condensate reservoir has a
strongly oil-wet nature under both conditions. This observation negates the generally held
notion that the heavy ends in crude oils are responsible for rendering oil-wet characteristics
to reservoirs.
2. The dynamic contact angle measurements with and without anionic and nonionic surfactants
(500, 1500, 3000 ppm) at ambient conditions indicate that the initially strongly oil-wet nature
of this particular reservoir rock-brine-condensate was altered by the anionic surfactant to
weakly oil-wet or intermediate-wet nature. However, the reservoir wettability was not
modified by the nonionic surfactant which remained strongly oil-wet.
3. Based on DDDC contact angle measurements at reservoir conditions, the surfactant-induced
wettability alteration did not occur in the 500 ppm case with the anionic surfactant. As the
surfactant concentrations increased to 1500 and 3000 ppm, it was observed that the anionic
surfactant altered the reservoir wettability from strongly oil-wet to weakly oil-wet or
intermediate-wet for this particular reservoir case. It reiterates that the rock-fluid interactions

154
depend on pressure and temperature and the consequent need to make such measurements at
actual reservoir conditions.
4. The fluid-fluid and rock-fluid interactions and their dependence on type and concentration of
surfactants examined in this study at both ambient and reservoir conditions have
demonstrated the potential of the beneficial effects of wettability alteration and spreading
coefficient reduction in resolving condensate blockage problems.
5.1.2 Effect of Surfactants on IFT and Spreading Coefficient
1. At ambient conditions, anionic and nonionic surfactants reduced the interfacial tension in
brine-condensate (σow from 22.94 to 3 mN/m) and brine-methane systems (σwg from 70.01 to
28 mN/m) and had less influence on lowering interfacial tension in condensate-methane
systems (σog =20.58 mN/m).
2. At reservoir conditions, the nonionic surfactant had poor thermal stability and was therefore
rejected for use in further experimentation. The anionic surfactant also decreased the
interfacial tensions in brine-condensate (σow from 9.10 to 1 mN/m) and brine-methane
systems (σwg from 43.87 to 10.72 mN/m). In condensate-methane systems, however, methane
developed miscibility with condensate at reservoir pressure and temperature (σog = 0 mN/m).
3. Positive spreading coefficients were obtained with and without surfactants (anionic and
nonionic) at ambient and at reservoir conditions (anionic), but the spreading coefficients did
decrease in magnitude after surfactant application under both conditions. This declining trend
indicates that the use of the surfactants in this strongly oil-wet condensate reservoir could
improve condensate recovery and gas relative permeability. However, compared to the role
played by wettability alteration, spreading coefficient played a relatively minor role in
enhancing gas relative permeability in this condensate reservoir case.

155
5.1.3 Effect of Surfactants on Relative Permeability and Recovery
1. The anionic surfactant treatment in this Berea rock-condensate-synthetic brine was effective in
enhancing both the condensate recovery and gas relative permeability. The improvements in
condensate recovery and gas relative permeability were up to 23% OOIP and 82% at 1500
ppm surfactant concentration, respectively. This implies that the low surfactant concentration
can be effective make the surfactant treatment more economical in the field.
2. The gradual rightward shift in relative permeability ratio curves induced by surfactant
demonstrated the wettability alteration to intermediate-wet in this rock-fluids system. The
advancing contact angles measured in this system also substantiate the wettability shift to
intermediate-wet due to the ability of this anionic surfactant.
3. A change in the temperature for aging period from ambient temperature (68 °F) to reservoir
temperature (210 °F) resulted in a marginal increment of oil (condensate) recovery of up to 5%
original oil in place (OOIP) in this Berea sandstone rock-condensate-synthetic brine. This
can be attributed to slight wettability alteration induced by the temperature increase.
5.1.4 Effect of Brine Salinity
1. Condensate-brine interfacial tensions measured in different salinity multi-component brine
and single-salt brine systems varied from 26mN/m to 34mN/m. Wettability was determined
by DDDC technique for both multi-component and single-salt brine systems. Large
advancing angles of about 140° to 165° obtained in this study for all nineteen cases show a
surprisingly strongly oil-wet nature of a gas-condensate fluid. No significant change in
interfacial tension and wettability for all cases implies that brine salinity and composition
have very little influence within the ranges studied.

156
2. The pH of brine was measured for all cases. In multi-component brine systems, the pH is
about 6 to 7. In single-salt brine systems, the pH of brine varied between 2 to 3 for
multivalent brines (Al3+
, Fe3+
) but 5 to 7 for divalent brines (Ca2+
, Mg2+
) and monovalent
brine (Na+). Although the pH changed, no particular effect on condensate-brine interfacial
tension and wettability was observed.
3. The variation of brine salinity and brine composition yielded an unexpected observation in
that the condensate drop spread on the rock surface resulting in a large receding contact
angle. This spreading behavior was more pronounced in high salinity brine (both multi-
component and single-salt) systems.
4. Stability of the thin aqueous films is responsible for the adsorption and spreading of the
condensate onto the quartz surface.
5.1.5 Key Mechanisms from Observed Results
1. The dynamic behavior of condensate drops was visually observed on the quartz surface
during surfactant injection and after surfactant injection at reservoir conditions. The possible
explanation for the observed dynamic behavior was given on the basis of their relative
affinity to the rock-liquid (brine or condensate) and brine-condensate interfaces.
2. The dimensionless Bond number was used to explain the dynamic capillary/gravity effect on
condensate drops on the lower substrate at ambient and reservoir conditions. It was shown
that the Bond number which includes the contact angle term quantitatively better interprets
the rock-fluids interactions at both conditions.
3. The coreflood results show the weakly water-wet nature for this rock-fluids system.
However, the wettability of this rock-fluids system inferred from DDDC contact angle
measurements is strongly oil-wet. These contradictory wettabilities appear to be related to

157
rock pore structure caused by insufficient aging time in corefloods as well as fines migration
observed in the experiments. The results show the wettability interpretation from relative
permeability data is subject uncertainties due to the dependence of relative permeability on
factors other than wettability. It further points out, as has been established in the literature,
that making an independent wettability measurement such as reproducible contact angle
measurements is more important than that determined from relative permeability data.
4. A reduction of two orders of magnitude in oil-water interfacial tension was obtained with this
anionic surfactant in this rock-fluids system, which is insufficient for enhancing condensate
recovery. This clearly proves that the predominance of wettability alteration mechanism over
reduction of interfacial tension and spreading coefficient is the principal reason to modify
multiphase flow characteristics and oil (condensate) recovery in this Berea sandstone rock.
5.2 Recommendations for Future Work
1. To use the chemicals to create the core with artificial strongly oil-wet nature, then use the
same surfactants to test the effect of surfactants on wettability, spreading, and enhanced oil
recovery and gas productivity;
2. To measure Zeta potential to determine the interaction with quartz or sandstone in the
presence of different saline solutions;
3. To measure polar components in the condensate, both acidic and basic;
4. To Test the effect of the dual-salt brines with various salinities (ex. Na+ + Al
3+/ Fe
3+,
Ca2+
/Mg2+
+ Al3+
/Fe3+
) on water-advancing and receding contact angles;
5. To conduct the similar experiments to examine brine salinity/composition effect under the real
reservoir conditions;
6. To perform compositional simulations on the basis of experimental results to evaluate the
economics of surfactant treatment;

158
7. To perform similar contact angle measurements in a crude oil instead of condensate system,
using brines with various salinities and quartz surface to compare the results of both
condensate and crude oil systems.
`
159
REFERENCES
1. Abdel-Wali, A. A.: “Effect of Simple Polar Compounds and Salinity on Interfacial Tension
and Wettability of Rock/Oil/Brine System,” Journal of King Saud University-Engineering
Science, 1996, 8(2): 153-163.
2. Abel, W., Jackson, R.F. and Wattenbarger, R. A.: “Simulation of a Partial Pressure
Maintenance Gas Cycling Project with a Compositional Model, Carson Creek Field,
Alberta,” Journal of Petroleum Technology, Jan., 1970, p. 38.
3. Afidick, D. Kaczorowski, N. J. and Bette, S.: “Production Performance of Retrograde Gas
Reservoir: A Case Study of the Arun Field,” paper SPE 28749, presented at the SPE Asia
Pacific Oil and Gas Conference, Melbourne, Australia, Nov. 7-10, 1994.
4. Agbalaka, C.C., Dandekar, A. Y., Patil, S. L., Khataniar, S. and Hemsath, J. R.:
“Coreflooding Studies to Evaluate the Impact of Salinity and Wettability on Oil Recovery
Efficiency,” Transport in Porous Media 76(1):77-94.
5. Al-Abri, A., Sidiq, H. and Amin, R.: “Enhanced Natural Gas and Condensate Recovery by
Injection of Pure SCCO2, Pure CH4 and Their Mixtures: Experimental Investigation,” paper
SPE 124145, presented at the SPE Annual Technical Conference and Exhibition held in New
Orleans, Louisiana, USA, 4-7 October, 2009.
6. Al-Anazi, H. A., Pope, G. A., Sharma, M. M., and Metcalfe, R. S.: “Laboratory
Measurements of Condensate Blocking and Treatment for Both Low and High Permeability
Rocks,” paper SPE 77546, presented at the SPE Annual Technical Conference and
Exhibition, San Antonio, TX, 29 Sep.-2 Oct., 2002.
7. Al-Anazi, H. A., Walker, J. G., Pope, G. A., Sharma, M. M, and Hackney, D. F.: “A
Successful Methanol Treatment in a Gas-Condensate Reservoir: Field Application,” SPE
Production & Facilities, February 2005, 60-69.
8. Alotaibi, M. B. and Nasr-El-Din, H. A.: “Effect of Brine Salinity on Reservoir Fluids
Interfacial Tension,” paper SPE 121569, presented at SPE EUROPEC/EAGE Annual
Conference and Exhibition held in Amsterdam, the Netherlands, 8-11 June, 2009.
9. Alotaibi, M. B., Nasralla, R. A., and Nasr-EI-Din, H. A.: “Wettability Studies Using Low-
Salinity Water in Sandstone Reservoirs,” SPE Reservoir Evaluation & Engineering,
December 2011, 713-725.
10. Allen, F. H. and Roe, R.P.: “Performance Characteristics of a Volumetric Condensate
Reservoir,” Petroleum Transactions, AIME, Vol. 189, 1950, p. 83.
11. Anderson, W. G.: “Wettability Literature Survey—Part 1: Rock/Oil/Brine Interactions and
the Effects of Core Handling on Wettability,” Journal of Petroleum Technology, October,
1986 (a).

160
12. Anderson, W. G.: “Wettability Literature Survey- Part 2: Wettability Measurement,” Journal
of Petroleum Technology, October, 1986 (b), p.1246-1262.
13. Anderson, W. G.: “Wettability Literature Survey- Part 5: The effects of Wettability on
Relative Permeability,” Journal of Petroleum Technology, November, 1987.
14. Antoci, J. C., Briggiler, N. J. and Chadwich, J. A.: “Crosslink Methanol: Analysis of a
Successful Experience in Fracture Gas Wells,” paper SPE 69585, presented at SPE Latin
American and Caribbean Petroleum Engineering Conference, Buenos Aires, March 25-28,
2001.
15. Araujo, Y. C., Araujo, M., Guzman, H. and Moya, G.: “Effect of the Spreading Coefficient
on Two-Phase Relative Permeability,” paper SPE 65385, presented at the SPE International
Symposium on Oilfield Chemistry held in Houston, Texas, 13-16 February, 2001.
16. Ashraf, A., Hadia, N. J., Torstæer, O. and Tweheyo, M. T.: “Laboratory Investigation of
Low Salinity Waterflooding as Secondary Recovery Process: Effect of Wettability,” paper
SPE 129012, presented at the SPE Oil and Gas India Conference and Exhibition held in
Mumbai, India, 20-22 January, 2010.
17. Austad, T. and Standnes, D. C.: “Spontaneous Imbibition of Water into Oil-Wet Carbonates,”
Journal of Petroleum Science and Engineering, 39 (2003) 363-376.
18. Ayirala, S. C.: “Surfactant-induced Relative Permeability Modifications for Oil Recovery
Enhancement,” M.S. Thesis, Louisiana State University, Baton Rouge, December 2002.
19. Ayirala, S. C. and Rao, D. N.: “Multiphase Flow and Wettability Effects in Porous Media,”
Colloids and Surfaces A: Physicochemical and Engineering Aspects, 241 (2004), p.313.
20. Ayirala, S. C., Vijapurapu, C. S. and Rao, D. N.: “Beneficial Effects of Wettability Altering
Surfactants in Oil-Wet Fractured Reservoirs,” Journal of Petroleum Science and
Engineering, 52 (2006), 261 – 274.
21. Ayyalasomayajula, P., Silpngarmlers, N., Berroteran, J., Sheffield, J. and Kamath, J.:
“Condensate Relative Permeability Data for Well Deliverability Predictions for A Deep
Marine Sandstone Reservoir,” paper SCA 2003-33, 2003.
22. Aziz, R.: “Deliverability Projection Model for Overpressured Gas-Condensate Reservoirs,”
paper SPE 13706, presented at SPE Middle East Technical Conference and Exhibition,
Bahrain, March 11-14, 1985.
23. Babadagli, T., “Analysis of Oil Recovery by Spontaneous Imbibition of Surfactant Solution”,
paper SPE 84866, SPE International Improved Oil Recovery Conference in Asia Pacific,
Kuala Lumpur, Malaysia, 20-21October, 2003.
24. Bagci, S., Kok, M. V. and Turksoy, U.: “Effect of Brine Composition on Oil Recovery by
Waterflooding,” Petroleum and Technology, 19(3&4), 359-372, 2001.
161
25. Baig, T., Droegemueller, U. and Gringarten, A.C.: “Productivity Assessment of Fractured
and Non-Fractured Wells in a Lean/Intermediate Low Permeability Gas Condensate
Reservoir,” paper SPE 93136, presented at SPE Europec/EAGE Annual Conference, Madrid,
Spain, 13-16 June 2005.
26. Bang, V., Kumar, V., Ayyalasomayajula, P., Pope, G. A. and Sharma, M. M: “Relative
Permeability of Gas-Condensate Fluids: A General Correlation,” paper SPE 102741,
presented at the SPE Annual Technical Conference and Exhibition, San Antonio, TX, 24-27
September 2006.
27. Bang, V., Pope, G. A. and Sharma, M. M: “Development of a Successful Chemical
Treatment for Gas Wells with Water and Condensate Blocking Damage,” paper SPE 124977,
presented at the SPE Annual Technical Conference and Exhibition, New Orleans, LA, Oct.
4-7, 2009.
28. Bang, V., Pope, G. A., Sharma, M. M, Baran Jr., J. R. and Ahmadi, M.: “A New Solution to
Restore Productivity of Gas Wells with Condensate and Water Blocks,” SPE Reservoir
Evaluation & Engineering, April 2010, 323-331.
29. Barnum, R. S., Brinkman, F. P., Richardson, T. W. and Spillette, A. G.: “Gas Condensate
Reservoir Behavior: Productivity and Recovery Reduction Due to Condensation,” paper SPE
14413 presented at the SPE Annual Technical Conference and Exhibition, Dallas, TX,
October 22-25, 1995.
30. Bernard, G. G.: “Effect of Floodwater Salinity on Recovery of Oil from Cores Containing
Clays,” paper SPE 1725, presented at the 38th
Annual California Regional Meeting of the
Society of Petroleum Engineers of AIME, Los Angeles, California, 26-27 October, 1967.
31. Boom, W., Wit, K., Zeelenberg, J. P. W., Weeda, H. C. and Maas, J. G.: “On the Use of
Model Experiment for Assessing Improved Gas-Condensate Mobility under Near-Wellbore
Flow Conditions,” paper SPE36714, presented at the SPE Annual Technical Conference and
Exhibition held in Denver, Colorado, USA, 6-9 October, 1996.
32. Bozorgzadeh, M. and Gringarten, A. C.: “Condensate-Bank Characterization from Well-Test
Data and Fluid PVT Properties,” SPE Reservoir Evaluation & Engineering, October 2006,
596-611.
33. Buckley, J. S., Takamura, K. and Morrow, N. R.: “Influence of Electrical Surface Charges on
the Wetting Properties of Crude Oils,” SPE Reservoir Engineering, 1989, 4 (3): 332-342.
34. Buckley, J. S., Liu, Y., and Monsterleet, S.: “Mechanisms of Wetting Alteration by Crude
Oils,” SPE Journal, March 1998, 54-61.
35. Cai, B., Yang, J. and Guo, T., “Interfacial Tension of Hydrocarbon + Water/Brine Systems
under High Pressure,” Journal of Chemical and Engineering Data 41 (3):493-496.

162
36. Cao, H., Tsai, F. T-C. and Rusch, K. A.: “The Impact of Salinity on MS-2 Sorption in
Saturated Sand Columns – Fate and Transport Modeling,” Journal of Environmental
Engineering, ASCE, 135 (10), 2009, 1041-1050.
37. Cao, H., Tsai, F. T-C. and Rusch, K. A.: “Salinity and Soluble Organic Matter on Virus
Sorption in Sand and Soil Columns,” Ground Water, 48(1), 2010, 42-52.
38. Catchpole, J. P. and Fulford, G.: “Dimensionless Groups,” Ind. Eng. Chem., 58, 1966, p46-
60.
39. Clark, T. J.: “The Application of a 2-D Compositional, Radial Model to Predict Single-Well
performance in a Rich Gas Condensate Reservoir,” paper SPE 14413, presented at the SPE
Annual Technical Conference and Exhibition, Las Vegas, NV. Sep. 22-25, 1985.
40. Clementz, D. M.: “Clay Stabilization in Sandstones through Adsorption of Petroleum Heavy
Ends,” Journal of Petroleum Technology, September 1977, 1061-1066.
41. Craig, F. F., “The Reservoir Engineering Aspects of Waterflooding,” Monograph Series,
SPE, Richardson, TX (1971) 3.
42. CYDAR coreflood simulator, http://www.cydarex.fr/, (August, 2010).
43. Derjaguin, B. V., Zorin, Z. M., Churaev, N. V., and Shishin, V. A.: “Examination of Thin
Layers of Liquid on Various Solid Substrates,” Wetting, Spreading and Adhesion, J. F.
Padday (ed.), Academic Press, New York (1978).
44. Derjaguin, B. V., Churaev, N. V., and Muller, V. M.: “Surface Forces,” Consultants Bureau,
New York City, 1987.
45. Derjaguin, B. V., “Theory of Stability of Colloids and Thin Films,” Consultants Bureau, New
York City, 1989.
46. DSA software data base, Kruss Company.
47. Du, L., Walker, J. G., Pope, G. A., Sharma, M. M, and Wang, P.: “Use of Solvents to
Improve the Productivity of Gas Condensate Wells,” paper SPE 62935, presented at SPE
Annual Technical Conference and Exhibition, Dallas, Texas, 1-4 October, 2000.
48. Duggan, J.O., “The Anderson ‘L’- An Abnormally Pressured Gas Reservoir in South Texas,”
Journal of Petroleum Technology, Feb., 1972, 132.
49. Eikeland, K. M. and Hansen, H.: “Dry-Gas Reinjection in a strong Waterdrive Gas-
Condensate Field Increases Condensate Recovery-Case study: The Slerpner Ty Field, South
Viking Graben, Norwegian North Sea,” paper SPE 110309, presented at the SPE Annual
Technical Conference and Exhibition, Anaheim, California, Nov. 11-14, 2007.

163
50. Engineer, R.: “Cal Canal Field California: Case History of a Tight and Abnormally Pressure
Gas Condensate Reservoir,” paper SPE 13650, SPE California Regional Meeting in
Bakersfield, California, March 27-29, 1985.
51. Fahes, M. and Firoozbadi, A.: “Wettability Alteration to Intermediate Gas-Wetting in Gas-
Condensate Reservoirs at High Temperatures,” SPE Journal, December 2007, 397 – 407.
52. Fussell, D. D.: “Single- Well Performance Predictions for Gas Condensate Reservoirs,”
Journal of Petroleum Technology, July 1973, 860-870.
53. Grattoni, C.A., Pingo Almada, M.B. and Dawe, R. A.: “Pore and Core-Scale Displacement
Mechanisms with Spreading and Wetting Effects during Three-Phase Flow,” paper SPE
39032 presented at the Fifth Latin American and Caribbean Petroleum Engineering
Conference and Exhibition held in Rio de Janeiro, Brazil, 30 August-3 September, 1997.
54. Gruesbeck, C. and Collins, R. E.: “Entrainment and Deposition of Fine Particles in Porous
Media,” SPE Journal (Dec. 1982), 847-856.
55. Gupta, A. and Sharma, M. M.: “Stability of Thin Aqueous Films on Solid Surfaces,” Journal
of Colloid and Interface Science, Vol. 149, No. 2, March 1992, 392-406.
56. Gupta, R. and Mohanty, K. K.: “Temperature Effects on Surfactant-aided Imbibition into
Fractured Carbonates,” SPE Journal, September 2010, 587-597.
57. Hall, A. C., Collins, S. H. and Melrose, J. C.: “Stability of Aqueous Wetting Films in
Athabasca Tar Sands,” Society of Petroleum Engineers Journal, April 1983, 249-258.
58. Hamouda, A. A. and Karoussi, O.: “Effect of Temperature, Wettability and Relative
Permeability on Oil Recovery from Oil-Wet Chalk,” Energies, 2008, 1:19-34.
59. Henderson, G. D., Danish, A., Tehrani, D. H. and Al-Kharusi, B.: “The Relative Significance
of Positive Coupling and Inertial Effects on Gas Condensate Relative Permeabilities at High
Velocity,” paper SPE 62933 presented at the SPE Annual Technical Conference and
Exhibition, Dallas, TX, Oct.1-4, 2000.
60. Hinchman, S. B. and Barree, R. D.: “Productivity Loss in Gas Condensate Reservoirs,”
paper SPE 14203 presented at the SPE Annual Technical Conference and Exhibition, Las
Vegas, NV. Sep. 22-25, 1985
61. Hirasaki, G. J.: “Wettability: Fundamentals and Surface Forces,” SPE Formation Evaluation,
June 1991: 217-226.
62. Hirasaki, G. J. and Zhang, D. L.: “Surface Chemistry of Oil Recovery from Fractured, Oil-
Wet, Carbonate Formations,” SPE Journal, June 2004, 151-162.

164
63. Hirasaki, G. J., Miller, C. A. and Puerto, M.: “Recent Advances in Surfactant EOR,” paper
SPE 115386, presented at the SPE Annual Technical Conference and Exhibition held in
Denver, Colorado, USA, 21-24 September 2008.
64. HØgnesen, E. J., Strand, S. and Austad, T.: “Waterflooding of Preferential Oil-Wet
Carbonates: Oil Recovery Related to Reservoir Temperature and Brine Composition,” paper
SPE 94166, presented at the SPE Europec/EAGE Annual Conference held in Madrid, Spain,
13-16 June, 2005.
65. Hoier, L., Cheng, N. and Whitson, C.H.: “Miscible Gas Injection in Undersaturated Gas-Oil
Systems,” paper SPE 90379 presented at the SPE Annual Technical Conference and
Exhibition, Houston, TX, Sep. 26-29, 2004.
66. Hough, E. W., Rzasa, M. J. and Wood, B. B.: “Interfacial Tensions at Reservoir Pressures
and Temperatures; Apparatus and the Water-Methane System”, Trans., AIME (1951) Vol.
192, 57-60
67. Iler, R. K.: “The Chemistry of Silica” (Wiley, New York, 1979).
68. Israelachvili, J. N.: “Intermolecular and Surface Forces,” Academic Press, New York City,
1985.
69. Jamaluddin, A. K. M., Ye, S., D’Cruz, D. and Nighswander, J.: “Experimental and
Theoretical Assessment of Using Propane to Remediate Liquid Buildup in Condensate
Reservoirs,” paper SPE 71526, presented at presented at the SPE Annual Technical
Conference and Exhibition, New Orleans, Louisiana, 30 Sep.-3 Oct., 2001.
70. Jennings, H. Y. JR, and Newman, G. H.: “The Effect of Temperature and Pressure on the
Interfacial Tension of Water against Methane-Normal Decane Mixtures,” SPE Journal, June,
1971: 171-175.
71. Johnson, E. P., Bossler, D. P. and Naumann, V. O.: “Calculation of Relative Permeability
from Displacement Experiments,” Petroleum Transactions, AIME, 216(1959).
72. Khilar, K. C. and Folger, H. S.: “Water Sensitivity of Sandstones,” SPEJ (Feb. 1983), 55-64.
73. Klins, M.A.: “Carbon Dioxide Flooding – Basic Mechanisms and Project Design,”
International Human Resources Development Corporation, Boston, 1984.
74. Kumar, V., Pope, G. A. and Sharma, M. M: “Improving the Gas and Condensate Relative
Permeability Using Chemical Treatments,” paper SPE 100529 presented at SPE Gas
Technology Symposium, Calgary, Alberta, Canada, May 15-17, 2006a.
75. Kumar, V., Pope, G. A. Sharma, M. M, Ay, Ayyalasomayajula, P. S., and Kamath, J.:
“Chemical Stimulation of Gas-Condensate Reservoirs,” paper SPE 102669, presented at the
SPE Annual Technical Conference and Exhibition, San Antonio, Texas, USA, 24-27
September 2006b.

165
76. Lager, A., Webb, K. J., Black, J. J., Singleton, M. and Sorbie, K. S.: “Low Salinity Oil
Recovery – An Experimental Investigation,” paper SCA2006-36, presented at the
International Symposium of the Society of Core Analysis held in Trondheim, Norway, 12-16
September, 2006.
77. Lager, A., Webb, K. J., Collins I. R. and Richmond, D. M.: “LoSalTM
Enhanced Oil
Recovery: Evidence of Enhanced Oil Recovery at the Reservoir Scale,” paper SPE 113976,
presented at the SPE/DOE Improved Oil Recovery held in Tulsa, Oklahoma, USA, 19-23
April, 2008.
78. Lemon, P., Zeinijahromi, A., Bedrikovetsky, P. and Shahin, I.: “Effects of Injected Water
Chemistry on Waterflood Sweep Efficiency via Induced Fines Migration,” paper SPE
140141, presented at the SPE International Symposium on Oilfield Chemistry held in The
Woodlands, Texas, USA, 11-13 April 2011.
79. Li, J., Wang, W., Gu, Y.: “Dynamic Interfacial Tension Phenomenon and Wettability
Alteration of Crude Oil-Rock-Alkaline-Surfactant Solution Systems,” paper SPE 90207,
presented at the SPE Annual Technical Conference and Exhibition, Houston, TX, 26-29
September 2004.
80. Li, K. and Firoozbadi, A.: “Experiment Study of Wettability Alteration to Preferential Gas-
Wetness in Porous Media and its Effect,” SPE Reservoir Evaluation & Engineering, April
2000, 139 – 149.
81. Luo, K., Li, S., Zheng, X., Chen, G., Dai, Z. and Liu, N.: “Experimental Investigation into
Revaporization of Retrograde Condensate by Lean Gas Injection,” paper SPE 68683, SPE
Asia Pacific Oil Conference and Exhibition, Jakarta, Indonesia, April 17-19, 2001.
82. Maeda, H. and Okatsu, K.: “EOR Using Thin Oil Film Drainage Mechanism in Water Wet
Oil Reservoir,” SPE 116532, paper presented at the 2008 SPE Asia Pacific Oil & Gas
Conference and Exhibition held in Perth, Australia, 20-22 October 2008.
83. Mannhardt, K.: “The Measurement of Interfacial Tension by the Spinning Drop Apparatus”,
Technical Report Submitted to Petroleum Recovery Institute, Calgary, Canada, March 13
(1987).
84. Martin, J. C.: “The Effects of Clays on the Displacement of Heavy Oil by Water,” paper
presented at the 3th Annual Venezuelan Regional Meeting of AIME, Caracas, October 1959.
85. McCain, Jr., W.D.: “The Properties of Petroleum Fluids (Second Edition),” PennWell
Publishing Co., Tulsa, 1990.
86. McGuire, P. L., Chatham, J. R., Paskvan, F. K., Sommer, D. M. and Carini, F. H.: “Low
Salinity Oil Recovery: An Exciting New EOR Opportunity for Alaska’s North Slope,” paper
SPE 93093, presented at the SPE Western Regional Meeting Held in Irvine, CA, USA, 30
March-1 April, 2005.

166
87. Mohan, J.: “Modeling of Gas Condensate Wells with and without Hydraulic Fractures,” MS
Thesis, University of Texas at Austin, August, 2005.
88. Mohan, J., Pope, G. A. and Sharma, M. M.: “Effect of Non-Darcy Flow on Well Productivity
of a Hydraulically Fractured Gas-Condensate Well,” SPE Reservoir Evaluation &
Engineering, August 2009, 576-585.
89. Morrow, N. and Buckley, J.: “Improved Oil Recovery by Low-Salinity Waterflooding,”
Journal of Petroleum Technology, May 2011, 106~112.
90. Mott, R., Cable, A. and Spearing, M.: “Measurements and Simulation of Inertial and High
Capillary Number Flow Phenomena in Gas-Condensate Relative Permeability,” paper SPE
62932, presented at the SPE Annual Technical Conference and Exhibition, Dallas, TX,
Oct.1-4, 2000.
91. Mungan, N.: “Permeability Reduction through Changes in PH and Salinity,” Journal of
Petroleum Technology, December 1965, 1449-1453.
92. Mungan, N.: “Interfacial Effect in Immiscible Liquid-Liquid Displacement in Porous
Media,” Soc. Pet. Eng. J. Sept. 1966, 247-253.
93. Mwangi, P.: “An Experimental Study of Surfactant Enhanced Waterflooding,” M.S. Thesis,
Louisiana State University at Baton Rouge, December 2010.
94. Nagarajan, N. R., Honarpour, M. M., Sampath, K. and McMichael, D.: “Comparison of Gas-
Condensate Relative Permeability Using Live Fluid vs. Model Fluids,” SCA 2004-09, 2004.
95. Nasralla, R. A., Alotaibi, M. B. and Nasr-El-Din, H. A.: “Efficiency of Oil Recovery by Low
Salinity Water Flooding in Sandstone Reservoirs,” paper SPE 144602, presented at the SPE
Western North American Regional Meeting held in Anchorage, Alaska, USA, 7-11 May
2011.
96. National Institute of Standards and Technology (NIST), http://webbook.nist.gov/chemistry/
97. Noh, M. and Firoozabadi, A.: “Effect of Wettability on High-Velocity Coefficient in Two-
Phase Gas/Liquid Flow,” SPE Journal, September 2008, 298-204.
98. Odi, U.: “Analysis and Potential of CO2 Huff-n-Puff for Near Wellbore Condensate Removal
and Enhanced Gas Recovery,” paper SPE160917, presented at SPE Annual Technical
Conference and Exhibition held in San Antonio, Texas, USA 8-10 October, 2012.
99. Okasha, T. M. and Al-Shiwaish, A. A.: “Effect of Brine Salinity on Interfacial Tension in
Arab-D Carbonate Reservoir, Saudi Arabia,” paper SPE 119600, presented at the SPE
Middle East Oil & Gas Show and Conference in the Bahrian International Exhibition Centre,
Kingdom of Bahrain, 15-18 March, 2009.
100. Okazawa, T.: “User’s Manual for ANRPM and EXRPM Relative Permeability
Simulators,” Petroleum Recovery Institute, Calgary, AB, 1983.

167
101. Oren, P. E., Billiotte, J. and Pinczewski, W. V.: “Mobilization of Waterflood Residual
Oil by Gas Injection for Water-Wet Conditions,” SPE Formation Evaluation, March 1992,
p.70-78.
102. Oren, P. E., and Pinczewski, W. V.: “Effect of Wettability and Spreading on Recovery of
Waterflood Residual Oil by Immiscible Gasflooding,” SPE Formation Evaluation, June,
1994, p. 149-156.
103. Othman, M., Yang, J., Chong, M. O., Zakaria, M. S., Ali, B. A. and Cheng, C. B.: “Angsi
K-Sand Production Performance: A Case History of Hydraulically Fractured Retrograded
Gas Condensate Reservoir,” paper SPE 113816, presented at SPE Europec/EAGE Annual
Conference and Exhibition, Rome, Italy, June 9-12, 2008.
104. Pashley, R. M.: “Forces between Mica Surfaces in La3+
and Cr3+
Electrolyte Solutions,”
Journal of Colloid and Interface Science, 102 (1984) 23-35.
105. Patil, S., Dandekar, A. Y., Patil, S. L., and Khataniar, S.: “Low Salinity Brine Injection
for EOR on Alaska North Slope (ANS),” paper IPTC 12004, presented at the International
Petroleum Technology Conference, Kuala Lumpur, Malaysia, 3-5 December, 2008.
106. Porter, M. R.: “Handbook of Surfactants, second edition,” Blackie Academic &
Professional, 1994.
107. Rao, D. N., Girard, M. and Sayegh, S. G.: “Impact of Miscible Flooding on Wettability,
Relative Permeability, and Oil Recovery,” SPE Reservoir Engineering, May 1992, 204-212.
108. Rao, D. N. and Girard, M. G.: “A New Technique for Reservoir Wettability
Characterization,” Journal of Canadian Petroleum Technology, 1996, Vol. 35, No.1:31- 39.
109. Rao, D. N.: “Wettability Effects in Thermal Recovery Operations,” SPE Reservoir
Evaluation & Engineering, Vol. 2, No. 5, October 1999, 420-430.
110. Rao, D. N.: “Correlation of Oil-Water Flow Behavior in Reservoir Rocks with Dynamic
Contact Angles,” Journal of Canadian Petroleum Technology, July, 2002.
111. Rao, D. N.: “The Concept, Characterization, Concerns and Consequences of Contact
Angles in Solid-Liquid-Liquid Systems,” Contact Angle, Wettability and Adhesion, 2003,
Vol. 3, pp.191-210.
112. Rao, D. N., Ayirala, S. C., Abe, A. A. and Xu, W.: “Impact of Low-Cost Dilute
Surfactants on Wettability and Relative Permeability,” paper SPE 99609, presented at the
SPE/DOE Symposium on Improved Oil Recovery held in Tulsa, Oklahoma, 22-26 April
2006.
113. Rapoport, L. A. and Leas, W. J.: “Properties of Linear Waterfloods,” Petroleum
Transactions, AIME, 198(1953), 139-148.

168
114. Robertson E. P.: “Low-Salinity Waterflooding to Improve Oil Recovery-Historical Field
Evidence,” paper SPE 109965, presented at the SPE Annual Technical Conference and
Exhibition, Anaheim, California, USA, 11-14 November, 2007.
115. Ryan, J. N. and Elimelech, M.: “Colloid Mobilization and Transport in Groundwater,”
Colloids and Surfaces A: Physicochemical and Engineering Aspects, 107 (1996), 1-56.
116. Sarkar, A. K. and Sharma, M. M.: “Fines Migration in Two-Phase Flow,” Journal of
Petroleum Technology, May 1990, 646-652.
117. Schramm, L. L.: “Surfactants: Fundamentals and Applications in the Petroleum Industry,”
Cambridge University Press, 2000.
118. Seccombe, J. C., Lager, A., Webb, K., Jerauld, G. and Fueg, E.: “Improving Waterflood
Recovery: LoSal TM
EOR Field Evaluation,” paper SPE 113480, presented at the SPE/DOE
Improved Oil Recovery held in Tulsa, Oklahoma, USA, 19-23 April, 2008.
119. Seethepalli, A., Adibhatla, B. and Mohanty, K.K.: “Physicochemical Interactions During
Surfactant Flooding of Fractured Carbonate Reservoirs”, SPE Journal, December 2004.
120. Sequeira, D. S.: “Compositional Effects on Gas-Oil Interfacial Tension and Miscibility at
Reservoir,” M.S. Thesis, Louisiana State University, Baton Rouge, December 2006.
121. Settari, A., Bachman, R. C., Hovem, K. and Paulson, S. G.: “Productivity of Fractured
Gas Condensate Wells - a Case Study of Smorbukk Field,” paper SPE 35604, presented at
Gas Technology Conference, Calgary, Canada, 28April-1May, 1996.
122. Sharma, M. M. and Filoco, P. R.: “Effect of Brine Salinity and Crude-oil Properties on
Oil Recovery and Residual Oil Saturations,” SPE Journal 5(3), September, 2000, p.293-300.
123. Shi, C. and Horne, R. N.: “Improved Recovery in Gas-Condensate Reservoirs
Considering Compositional Variations,” paper SPE 115786, presented at the SPE Annual
Technical Conference and Exhibition held in Denver, Colorado, USA, 21-24 September 2008.
124. Skrettingland, K., Holt, T., Tweheyo, M. T. and Skjevrak, I.: “Snorre Low-Salinity-Water
Injection—Coreflooding Experiments and Single-Well Field Pilot,” SPE Reservoir
Evaluation & Engineering, April 2011, 182-192.
125. Smith, K. W.: “Brines as Flooding Liquids,” paper presented at 7th
Annual Tech. meeting,
Min. Ind. Expt. Sta., Penn State College, November 1942.
126. Somasundaran, P. and Zhang, L.: “Adsorption of Surfactants on Minerals for Wettability
Control in Improve Oil Recovery Processes,” Journal of Petroleum Science & Engineering,
52(2006), 198-212.
127. Takamura, K. and Chow, R. S.: “The Electric Properties of the Bitumen/Water Interface
Part II. Application of the Ionizable Surface-Group Model,” Colloid and Surfaces, 1989, 15:
35-48.
169
128. Tang, G. and Firoozbadi, A.: “Relative Permeability Modification in Gas/Liquid Systems
through Wettability Alteration to Intermediate Gas Wetting,” SPE Reservoir Evaluation &
Engineering, December 2002, 427 – 436.
129. Tang, G. Q. and Morrow, N. R.: “Salinity, Temperature, Oil Composition, and Oil
Recovery by Waterflooding,” SPE Reservoir Engineering, November, 1997:269-276.
130. Tang, G. Q. and Morrow, N. R.: “Influence of Brine Composition and Fines Migration on
Crude Oil/Brine/Rock Interactions and Oil Recovery,” Journal of Petroleum Science and
Engineering, 24(1999) 99-111.
131. Valdya, R. N. and Fogler, H. S.: “Fines Migration and Formation Damage: Influence of
pH and Ion Exchange,” SPE Production Engineer, November 1992, 325-330.
132. Vijapurapu, C. S., Rao, D. N. and Lian, K: “The Effect of Rock Surface Characteristics
on Reservoir Wettability,” paper SPE 75211, presented at the SPE/DOE Improved Oil
Recovery Symposium held in Tulsa, Oklahoma, 13-17 April 2002.
133. Vijapurapu, C. S. and Rao, D. N.: “Compositional Effects of Fluids on Spreading,
Adhesion and Wettability in Porous Media,” Colloids and Surfaces A: Physicochemical and
Engineering Aspects, 241(2004) 335-342.
134. Vizika, O. and Lombard, J. M.: “Wettability and Spreading: Two Key Parameters in Oil
Recovery with Three-Phase Gravity Drainage,” SPE Reservoir Engineering, February 1996,
54-60.
135. Webb, K. J., Black, J. J and Al-Ajeel, H.: “Low Salinity Oil Recovery-Log-Inject-Log,”
paper SPE 89379, presented at the SPE/DOE Fourteen Symposium on Improved Oil
Recovery held in Tulsa, Oklahoma, USA, 17-21 April, 2004.
136. Wheaton, R. J. and Zhang, H. R.: “Condensate Banking Dynamics in Gas Condensate
Fields: Compositional changes and Condensate Accumulation around Production Wells,”
paper SPE 62930, presented at the SPE Annual Technical Conference and Exhibition, Dallas,
TX, Oct.1-4, 2000.
137. White, C. D., Bradurn, F. R., Brown, R. L., and Thieme, M. A.: “Reservoir Potential of
Thin-Bedded Turbidites: Prospect Tahoe,” paper SPE 24875, presented at the 67th
Annual
Technical Conference and Exhibition of the Society of Petroleum Engineers held in
Washington, DC, October 4-7, 1992.
138. Xu, W.: “Experimental Investigation of Dynamic Interfacial Tensions at Reservoir
Conditions,” M.S. Thesis, Louisiana State University at Baton Rouge, May 2005.
139. Zhang, L, Somasundaran, P. and Maltesh, C.: “Adsorption of n-Dodecyl-β-D-Maltoside
on Solids,” Journal of Colloid and Interface Science 191, 202-208 (1997).
170
140. Zhang, Y., Xie, X and Morrow, N. R.: “Waterflood Performance by Injection of Brine
with Different Salinity for Reservoir Cores,” paper SPE 109849, presented at the SPE
Annual Technical Conference and Exhibition,, Anaheim, California, USA, 11-14 November,
2007.
141. Zhang, Y. P., Sayegh, S. G., Huang, S. and Dong, M.: “Enhanced Light-Oil Recovery by
CO2/Flue Gas Huff-n-Puff Process,” Journal of Canadian Petroleum Technology, Vol. 45,
No. 2, February 2006, 24-32.
142. Zisman, W. A.: “Contact Angle, Wettability and Adhesion,” Adv. Chem. Ser.43, ACS,
Washington, DC, USA (1964).

171
APPENDIX: HISTROY MATCH OF RECOVERY AND PRESSURE DROP
AND RESULTS OF RELATIVE PERMEABILITIES FROM COREFLOOD
SIMULATOR
Figure A1: Recovery Results of Experiment and Simulation for 0 ppm at 68 °F
Figure A2: Pressure Drop Results of Experiment and Simulation for 0 ppm at 68 °F
Figure A3: Oil-Water Relative Permeability for 0 ppm at 68 °F
0
5
10
15
20
25
30
35
0 0.5 1 1.5 2 2.5
Re
cove
ry (
cc)
Injected Pore Volume (PV)
Exp (recovery)
Sim (recovery)
0
0.1
0.2
0.3
0.4
0.5
0.6
0.7
0.8
0.9
1
1.1
0 0.5 1 1.5 2 2.5
Pre
ssu
re d
rop
(m
Pa)
Injected Pore Volume (PV)
Exp (pressure)
Sim (pressure)
0
0.2
0.4
0.6
0.8
1
0
0.2
0.4
0.6
0.8
1
0 0.1 0.2 0.3 0.4 0.5 0.6 0.7 0.8 0.9 1
Krw
Kro
Water saturation (frac)
Kro
Krw

172
Figure A4: Recovery Results of Experiment and Simulation for 0 ppm at 210 °F
Figure A5: Pressure Drop Results of Experiment and Simulation for 0 ppm at 210 °F
Figure A6: Oil-Water Relative Permeability for 0 ppm at 210 °F
0
5
10
15
20
25
30
0 0.4 0.8 1.2 1.6 2 2.4 2.8
Re
cove
ry (
cc)
Injected pore volume (PV)
Exp (recovery)
Sim (recovery)
0
0.2
0.4
0.6
0.8
1
1.2
1.4
0 0.4 0.8 1.2 1.6 2 2.4 2.8
Pre
ssu
re d
rop
(m
Pa)
Injected pore volume (PV)
Exp (recovery)
Sim (recovery)
0
0.2
0.4
0.6
0.8
1
0
0.2
0.4
0.6
0.8
1
0 0.1 0.2 0.3 0.4 0.5 0.6 0.7 0.8 0.9 1
Krw
Kro
Water saturation (frac)
Kro
Krw

173
Figure A7: Recovery Results of Experiment and Simulation for 1500 ppm
Figure A8: Pressure Drop Results of Experiment and Simulation for 1500 ppm
Figure A9: Oil-Water Relative Permeability for 1500 ppm
0
5
10
15
20
25
30
35
40
45
0 1 2 3 4 5
Re
cove
ry (
cc)
Injected pore volume (PV)
Exp (recovery)
Sim (recovery)
0
0.5
1
1.5
2
2.5
3
0 1 2 3 4 5
Pre
ssu
re d
rop
(m
Pa)
Injected pore volume (PV)
Exp (pressure)
Sim (pressure)
0
0.2
0.4
0.6
0.8
1
0
0.2
0.4
0.6
0.8
1
0 0.1 0.2 0.3 0.4 0.5 0.6 0.7 0.8 0.9 1
Krw
Kro
Water saturation (frac)
Kro
Krw

174
Figure A10: Recovery Results of Experiment and Simulation for 3000 ppm
Figure A11: Pressure Drop Results of Experiment and Simulation for 3000 ppm
Figure A12: Oil-Water Relative Permeability for 3000 ppm
0
5
10
15
20
25
30
35
40
45
50
0 0.5 1 1.5 2 2.5 3 3.5 4 4.5
Re
cove
ry (
cc)
Injected pore volume (PV)
Exp(recovery)
Sim (recovery)
0
0.2
0.4
0.6
0.8
1
1.2
1.4
0 0.5 1 1.5 2 2.5 3 3.5 4 4.5
Pre
ssu
re d
rop
(m
Pa)
Injected pore volume (PV)
Exp(pressure)
Sim (pressure)
0
0.2
0.4
0.6
0.8
1
0
0.2
0.4
0.6
0.8
1
0 0.1 0.2 0.3 0.4 0.5 0.6 0.7 0.8 0.9 1
Krw
Kro
Water saturation (frac)
Kro
Krw

175
VITA
Yu Zheng, the daughter of Yicai Zheng and Jinlan Wang, was born and raised in Lu’an, China.
She obtained her Bachelor of Science degree in Chemical Engineering from Shandong Institute
of Mining Technology, China, in 1994. After she graduated from the college, she joined Qingdao
Gas Group, China and worked as a chemical engineer for seven years. In 2001, she reentered the
Qingdao University of Science & Technology, China, to pursue her master degree. And she
obtained her Master of Science degree in Chemical Engineering in 2004. In August 2007, she
joined the PhD program in the Craft and Hawkins Department of Petroleum Engineering at
Louisiana State University, Baton Rouge. The doctoral degree in Petroleum Engineering will be
conferred in December 2012.


![Influence of Salinity, Surfactants and Power of Ultrasonic ......hydrocyclone units, crude oil transport facilities and etc [5]. The droplet size distribution has significant influences](https://static.fdocuments.in/doc/165x107/611e7358544055649f17c8d0/influence-of-salinity-surfactants-and-power-of-ultrasonic-hydrocyclone.jpg)