EFFECT OF SURFACE MODIFICATION WITH ELECTROSPUN NANOFIBERS … · 2018-07-30 · EFFECT OF SURFACE...
127
EFFECT OF SURFACE MODIFICATION WITH ELECTROSPUN NANOFIBERS ON THE PERFORMANCE OF THE ULTRAFILTRATION MEMBRANE By: Ladan Zoka Master of Applied Science Thesis Submitted to the School of Graduate Studies and Research under the supervision of Dr. Takeshi Matsuura and Dr. Roberto M. Narbaitz In partial fulfilment of the requirement for the degree of Master of Applied Science in Environmental Engineering The degree is offered under Ottawa- Carleton Institute for Environmental Engineering Department of Civil Engineering at University of Ottawa Ottawa, Ontario Canada K1N 6N5 Ladan Zoka, Ottawa, Canada, 2018
Transcript of EFFECT OF SURFACE MODIFICATION WITH ELECTROSPUN NANOFIBERS … · 2018-07-30 · EFFECT OF SURFACE...
EFFECT OF SURFACE MODIFICATION WITH ELECTROSPUN
NANOFIBERS ON THE PERFORMANCE OF THE
ULTRAFILTRATION MEMBRANE
By:
Ladan Zoka
Master of Applied Science Thesis
Submitted to the School of Graduate Studies and Research under the supervision of
Dr. Takeshi Matsuura and Dr. Roberto M. Narbaitz
In partial fulfilment of the requirement for the degree of Master of Applied Science in
Environmental Engineering
The degree is offered under Ottawa- Carleton Institute for Environmental Engineering
Department of Civil Engineering at University of Ottawa
Ottawa, Ontario
Canada K1N 6N5
Ladan Zoka, Ottawa, Canada, 2018
ii
ABSTRACT
Membrane surface modification is often utilized to combat membrane fouling, i.e., the
deterioration of membrane performance with time. Among many modification methods,
the effect of coating the surface of a commercial membrane with electrospun nanofibers
on the membrane performance has received little attention.
In this work, a commercial polyethersulfone (PES) ultrafiltration membrane was
modified by electrospinning PVDF hydrophobic nanofibers for different time periods, i.e.,
25min, 125min, and 250min, and its effect on the filtration performance was investigated.
It was found that coating with the electrospun nanofiber layer enhanced the pure water
permeation (PWP) flux. While the fouling of electrospun PES (EPES) membranes was
more severe when they filtered Ottawa River (OR) Water or protein solutions, their final
flux was still higher than that of the PES membrane. The membranes were further
characterized by scanning electron microscopy (SEM), contact angle measurement and
pore size and pore size distribution. The relationship between these characteristics and
the membrane performance was discussed.

iii
I dedicate this study to:
My father`s soul,
My mom,
Pedram and
Tanaz
iv
ACKNOWLEDGEMENTS
I would like to express my gratitude to my supervisors Dr. Takeshi Matsuura and Dr.
Roberto Narbaitz for their continuous support, guidance, patience, enthusiasm, and
immense knowledge during all the testing and writing my thesis. This work would not
have been possible without them.
I would also like to thank Dr. Dipak Rana from the Department of Chemical and
Biochemical Engineering for his support and advice. I would like to thank Louis
Tremblay, the chemical engineering technician, for his help and recommendations. Also,
I would like my friend and lab co- worker Johnson Efome for teaching me how to use the
electrospinning equipment.
I would like to thank my dear friends Bingjie Xu and Pablo Gonzalez Galvis for their
help, support, and encouragement. We were Dr. Narbaitz’s students and Bingjie was the
first friend that I met since the beginning of the master’s program. Also, I would like to
thank Patrick D’Aoust, environmental engineering lab technician, and Neda Arabgol as
my friends, classmates, office mates, and for their help and advice. My other friends in
the same office: Nour Al- ghuasian, Kellie Boyle, and Maha Dabas always supported me.
Thanks for all those precious times of laughing, chating, and crying we spent together.
And at the end I would like to thank my angels, my parents. I need to give an additional
thanks to my dear husband Pedram Fouladirad and my pretty and lovely daughter Tanaz
Fouladirad for their support, love, understanding, inspiration, and encouragement. Thanks
to my dear sister Rana for her support and advice in this journey. Thanks to my brother,
Mohammad, for his support from far away.
v
TABLE OF CONTENTS
ABSTRACT ........................................................................................................................ ii
ACKNOWLEDGEMENTS ............................................................................................... iv
ABBREVIATIONS ......................................................................................................... xiii
GLOSSARY .................................................................................................................... xvi
CHAPTER 1 ....................................................................................................................... 1
INTRODUCTION .............................................................................................................. 1
CHAPTER 2 ....................................................................................................................... 3
LITERATURE REVIEW .................................................................................................. 3
2.1 Membranes ................................................................................................................ 3
2.1.1 Membrane types and formation method ............................................................ 7
2.1.2 Symmetric membranes ....................................................................................... 9
2.1.3 Asymmetric membranes .................................................................................. 11
2.1.4 Thin-film composite membranes ...................................................................... 14
2.2 Membrane processes .............................................................................................. 16
2.2.1 Ultrafiltration: ................................................................................................... 16
2.3 Membrane fouling .................................................................................................. 18
2.3.1 Types of fouling................................................................................................ 19
2.3.2 Foulants .......................................................................................................... 22
2.3.2.1 Natural organic matter ............................................................................. 23
vi
2.3.2.2 Scaling...................................................................................................... 24
2.3.2.3 Membrane biofouling............................................................................... 24
2.4 Factors affecting membrane fouling ...................................................................... 25
2.4.1 Impact of feed properties ................................................................................. 25
2.4.1.1 Concentration ............................................................................................ 25
2.4.1.2 pH and ionic strength ............................................................................... 25
2.4.1.3 Constitution interactions ........................................................................... 26
2.4.1.4 Prefiltration and aggregates removal ........................................................ 26
2.4.2 Effect of membrane physio-chemical characteristics on membrane performance
and fouling ................................................................................................................. 26
2.4.2.1 Pore size ................................................................................................... 26
2.4.2.2 Porosity and pore size distribution ........................................................... 27
2.4.2.3 Physico-chemical properties .................................................................... 27
2.4.3 The effect of the membrane operating factors ................................................. 28
2.4.3.1 Transmembrane pressure ......................................................................... 28
2.4.3.2 Temperature ............................................................................................. 28
2.4.3.3 Cross-flow velocity and turbulence ......................................................... 29
2.5 Membrane cleaning ................................................................................................. 30
2.5.1 Physical cleaning methods............................................................................... 30
2.5.2 Chemical cleaning methods ............................................................................. 30
vii
2.5.3 Physico-chemical cleaning methods ................................................................ 31
2.5.4 Biological cleaning methods ........................................................................... 31
2.6 Approaches for improving membrane performance ............................................... 31
2.6.1 Boundary layer or velocity control .................................................................. 31
2.6.2 Turbulence generator ...................................................................................... 32
2.6.3 Membrane material and modification .............................................................. 32
2.7 Electrospinning....................................................................................................... 33
CHAPTER 3 ..................................................................................................................... 41
MATERIALS AND METHODS ...................................................................................... 41
3.1 Materials .................................................................................................................. 41
3.2 Membrane electrospinning ..................................................................................... 43
3.3 Membrane filtration tests ....................................................................................... 48
3.3.1 Permeation experiment set-up: ........................................................................ 48
3.3.2 Permeation and filtration test procedure ........................................................... 50
3.4 Analytical Methods ................................................................................................. 55
3.4.1 Spectrophotometric Analysis ............................................................................ 55
3.5 Other membrane characterization analysis ............................................................. 56
3.5.1 Scaning electron microscope (SEM) ............................................................... 56
3.5.2 Contact angle measurements ........................................................................... 59
CHAPTER 4 ..................................................................................................................... 60
viii
RESULTS AND DISCUSSION ....................................................................................... 60
4.1 Membrane performance testing ............................................................................... 61
4.1.1 Pure water permeation test ............................................................................... 61
4.2 Series 1 Tests including filtration of Ottawa River (OR) Water ............................. 67
4.2.1 Filtration of protein solutions ........................................................................... 72
4.2.1.1 Filtration of a BSA solution with series 4 PES and EPES membranes .... 72
4.2.1.2 Fouling of series 4 PES and EPES-250 membranes by various protein
solutions ................................................................................................................ 76
4.2.2 Analysis of fouling by OR Water ..................................................................... 78
4.2.3 Analysis of fouling by the BSA solution .......................................................... 81
4.3 Membrane characterization ..................................................................................... 83
4.3.1 Scanning electron microscopic (SEM) image analysis .................................... 83
4.3.2 Contact angle measurements ............................................................................ 91
4.3.3 Pore size and pore size distribution .................................................................. 93
Chapter 5 ........................................................................................................................... 98
Conclusions and recommendations................................................................................... 98
References: ...................................................................................................................... 101
APPENDIX A ................................................................................................................. 108
APPENDIX B ................................................................................................................. 109
ix
List of Tables
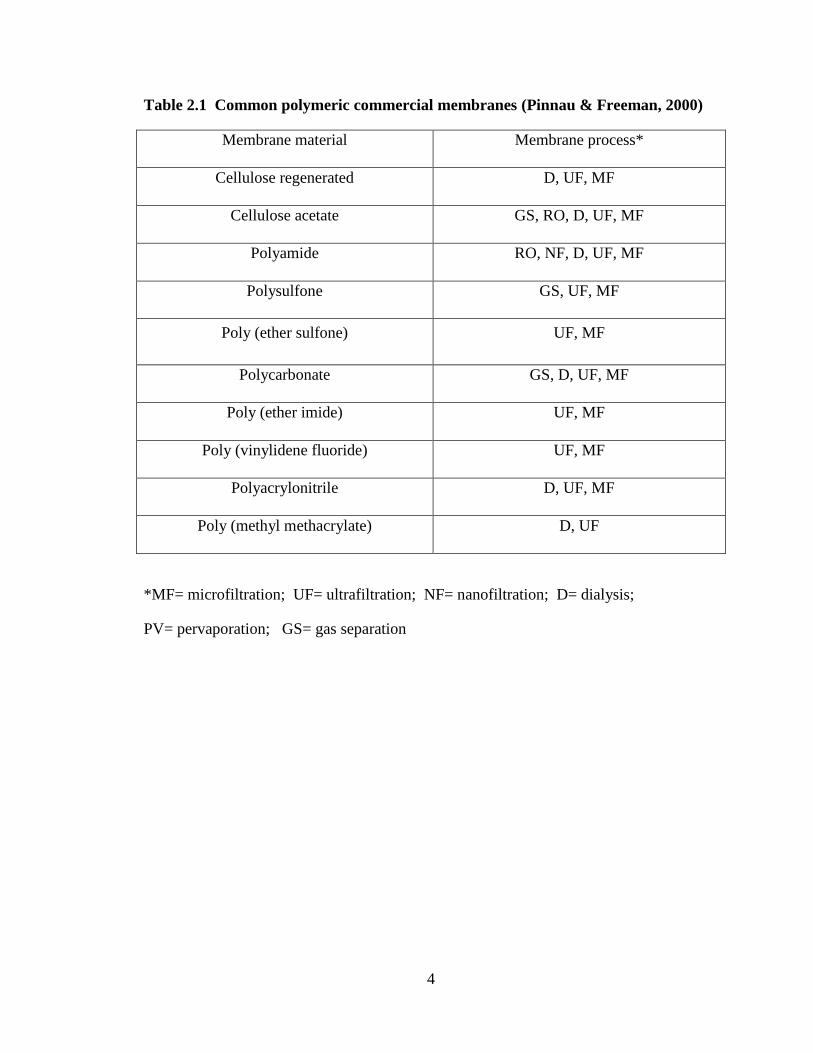
Table 2.1 Common polymeric commercial membranes (Pinnau & Freeman, 2000) ........ 4
Table 2.2 Common multi-components used for producing membranes by immersion
precipitation (Pinneau & Freeman, 2000) ......................................................................... 12
Table 2.3 Foulants and their modes of fouling (Shi et al. 2014) ..................................... 22
Table 2. 4 Few studies of electrospun modified membranes and their fluxes .................. 38
Table 3. 1 ORW quality characteristics in different seasons (Xu, 2015) ......................... 43
Table 3. 2 Experimental plan of this study ....................................................................... 54
Table 3.3 Concentration of each protein for UV Calibration .......................................... 56
Table 4.1 PWP of all the series of PES and EPES membrane coupons tested ................ 63
Table 4.2 t- Test: two- Sample Assuming equal Variances ............................................. 65
Table 4.3 Average permeate flux of series 4 membranes with the BSA solution ............ 72
Table 4. 4 Flux reduction percentage of BSA fouling test for membranes series 4 ........ 75
Table 4.5 PWP data for Series 4 PES and EPES-250 ...................................................... 76
Table 4.6 Permeate Flux of Series 4 PES and EPES-250 membrane coupons for the
various feed protein solutions ........................................................................................... 77
Table 4.7 Normalised flux decrease of Series 1 PES and EPES-250 by OR Water due to
compaction and fouling..................................................................................................... 80
Table 4.8 Flux reductions by compaction and BSA fouling for Series 3 PES and EPES
membranes of different electro-spinning periods. ............................................................ 81
Table 4. 9 Summary of contact angle measurements of the virgin membranes .............. 91
x
Table 4. 10 Molecular weight, diffusivity and radius of protein ..................................... 94
Table 4. 11 Protein rejection by Series 4 PES and EPES-250 ......................................... 95
Table 4.12 y and x obtained from the protein separation of Series 4 ESEP-250 and
protein radius .................................................................................................................... 96
Table B. 1 Standard Normal Distribution ....................................................................... 109
Table B. 2 Standard Normal Distribution ....................................................................... 110
xi
List of Figures
Figure 2.1 Synthetic membrane classification based on their geometry, bulk structure,
separation regime, manufacturing method, and operation (Pinnau & Freeman, 2000) ...... 7
Figure 2.2 Representational of the cross-section of symmetric and asymmetric
membranes (Pinnau & Freeman, 2000) .......................................................................... 8
Figure 2.3 Cross section of polysulfone symmetric membrane that is produced by
vapour- precipitation/evaporation method (Pinnau & Freeman, 2000) ........................... 10
Figure 2.4 Separation capabilities of pressure-driven membrane processes used in water
treatment (MWH, 2012).................................................................................................... 16
Figure 2. 5 Electrospinning system (Nasreen et al., 2013) .............................................. 34
Figure 3. 1 Chemical formula for PES (http://pslc.ws/macrog/pes.htm) ......................... 42
Figure 3. 2 Electrospinning equipment ............................................................................ 45
Figure 3.3 Electrospinning chamber ................................................................................ 47
Figure 3.4 Schematic of the filtration system .................................................................. 48
Figure 3.5 Sections of membrane based on the feed flow (Maruf et al., 2013) ............... 57
Figure 3.6 VCA Optima Surface Analysis System .......................................................... 59
Figure 4.1 PWP flux versus time for a typical set of PES and EPES membranes .......... 62
Figure 4.2 Change of PWP flux during the PWP experiments with time for Series 1 PES
and EPES-250 OR filtration test ....................................................................................... 68
Figure 4.3 OR Water permeate flux for Series 1 PES and EPES-250 .............................. 69
xii
Figure 4.4 Change of PWP flux during the second PWP/tangential wash tests for Series 1
PES and EPES-250 ........................................................................................................... 71
Figure 4. 5 Images of fouled a) PES and b) EPES-250 with the cells area of 20.4 cm2 and
after BSA fouling test ....................................................................................................... 73
Figure 4.6 BSA filtration fluxes for membrane series 4 .................................................. 74
Figure 4.7 SEM surface image of a) PES before and b) PES after the filtration of OR
Water and cleaning ........................................................................................................... 84
Figure 4.8 SEM image of a) EPES-250 before and b) EPES-250 after filtration of OR
Water and cleaning ........................................................................................................... 84
Figure 4.9 8K magnification SEM image of the surface of the PES membrane fouled with
Ottawa River water ........................................................................................................... 85
Figure 4.10 Cross-sectional images of a) PES membrane before filtration; b) PES
membrane after filtration of OR Water and cleaning ....................................................... 87
Figure 4.11 Cross sectional images of a) EPES-250 membrane before filtration; and b)
EPES-250 membrane after filtration of OR Water and cleaning ...................................... 87
Figure 4. 12 Cross-sectional images of the virgin EPS-25 membrane ............................. 88
Figure 4. 13 Cross-sectional images of virgin EPES-125 membrane .............................. 89
Figure 4. 14 Cross-sectional images of virgin EPES-250 membrane .............................. 89
Figure 4.15 Membrane electrospun layer thickness versus electrospinning time ........... 90
Figure 4. 16 Contact angle versus thickness of electrospun layer ................................... 92
Figure A. 1 PWP for electrospun PES with DMAc solvent .......................................... 108
xiii
ABBREVIATIONS
BSA Bovine serum albumin
CA
CS
Cellulose acetate
Chitosan
D Dialysis
DMAc Dimethylacetamide
DW
DOC
Distilled water
Dissolved organic carbon
EDTA Ethylenediaminetetraacetic acid
EfoM Effluent organic matter
ENMs Electrospun nanofiber membranes
EPES Electrospun polyethersulfone membrane
ESP Extracellular polymeric substances
FA Fulvic acid
Fe(OH)3 Ferric hydroxide
GS Gas separation
HA
HPO
Humic acids
Hydrophobic NOM fraction
ID Inner diameter
IPA Isopropyl alcohol
LiCl Lithium chloride
LiNO3 Lithium nitrate
xiv
MC Methylcellulose
MF Microfiltration
MWCO Molecular weight cut off
NF Nanofiltration
NMP N-methylpyrrolidone
NOM Natural organic matter
OD Outer diameter
OR
PAN
Ottawa River
Polyacrylonitrile
PEO Polyethylene oxide
PES Polyethersulfone
PET Polyethylene terephthalate
PI
PLA
Polyimide
Poly (lactic acid)
PS Polystyrene
PSF Polysulfone
PV Pervaporation
PVA Polyvinyl alcohol
PVC Polyvinyl chloride
PVP Polyvinylpyrrolidone
PWP Pure water permeate
SEM Scanning electron microscopy
Sepa CF Sepa cross-flow membrane cell
xv
SMM Surface modifying macromolecules
SMPS
SUVA
Soluble microbial products
Specific UV absorption
TFL Thin-film-layer
Tm Melting point temperature
TMP Transmembrane pressure
UF Ultrafiltration
UV Ultraviolet absorbance
xvi
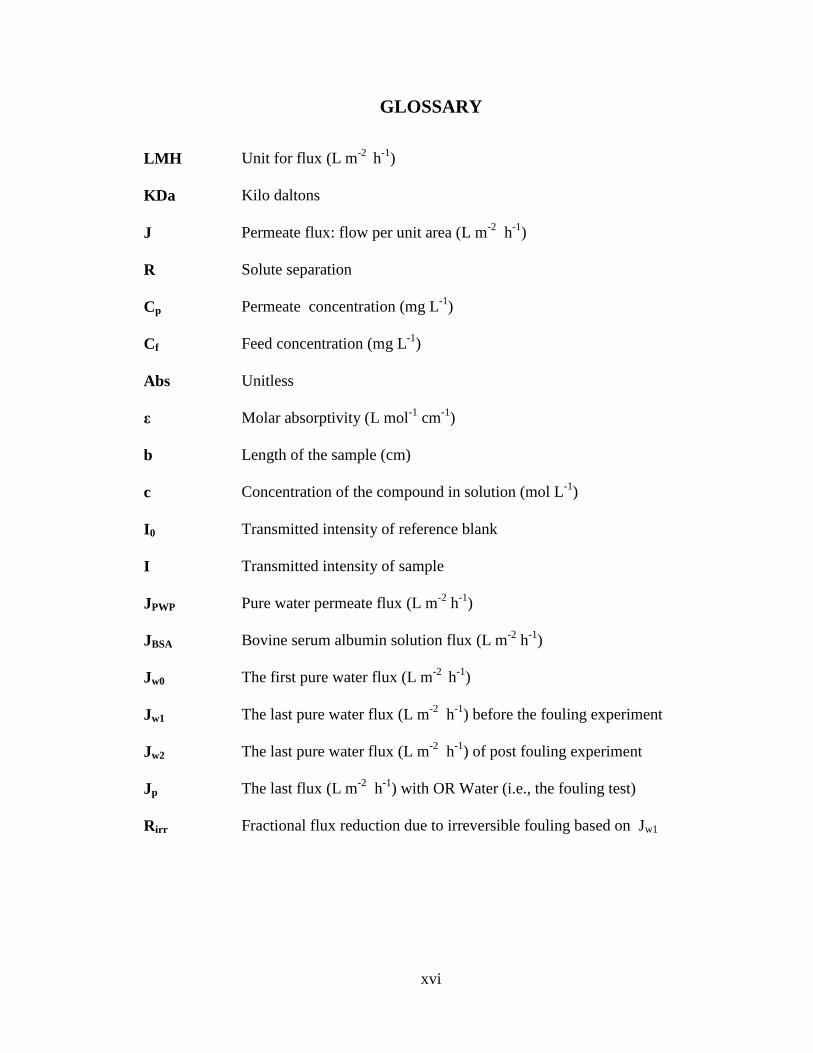
GLOSSARY
LMH Unit for flux (L m-2
h-1
)
KDa Kilo daltons
J Permeate flux: flow per unit area (L m-2
h-1
)
R Solute separation
Cp Permeate concentration (mg L-1
)
Cf Feed concentration (mg L-1
)
Abs
ε
b
c
I0
I
Unitless
Molar absorptivity (L mol-1
cm-1
)
Length of the sample (cm)
Concentration of the compound in solution (mol L-1
)
Transmitted intensity of reference blank
Transmitted intensity of sample
JPWP Pure water permeate flux (L m-2
h-1
)
JBSA Bovine serum albumin solution flux (L m-2
h-1
)
Jw0 The first pure water flux (L m-2
h-1
)
Jw1 The last pure water flux (L m-2
h-1
) before the fouling experiment
Jw2 The last pure water flux (L m-2
h-1
) of post fouling experiment
Jp The last flux (L m-2
h-1
) with OR Water (i.e., the fouling test)
Rirr
Fractional flux reduction due to irreversible fouling based on Jw1
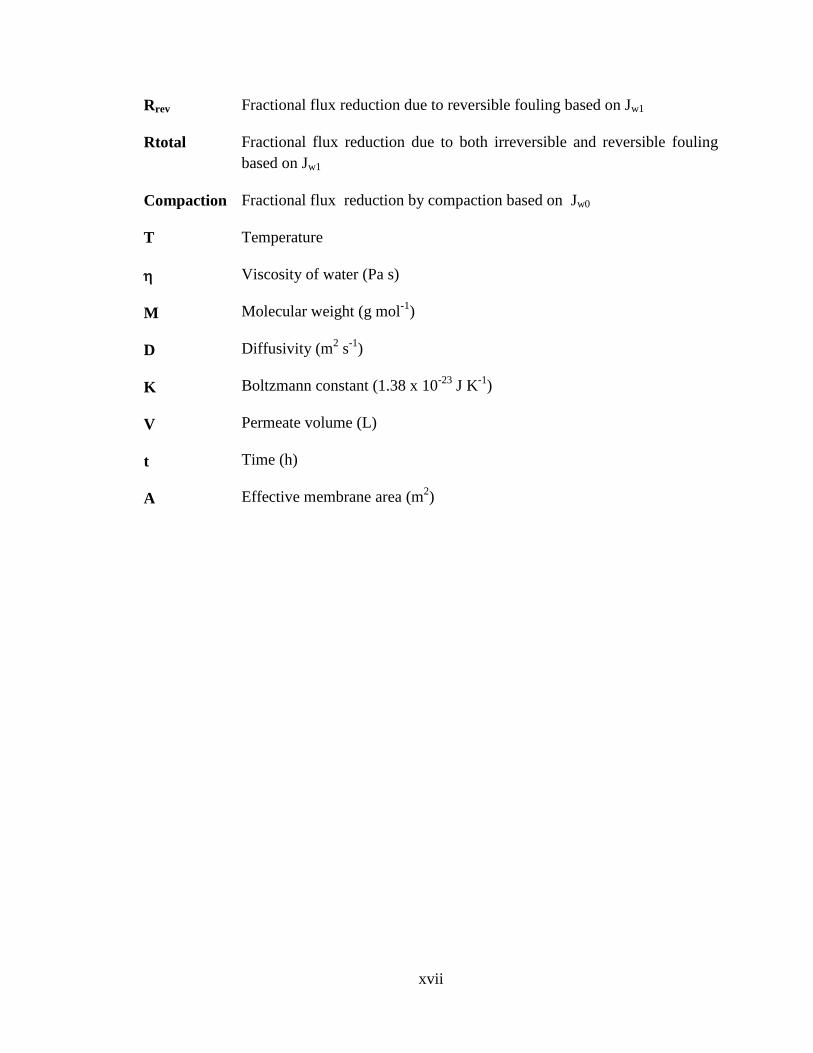
xvii
Rrev Fractional flux reduction due to reversible fouling based on Jw1
Rtotal Fractional flux reduction due to both irreversible and reversible fouling
based on Jw1
Compaction
T
M
D
K
V
t
A
Fractional flux reduction by compaction based on Jw0
Temperature
Viscosity of water (Pa s)
Molecular weight (g mol-1
)
Diffusivity (m2 s
-1)
Boltzmann constant (1.38 x 10⁻²³
J K-1
)
Permeate volume (L)
Time (h)
Effective membrane area (m2)
1
CHAPTER 1
INTRODUCTION
Providing sustainable supplies of clean water and energy, two interrelated resources at
affordable costs, is one of the greatest challenges of 21st century. Membrane technology
has been playing an important role as a technology for water production and energy
saving. Membrane processes are now extensively used in drinking water treatment, waste
water reuse, seawater desalination, dialysis, chemical separation processes, etc. However,
there is a necessity to develop membranes with higher fluxes, higher selectivity, lower
vulnerability to different types of fouling and chemical environments, especially chlorine
which is used extensively in drinking water treatment (Geise, et al., 2010).
One of the main concerns with membrane separation processes is the accumulation of
solids and solutes on top of the membrane surface, or within the membrane pores. This
phenomenon is called fouling, which results in a reduction of the flux (the water
production rate per unit membrane area) in constant pressure systems and an increase in
the pressure drop in steady flux systems. Fouling is combated by operational means, such
as backwashing and chemical cleaning. Even with these precautions fouling is inevitable
and may lead to premature membrane replacement. Modification of the membrane
surface can be achieved either chemically or physically. Physical modification includes
morphological modifications (Jamshidi, et al., 2013).
2
Electrospinning efficiently produces continuous ultrafine polymer fibers on either
polymer or molten solutions (Bjorge, et al., 2010). Huang et al. 2003 have claimed,
electrospinning is one of the most successful methods that can be used in nanofiber
production. And as such, electrospinning has the potential of being a technique to modify
the surface of membranes by adding layers of nanofibers to the membrane surface.
Numerous studies (Yoon et al., 2009; Wang et al., 2012; Khamforoush et al., 2015; Wang
et al., 2017; Dobosez et al., 2017) have shown that porous membrane support material
coated with electrospun layers can yield high flux membranes.
The objective of this work is to investigate the effects of coating the surface of a
commercial membrane. It is in contrast with most of the earlier studies where the support
material or the base membranes were laboratory made. To this end, a commercial PES
ultrafiltration membrane, known as a membrane of high mechanical strength, was chosen
to be coated with nanofiber layers of electrospun PVDF, known as a chlorine resistant
and mechanically strong polymer (www.porex.com/technologies/materials/porous-
plastics/polyvinylidene-fluoride/). The filtration performance of the electrospun coated
membrane will be compared with the pristine PES membrane.
3
CHAPTER 2
LITERATURE REVIEW
This chapter introduces membrane separation process, types of available membranes and
their characteristics, membrane fouling, followed by a discussion of different membrane
making processes and modification approaches to minimize fouling.
2.1 Membranes
Selective mass transport is permitted by a thin barrier known as a membrane. A
wide variety of organic polymers and liquids and also inorganic carbons and zeolites can
be used in membrane fabrication (Pinnau & Freeman, 2000). Presently, polymers are
used for the fabrication of most commercial membranes. The most common polymer
membranes are listed in Table 2.1 on the following page.
4
Table 2.1 Common polymeric commercial membranes (Pinnau & Freeman, 2000)
Membrane material Membrane process*
Cellulose regenerated D, UF, MF
Cellulose acetate GS, RO, D, UF, MF
Polyamide RO, NF, D, UF, MF
Polysulfone GS, UF, MF
Poly (ether sulfone) UF, MF
Polycarbonate GS, D, UF, MF
Poly (ether imide) UF, MF
Poly (vinylidene fluoride) UF, MF
Polyacrylonitrile D, UF, MF
Poly (methyl methacrylate) D, UF
*MF= microfiltration; UF= ultrafiltration; NF= nanofiltration; D= dialysis;
PV= pervaporation; GS= gas separation
5
In general, the material and morphology of the membrane control the properties and
performance of the membranes. Pinnau (1994) claimed that a membrane with at least the
following characteristics is useful in an industrial separation process:
- High flux,
- High selectivity (rejection),
- Mechanical stability,
- Tolerance to all feed stream components (fouling resistance),
- Tolerance to temperature variations,
- Manufacturing reproducibility,(Buonomenna, Choi, Galiano, & Drioli, 2011)
- Low manufacturing cost, and
- Ability to be packaged into high surface area modules.
Among these requirements, the permeate (or product) flux and the rejection are
the most important performance metrics. If the flux of the membrane is higher at a given
driving force, the area required for a membrane for a given permeate flow rate will be
smaller; and consequently, the capital costs of the membrane will be lower. As well,
membranes with higher selectivity are more desirable since less processing will be
required to achieve a product of a given purity.
Normally, membranes with high porosity and narrow pore size distribution are
used in dialysis, ultrafiltration, and microfiltration applications (Pinnau & Freeman,
6
2000). On the other hand, in reverse osmosis, pervaporation, and gas separation
membranes with a dense selective layer are used. Also, Villaluenga et al. (2005) have
claimed that according to the solution/diffusion mechanism, flux is inversely proportional
to the membrane thickness; therefore, the selective layer in ideal dense membranes
should be very thin. Even a few defects in a membrane can produce a remarkable
decrease in selectivity, thus, the formation of a molecularly dense thin separating layer is
desired.
Ulbricht (2006) has claimed that although tailor-made polymers have been
developed with an excellent selectivity and permeability, only a few of them were
utilized in commercial applications. The process of applying new membrane materials
has been very slow due to other important performance requirements. For instance,
mechanical strength, chemical resistance, and thermal stability should be considered in
the assessment of new membrane materials (Le & Nunes, 2016). Under industrial
operating conditions, it is critical that membranes show stable long-term separation
characteristics. Over time many of these membranes experience a decrease in separation
flux or selectivity, and basically they need to be replaced regularly. Long-term use of
current membrane types is limited by fouling, swelling, and even chemical destruction.
7
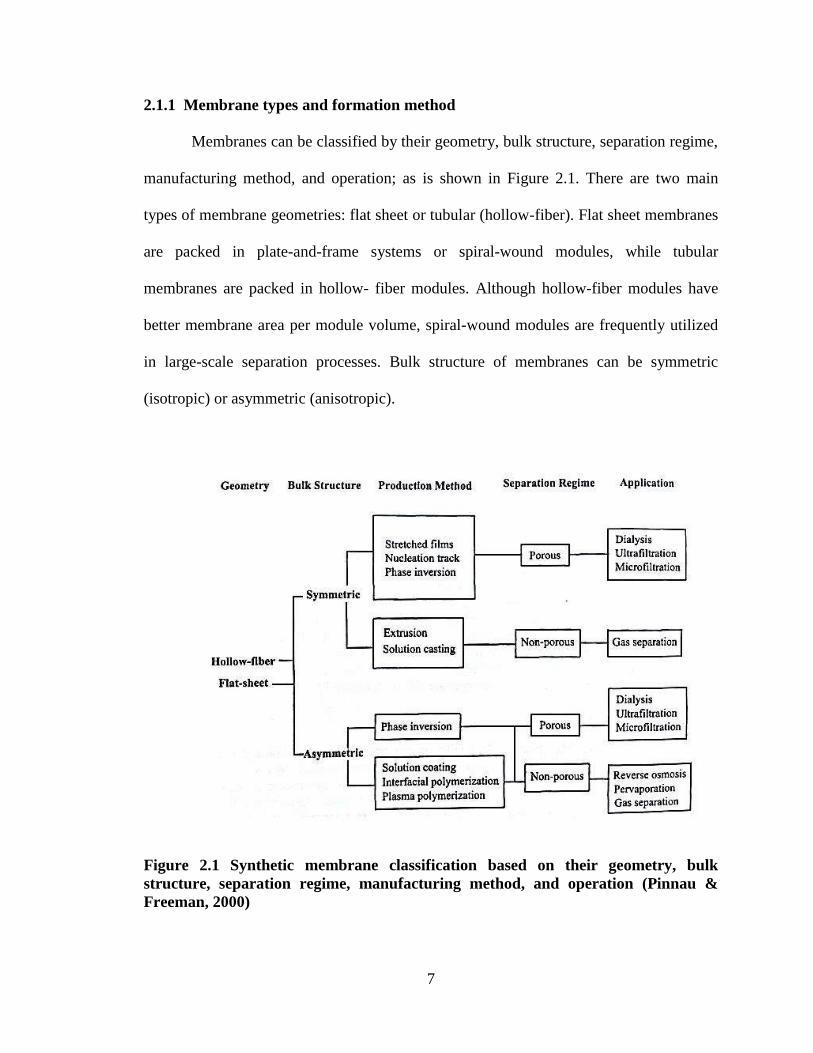
2.1.1 Membrane types and formation method
Membranes can be classified by their geometry, bulk structure, separation regime,
manufacturing method, and operation; as is shown in Figure 2.1. There are two main
types of membrane geometries: flat sheet or tubular (hollow-fiber). Flat sheet membranes
are packed in plate-and-frame systems or spiral-wound modules, while tubular
membranes are packed in hollow- fiber modules. Although hollow-fiber modules have
better membrane area per module volume, spiral-wound modules are frequently utilized
in large-scale separation processes. Bulk structure of membranes can be symmetric
(isotropic) or asymmetric (anisotropic).
Figure 2.1 Synthetic membrane classification based on their geometry, bulk
structure, separation regime, manufacturing method, and operation (Pinnau &
Freeman, 2000)

8
Symmetric membranes have a uniform cross-section (Figure 2.2). On the other
hand, the structure of asymmetric membranes changes from its skin or top surface to its
base.
Figure 2.2 Representational of the cross-section of symmetric and asymmetric
membranes (Pinnau & Freeman, 2000)
9
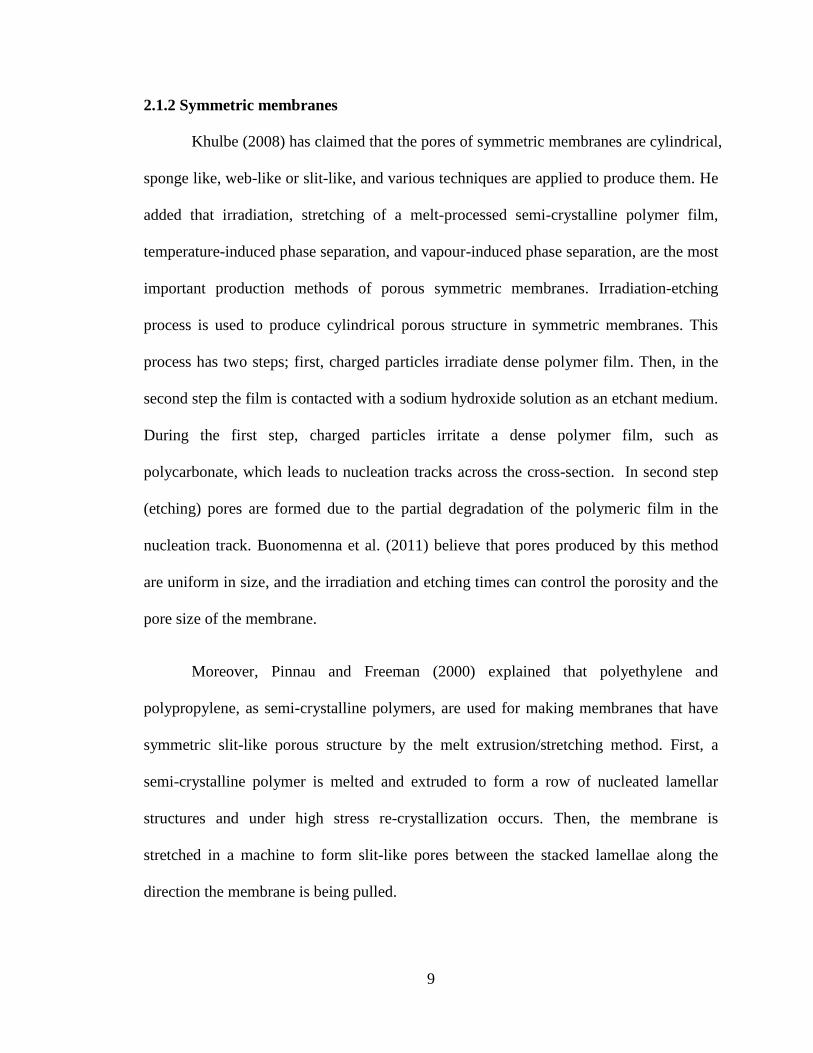
2.1.2 Symmetric membranes
Khulbe (2008) has claimed that the pores of symmetric membranes are cylindrical,
sponge like, web-like or slit-like, and various techniques are applied to produce them. He
added that irradiation, stretching of a melt-processed semi-crystalline polymer film,
temperature-induced phase separation, and vapour-induced phase separation, are the most
important production methods of porous symmetric membranes. Irradiation-etching
process is used to produce cylindrical porous structure in symmetric membranes. This
process has two steps; first, charged particles irradiate dense polymer film. Then, in the
second step the film is contacted with a sodium hydroxide solution as an etchant medium.
During the first step, charged particles irritate a dense polymer film, such as
polycarbonate, which leads to nucleation tracks across the cross-section. In second step
(etching) pores are formed due to the partial degradation of the polymeric film in the
nucleation track. Buonomenna et al. (2011) believe that pores produced by this method
are uniform in size, and the irradiation and etching times can control the porosity and the
pore size of the membrane.
Moreover, Pinnau and Freeman (2000) explained that polyethylene and
polypropylene, as semi-crystalline polymers, are used for making membranes that have
symmetric slit-like porous structure by the melt extrusion/stretching method. First, a
semi-crystalline polymer is melted and extruded to form a row of nucleated lamellar
structures and under high stress re-crystallization occurs. Then, the membrane is
stretched in a machine to form slit-like pores between the stacked lamellae along the
direction the membrane is being pulled.
10
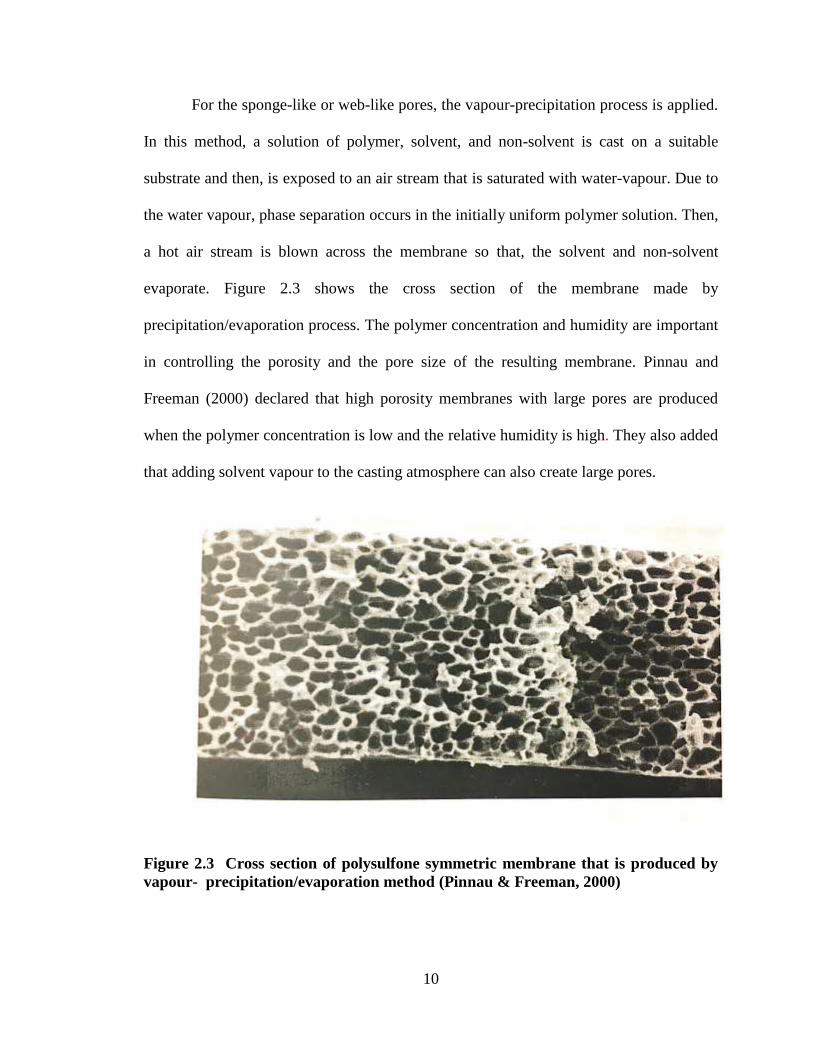
For the sponge-like or web-like pores, the vapour-precipitation process is applied.
In this method, a solution of polymer, solvent, and non-solvent is cast on a suitable
substrate and then, is exposed to an air stream that is saturated with water-vapour. Due to
the water vapour, phase separation occurs in the initially uniform polymer solution. Then,
a hot air stream is blown across the membrane so that, the solvent and non-solvent
evaporate. Figure 2.3 shows the cross section of the membrane made by
precipitation/evaporation process. The polymer concentration and humidity are important
in controlling the porosity and the pore size of the resulting membrane. Pinnau and
Freeman (2000) declared that high porosity membranes with large pores are produced
when the polymer concentration is low and the relative humidity is high. They also added
that adding solvent vapour to the casting atmosphere can also create large pores.
Figure 2.3 Cross section of polysulfone symmetric membrane that is produced by
vapour- precipitation/evaporation method (Pinnau & Freeman, 2000)
11
2.1.3 Asymmetric membranes
As described by Ladewig and Al-Shaeli (2017) based on their structure there
are three kinds of asymmetric membranes: 1) integrally asymmetric- membranes with a
porous skin layer; 2) integrally asymmetric membranes with a dense skin layer; and 3)
thin- film composite membranes. Integrally asymmetric membranes with a porous skin
layer are utilized in dialysis, ultrafiltration, and microfiltration, while integrally
asymmetric membranes with a dense skin layers are used in reverse osmosis and gas
separation (Ladewig & Al-Shaeli, 2017). They also reported that thin-film composite
membranes have a thin selective layer on top of a porous support layer, and the materials
for each layer can be chosen independently; essentially, this type of membrane is
produced for reverse osmosis although currently they are primarily utilized in
nanofiltration, gas separation, and pervaporation applications.
The Immersion precipitation process is used to produce integrally-skinned
asymmetric membranes from a binary solution which contains a polymer and a solvent.
The cast solution is spread over a surface to form a film, and then the solution- film is
immersed into a liquid (the non-solvent) and mixed. Then, some of the solvent diffuses
into the non-solvent but the polymer does not; this results in a porous or non-porous skin
layer of asymmetric structure formation. In integrally–skinned asymmetric membranes
there is a structural gradient as a result of precipitous polymer concentration in the
developing membrane at the beginning of the phase separation (Buonomenna et al., 2011).
Phase separation in immersion precipitation is generated via solvent evaporation or
solvent/non-solvent exchange during quenching.
12
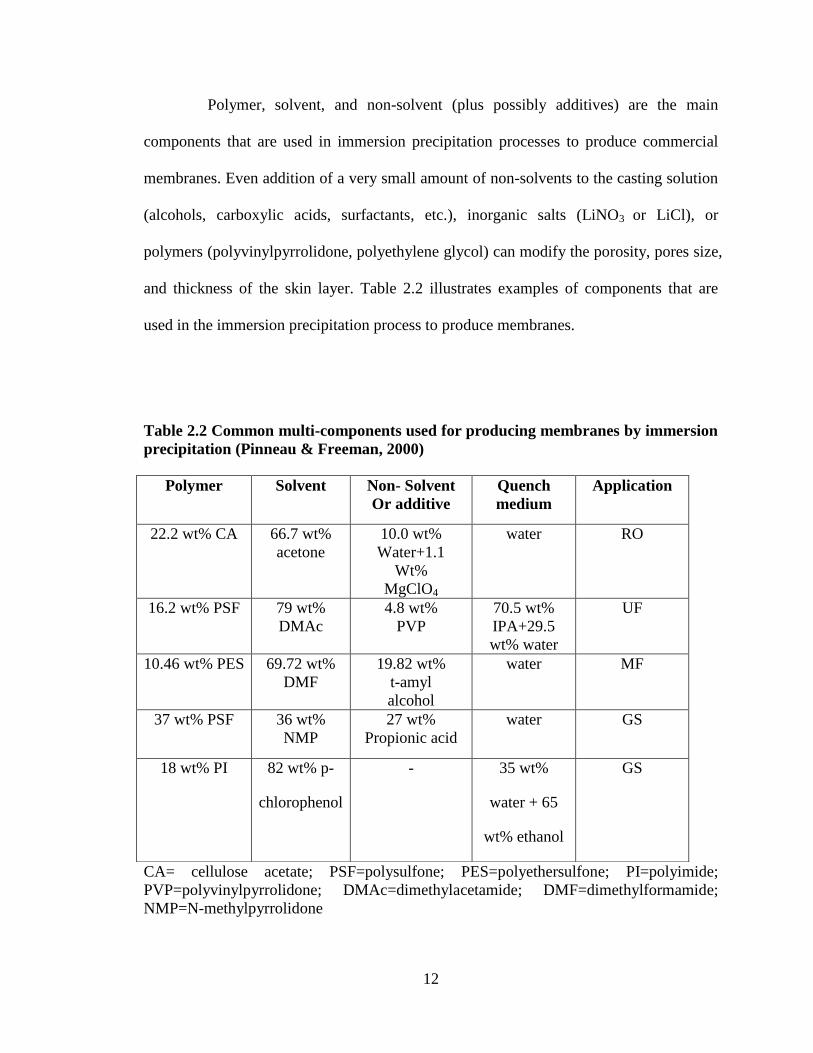
Polymer, solvent, and non-solvent (plus possibly additives) are the main
components that are used in immersion precipitation processes to produce commercial
membranes. Even addition of a very small amount of non-solvents to the casting solution
(alcohols, carboxylic acids, surfactants, etc.), inorganic salts (LiNO3 or LiCl), or
polymers (polyvinylpyrrolidone, polyethylene glycol) can modify the porosity, pores size,
and thickness of the skin layer. Table 2.2 illustrates examples of components that are
used in the immersion precipitation process to produce membranes.
Table 2.2 Common multi-components used for producing membranes by immersion
precipitation (Pinneau & Freeman, 2000)
CA= cellulose acetate; PSF=polysulfone; PES=polyethersulfone; PI=polyimide;
PVP=polyvinylpyrrolidone; DMAc=dimethylacetamide; DMF=dimethylformamide;
NMP=N-methylpyrrolidone
Polymer Solvent Non- Solvent
Or additive
Quench
medium
Application
22.2 wt% CA 66.7 wt%
acetone
10.0 wt%
Water+1.1
Wt%
MgClO4
water RO
16.2 wt% PSF 79 wt%
DMAc
4.8 wt%
PVP
70.5 wt%
IPA+29.5
wt% water
UF
10.46 wt% PES 69.72 wt%
DMF
19.82 wt%
t-amyl
alcohol
water MF
37 wt% PSF 36 wt%
NMP
27 wt%
Propionic acid
water GS
18 wt% PI 82 wt% p-
chlorophenol
- 35 wt%
water + 65
wt% ethanol
GS
13
According to Pinnau and Freeman, (2000), the specific parameters that affect formation
of membranes in immersion precipitation method are:
- Characteristics of the polymer (molecular weight, molecular weight distribution)
- Characteristics of the solvent
- Characteristics of the additives
- Proportion of the base polymer, solvent and additives in the casting solution
- Temperature of the casting solution
- Characteristics and temperature of the quench medium
- Composition and temperature of the atmosphere
- Evaporation conditions
- Cast film thickness
- Casting speed
- Material of membrane support (type of woven or non- woven)
- Drying conditions
14
2.1.4 Thin-film composite membranes
Thin-film composite membranes are composed of at least two layers that are
made of different materials (Ladewig & Al-Shaeli, 2017). They can consist of a single
thin selective layer and a porous sublayer, or multi layers with different functions. In
single thin–layer membranes, the first type, mechanical strength is provided by the
porous support while the top-layer governs the separation. In the multi-layer membranes,
the second type, each layer has a specific function.
Thin film composite membranes have several advantages over the integrally-
skinned asymmetric membranes such as: 1) different materials can be chosen and
different preparation methods can be applied for the separating layer and the porous
sublayer; 2) Only a very small amount of polymer is used for the selective layer,
therefore, very expensive membrane materials can be used (Naylor, 1996).
Low et al. (2015) claimed that in many cases, mechanical support for the thin-
film composite membranes is provided by an ultrafiltration membrane that is produced by
the immersion precipitation method and is porous. The porous support layer should be
chemically resistant to the solvent or solvent mixture used for the formation of the
selective layer. Also, it should have small pores and high surface porosity.
Lau & Ismail (2011) claimed that solution coating and interfacial polymerization
methods are the most important techniques to produce commercial thin-film composite
membranes. In the solution coating technique, the surface of a porous support, such as
substrate or backing material, is covered by direct deposition of a diluted polymer
solution. Regardless of the shape (flat sheet or hollow fibre support) before coating, the
15
porous support is immersed into a bath of dilute polymer. Then, the membrane is taken
out of the bath and the solvent evaporates and a thin layer of polymer forms on the
surface of substrate membrane. The thickness of this coating layer is usually less than 2
m and contains defects. Also, the coating polymer solution may penetrate into the pores
of the substrate membrane (Khayet & Matsuura, 2011).
In interfacial polymerization or in-situ technique, a nonporous top layer is created
on a porous substrate via a polymerization reaction; this occurs when two reactive
monomers react at the interface of the two un-mixable solvents. The porous substrate is
saturated by an aqueous solution which contains a reactant, such as a polymeric amine,
and then the porous substrate is immersed, an un-mixable organic solvent (such as
hexane), that contains a reagent like di- isocyanate. As a result of the reaction of the two
monomers at the water-organic solvent interface, a dense layer forms on top of the porous
substrate (Baker, 2012).
16
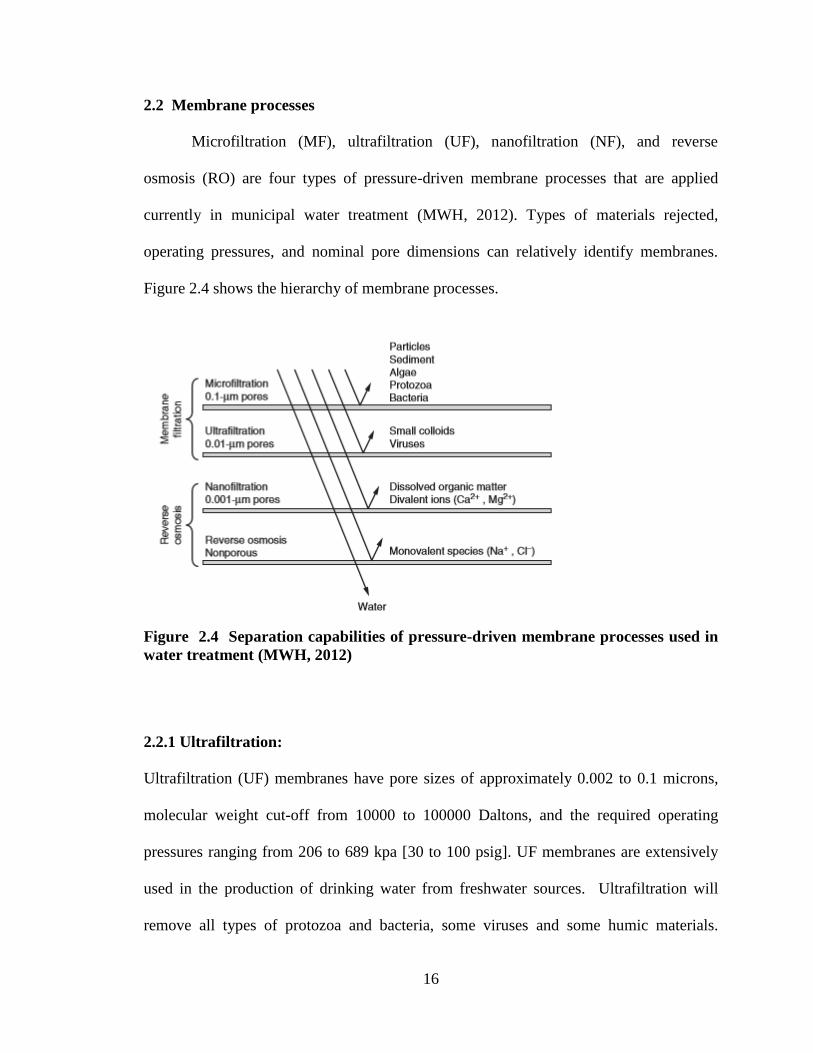
2.2 Membrane processes
Microfiltration (MF), ultrafiltration (UF), nanofiltration (NF), and reverse
osmosis (RO) are four types of pressure-driven membrane processes that are applied
currently in municipal water treatment (MWH, 2012). Types of materials rejected,
operating pressures, and nominal pore dimensions can relatively identify membranes.
Figure 2.4 shows the hierarchy of membrane processes.
Figure 2.4 Separation capabilities of pressure-driven membrane processes used in
water treatment (MWH, 2012)
2.2.1 Ultrafiltration:
Ultrafiltration (UF) membranes have pore sizes of approximately 0.002 to 0.1 microns,
molecular weight cut-off from 10000 to 100000 Daltons, and the required operating
pressures ranging from 206 to 689 kpa [30 to 100 psig]. UF membranes are extensively
used in the production of drinking water from freshwater sources. Ultrafiltration will
remove all types of protozoa and bacteria, some viruses and some humic materials.
17
However, since UF membranes are not absolute barrier for all viruses, in drinking water
treatment post-membrane chemical disinfection is recommended as a second barrier to
viruses. Ultrafiltration has a wide application in many industrial processes with high
separation efficiency such as water purification, biological filtration, and beverage
clarification (Dobosz et al., 2017). To improve the performance of UF membranes it is
necessary to simultaneously improve the permeability and selectivity by controlling their
structure (Fang et al., 2015). Fang et al. (2015) also declared that high membrane
permeability is achieved by membranes with thinner skin layers and larger pore density;
while better selectivity occurs by thinner skin layer and smaller pore sizes. Usually, the
material for ultrafiltration membrane is either organic or inorganic (Chen et al., 2013) and
the most common polymeric ultrafiltration membrane preparation method is the phase
inversion process (Fang et al., 2015). Compared to conventional clarification and
disinfection processes, the principal advantages of low-pressure ultrafiltration membranes
are (Foley, 2011):
- Less chemicals such as coagulants, flocculants, disinfectants, and pH adjustment
are required
- Size- exclusion filtration in contrast with media depth filtration
- Constant quality of the purified water regardless of fluctuations in the feed water
quality
- Compact units resulting in smaller treatment plants
- Uncomplicated automation
18
2.3 Membrane fouling
Zhao et al (2000) claimed that most membrane separation processes save energy
and do not require phase change; therefore, they are widely used technologies and are a
better substitution for some of the conventional separation processes. Compared to
distillation and evaporation processes, membrane separation are non-thermal methods
and have higher efficiency. Thus, industries such as the pharmaceutical and the food
industry apply membranes for many separation processes. Although there is a great
interest in membrane technology and its applications, their efficiency is affected by
fouling and concentration polarisation (Zhao et al., 2000).
Accumulation of solutes in the pores or on the surface of the membrane causes
fouling which reduces membrane permeability (Duranceau, 2001). Also, membrane
rejection is affected by fouling. There are two types of fouling: reversible, which can be
removed by hydrodynamic or chemical cleaning processes, and irreversible which cannot.
Only the flux loss caused by reversible fouling can be recovered (Duranceau, 2001).
Shi et al. (2014) declared that concentration polarisation is a specific problem
throughout filtration process of low molecular weight solutes or macromolecules. During
filtration, the permeation flow carries solutes towards the membrane surface, where
larger solutes are rejected by the surface of the membrane while the solvent molecules
pass through the membrane. Thus, the rejected molecules accumulate near the membrane
surface and diffuse back to the bulk solution very slowly, which leads to a concentration
gradient above the surface of the membrane. The concentration of the rejected molecules
near the membrane surface becomes sometimes 20-50 times of the bulk solution (Shi et
al., 2014). The accumulated molecules delay the flow of the solvent through the
19
membrane and causes osmotic back pressure which reduces the effective transmembrane
pressure (TMP) of the system. Although concentration polarisation is an unavoidable
phenomenon, it does not have impact on innate properties of a membrane. If the feed is
switched to the pure-solvent stream, the flux loss will be recovered. Accumulation of
solutes at the upstream surface of a membrane leads to concentration polarization, which
is considered as a hydrodynamic/diffusion phenomenon (Zhao et.al, 2000). Operating the
system at higher velocity may facilitate reduction of this phenomenon. Usually,
concentration polarization occurs in any membrane processing due to fundamental
restrictions of mass transfer and actuality of a boundary layer.
In addition, deposition of matter on the surface of a membrane or inside its pores causes
membrane fouling. Irreversible loss of membrane permeability may occur by fouling in
contrast to reversible flux decline caused by concentration polarisation.
2.3.1 Types of fouling
Adsorption, pore blocking, and cake or gel formation are the mechanisms that
cause fouling in ultrafiltration. Adsorption occurs due to specific interactions between
particles or solutes in the solution and the membrane. Depending on which functional
group is involved, interactions are weak Van der Waals, electrostatic interactions, or
chemical bonds (Shi et al., 2014). In addition, formation of a monolayer of solutes on the
surface of the membrane can occur instantaneously and spontaneously even in the
absence of permeate flux. This phenomenon may become irreversible as it happens in the
separation of some humic acids (HA) and proteins; humic acids are diverse in
composition, many are hydrophobic in nature, so, they have a strong affinity for the
membrane surface (Shi et al., 2014). Only chemical cleaning is effective for membranes
20
fouled with these macromolecules. The hydrophobicity of the membrane material may
make it more prone to fouling particularly by hydrophobic solutes. Hydrophobicity and
charge characteristics of the membrane are affected by the adsorbed materials (Shi et al.,
2014).
Pore blocking, cake, and gel formation are considered as internal and external
fouling, respectively. When colloids and particles block the pores fully or partially, pore
blockage forms and it usually occurs rapidly in the initial phases of filtration before the
cake and gel formation.
As Shi et al., (2014) have described, cake layer forms when particles precipitate
layer by layer on the membrane surface causing an extra resistance to the permeate flow.
Both chemically inert and active colloids can form the cake layer. The first layer of inert
colloids near the surface of the membrane prevents active colloids from contacting the
membrane surface. This is called a “filter aid”. In contrast, it may happen that the first
layer is formed by the active colloids that will act as a bridge for inert colloids; this
phenomenon creates a more adhesive cake and more irreversible fouling. When small
macromolecules enter and penetrate the openings within the cake, “over clogging” occurs
and this leads to a considerable hydraulic resistance. While Shi et al. (2014) declared that
the interaction between the membrane surface and cake layer determines the fouling
reversibility, morphology of the cake layer controls the flux decline.
21
Gel formation occurs when the concentrated layer of macromolecules is formed in
the vicinity of the membrane surface due to concentration polarisation. Concentration
polarization transits to fouling when the attractive electrostatic force becomes greater
than the repulsive force. Shi et al. (2014) claimed that at a certain flux gelation occurs
and this flux is marked as limiting flux that represents the maximum stationary
permeation flux reached through increasing trans-membrane pressure (TMP). In general,
mechanism of fouling depends on operating conditions, feed streams, and membrane
properties.
22
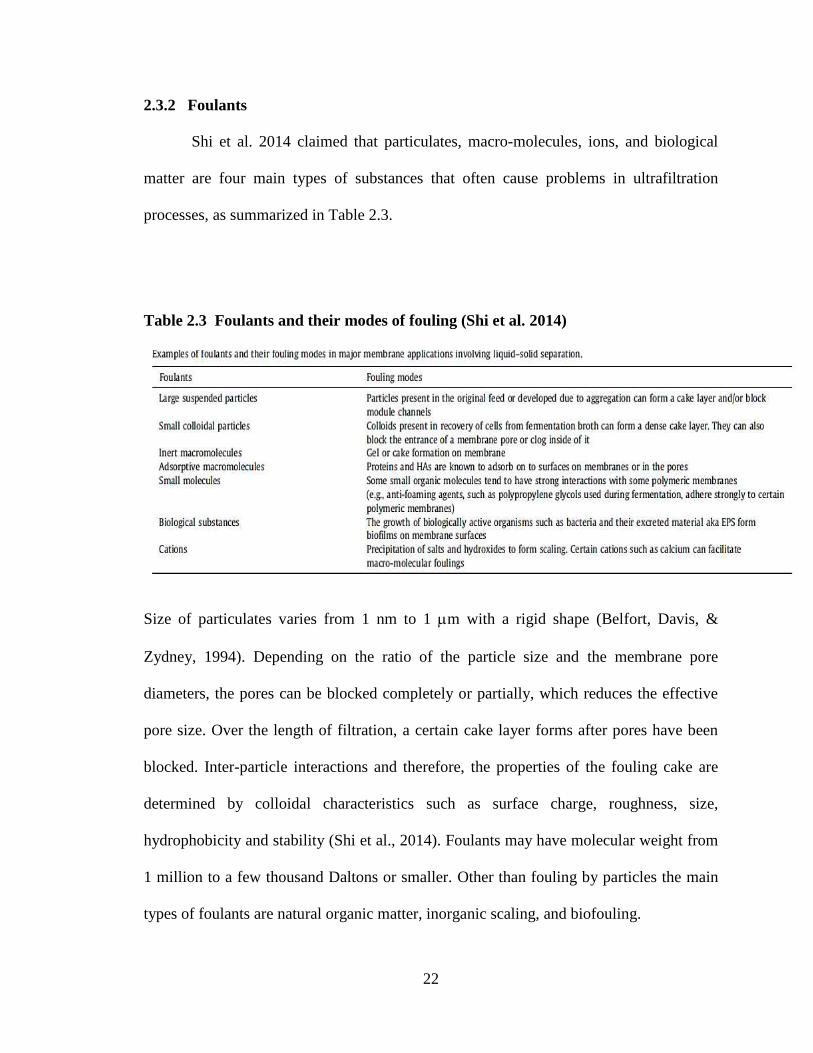
2.3.2 Foulants
Shi et al. 2014 claimed that particulates, macro-molecules, ions, and biological
matter are four main types of substances that often cause problems in ultrafiltration
processes, as summarized in Table 2.3.
Table 2.3 Foulants and their modes of fouling (Shi et al. 2014)
Size of particulates varies from 1 nm to 1 m with a rigid shape (Belfort, Davis, &
Zydney, 1994). Depending on the ratio of the particle size and the membrane pore
diameters, the pores can be blocked completely or partially, which reduces the effective
pore size. Over the length of filtration, a certain cake layer forms after pores have been
blocked. Inter-particle interactions and therefore, the properties of the fouling cake are
determined by colloidal characteristics such as surface charge, roughness, size,
hydrophobicity and stability (Shi et al., 2014). Foulants may have molecular weight from
1 million to a few thousand Daltons or smaller. Other than fouling by particles the main
types of foulants are natural organic matter, inorganic scaling, and biofouling.
23
2.3.2.1 Natural organic matter
Natural organic matter (NOM) was classified by Shi et al. (2014) according to the
NOM’s origin and source: i) allochthonous organic matter originates from floral debris
and terrestrial sources, ii) autochthonous organic matter consisting of extracellular,
intercellular, and cellular debris from natural aquatic sources, iii) NOM from wastewater
effluents (EfoM) that contains background NOM and soluble microbial products (SMPS)
generated by biological wastewater treatment plants. According to Shi et al. (2014) NOM
has a complex chemistry due to the wide range in size of the heterogeneous mixture of
macromolecules, functional groups, and sub structures. They also declared that the
majority of these macromolecules in natural waters are humic substances; they represent
approximately 80% of the total organic carbon in the water. Based on the solubility of
humic substances in acidic solutions, NOM is categorized into three fractions: 1)
insoluble humin; 2) humic acids (HA) which are insoluble at pH<2; and 3) fulvic acids
(FA) which are soluble at any pH. Polysaccharides, carbohydrates, amino acids, and
proteins are the other fraction (20%) of NOM.
In NOM filtration the feed is complex and it is generally difficult to identify an
individual fouling mechanism; the effects are combined. For example, HAs provide a
bridge between membrane polymers and alginate gels, which causes a more irreversible
fouling layer (Jermann et al., 2007). Compressing the electrostatic double layer and
smoothing colloidal aggregation are caused by HAs, which may lead to changing the
state of colloidal particles (Tombacz et al., 2004; Tombacz & Szekeres, 2006; Contreras
et al., 2009).
24
2.3.2.2 Scaling
Scaling from metal ions can be a significant problem of UF under specific
circumstances. Iron salts are sometimes used as a coagulant agent in membrane pre-
treatment of surface waters with medium to high turbidities and NOM concentrations.
The Fe salts form Fe(OH)3 flocs that can form a sticky brown fouling layer on the
membrane surface. Shi et al. (2014) declared that the magnitude of the fouling caused by
cation flocs can be greater than that by the foulants themselves. Divalent cations provide
a bridge between NOM molecules that have a net negative charge. Also, Shi et al. (2014)
claimed that although the membrane surface is negatively charged the presence of
monovalent cations increases the ionic strength and weakens electrostatic repulsion force.
2.3.2.3 Membrane biofouling
Shi et al. (2014) have provided that membrane biofouling is caused by active
microorganisms when they adhere to the membrane and form a biofilm by growing. The
process begins by adsorption of existing macromolecules in the feed such as proteins,
polysaccharides, HAs, and extracellular polymeric substances (ESP) discharged from the
microorganisms, and formation of a conditioning film on the membrane surface. They
form a gel-like film that causes an immediate extra resistance to the permeate flow. An
uneven deposition forms due to attachment of micro-organisms onto the membrane
surface. Nutrients and organics from the feed are brought to the membrane surface by
convective flows and concentration gradients (diffusion). Shi et al. (2014) claimed that
the colonisers grow on these transferred nutrients and organic and eventually, form a
joining and mingling biofilms. These biofilms may be heterogeneous, dwelling different
species of micro-organisms, and stratified, containing a layer with an aerobic population
25
at the top and another layer consisting anaerobic population underneath, this is provided
by Schaefer et al. (2005). As Le-Clech et al. (2006) have discussed, these biofilms are a
major issue in MBRs (membrane bio reactors) and RO systems.
2.4 Factors affecting membrane fouling
2.4.1 Impact of feed properties
2.4.1.1 Concentration
According to Olson (1977) and Balmann et al. (1989), increasing the feed concentration
leads to a decline in permeate flux but does not have remarkable effect on the membrane
retention characteristics, unless the size of components change with concentration. As
well, increasing concentration has little impact on irreversible membrane fouling but
reversible cake and gel formation is increased. Furthermore, increasing concentration
increases the rate of membrane fouling when internal membrane fouling is dominant.
However, cake or surface fouling is presumed to dominate at high concentration feeds.
2.4.1.2 pH and ionic strength
Proteins are complex molecules and their interactions with the membrane surface are
affected by pH and ionic strength, therefore, protein fouling is not clearly understood.
There are three explanations for the effects of ionic strength and pH on membrane-
protein interactions: 1) the change in protein configuration and stability affects the
tendency of the protein to deposit on the membrane; 2) the change in the protein effective
size affects the porosity of the dynamic membrane; and 3) the change in charge
difference between the membrane surface and protein affects protein deposition or
adsorption (Zhao et al., 2000).
26
2.4.1.3 Constitution interactions
When there are large and smalle molecules that coexist in the feed solution, the
larger molecules may be adsorbed first due to their stronger interaction with the
membrane, leading to the partial pore blocking. Then the smaller molecules are rejected
by the smaller pores formed between the larger molecules (Zhao et al., 2000).
2.4.1.4 Prefiltration and aggregates removal
When proteins agglomerate, larger membrane pores are blocked, causing
disproportionate loss of flux and the formation of a protein foulant layer on the
membrane surface (Zhao et al., 2000). Permeate flux in UF and MF can be improved by
prefiltration in which large molecular weight compounds are removed (Tanny et al.,
1982).
2.4.2 Effect of membrane physio-chemical characteristics on membrane
performance and fouling
In general, membrane fouling is influenced by: a) the morphology of the membrane
surface; e.g. surface roughness, pore size, and porosity, and b) the physio-chemical
characteristics of the membrane.
2.4.2.1 Pore size
Numerous studies have shown that increasing the pore size leads to more severe
membrane fouling (Gatenholm et al., 1988; Balmann et al., 1989). There is an optimum
pore size; below the optimum size the permeate flow is restricted due to the resistance of
the membrane and above the optimum size the flux decreases due to the serious
membrane fouling.
27
2.4.2.2 Porosity and pore size distribution
Zhao et al. (2000) have claimed that the majority of UF and MF membranes
possess a broad pore size distribution. The total permeate flux is controlled by the flow
through the largest pores, therefore, fouling or plugging of the large pores such as by
protein aggregation, affect the permeate flux. Membranes with a wide pore size
distribution have poor selectivity. Pore size distribution and pore density are changed by
membrane fouling. Thus, as the membrane gets fouled over the time, membrane
selectivity, component retentions, and permeate flow are changed (Zhao et al., 2000).
2.4.2.3 Physico-chemical properties
Zhao et al. (2000) explained that physio-chemical interactions between solutes
and membrane materials may change under different circumstances. The two main
physio-chemical interactions are charge and hydrophobic effects. They added that the
membrane material, the pH, and ionic strength of the feed determine the charges on the
membrane. Electrostatic interactions between the solute and the membrane are either
attractive or repulsive. Both solute and membrane charges are effected by the pH of the
feed solution. As well, as the ionic strength of the feed solution increases, the thickness of
the double layer is reduced, this weakens the electrostatic interaction.
Nakao et al. (1988) showed for membranes that had a similar charge to the protein
charge, the permeate flux may be higher if the concentration polarization is less. They
explained that this occurs by repulsion of same electrostatic charges between membrane
and proteins, and it results in a smaller concentration polarization layer and ultimately,
lower flux reduction.
28
According to Fane and Fell (1987) hydrophilic membranes adsorb less protein and
potentially have higher permeate fluxes than hydrophobic membranes. However, when
multilayers of adsorbed proteins form due to high concentration polarization and protein
deposition, the effect of membrane surface hydrophilicity/phobicity is hidden.
2.4.3 The effect of the membrane operating factors
The permeate flux and fouling are impacted by a number of factors in membrane
operating system. These factors include the transmembrane pressure, temperature, and
cross-flow velocity and turbulence.
2.4.3.1 Transmembrane pressure
Zhao et al. (2000) showed that in low pressure filtration (TMP< 4 bar), increasing
the transmembrane pressure leads to an increase in permeate flux and an increase in the
fouling rate. Increasing concentration polarization can decrease the membrane rejection.
However, in the long term the retention of component by UF membranes increases
because the rate of fouling is increased (Zhao et al., 2000).
2.4.3.2 Temperature
Zhao et al. (2000) declared that increasing temperature results in an increase in
the permeate flux due to the decrease in the liquid viscosity. Edzwald (2010), in his water
quality and treatment handbook, also claimed that increasing temperature also increases
the solute diffusivity and permeate flux, and thus reduces the concentration polarisation
effect.
29
2.4.3.3 Cross-flow velocity and turbulence
Zhao et al. (2000) claimed that permeate flux improves in UF and MF by
increasing the cross-flow velocity due to a reduction in the gel layer formation. They
added that increasing velocity decreases membrane fouling and increases effective pore
size. They explained that the cross-flow velocity does not have any effect on the
irreversible fouling as it is primarily due to fouling in the membrane pores. In addition,
they claimed that generating higher turbulence at the membrane surface causes an
enhancement in mass transfer and a greater membrane flux.
30
2.5 Membrane cleaning
Membrane cleaning methods are categorized into four types: Physical, chemical, physio-
chemical, and biological techniques.
2.5.1 Physical cleaning methods
According to Pearce (2011) in physical membrane cleaning methods the foulants are
removed mechanically from the membrane surface. These methods include periodical
backflushing of hollow fiber membranes, cross-flow flushing of flat sheets and spiral
wound membranes, vibration, air sparging, and ultrasonication. The optimization of
ultrasonic cleaning procedures for ultrafiltration membranes in the dairy industry was
attempted by Muthukumaran et al. (2004).
2.5.2 Chemical cleaning methods
Zhao et al. (2000) have provided that this technique is dependent on chemical reactions
that remove foulants from the membrane surface. Normal functional capacity and
separation properties of the membrane should be restored while deposits are removed by
the chemical cleaning process. They added that chemicals should dissolve the foulant at
the membrane surface, but should not destroy the membrane or other parts of the system.
Examples of cleaning agents include: alkalis (hydroxides, carbonates); acids (nitric and
phosphoric); surface- active agents (anionic, cationic, and non-ionic); and sequestering
agents: (EDTA) (Zhao et al., 2000). Chlorine solutions are often used to clean NOM
fouled membranes.
31
2.5.3 Physico-chemical cleaning methods
Physical and chemical cleanings are combined in order to enhance cleaning efficiency.
Zhao et al. (2000) mentioned that a physio-chemical cleaning method has been performed
by Kuiper and his colleagues to clean cellulose acetate RO membranes fouled by a highly
polluted source for 19 months. The most effective cleaning method was mechanical
cleaning (such as depressurising and flushing with the foam balls) enhanced by acid
washing.
2.5.4 Biological cleaning methods
Foulants are removed by cleaning mixtures that contain bioactive agents. Enzymes are
the most effective cleaning agents for this purpose (Zhao et al., 2000).
2.6 Approaches for improving membrane performance
Methods to avoid reduction of membrane performance due to membrane fouling
and concentration polarization are classified in four categories: control of boundary layer,
turbulence generator or persuader, membrane materials, and membrane modification.
2.6.1 Boundary layer or velocity control
Al-Bastaki and Abbas (2001) have claimed that thickness of the boundary layer
adjacent to the membrane can be reduced by increasing the cross-flow velocity of the
feed solution. They also mentioned that flow pulsation causes the boundary layer
thickness to oscillate and helps prevent the formation of gel layers. They explained that
the flow pulsation is used in addition to a periodic backwashing from the permeate side in
order to minimize concentration polarization.
32
2.6.2 Turbulence generator
Turbulence generators and persuaders include ribbed spacers and channels,
additional particles or spheres with different densities, and ribbed or wavy membranes
(Zhao et al. 2000). The increased turbulence they create help reduce the thickness of the
boundary layer and thus reduce the extent of concentration polarization.
2.6.3 Membrane material and modification
Contact of foulants with the membrane can be minimized by velocity and
turbulence on the surface of the membrane. Nevertheless, eventually, foulants will
interact or react with the membrane. Thus, membrane fouling can be reduced by
minimizing these interactions. The development of new membrane materials and the
modification of membrane surfaces are helpful for reducing membrane fouling (Zhao et
al., 2000).
Hydrophilic and homogeneously permeable membranes are ideal UF membranes
for the majority of applications. To this end, membranes are often pretreated by
surfactants or by hydrophilic polymers such as: methylcellulose (MC), polyvinylalcohol
(PVA), and PVP, especially when the foulant is a protein (Zhao et al., 2000). Initial UF
flux increases and flux decline decreases via this treatment.
Surface Thin-film (–layer) (TFL) coating is a technique to modify the membrane
surface (Matsuura & Rana, 2010). They added that TFLs can be coated via non covalent
or Van der Waals bonding by using materials that are hydrophilic or negatively charged.
In addition, they explained that surface- modifying macromolecules (SMM) are
polymers or macromolecules blended in the membrane casting solutions and during the
33
casting these macromolecules tends to migrate toward the surface of the membrane in
order to decrease the surface energy, as confirmed by Zhang et al. (2003). Matsuura &
Rana (2010) explained that by controlling the amount of mitigated components the
membrane surface can be modified by blending even small quantity of macromolecules.
This is a one step process and does not require an extra surface-modification step
(Nguyen et al., 2007; Pezeshk, et al., 2012).
2.7 Electrospinning
Nasreen et al. (2013) have claimed that one of the recent developments in
membrane fabrication and modification is the application of nanotechnologies. Various
materials such as polymers and inorganic metal/polymer composite can be used in their
nano-scale structures. They also added that among others, electrospun nanofiber
membranes (ENMs) have attracted much attention recently due to their high porosity of
interconnected pores, the high surface to volume ratio, simplicity of electrospinning.
Electrospinning is a flexible method for producing nanofibers with various
diameters and different morphologies (Nasreen et al., 2013). It is capable to produce
nanofibers of nanometer to micrometer size. The formation of nanofibers is governed by
several electrospinning conditions such as: the electrospinning solution flow rate, the
applied voltage, the electrospinning chamber humidity, and the distance between the tip
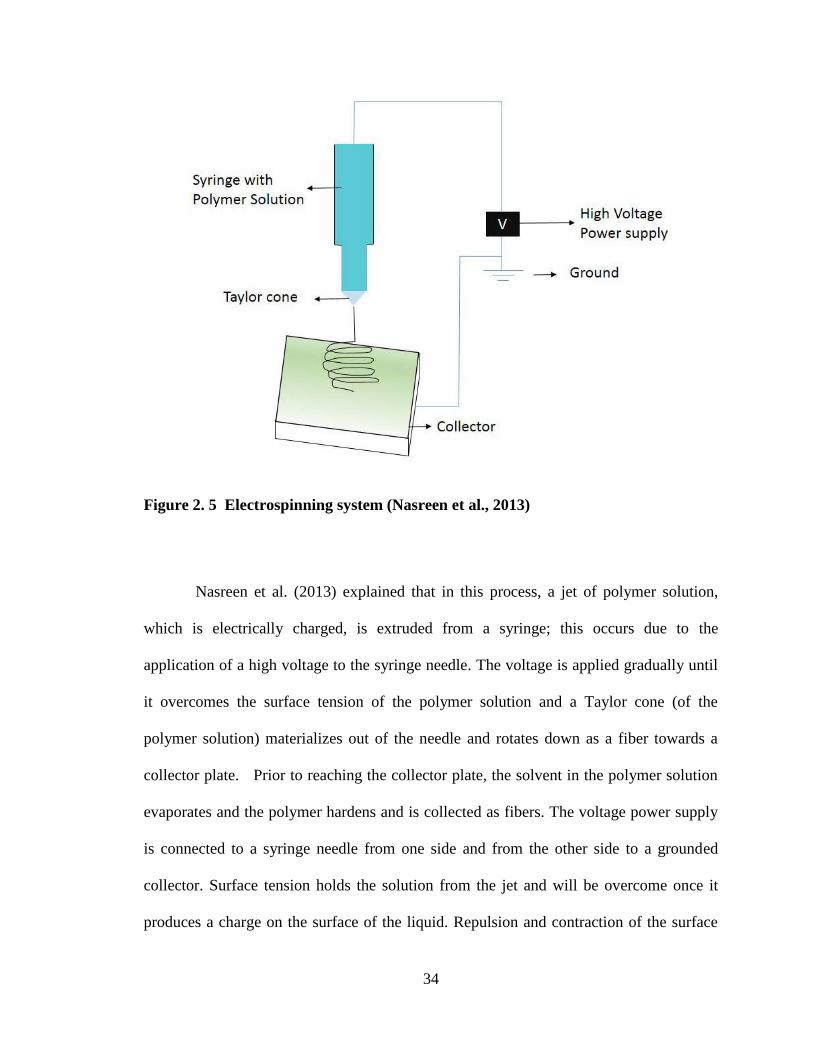
of the extrusion needle and the nanofiber collector. Figure 2.5 presents a schematic an
electrospinning set-up.
34
Figure 2. 5 Electrospinning system (Nasreen et al., 2013)
Nasreen et al. (2013) explained that in this process, a jet of polymer solution,
which is electrically charged, is extruded from a syringe; this occurs due to the
application of a high voltage to the syringe needle. The voltage is applied gradually until
it overcomes the surface tension of the polymer solution and a Taylor cone (of the
polymer solution) materializes out of the needle and rotates down as a fiber towards a
collector plate. Prior to reaching the collector plate, the solvent in the polymer solution
evaporates and the polymer hardens and is collected as fibers. The voltage power supply
is connected to a syringe needle from one side and from the other side to a grounded
collector. Surface tension holds the solution from the jet and will be overcome once it
produces a charge on the surface of the liquid. Repulsion and contraction of the surface
35
charges to the counter electrode generate an opposite force directly to the surface tension.
By increasing the voltage, the Taylor cone initiated from the tip of needle surface
lengthens. The discharged polymer solution jet experiences an instability and elongation
process, which permits the jet to create remarkably long, uniform, and thin fibers.
Nasreen et al. (2013) mentioned that electrospinning is a technique with numerous
potential applications. However, presently electrospinning is primarily at the research
stage involving small membranes; large-scale (commercial) membrane electrospinning
has not been fully developed. They also claimed that multijet and needleless
electrospinning methods are emerging, which will hopefully permit larger scale
membrane electrospinning.
Feng et al. (2013) claimed that more than 100 standard synthetic and natural
polymers, such as poly (ethylene terephthalate) (PET), polystyrene (PS), poly (ethylene
oxide) (PEO), poly (vinyl chloride) (PVC), poly (vinylidine fluoride) (PVDF), wools, silk,
cellulose have been successfully electrospun into nanofibers from their solutions. This
occurs due to sufficiently high molecular weight of polymers and the vaporization of
solvent during the time of jet transition over the distance between the needle (or
spinneret) and the collector (Feng et al., 2013).
There is a problem in handling electrospun nanofibers due to their accumulation
of electrostatic charges during the electrospinning process. This happens when the
polymer is poorly conductive and the polymer tends to continue, retaining the charges
instantly after deposition. Gopal et al. (2006) declared that this problem escalates as the
electrospinning thickness increases. Therefore, an additional support different from
36
conventional membranes is required for facilitating the membrane application and
improving the nanofibers strength. Thus, a considerable number of applications of ENMs
in membrane separation were built on hybrid systems where nanofibers were
“sandwiched” between different layers or combined with micron fibers (Gopal et al.,
2006).
Gopal et al. (2006) have declared that in order to alleviate the handling issue of
ENM, electrospinning is performed over a more rigid and stronger support. They also
mentioned that the strengthening of nanofibers can be conducted by post- heat treatment
on the electrospun fibers. They added that nanofibers overlap each other randomly during
the electrospinning process, which leads to an open pore structure that is ideal for
membranes. They explained that the applied heat should be lower than the melting point
(Tm) of constituent material, since otherwise the overlapping fibers would fuse together.
This phenomenon, post- heat treatment, improves the structural strength, crystalline
structure and mechanical strength of nanofibers and improves nanofiber handling (Gopal
et al., 2006).
Once a membrane is created, flux and selectivity are two main factors used to
assess membrane performance. Flux describes the rate of transport of permeants across
the membrane whereas selectivity is determined by surface properties of the membrane
(such as the pore size distribution) that dictates the type of permeant species that can
traverse the membrane.
37
Yoon et al. (2006) have claimed that UF porous membranes that are
conventionally manufactured by the phase inversion, inversion precipitation, method and
consist of torturous porosity result in a low flux rate. They along with other recent studies
(Wang et al., 2012; Khamforoush et al., 2015; Wang et al., 2017, and Dobosz et al.,
2017) showed that nanofiber layers provide higher flux and permeability compared to
conventional UF membranes.
According to Lee et al. (2014), in water treatment, electrospun nanofibrous
membranes are seriously vulnerable to fouling and after some time the fouling
deteriorates the permeability and rejection efficiency. They added that many efforts have
been made to develop fouling-tolerant membranes by using hydrophilic/hydrophobic
interactions or electrostatic repulsions between membrane surface and foulants.
38
Conventional UF membranes can be used as a support for the electrospun layer in
order to enhance the strength of the electrospun layer. Improving the performance of
electrospun membranes was also confirmed by Dobosz et al. (2017). Based on the above
research there is a need to develop and test alternative electrospun membranes for water
treatment. Numerous studies have developed modified membranes mostly using a UF or
NF membrane as a support and coated with an electrospun layer of different material;
these membranes had higher fluxes than existing commercial membranes. Several of
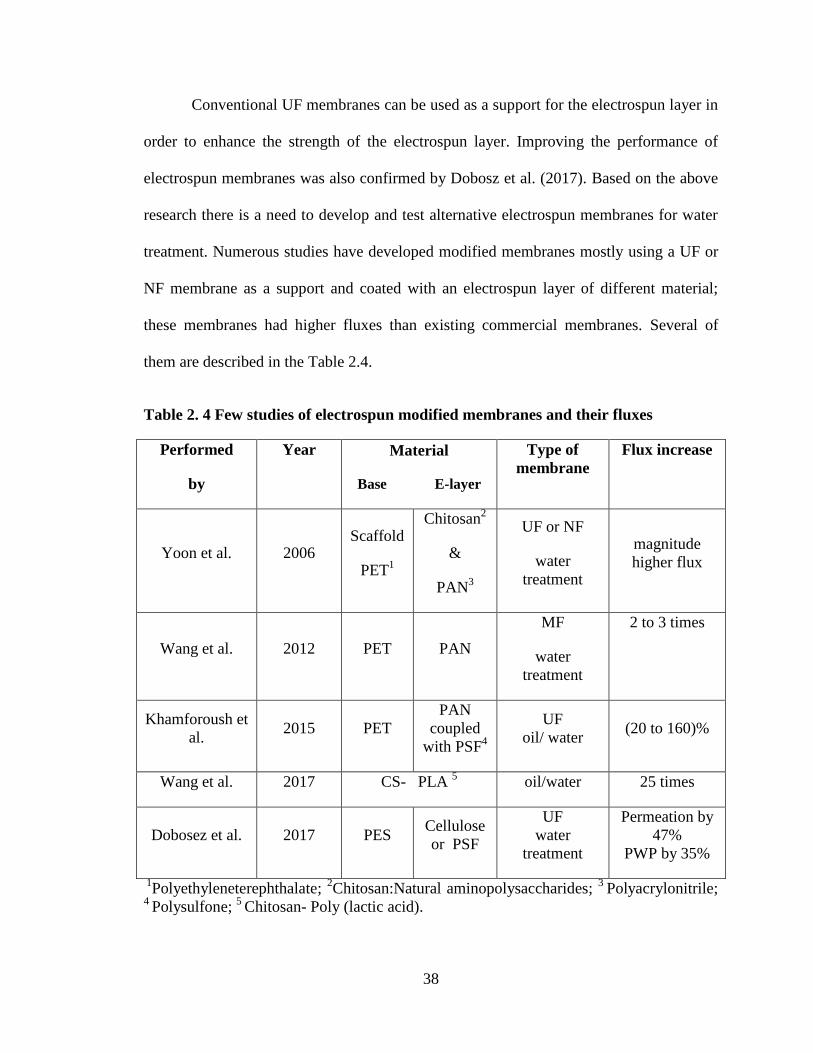
them are described in the Table 2.4.
Table 2. 4 Few studies of electrospun modified membranes and their fluxes
Performed
by
Year Material
Base E-layer
Type of
membrane
Flux increase
Yoon et al. 2006 Scaffold
PET1
Chitosan2
&
PAN3
UF or NF
water
treatment
magnitude
higher flux
Wang et al. 2012 PET
PAN
MF
water
treatment
2 to 3 times
Khamforoush et
al. 2015 PET
PAN
coupled
with PSF4
UF
oil/ water (20 to 160)%
Wang et al. 2017 CS- PLA 5 oil/water 25 times
Dobosez et al. 2017 PES Cellulose
or PSF
UF
water
treatment
Permeation by
47%
PWP by 35%
1Polyethyleneterephthalate;
2Chitosan:Natural aminopolysaccharides;
3 Polyacrylonitrile;
4 Polysulfone;
5 Chitosan- Poly (lactic acid).
39
In the studies shown in Table 2.4 various materials were used for both supports
and electrospun nanofiber layers to fabricate membranes for different processes such as
water and oil filtration. Yoon et al. (2006) used a PET UF/NF membrane substrate with a
medium PAN electrospun nanofibrous scaffold coupled and coated with a thin layer of
hydrophilic, water resistant, and at the same time water permeable material such as
chitosan. Their membrane exhibited an order of magnitude higher flux than the
conventional UF or NF porous membranes in water treatment. Wang et al. (2012) used a
non-woven PET support coated with the electrospun nanofibers of PAN to show that the
flux of the composite MF membrane was 2-3 times higher than the commercial MF
membranes of the same pore size (0.22± 0.01)m. Khamforoush et al.(2015) provided a
TFC membrane by using non-woven PET support with an electrospun PAN nanofibrous
mid layer, and a coating top layer of PSF. The flux of the TFC membrane was 20 to
160% higher than that of the conventional asymmetric PSF membrane. Wang et al.
(2017) reported that 25 times higher flux was achieved when CS-PLA nanofiber mats of
excellent hydrophobicity and oleophilic properties were collected on number 10 stainless
steel mesh wires than collected by number 0 stainless steel wires.
Dobosc et al. (2017) used a commercial PES support on which an electrospun
layer of cellulose / PSF blend nanofibers was placed with no adhesion. Only O-rings of
the membrane filtration cells held the nanofiber and support layer together to form a
composite membrane. The permeation flux in the presence of solute in the feed and pure
water permeation flux (PWP) were increased by 47% and 35%, respectively compared to
the control membrane.
40
The above survey thus shows that little attention has been paid so far to coating of
electrospun nanofibers on top of the commercial membranes. Accordingly, the aim of this
study is to develop a method for modification of commercial and hydrophilic UF
membrane coated with a hydrophobic electrospun nanofibers layer, in order to improve
the membrane permeation flux. In addition, materials, method of preparation of
electrospun modified membrane, and technique of filtration in this study is different from
the ones presented in Table 2.4. Therefore, membranes will be developed by coating a
commercial PES membrane with electrospun PVDF nanofibers, as PVDF is ideal for
drinking water treatment due to its chlorine resistance. Chlorine is sometimes added at
the entrance of a water treatment plant and chlorine solutions are frequently used as a
chemical cleaning agent.
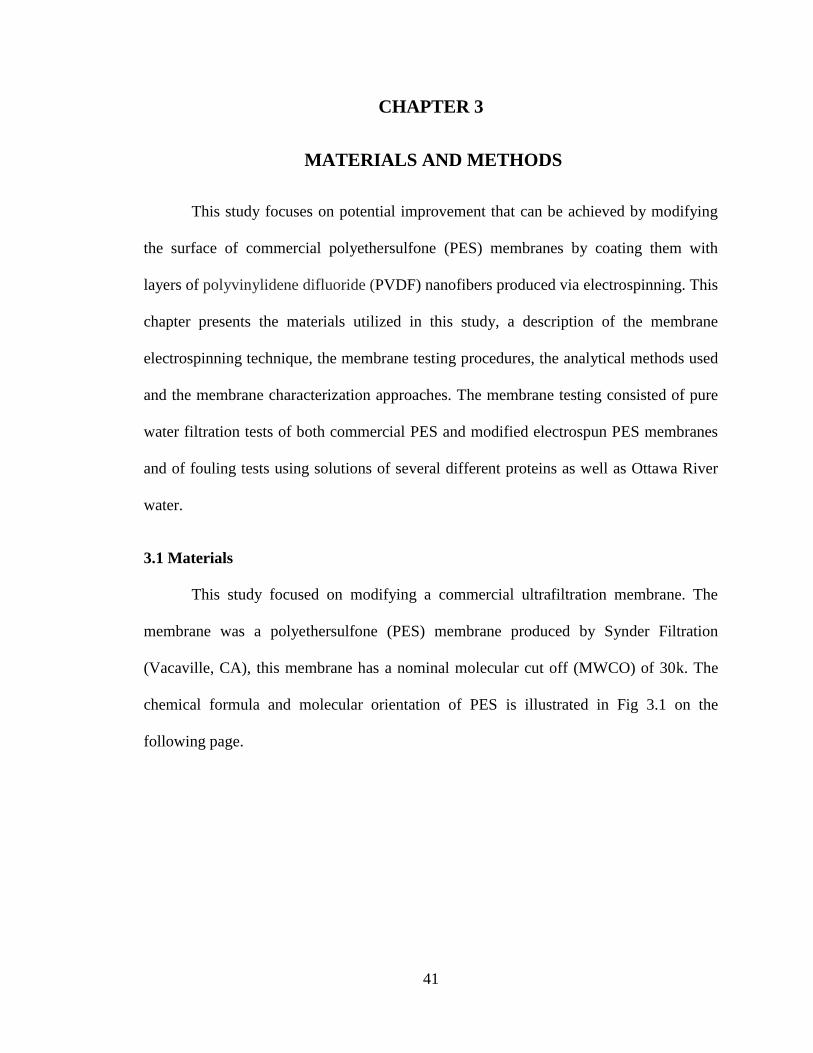
41
CHAPTER 3
MATERIALS AND METHODS
This study focuses on potential improvement that can be achieved by modifying
the surface of commercial polyethersulfone (PES) membranes by coating them with
layers of polyvinylidene difluoride (PVDF) nanofibers produced via electrospinning. This
chapter presents the materials utilized in this study, a description of the membrane
electrospinning technique, the membrane testing procedures, the analytical methods used
and the membrane characterization approaches. The membrane testing consisted of pure
water filtration tests of both commercial PES and modified electrospun PES membranes
and of fouling tests using solutions of several different proteins as well as Ottawa River
water.
3.1 Materials
This study focused on modifying a commercial ultrafiltration membrane. The
membrane was a polyethersulfone (PES) membrane produced by Synder Filtration
(Vacaville, CA), this membrane has a nominal molecular cut off (MWCO) of 30k. The
chemical formula and molecular orientation of PES is illustrated in Fig 3.1 on the
following page.
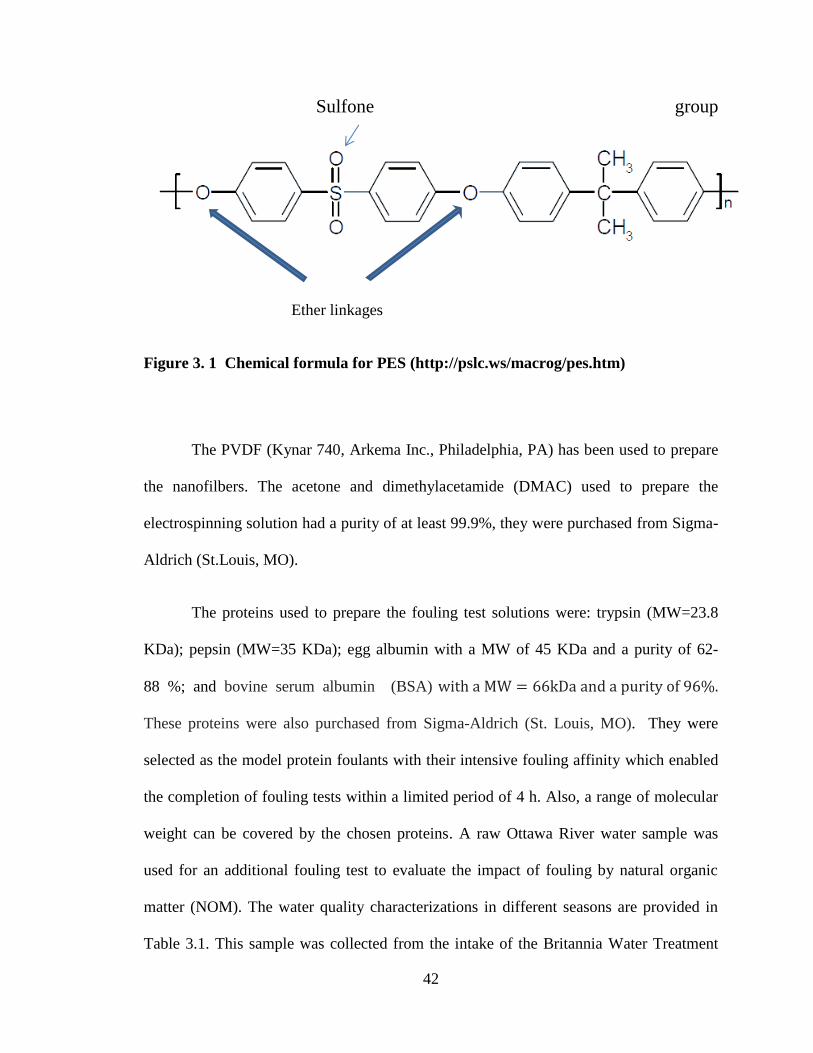
42
Sulfone group
Ether linkages
Figure 3. 1 Chemical formula for PES (http://pslc.ws/macrog/pes.htm)
The PVDF (Kynar 740, Arkema Inc., Philadelphia, PA) has been used to prepare
the nanofilbers. The acetone and dimethylacetamide (DMAC) used to prepare the
electrospinning solution had a purity of at least 99.9%, they were purchased from Sigma-
Aldrich (St.Louis, MO).
The proteins used to prepare the fouling test solutions were: trypsin (MW=23.8
KDa); pepsin (MW=35 KDa); egg albumin with a MW of 45 KDa and a purity of 62-
88 %; and bovine serum albumin (BSA) with a MW = 66kDa and a purity of 96%.
These proteins were also purchased from Sigma-Aldrich (St. Louis, MO). They were
selected as the model protein foulants with their intensive fouling affinity which enabled
the completion of fouling tests within a limited period of 4 h. Also, a range of molecular
weight can be covered by the chosen proteins. A raw Ottawa River water sample was
used for an additional fouling test to evaluate the impact of fouling by natural organic
matter (NOM). The water quality characterizations in different seasons are provided in
Table 3.1. This sample was collected from the intake of the Britannia Water Treatment
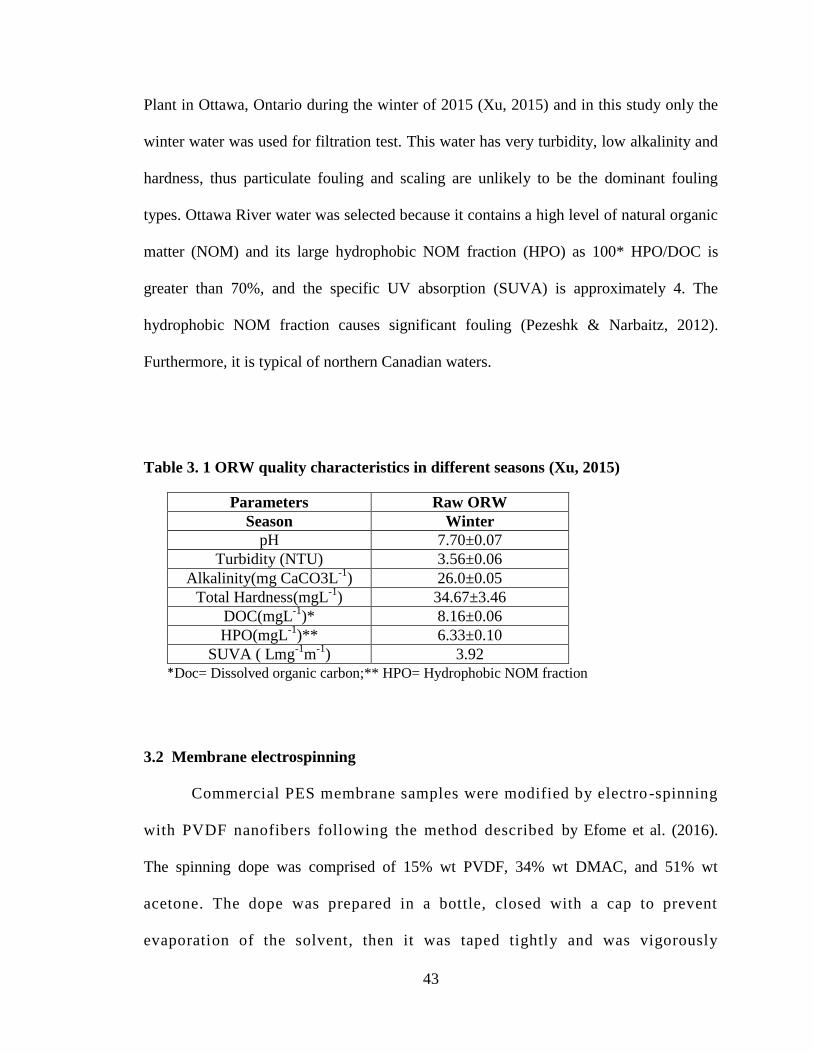
43
Plant in Ottawa, Ontario during the winter of 2015 (Xu, 2015) and in this study only the
winter water was used for filtration test. This water has very turbidity, low alkalinity and
hardness, thus particulate fouling and scaling are unlikely to be the dominant fouling
types. Ottawa River water was selected because it contains a high level of natural organic
matter (NOM) and its large hydrophobic NOM fraction (HPO) as 100* HPO/DOC is
greater than 70%, and the specific UV absorption (SUVA) is approximately 4. The
hydrophobic NOM fraction causes significant fouling (Pezeshk & Narbaitz, 2012).
Furthermore, it is typical of northern Canadian waters.
Table 3. 1 ORW quality characteristics in different seasons (Xu, 2015)
Parameters Raw ORW
Season Winter
pH 7.70±0.07
Turbidity (NTU) 3.56±0.06
Alkalinity(mg CaCO3L-1
) 26.0±0.05
Total Hardness(mgL-1
) 34.67±3.46
DOC(mgL-1
)* 8.16±0.06
HPO(mgL-1
)** 6.33±0.10
SUVA ( Lmg-1
m-1
) 3.92
*Doc= Dissolved organic carbon;** HPO= Hydrophobic NOM fraction
3.2 Membrane electrospinning
Commercial PES membrane samples were modified by electro -spinning
with PVDF nanofibers following the method described by Efome et al. (2016).
The spinning dope was comprised of 15% wt PVDF, 34% wt DMAC, and 51% wt
acetone. The dope was prepared in a bottle, closed with a cap to prevent
evaporation of the solvent, then it was taped tightly and was vigorously
44
stirred (@180 rpm) for 24 h in an orbital shaker at 50°C. This insured that all
the components were well mixed and an uniform solution was produced.
Then, the solution was cooled down and kept at room temperature for another
24 h; this process yielded a homogeneous transparent solution.
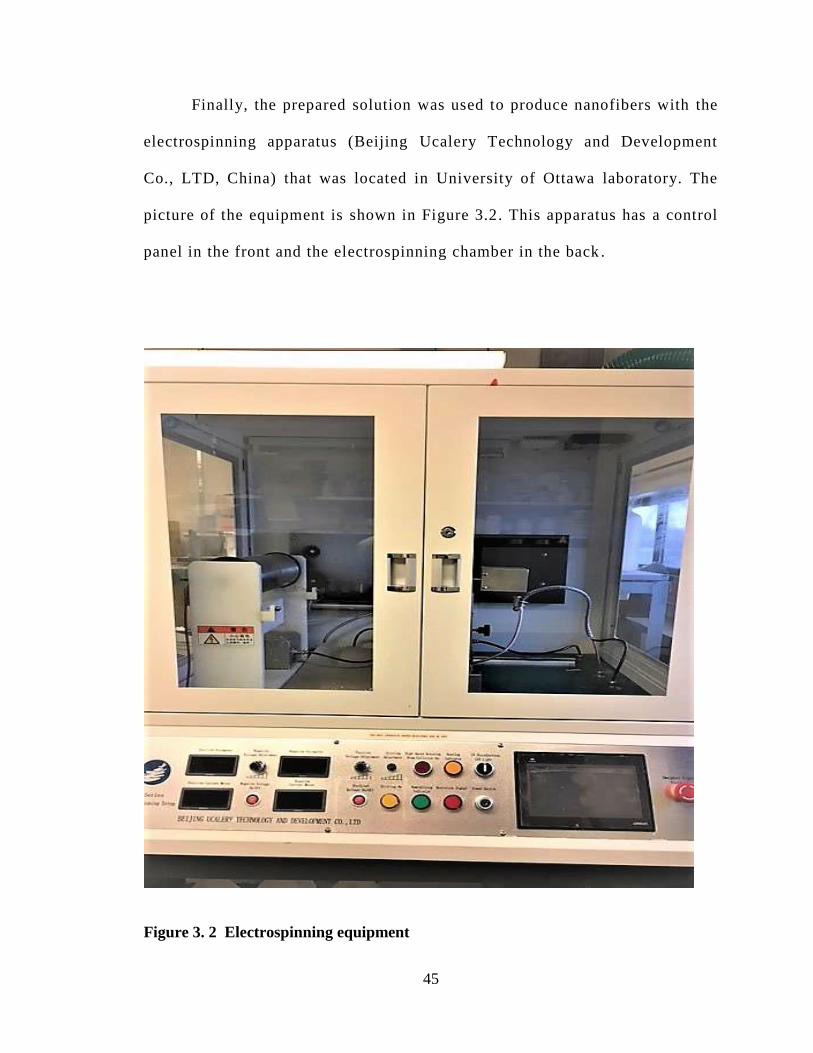
45
Finally, the prepared solution was used to produce nanofibers with the
electrospinning apparatus (Beijing Ucalery Technology and Development
Co., LTD, China) that was located in University of Ottawa laboratory. The
picture of the equipment is shown in Figure 3.2. This apparatus has a control
panel in the front and the electrospinning chamber in the back .
Figure 3. 2 Electrospinning equipment
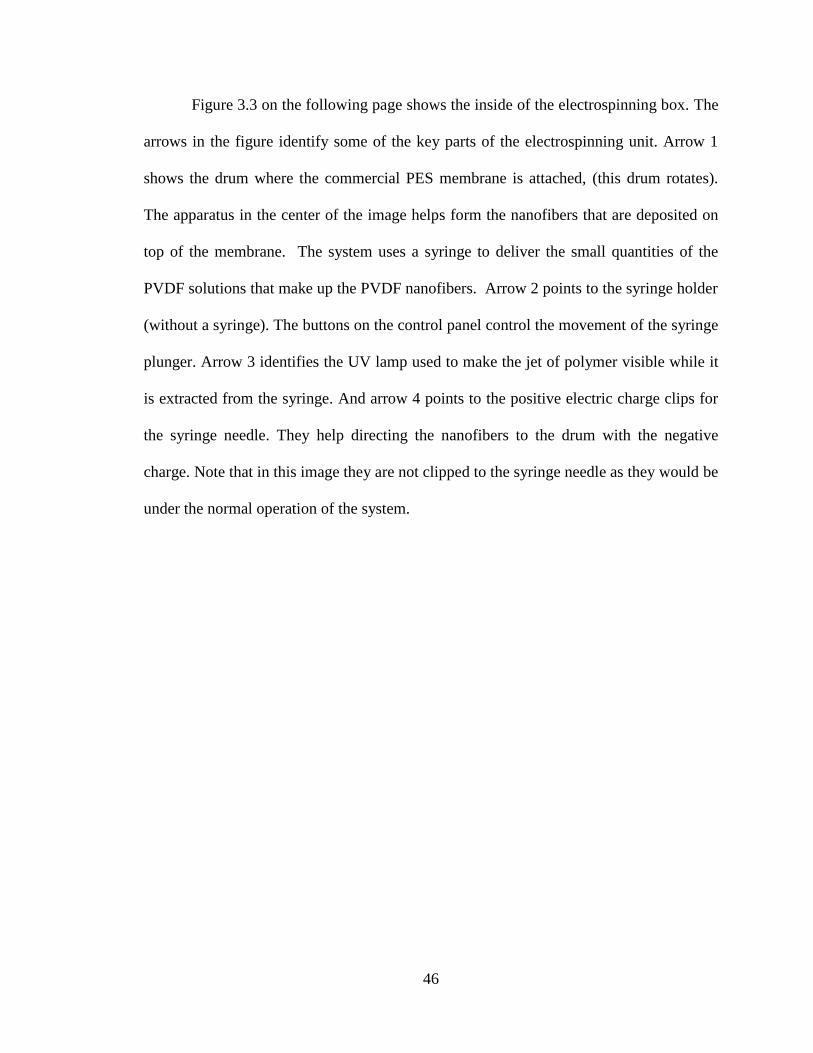
46
Figure 3.3 on the following page shows the inside of the electrospinning box. The
arrows in the figure identify some of the key parts of the electrospinning unit. Arrow 1
shows the drum where the commercial PES membrane is attached, (this drum rotates).
The apparatus in the center of the image helps form the nanofibers that are deposited on
top of the membrane. The system uses a syringe to deliver the small quantities of the
PVDF solutions that make up the PVDF nanofibers. Arrow 2 points to the syringe holder
(without a syringe). The buttons on the control panel control the movement of the syringe
plunger. Arrow 3 identifies the UV lamp used to make the jet of polymer visible while it
is extracted from the syringe. And arrow 4 points to the positive electric charge clips for
the syringe needle. They help directing the nanofibers to the drum with the negative
charge. Note that in this image they are not clipped to the syringe needle as they would be
under the normal operation of the system.
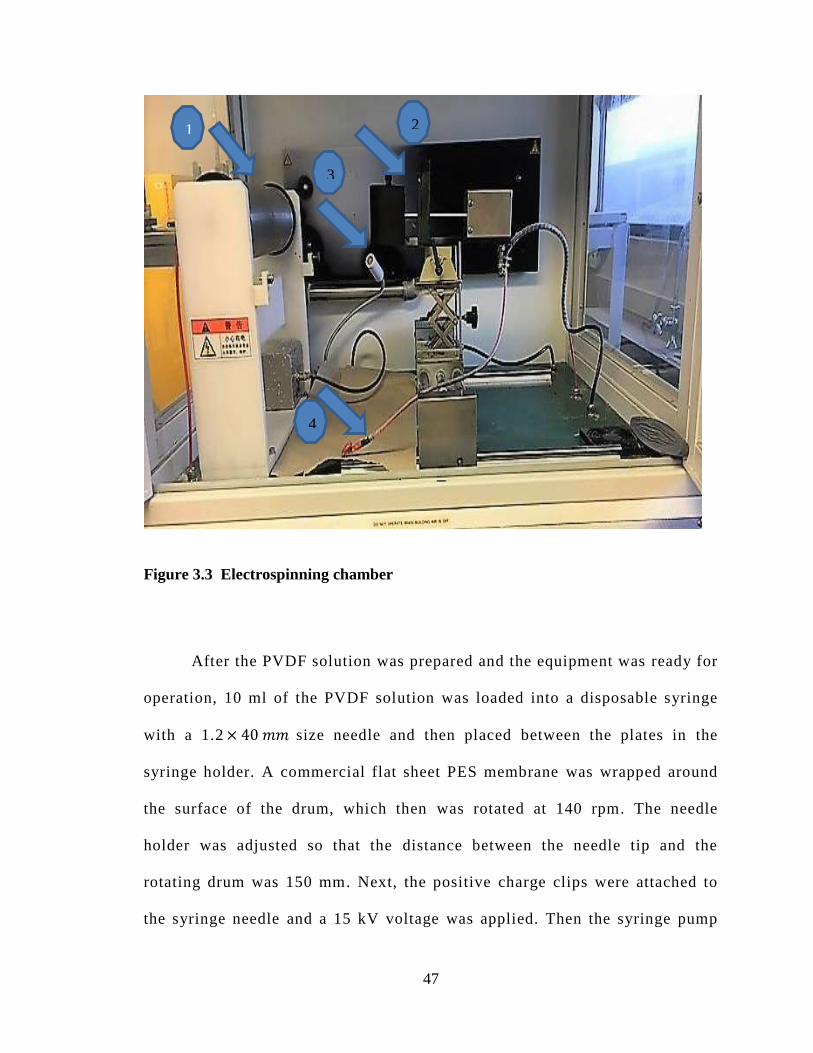
47
Figure 3.3 Electrospinning chamber
After the PVDF solution was prepared and the equipment was ready for
operation, 10 ml of the PVDF solution was loaded into a disposable syringe
with a 1.2 × 40 𝑚𝑚 size needle and then placed between the plates in the
syringe holder. A commercial flat sheet PES membrane was wrapped around
the surface of the drum, which then was rotated at 140 rpm. The needle
holder was adjusted so that the distance between the needle tip and the
rotating drum was 150 mm. Next, the positive charge clips were attached to
the syringe needle and a 15 kV voltage was applied. Then the syringe pump
1
3
2
4
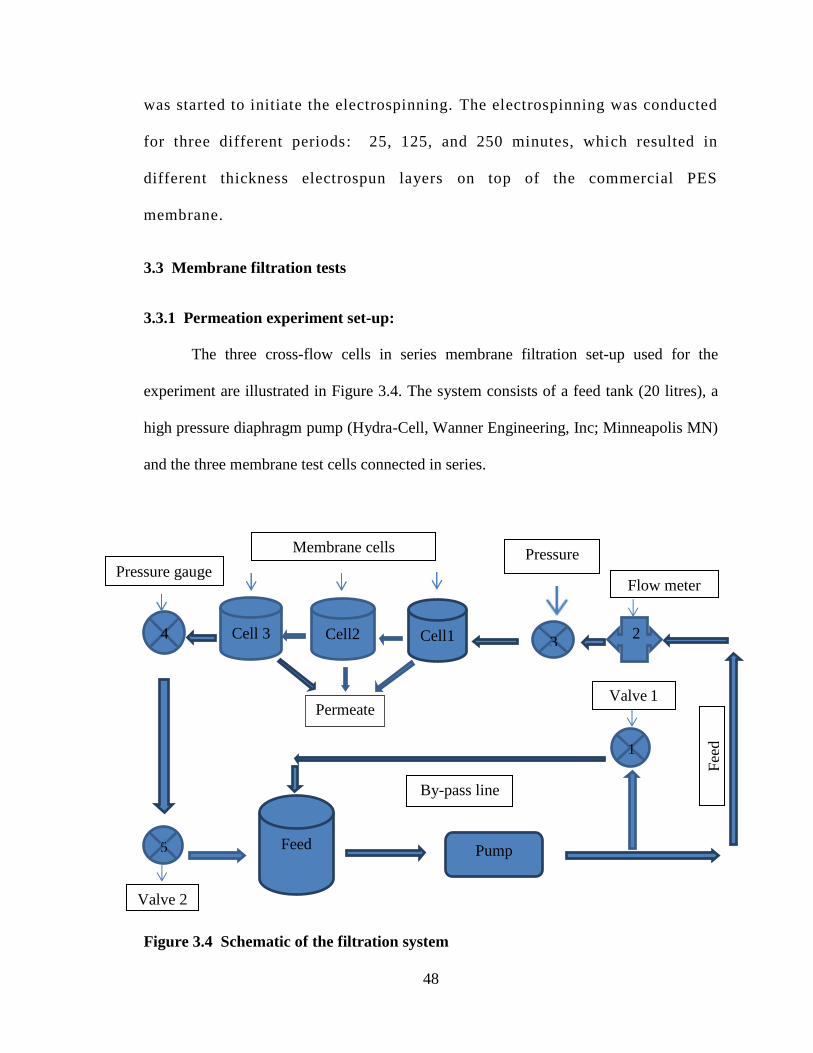
48
was started to initiate the electrospinning. The electrospinning was conducted
for three different periods: 25, 125, and 250 minutes, which resulted in
different thickness electrospun layers on top of the commercial PES
membrane.
3.3 Membrane filtration tests
3.3.1 Permeation experiment set-up:
The three cross-flow cells in series membrane filtration set-up used for the
experiment are illustrated in Figure 3.4. The system consists of a feed tank (20 litres), a
high pressure diaphragm pump (Hydra-Cell, Wanner Engineering, Inc; Minneapolis MN)
and the three membrane test cells connected in series.
Figure 3.4 Schematic of the filtration system
Feed
tank
Pump
3 Cell1 Cell2 Cell 3 4
1
5
Permeate
2
By-pass line
Valve 1
Flow meter
Pressure
gauge
Fee
d
Membrane cells
Pressure gauge
Valve 2
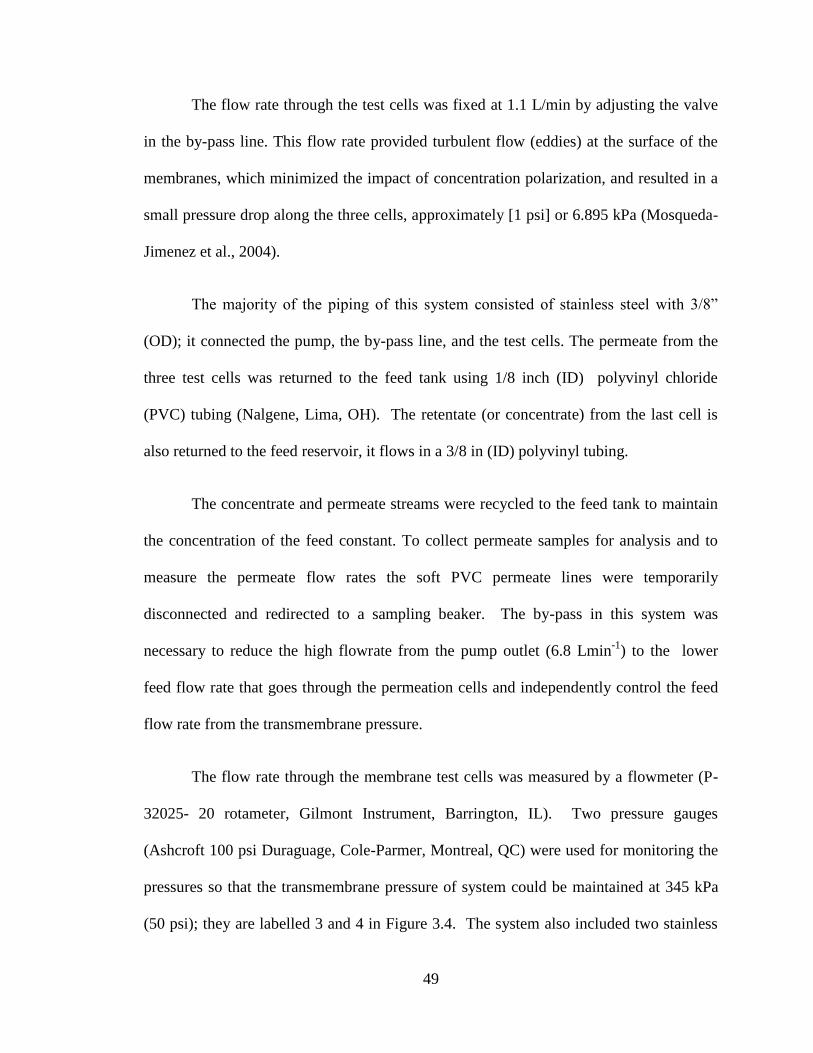
49
The flow rate through the test cells was fixed at 1.1 L/min by adjusting the valve
in the by-pass line. This flow rate provided turbulent flow (eddies) at the surface of the
membranes, which minimized the impact of concentration polarization, and resulted in a
small pressure drop along the three cells, approximately [1 psi] or 6.895 kPa (Mosqueda-
Jimenez et al., 2004).
The majority of the piping of this system consisted of stainless steel with 3/8”
(OD); it connected the pump, the by-pass line, and the test cells. The permeate from the
three test cells was returned to the feed tank using 1/8 inch (ID) polyvinyl chloride
(PVC) tubing (Nalgene, Lima, OH). The retentate (or concentrate) from the last cell is
also returned to the feed reservoir, it flows in a 3/8 in (ID) polyvinyl tubing.
The concentrate and permeate streams were recycled to the feed tank to maintain
the concentration of the feed constant. To collect permeate samples for analysis and to
measure the permeate flow rates the soft PVC permeate lines were temporarily
disconnected and redirected to a sampling beaker. The by-pass in this system was
necessary to reduce the high flowrate from the pump outlet (6.8 Lmin-1
) to the lower
feed flow rate that goes through the permeation cells and independently control the feed
flow rate from the transmembrane pressure.
The flow rate through the membrane test cells was measured by a flowmeter (P-
32025- 20 rotameter, Gilmont Instrument, Barrington, IL). Two pressure gauges
(Ashcroft 100 psi Duraguage, Cole-Parmer, Montreal, QC) were used for monitoring the
pressures so that the transmembrane pressure of system could be maintained at 345 kPa
(50 psi); they are labelled 3 and 4 in Figure 3.4. The system also included two stainless
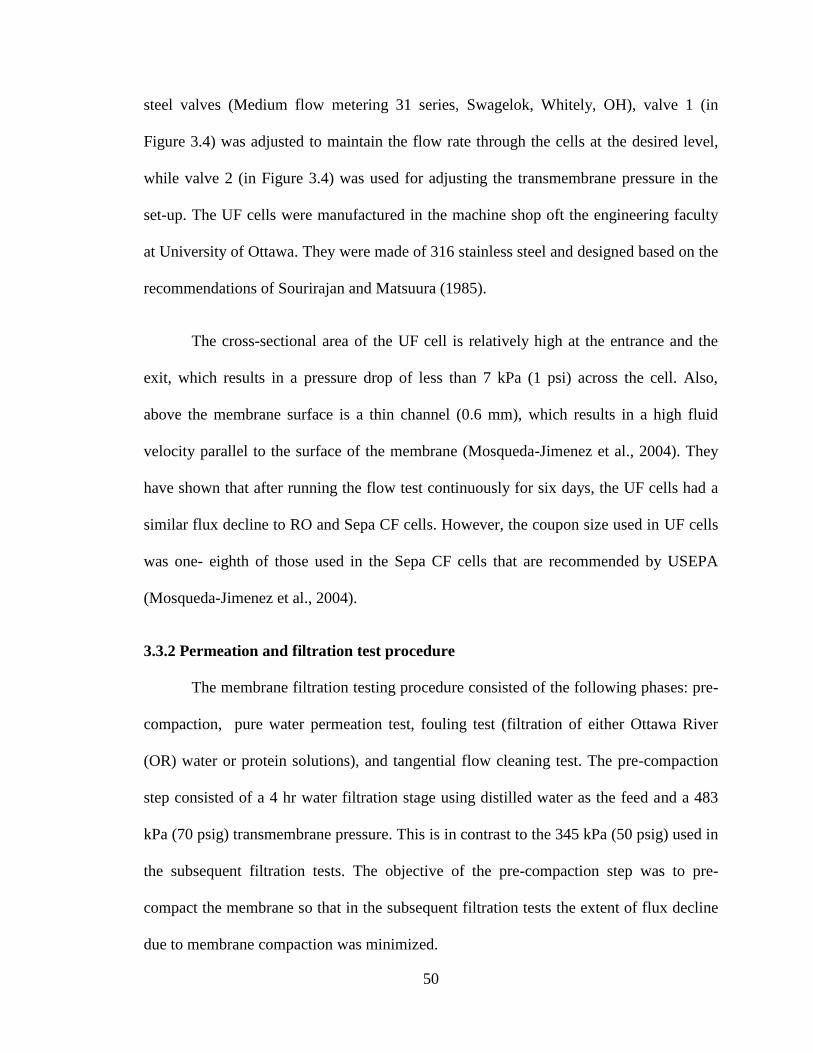
50
steel valves (Medium flow metering 31 series, Swagelok, Whitely, OH), valve 1 (in
Figure 3.4) was adjusted to maintain the flow rate through the cells at the desired level,
while valve 2 (in Figure 3.4) was used for adjusting the transmembrane pressure in the
set-up. The UF cells were manufactured in the machine shop oft the engineering faculty
at University of Ottawa. They were made of 316 stainless steel and designed based on the
recommendations of Sourirajan and Matsuura (1985).
The cross-sectional area of the UF cell is relatively high at the entrance and the
exit, which results in a pressure drop of less than 7 kPa (1 psi) across the cell. Also,
above the membrane surface is a thin channel (0.6 mm), which results in a high fluid
velocity parallel to the surface of the membrane (Mosqueda-Jimenez et al., 2004). They
have shown that after running the flow test continuously for six days, the UF cells had a
similar flux decline to RO and Sepa CF cells. However, the coupon size used in UF cells
was one- eighth of those used in the Sepa CF cells that are recommended by USEPA
(Mosqueda-Jimenez et al., 2004).
3.3.2 Permeation and filtration test procedure
The membrane filtration testing procedure consisted of the following phases: pre-
compaction, pure water permeation test, fouling test (filtration of either Ottawa River
(OR) water or protein solutions), and tangential flow cleaning test. The pre-compaction
step consisted of a 4 hr water filtration stage using distilled water as the feed and a 483
kPa (70 psig) transmembrane pressure. This is in contrast to the 345 kPa (50 psig) used in
the subsequent filtration tests. The objective of the pre-compaction step was to pre-
compact the membrane so that in the subsequent filtration tests the extent of flux decline
due to membrane compaction was minimized.
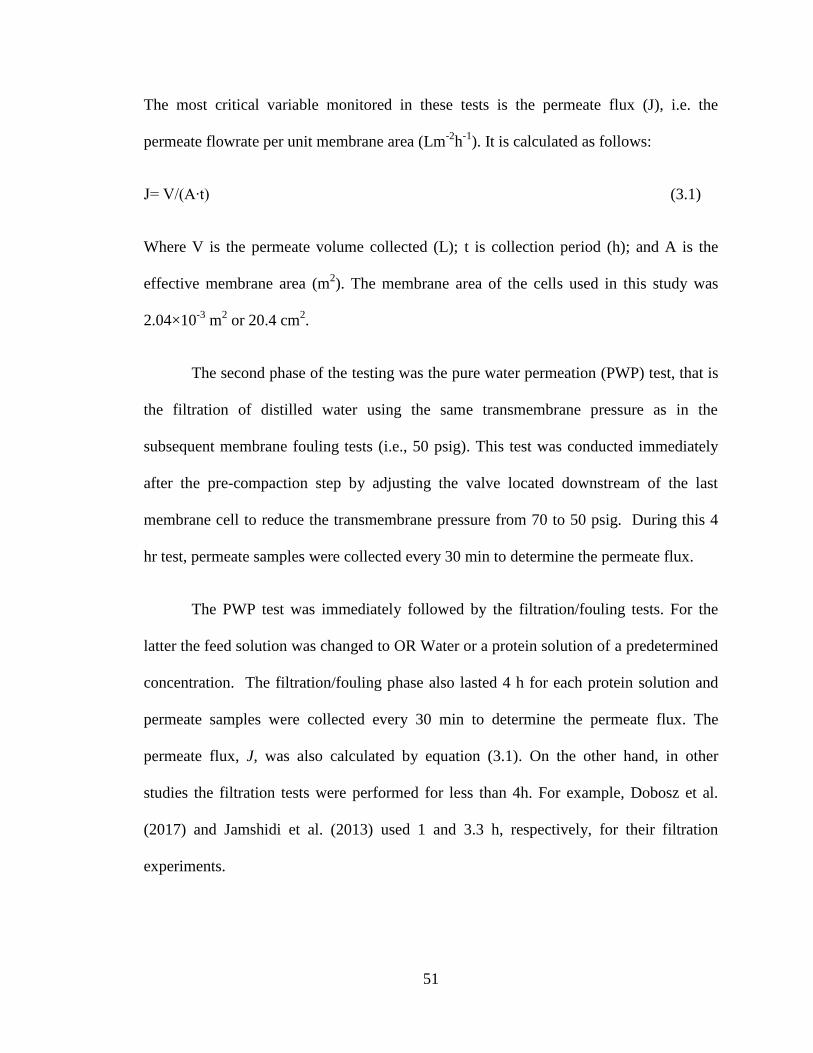
51
The most critical variable monitored in these tests is the permeate flux (J), i.e. the
permeate flowrate per unit membrane area (Lm-2
h-1
). It is calculated as follows:
J= V/(A∙t) (3.1)
Where V is the permeate volume collected (L); t is collection period (h); and A is the
effective membrane area (m2). The membrane area of the cells used in this study was
2.04×10⁻³
m2 or 20.4 cm
2.
The second phase of the testing was the pure water permeation (PWP) test, that is
the filtration of distilled water using the same transmembrane pressure as in the
subsequent membrane fouling tests (i.e., 50 psig). This test was conducted immediately
after the pre-compaction step by adjusting the valve located downstream of the last
membrane cell to reduce the transmembrane pressure from 70 to 50 psig. During this 4
hr test, permeate samples were collected every 30 min to determine the permeate flux.
The PWP test was immediately followed by the filtration/fouling tests. For the
latter the feed solution was changed to OR Water or a protein solution of a predetermined
concentration. The filtration/fouling phase also lasted 4 h for each protein solution and
permeate samples were collected every 30 min to determine the permeate flux. The
permeate flux, J, was also calculated by equation (3.1). On the other hand, in other
studies the filtration tests were performed for less than 4h. For example, Dobosz et al.
(2017) and Jamshidi et al. (2013) used 1 and 3.3 h, respectively, for their filtration
experiments.
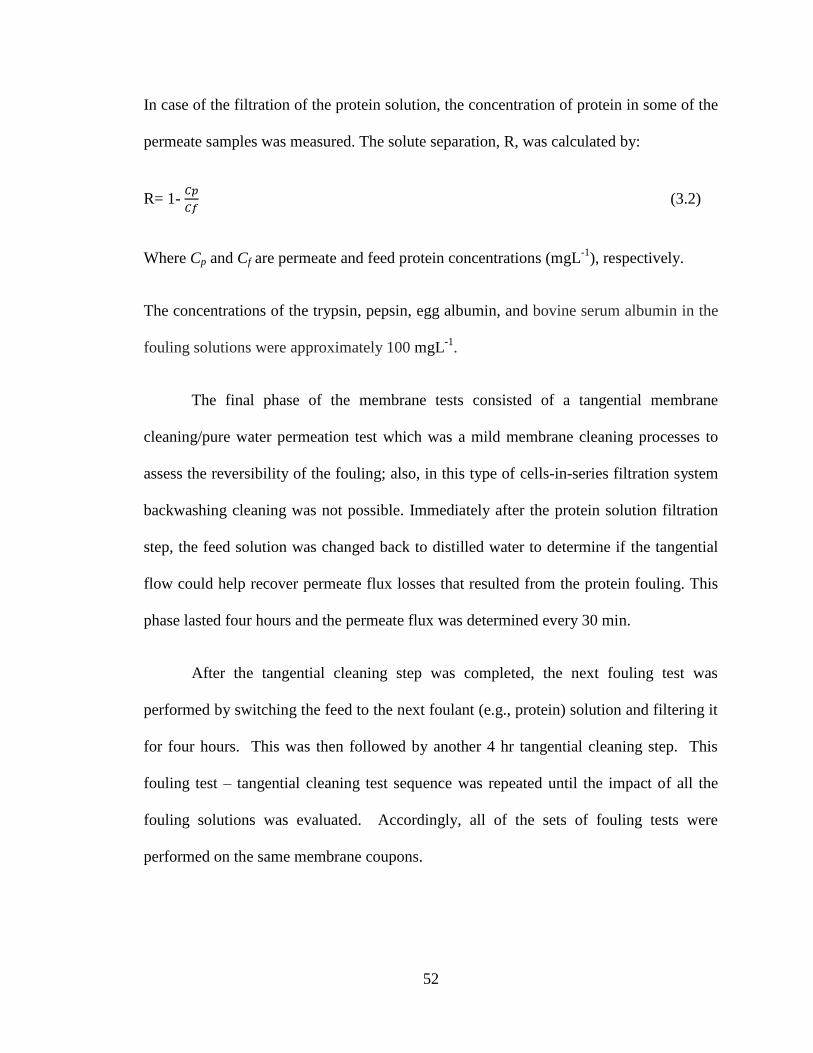
52
In case of the filtration of the protein solution, the concentration of protein in some of the
permeate samples was measured. The solute separation, R, was calculated by:
R= 1- 𝐶𝑝
𝐶𝑓 (3.2)
Where Cp and Cf are permeate and feed protein concentrations (mgL-1
), respectively.
The concentrations of the trypsin, pepsin, egg albumin, and bovine serum albumin in the
fouling solutions were approximately 100 mgL-1
.
The final phase of the membrane tests consisted of a tangential membrane
cleaning/pure water permeation test which was a mild membrane cleaning processes to
assess the reversibility of the fouling; also, in this type of cells-in-series filtration system
backwashing cleaning was not possible. Immediately after the protein solution filtration
step, the feed solution was changed back to distilled water to determine if the tangential
flow could help recover permeate flux losses that resulted from the protein fouling. This
phase lasted four hours and the permeate flux was determined every 30 min.
After the tangential cleaning step was completed, the next fouling test was
performed by switching the feed to the next foulant (e.g., protein) solution and filtering it
for four hours. This was then followed by another 4 hr tangential cleaning step. This
fouling test – tangential cleaning test sequence was repeated until the impact of all the
fouling solutions was evaluated. Accordingly, all of the sets of fouling tests were
performed on the same membrane coupons.
53
It should be noted that numerous membrane coupons were prepared by
electrospinning and then tested. They were grouped in a number of “series” and in each
series a sequence of experiment, including PWP and filtration/fouling tests, cleaning tests
were performed. Prior to testing a new series of coupons, the membrane filtration system
was cleaned by using chlorine solution (100-200 mgL-1
). The detergent was circulating in
the system for 30 minutes while the output tubing was put in the drain instead of the feed
tank. This reduces the risk of detergent staying in the system. Then, cleaning was
followed by circulating distilled water for three hours and the distilled water discarded. A
different sample was then introduced in the system for the subsequent membrane testing.
It should be noted that there are considerable variations in the flux data from
membrane sheet to membrane sheet and from coupon to coupon, taken from the same
sheet, even though the membrane was purchased from a membrane manufacturer.
Normally, the variation from coupon to coupon (from the same sheet) is less than the
variation from sheet to sheet. While, in each series of the experiments shown in Table 3.2,
the membrane sheets were taken from the same roll of commercial PES membrane. Each
control PES sheet was used for the cell coupons and the adjacent sheets were used for
different period of electrospinning and then coupons were cut from these electrospun PES
membranes to investigate the effect of electrospinning. Thus, the flux variation due to the
change in the membrane sheets was greater than variation of coupons.
For instance: in the series 1 experiments the control PES membrane coupon and the
coupon on which 250 min of electrospinning was applied (EPES-250) were from the
adjacent sheet. When those coupons were tested for ORW fouling, the effect of
electrospinning on the flux did not contain the variation due to the difference of the sheet.
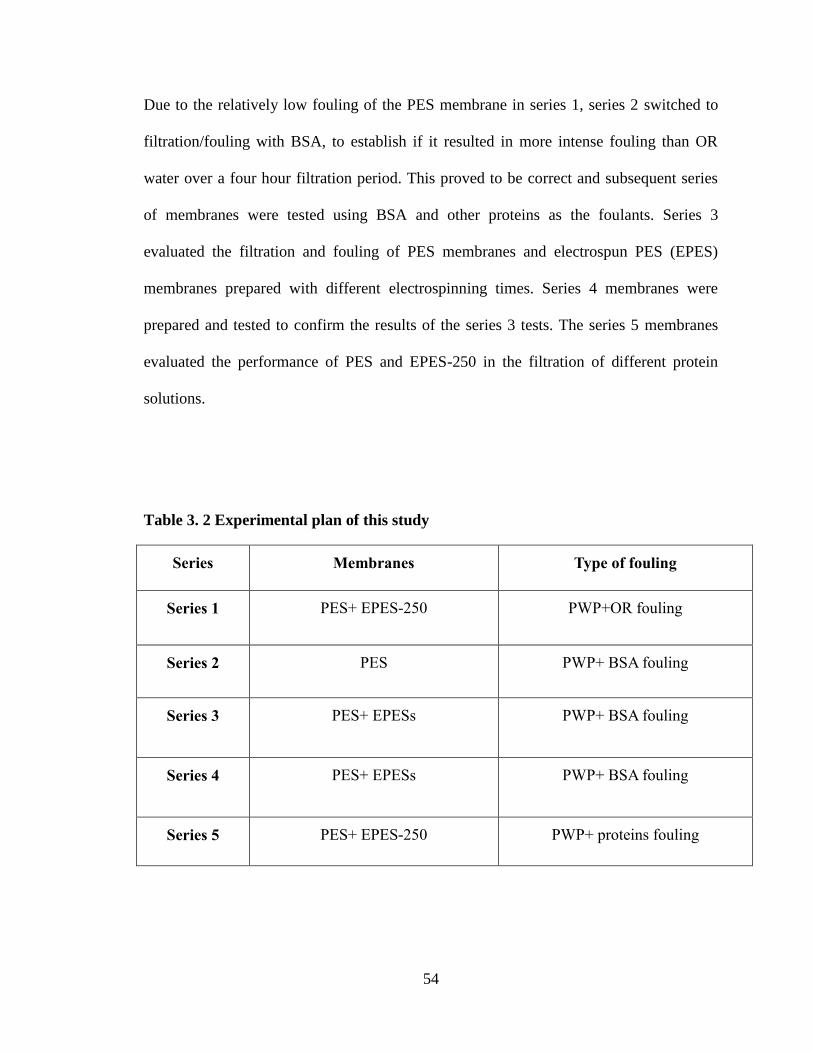
54
Due to the relatively low fouling of the PES membrane in series 1, series 2 switched to
filtration/fouling with BSA, to establish if it resulted in more intense fouling than OR
water over a four hour filtration period. This proved to be correct and subsequent series
of membranes were tested using BSA and other proteins as the foulants. Series 3
evaluated the filtration and fouling of PES membranes and electrospun PES (EPES)
membranes prepared with different electrospinning times. Series 4 membranes were
prepared and tested to confirm the results of the series 3 tests. The series 5 membranes
evaluated the performance of PES and EPES-250 in the filtration of different protein
solutions.
Table 3. 2 Experimental plan of this study
Series Membranes Type of fouling
Series 1 PES+ EPES-250 PWP+OR fouling
Series 2 PES PWP+ BSA fouling
Series 3 PES+ EPESs PWP+ BSA fouling
Series 4 PES+ EPESs PWP+ BSA fouling
Series 5 PES+ EPES-250 PWP+ proteins fouling
55
3.4 Analytical Methods
3.4.1 Spectrophotometric Analysis
The concentrations of trypsin, pepsin, egg albumin, and BSA in the fouling
solutions were measured using a UV spectrophotometer (DR 6000, Hach Instruments,
Loveland, CO). The measurements were conducted at a wave length of 220 nm because
they had the better absorbance at this wavelength. The solution was added to a crystal
cuvette (1 cm cell path) and the absorbance (Abs) was measured. According to Lambert
Beer’s law, Abs is proportional to the concentration of the solute, i.e.,
Abs = ϵ·b·c (3.3)
Where Abs is absorbance (unitless); ϵ is molar absorptivity (L mol-1cm-1); b is the path
length of the sample (cm); and c is the concentration of the compound in solution
(mol L-1). Also, absorbance can be calculated with intensity of beam light using the
following equation:
Abs= log10(𝐼0
𝐼) (3.4)
Where, I0 and I are transmitted intensity of reference blank (distilled water) and the
sample, respectively.
The spectrophotometer was calibrated with distilled water and six standards.
Distilled water was used to set the absorbance at zero. A 500 mgL-1
stock solution was
first prepared for each protein and then diluted to obtain a number of standards with
different concentrations.
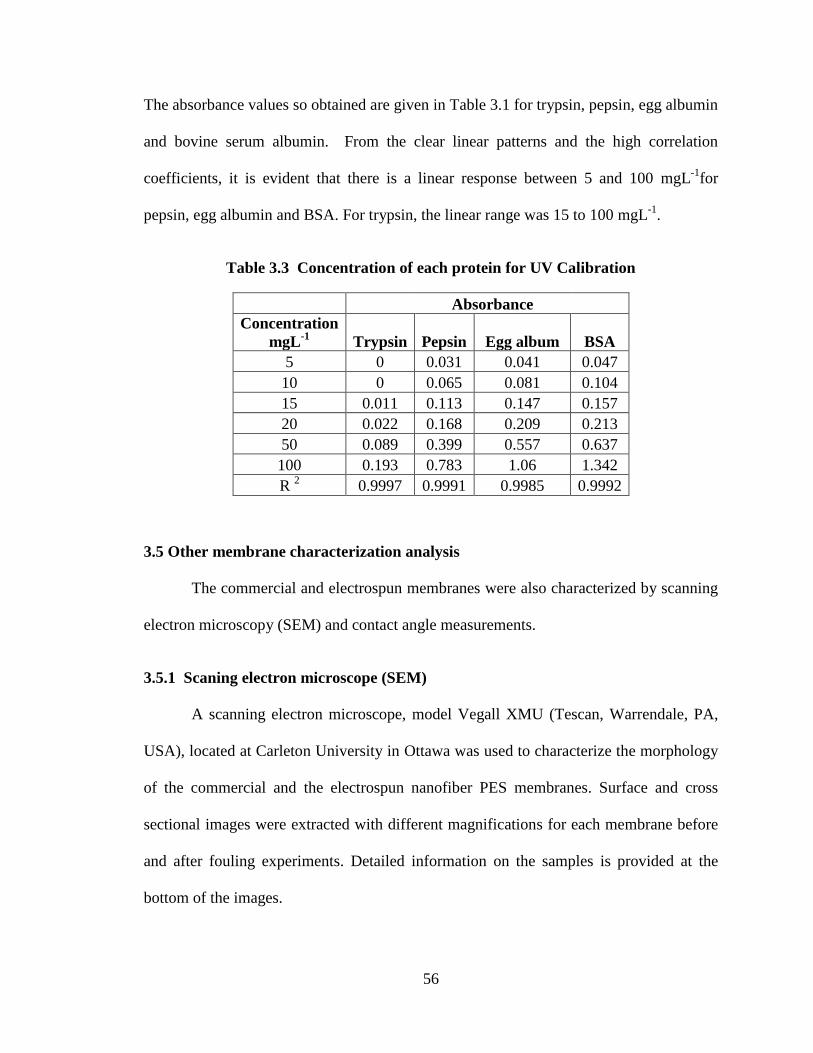
56
The absorbance values so obtained are given in Table 3.1 for trypsin, pepsin, egg albumin
and bovine serum albumin. From the clear linear patterns and the high correlation
coefficients, it is evident that there is a linear response between 5 and 100 mgL-1
for
pepsin, egg albumin and BSA. For trypsin, the linear range was 15 to 100 mgL-1
.
Table 3.3 Concentration of each protein for UV Calibration
Absorbance
Concentration
mgL-1
Trypsin Pepsin Egg album BSA
5 0 0.031 0.041 0.047
10 0 0.065 0.081 0.104
15 0.011 0.113 0.147 0.157
20 0.022 0.168 0.209 0.213
50 0.089 0.399 0.557 0.637
100 0.193 0.783 1.06 1.342
R 2 0.9997 0.9991 0.9985 0.9992
3.5 Other membrane characterization analysis
The commercial and electrospun membranes were also characterized by scanning
electron microscopy (SEM) and contact angle measurements.
3.5.1 Scaning electron microscope (SEM)
A scanning electron microscope, model Vegall XMU (Tescan, Warrendale, PA,
USA), located at Carleton University in Ottawa was used to characterize the morphology
of the commercial and the electrospun nanofiber PES membranes. Surface and cross
sectional images were extracted with different magnifications for each membrane before
and after fouling experiments. Detailed information on the samples is provided at the
bottom of the images.
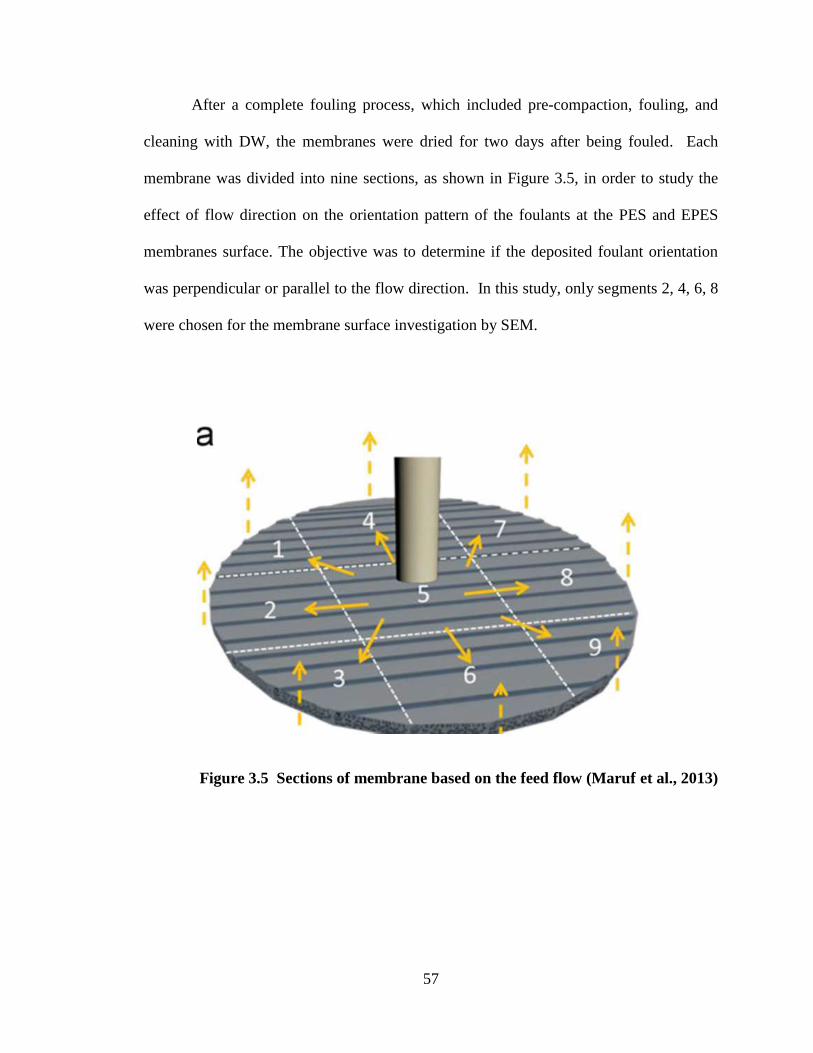
57
After a complete fouling process, which included pre-compaction, fouling, and
cleaning with DW, the membranes were dried for two days after being fouled. Each
membrane was divided into nine sections, as shown in Figure 3.5, in order to study the
effect of flow direction on the orientation pattern of the foulants at the PES and EPES
membranes surface. The objective was to determine if the deposited foulant orientation
was perpendicular or parallel to the flow direction. In this study, only segments 2, 4, 6, 8
were chosen for the membrane surface investigation by SEM.
Figure 3.5 Sections of membrane based on the feed flow (Maruf et al., 2013)
58
Due to the texture of the non-fouled electrospun membrane coupons (that are very
soft and had a spider web-like surface), they could be easily damaged; accordingly they
were immersed into liquid nitrogen to make them more rigid. Then, it was possible to
obtain membrane samples by cutting the frozen coupons with a very small and sharp
scissors. The samples were then placed and glued on the SEM holders with the copper
foils. In order to increase electron conductivity the samples were coated with gold to a
thickness of 10 nm, in a coater (Quorum Q 150T, Britain). The surface and cross section
of each membrane sample were studied.
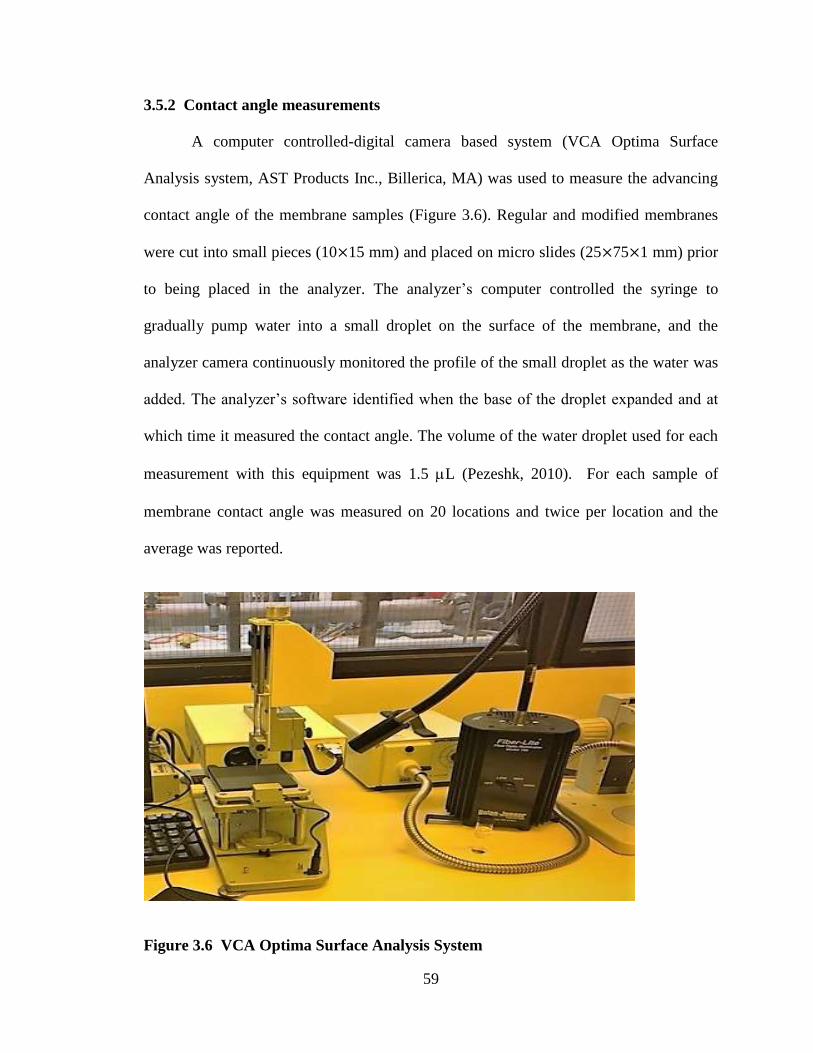
59
3.5.2 Contact angle measurements
A computer controlled-digital camera based system (VCA Optima Surface
Analysis system, AST Products Inc., Billerica, MA) was used to measure the advancing
contact angle of the membrane samples (Figure 3.6). Regular and modified membranes
were cut into small pieces (10×15 mm) and placed on micro slides (25×75×1 mm) prior
to being placed in the analyzer. The analyzer’s computer controlled the syringe to
gradually pump water into a small droplet on the surface of the membrane, and the
analyzer camera continuously monitored the profile of the small droplet as the water was
added. The analyzer’s software identified when the base of the droplet expanded and at
which time it measured the contact angle. The volume of the water droplet used for each
measurement with this equipment was 1.5 L (Pezeshk, 2010). For each sample of
membrane contact angle was measured on 20 locations and twice per location and the
average was reported.
Figure 3.6 VCA Optima Surface Analysis System
60
CHAPTER 4
RESULTS AND DISCUSSION
As discussed earlier, several sets of electrospun nanofiber coated polyethersulfone
(EPES) membrane coupons were prepared and tested, along with the commercial
polyethersulfone membrane coupons (hereafter denoted as PES), each of these sets is
referred to as a series. The EPES membranes in these series were produced with different
electrospun layer thicknesses and several coupons from the same fabrication series were
tested. It should be noted that all coupons were sequentially subjected to 4 h pure water
permeation (PWP) test, 4 h fouling tests and followed by 4 h tangential cleaning/ post
filtration tests using distilled water. Series 1 tested PES and EPES-250 membranes using
Ottawa River water as the foulant solution, series 2 evaluated just the PES membrane
with BSA solution as the foulant, and series 3 and 4 tested PES and several thickness
EPES membranes using solution of BSA. Also, research was followed with two sets of
experiment using solutions of four different proteins for EPES-250 and PES membranes
and each fouling stage was followed with the aforementioned 4 h tangential cleaning/
post filtration tests using distilled water, series1 to 4 are provided on further pages in
Table 4.1.
This chapter first describes the results of the PWP tests as they were the first stage
of each series of filtration tests. Then, the discussion will be followed by the presentation
and explanation of the results of each series, including the PWP and filtration results for
comparative purposes. Finally, the results of the membrane characterization will be
presented.
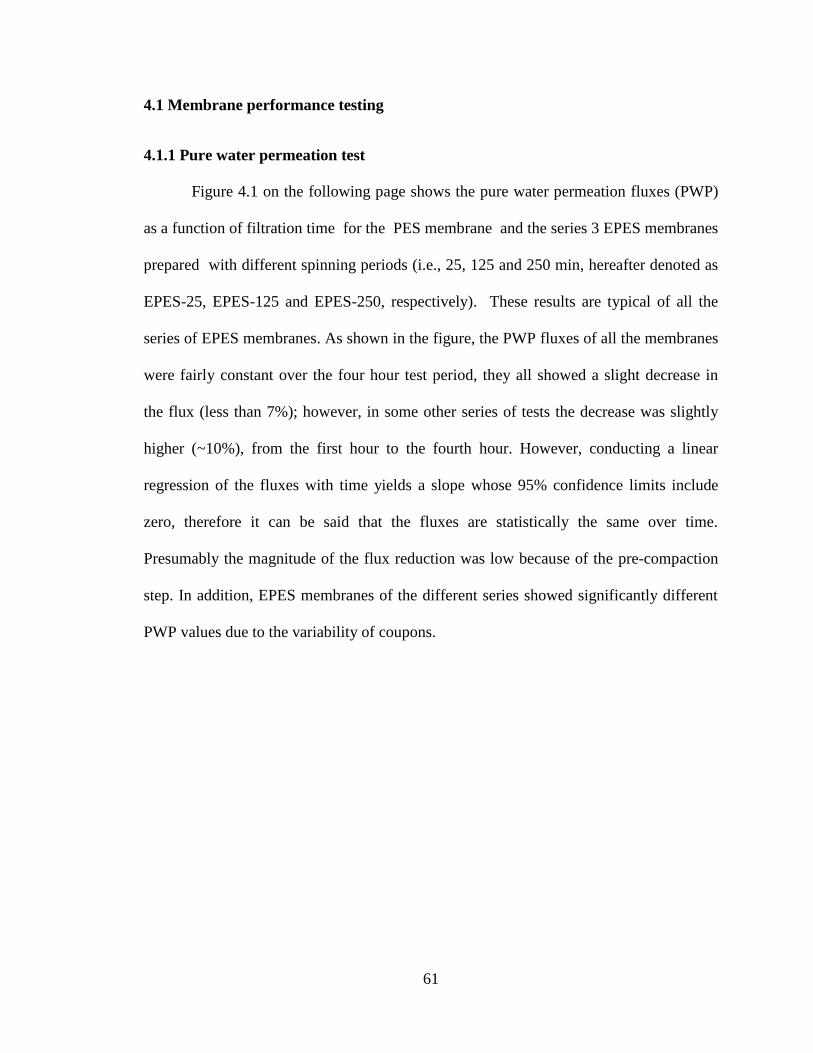
61
4.1 Membrane performance testing
4.1.1 Pure water permeation test
Figure 4.1 on the following page shows the pure water permeation fluxes (PWP)
as a function of filtration time for the PES membrane and the series 3 EPES membranes
prepared with different spinning periods (i.e., 25, 125 and 250 min, hereafter denoted as
EPES-25, EPES-125 and EPES-250, respectively). These results are typical of all the
series of EPES membranes. As shown in the figure, the PWP fluxes of all the membranes
were fairly constant over the four hour test period, they all showed a slight decrease in
the flux (less than 7%); however, in some other series of tests the decrease was slightly
higher (~10%), from the first hour to the fourth hour. However, conducting a linear
regression of the fluxes with time yields a slope whose 95% confidence limits include
zero, therefore it can be said that the fluxes are statistically the same over time.
Presumably the magnitude of the flux reduction was low because of the pre-compaction
step. In addition, EPES membranes of the different series showed significantly different
PWP values due to the variability of coupons.
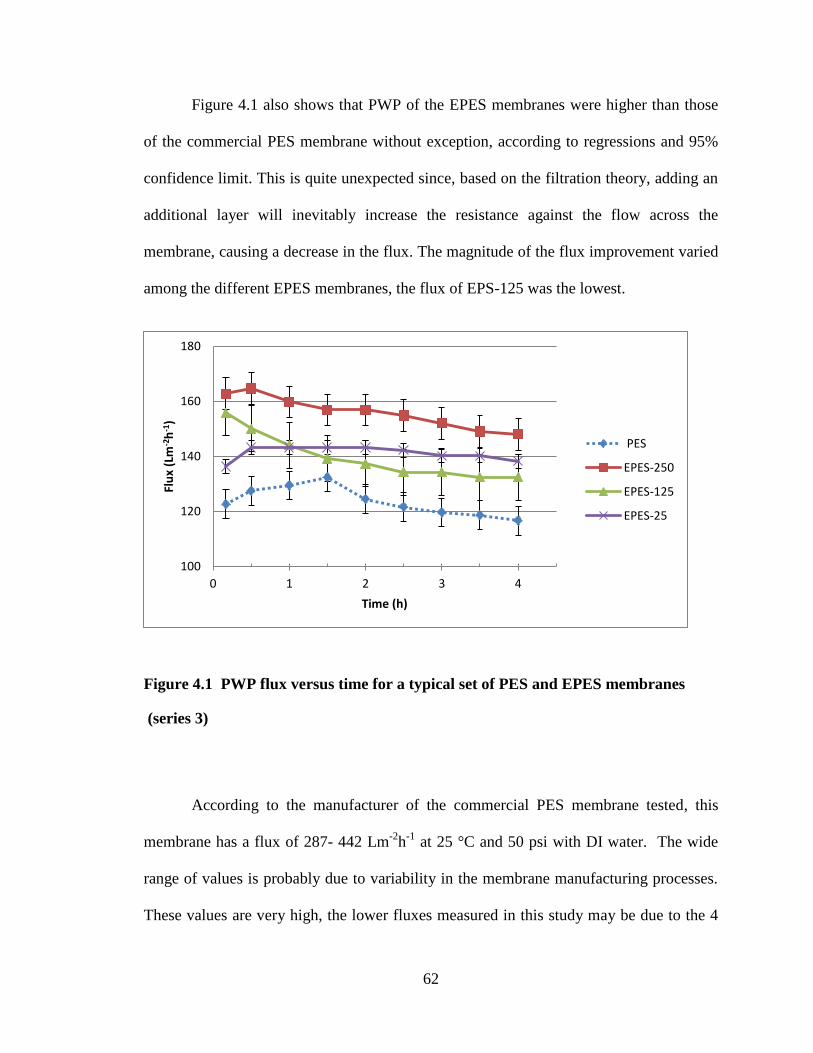
62
Figure 4.1 also shows that PWP of the EPES membranes were higher than those
of the commercial PES membrane without exception, according to regressions and 95%
confidence limit. This is quite unexpected since, based on the filtration theory, adding an
additional layer will inevitably increase the resistance against the flow across the
membrane, causing a decrease in the flux. The magnitude of the flux improvement varied
among the different EPES membranes, the flux of EPS-125 was the lowest.
Figure 4.1 PWP flux versus time for a typical set of PES and EPES membranes
(series 3)
According to the manufacturer of the commercial PES membrane tested, this
membrane has a flux of 287- 442 Lm-2
h-1
at 25 °C and 50 psi with DI water. The wide
range of values is probably due to variability in the membrane manufacturing processes.
These values are very high, the lower fluxes measured in this study may be due to the 4
100
120
140
160
180
0 1 2 3 4
Flu
x (L
m-2
h-1
)
Time (h)
PES
EPES-250
EPES-125
EPES-25
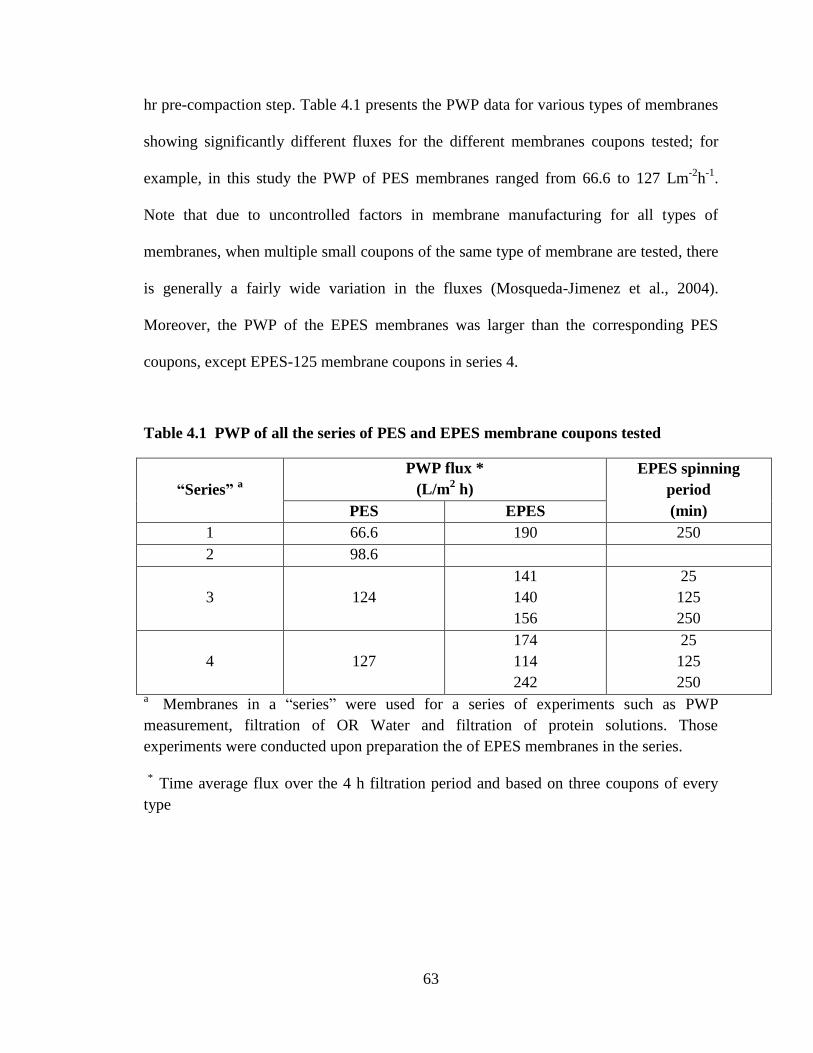
63
hr pre-compaction step. Table 4.1 presents the PWP data for various types of membranes
showing significantly different fluxes for the different membranes coupons tested; for
example, in this study the PWP of PES membranes ranged from 66.6 to 127 Lm-2
h-1
.
Note that due to uncontrolled factors in membrane manufacturing for all types of
membranes, when multiple small coupons of the same type of membrane are tested, there
is generally a fairly wide variation in the fluxes (Mosqueda-Jimenez et al., 2004).
Moreover, the PWP of the EPES membranes was larger than the corresponding PES
coupons, except EPES-125 membrane coupons in series 4.
Table 4.1 PWP of all the series of PES and EPES membrane coupons tested
“Series” a
PWP flux *
(L/m2 h)
EPES spinning
period
(min) PES EPES
1 66.6 190 250
2 98.6
3 124
141
140
156
25
125
250
4 127
174
114
242
25
125
250 a
Membranes in a “series” were used for a series of experiments such as PWP
measurement, filtration of OR Water and filtration of protein solutions. Those
experiments were conducted upon preparation the of EPES membranes in the series.
*
Time average flux over the 4 h filtration period and based on three coupons of every
type
64
Table 4.1 shows the significant differences in PWP values between the various
series, in order to statistically prove that the EPES membranes indeed had the higher
PWP fluxes than the PES membranes a t-test was carried out to confirm that the PWP of
the EPES membranes were indeed higher than PES. For this purpose, the data were
grouped into variable 1, which includes all the PES data, and variable 2, which includes
all the EPES data. First, a t-test was performed assuming equal variances with the null
hypothesis that these two groups of data (variables 1 and 2) are from the same sample
body. The reason for the assumption of equal variances is that all data were collected
with the same PWP experimental protocol. Microsoft Excel® was used to facilitate the
statistical data analysis. As shown in Table 4.2, with the degree of freedom 9 (= 11 data
points – 2 groups), the t Stat was calculated as -2.59464, which was less than the negative
t Critical for one-tail (-1.833113) and the absolute t Stat, 2.59464 is bigger than two-tails
(2.262157). Therefore, the null hypothesis was rejected with 95% confidence based on
both one- and two-tails. This confirms that the PWP data for EPES came from a different
sample body (with larger flux value) than those of PES.
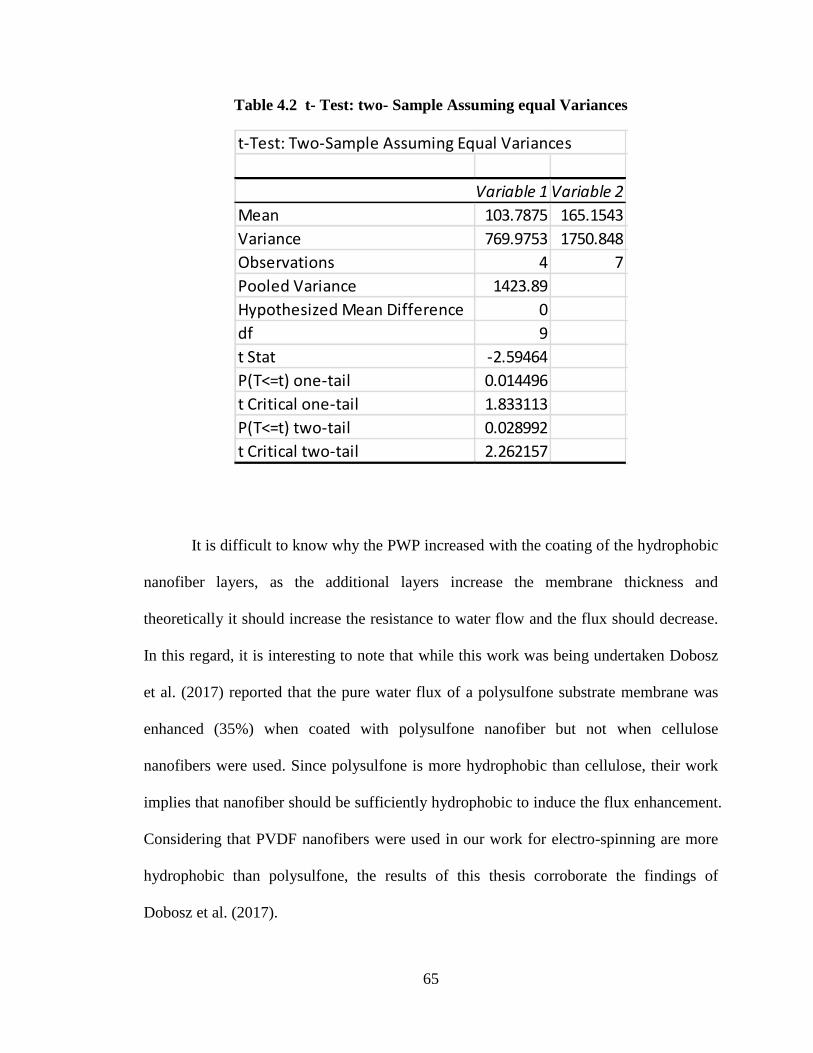
65
Table 4.2 t- Test: two- Sample Assuming equal Variances
It is difficult to know why the PWP increased with the coating of the hydrophobic
nanofiber layers, as the additional layers increase the membrane thickness and
theoretically it should increase the resistance to water flow and the flux should decrease.
In this regard, it is interesting to note that while this work was being undertaken Dobosz
et al. (2017) reported that the pure water flux of a polysulfone substrate membrane was
enhanced (35%) when coated with polysulfone nanofiber but not when cellulose
nanofibers were used. Since polysulfone is more hydrophobic than cellulose, their work
implies that nanofiber should be sufficiently hydrophobic to induce the flux enhancement.
Considering that PVDF nanofibers were used in our work for electro-spinning are more
hydrophobic than polysulfone, the results of this thesis corroborate the findings of
Dobosz et al. (2017).
t-Test: Two-Sample Assuming Equal Variances
Variable 1 Variable 2
Mean 103.7875 165.1543
Variance 769.9753 1750.848
Observations 4 7
Pooled Variance 1423.89
Hypothesized Mean Difference 0
df 9
t Stat -2.59464
P(T<=t) one-tail 0.014496
t Critical one-tail 1.833113
P(T<=t) two-tail 0.028992
t Critical two-tail 2.262157
66
A number of mechanisms were considered to explain the observed flux
enhancement. One was that the surface morphology of the PES substrate was changed by
the electro-spinning. This possibility was, however, disproved by experiments with
membranes processed in the electrospinning apparatus with a solvent spray without
polymer; these membranes did not show a PWP enhancement (Appendix A). It is likely
that solvent evaporated completely while extracting from the syringe and did not reach
the collecting drum. A second possibility might be that the modified PES membranes
become stronger due to the electrospun layer, so there is less compaction, deformation,
and ultimately, narrowing of the pores of the PES membrane and reducing its fluxes.
67
Finally, the electrospun layer is a more hydrophobic layer and consists of larger
pores compared to the PES support membrane; therefore, the pores may provide a
channeling of the flow through the membrane resulting in less fluid friction and higher
fluxes through the EPES membranes.
4.2 Series 1 Tests including filtration of Ottawa River (OR) Water
Series 1 tests evaluated PES and EPES-250 membrane samples (Table 4.1) and
the procedure included a PWP test, followed by a filtration/fouling tests with Ottawa
River water and a 4 hr tangential cleaning/filtration test. The results of the PWP
experiments are shown in Figure 4.2. It should be noted that three coupons were taken
from each membrane sheet and the average value is reported. From the figure it is
evident that the PWP flux of the EPES-250 membrane decreased gradually with time but
it remained approximately three times higher than that for the PES membrane. The PWP
flux of the PES membrane was stable during the entire 4 h period; this has been
confirmed by the flux versus time linear regression results. That is, the regression yielded
95 % confidence limits of the slope which included zero, so, statistically it can be said
that the flux did not change with time.
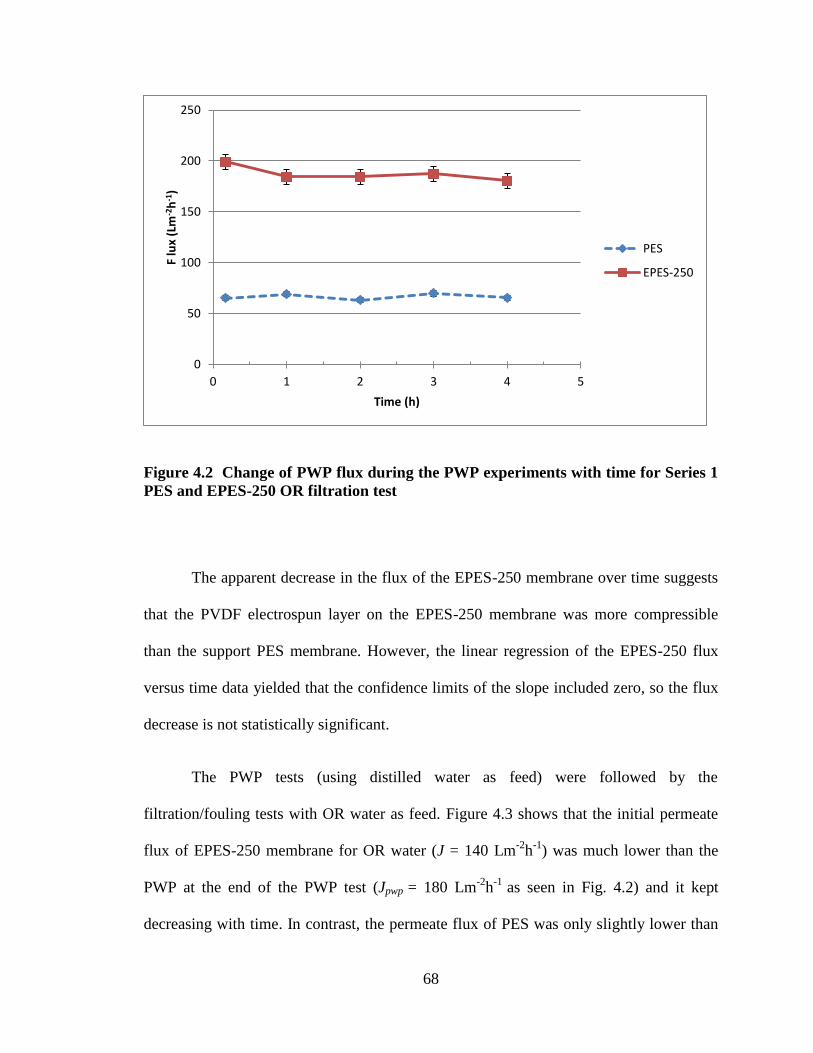
68
Figure 4.2 Change of PWP flux during the PWP experiments with time for Series 1
PES and EPES-250 OR filtration test
The apparent decrease in the flux of the EPES-250 membrane over time suggests
that the PVDF electrospun layer on the EPES-250 membrane was more compressible
than the support PES membrane. However, the linear regression of the EPES-250 flux
versus time data yielded that the confidence limits of the slope included zero, so the flux
decrease is not statistically significant.
The PWP tests (using distilled water as feed) were followed by the
filtration/fouling tests with OR water as feed. Figure 4.3 shows that the initial permeate
flux of EPES-250 membrane for OR water (J = 140 Lm-2
h-1
) was much lower than the
PWP at the end of the PWP test (Jpwp = 180 Lm-2
h-1
as seen in Fig. 4.2) and it kept
decreasing with time. In contrast, the permeate flux of PES was only slightly lower than
0
50
100
150
200
250
0 1 2 3 4 5
F lu
x (L
m-2
h-1
)
Time (h)
PES
EPES-250
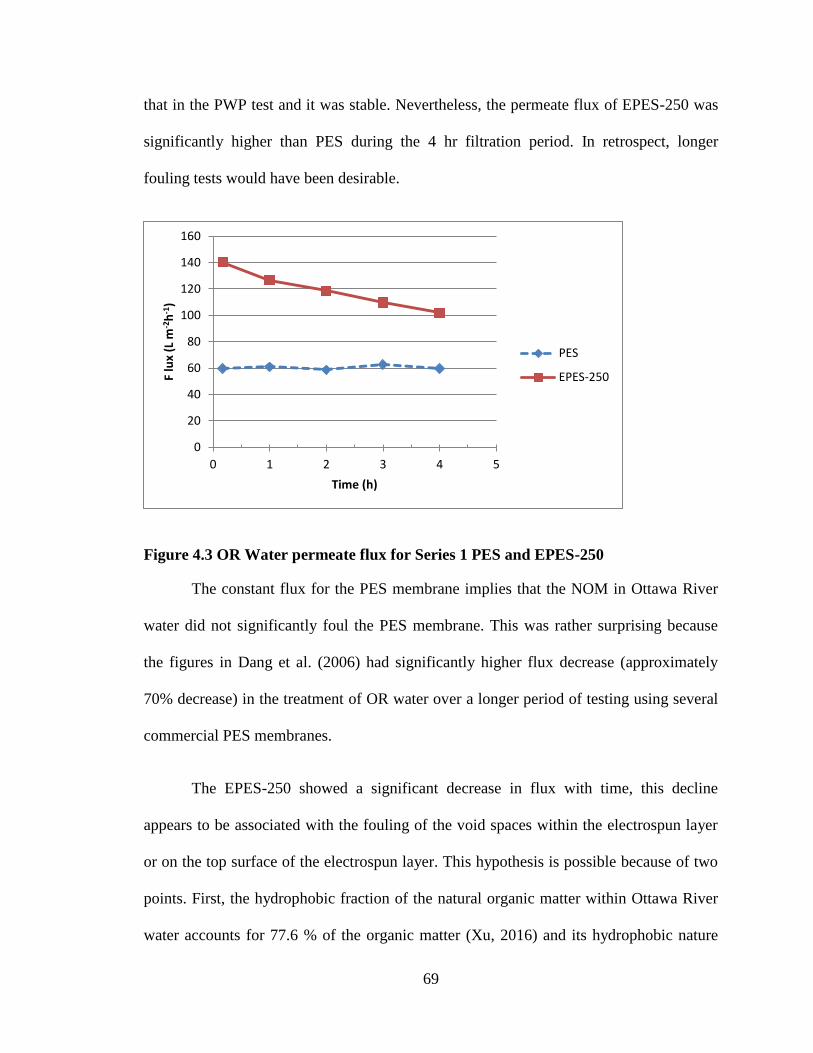
69
that in the PWP test and it was stable. Nevertheless, the permeate flux of EPES-250 was
significantly higher than PES during the 4 hr filtration period. In retrospect, longer
fouling tests would have been desirable.
Figure 4.3 OR Water permeate flux for Series 1 PES and EPES-250
The constant flux for the PES membrane implies that the NOM in Ottawa River
water did not significantly foul the PES membrane. This was rather surprising because
the figures in Dang et al. (2006) had significantly higher flux decrease (approximately
70% decrease) in the treatment of OR water over a longer period of testing using several
commercial PES membranes.
The EPES-250 showed a significant decrease in flux with time, this decline
appears to be associated with the fouling of the void spaces within the electrospun layer
or on the top surface of the electrospun layer. This hypothesis is possible because of two
points. First, the hydrophobic fraction of the natural organic matter within Ottawa River
water accounts for 77.6 % of the organic matter (Xu, 2016) and its hydrophobic nature
0
20
40
60
80
100
120
140
160
0 1 2 3 4 5
F lu
x (L
m-2
h-1
)
Time (h)
PES
EPES-250
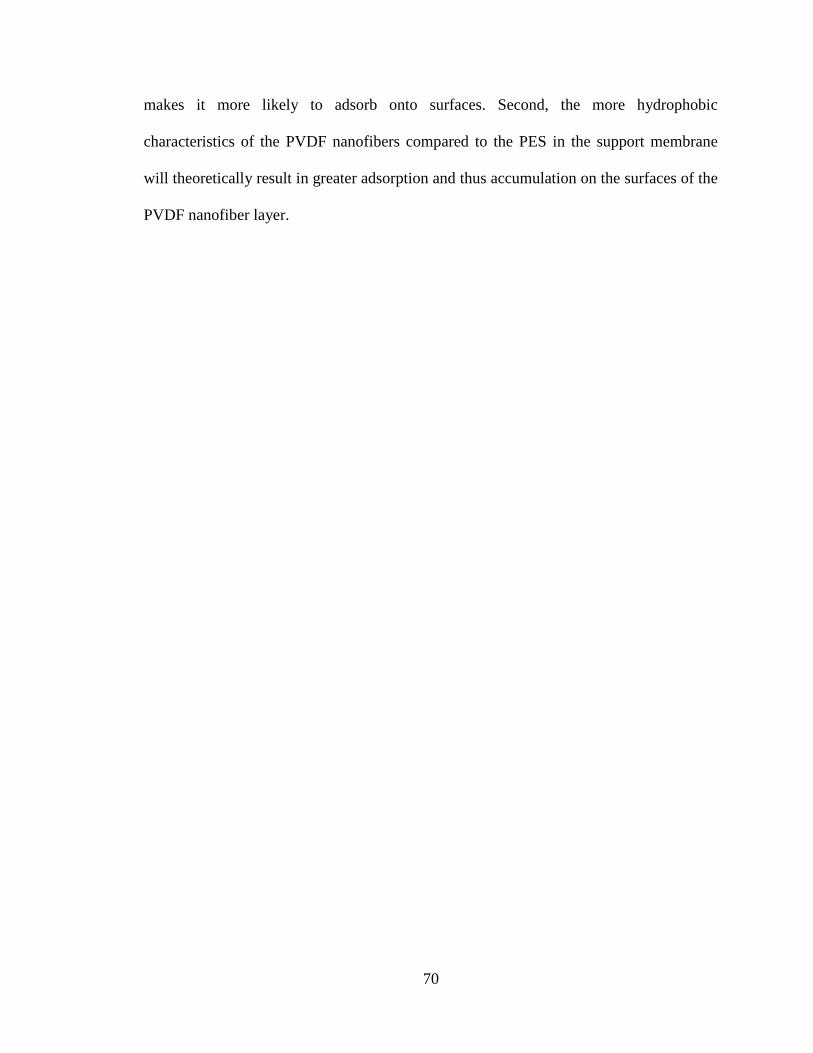
70
makes it more likely to adsorb onto surfaces. Second, the more hydrophobic
characteristics of the PVDF nanofibers compared to the PES in the support membrane
will theoretically result in greater adsorption and thus accumulation on the surfaces of the
PVDF nanofiber layer.
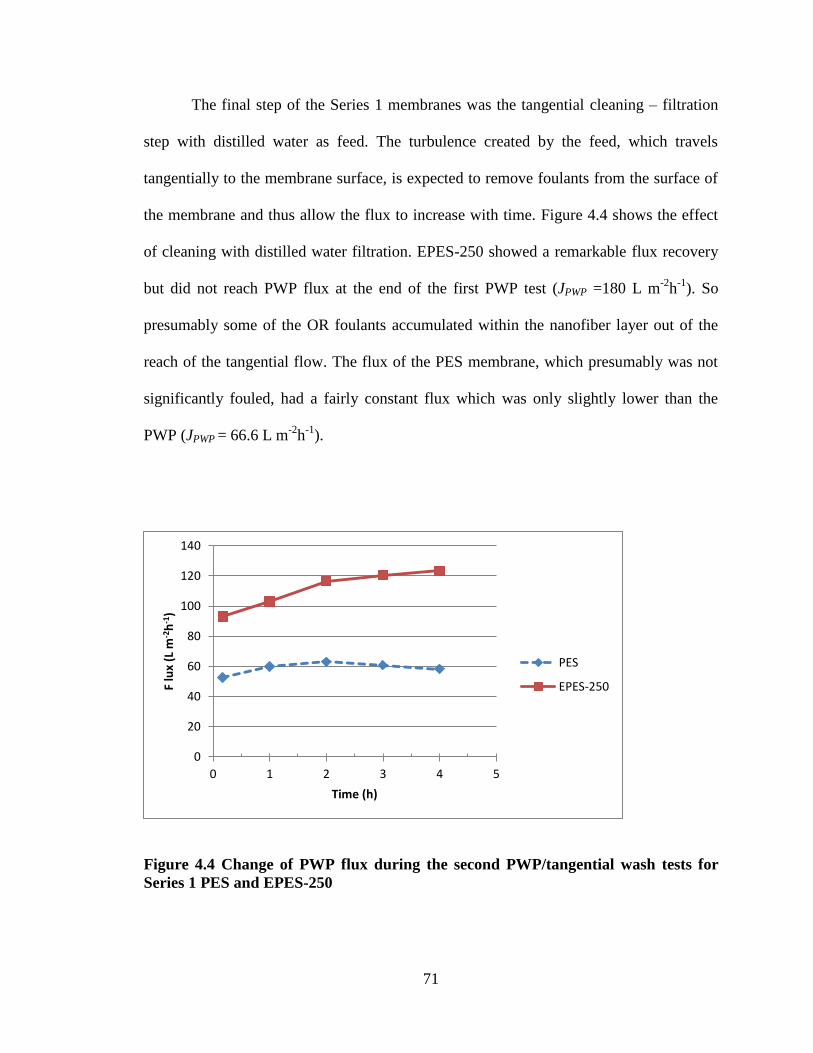
71
The final step of the Series 1 membranes was the tangential cleaning – filtration
step with distilled water as feed. The turbulence created by the feed, which travels
tangentially to the membrane surface, is expected to remove foulants from the surface of
the membrane and thus allow the flux to increase with time. Figure 4.4 shows the effect
of cleaning with distilled water filtration. EPES-250 showed a remarkable flux recovery
but did not reach PWP flux at the end of the first PWP test (JPWP =180 L m-2
h-1
). So
presumably some of the OR foulants accumulated within the nanofiber layer out of the
reach of the tangential flow. The flux of the PES membrane, which presumably was not
significantly fouled, had a fairly constant flux which was only slightly lower than the
PWP (JPWP = 66.6 L m-2
h-1
).
Figure 4.4 Change of PWP flux during the second PWP/tangential wash tests for
Series 1 PES and EPES-250
0
20
40
60
80
100
120
140
0 1 2 3 4 5
F lu
x (L
m-2
h-1
)
Time (h)
PES
EPES-250
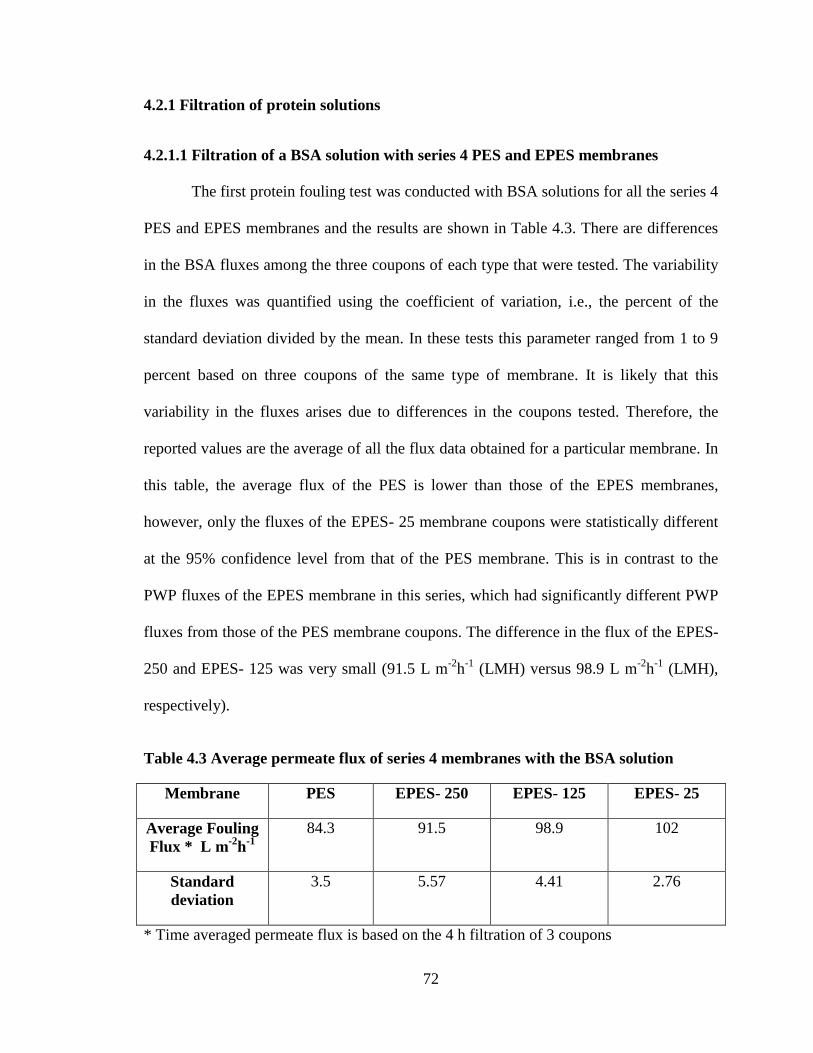
72
4.2.1 Filtration of protein solutions
4.2.1.1 Filtration of a BSA solution with series 4 PES and EPES membranes
The first protein fouling test was conducted with BSA solutions for all the series 4
PES and EPES membranes and the results are shown in Table 4.3. There are differences
in the BSA fluxes among the three coupons of each type that were tested. The variability
in the fluxes was quantified using the coefficient of variation, i.e., the percent of the
standard deviation divided by the mean. In these tests this parameter ranged from 1 to 9
percent based on three coupons of the same type of membrane. It is likely that this
variability in the fluxes arises due to differences in the coupons tested. Therefore, the
reported values are the average of all the flux data obtained for a particular membrane. In
this table, the average flux of the PES is lower than those of the EPES membranes,
however, only the fluxes of the EPES- 25 membrane coupons were statistically different
at the 95% confidence level from that of the PES membrane. This is in contrast to the
PWP fluxes of the EPES membrane in this series, which had significantly different PWP
fluxes from those of the PES membrane coupons. The difference in the flux of the EPES-
250 and EPES- 125 was very small (91.5 L m-2
h-1
(LMH) versus 98.9 L m-2
h-1
(LMH),
respectively).
Table 4.3 Average permeate flux of series 4 membranes with the BSA solution
Membrane PES EPES- 250 EPES- 125 EPES- 25
Average Fouling
Flux * L m-2
h-1
84.3 91.5 98.9 102
Standard
deviation
3.5 5.57 4.41 2.76
* Time averaged permeate flux is based on the 4 h filtration of 3 coupons
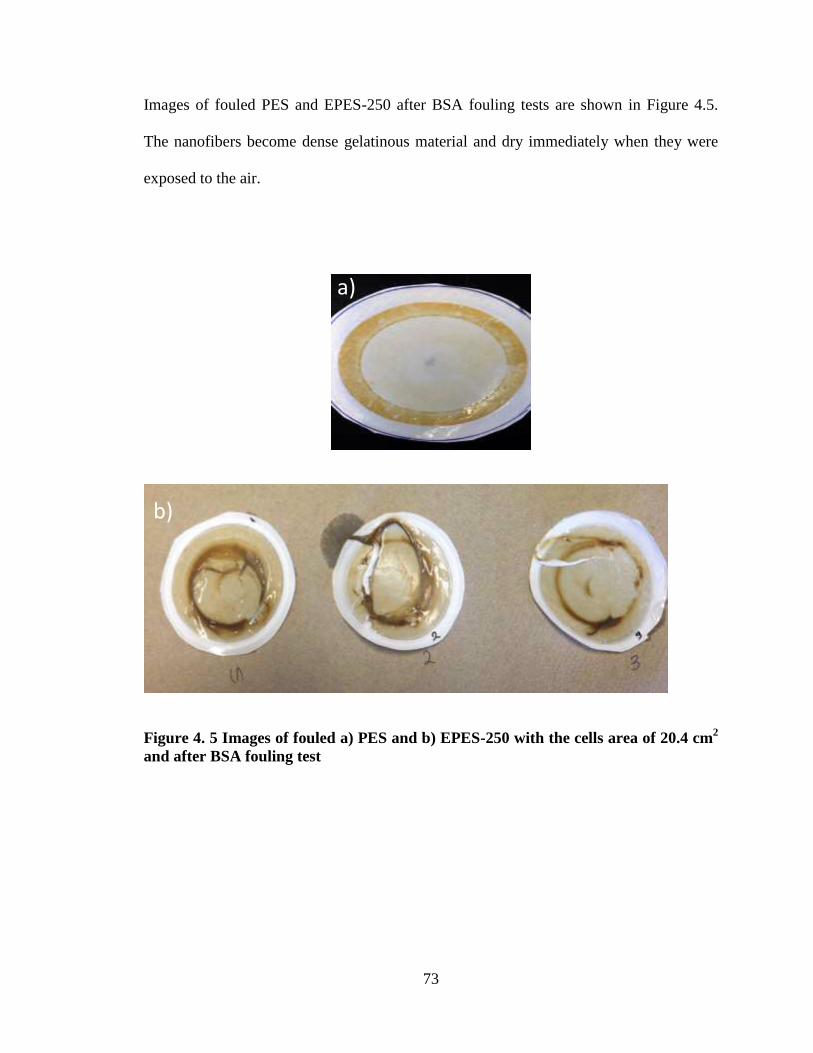
73
Images of fouled PES and EPES-250 after BSA fouling tests are shown in Figure 4.5.
The nanofibers become dense gelatinous material and dry immediately when they were
exposed to the air.
Figure 4. 5 Images of fouled a) PES and b) EPES-250 with the cells area of 20.4 cm2
and after BSA fouling test
a)
b)
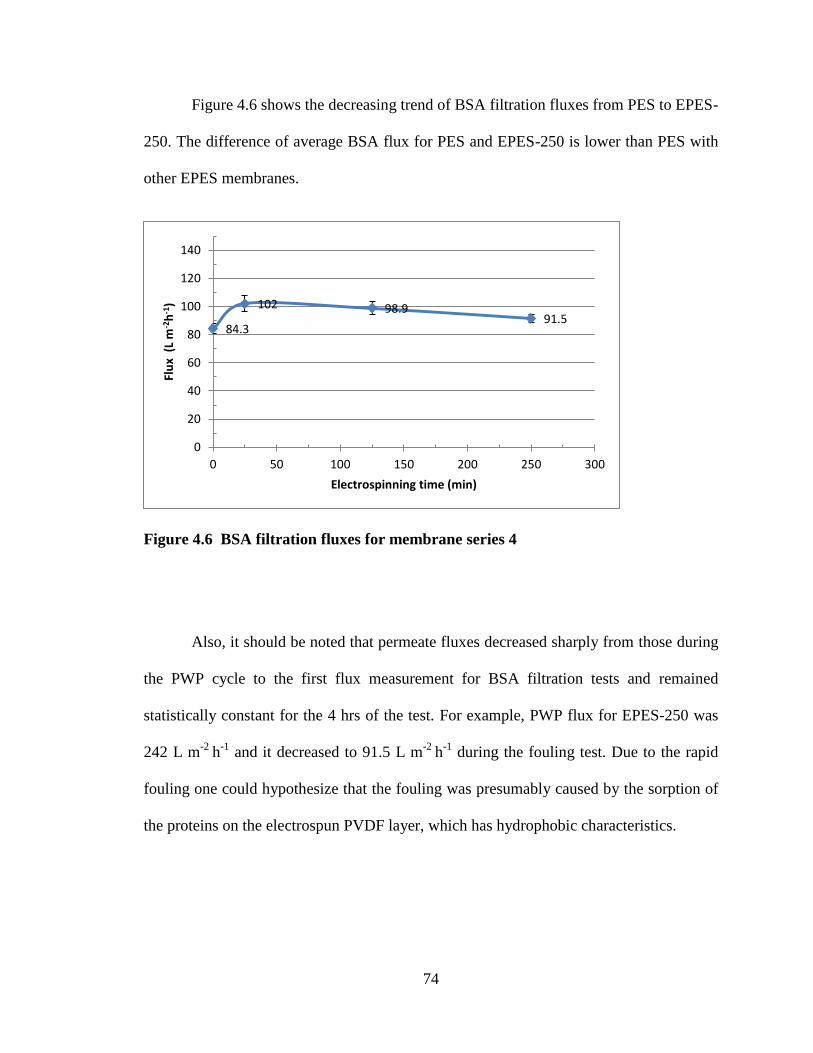
74
Figure 4.6 shows the decreasing trend of BSA filtration fluxes from PES to EPES-
250. The difference of average BSA flux for PES and EPES-250 is lower than PES with
other EPES membranes.
Figure 4.6 BSA filtration fluxes for membrane series 4
Also, it should be noted that permeate fluxes decreased sharply from those during
the PWP cycle to the first flux measurement for BSA filtration tests and remained
statistically constant for the 4 hrs of the test. For example, PWP flux for EPES-250 was
242 L m-2
h-1
and it decreased to 91.5 L m-2
h-1
during the fouling test. Due to the rapid
fouling one could hypothesize that the fouling was presumably caused by the sorption of
the proteins on the electrospun PVDF layer, which has hydrophobic characteristics.
84.3
102 98.9 91.5
0
20
40
60
80
100
120
140
0 50 100 150 200 250 300
Flu
x (
L m
-2h
-1)
Electrospinning time (min)
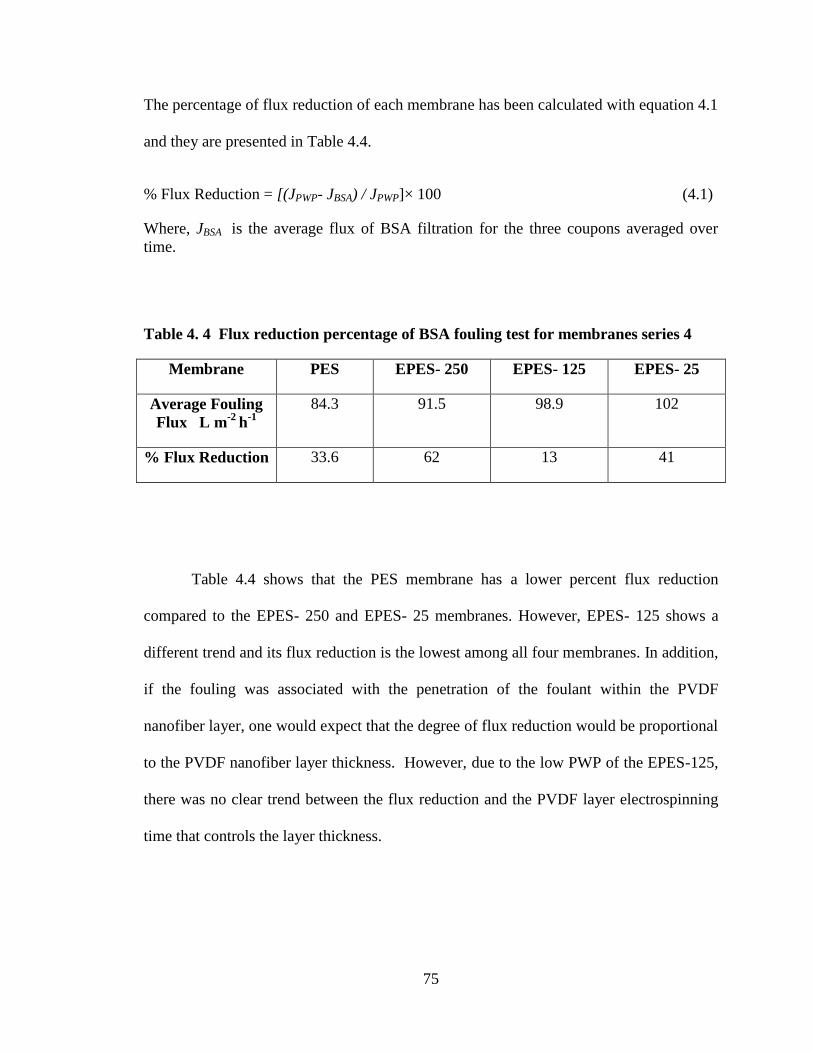
75
The percentage of flux reduction of each membrane has been calculated with equation 4.1
and they are presented in Table 4.4.
% Flux Reduction = [(JPWP- JBSA) / JPWP]× 100 (4.1)
Where, JBSA is the average flux of BSA filtration for the three coupons averaged over
time.
Table 4. 4 Flux reduction percentage of BSA fouling test for membranes series 4
Membrane PES EPES- 250 EPES- 125 EPES- 25
Average Fouling
Flux L m-2
h-1
84.3 91.5 98.9 102
% Flux Reduction 33.6 62 13 41
Table 4.4 shows that the PES membrane has a lower percent flux reduction
compared to the EPES- 250 and EPES- 25 membranes. However, EPES- 125 shows a
different trend and its flux reduction is the lowest among all four membranes. In addition,
if the fouling was associated with the penetration of the foulant within the PVDF
nanofiber layer, one would expect that the degree of flux reduction would be proportional
to the PVDF nanofiber layer thickness. However, due to the low PWP of the EPES-125,
there was no clear trend between the flux reduction and the PVDF layer electrospinning
time that controls the layer thickness.
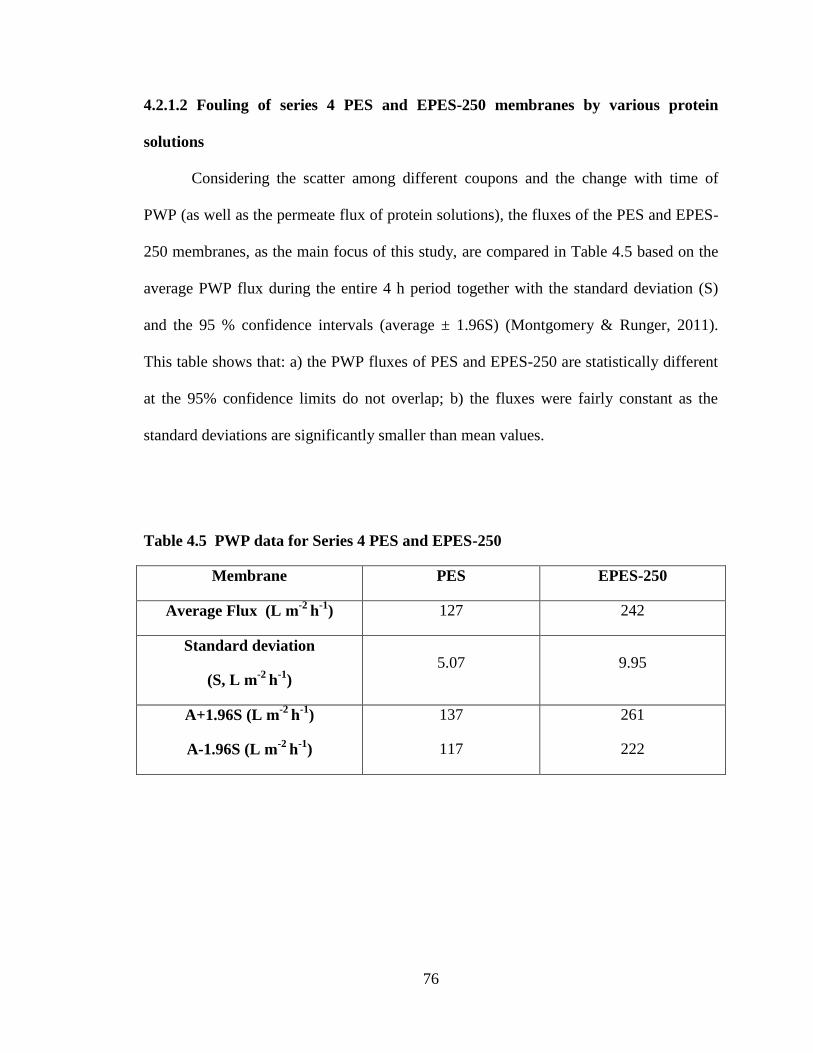
76
4.2.1.2 Fouling of series 4 PES and EPES-250 membranes by various protein
solutions
Considering the scatter among different coupons and the change with time of
PWP (as well as the permeate flux of protein solutions), the fluxes of the PES and EPES-
250 membranes, as the main focus of this study, are compared in Table 4.5 based on the
average PWP flux during the entire 4 h period together with the standard deviation (S)
and the 95 % confidence intervals (average ± 1.96S) (Montgomery & Runger, 2011).
This table shows that: a) the PWP fluxes of PES and EPES-250 are statistically different
at the 95% confidence limits do not overlap; b) the fluxes were fairly constant as the
standard deviations are significantly smaller than mean values.
Table 4.5 PWP data for Series 4 PES and EPES-250
Membrane PES EPES-250
Average Flux (L m-2
h-1
) 127 242
Standard deviation
(S, L m-2
h-1
) 5.07 9.95
A+1.96S (L m-2
h-1
)
A-1.96S (L m-2
h-1
)
137
117
261
222
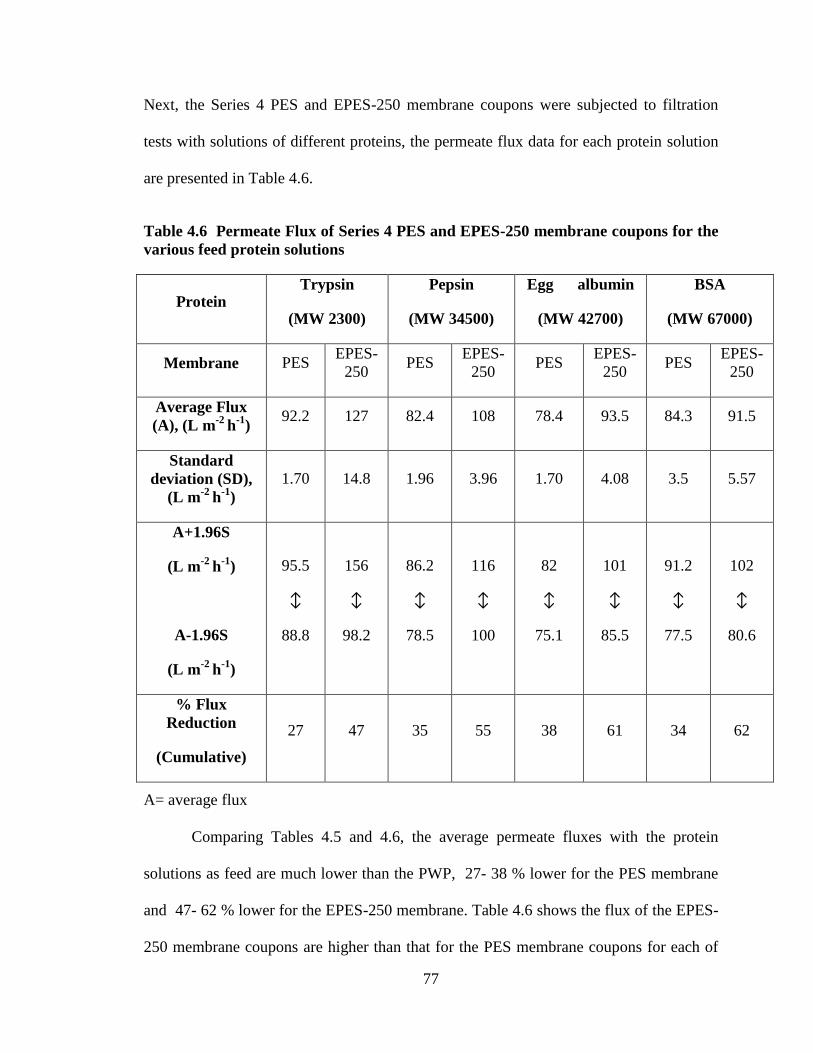
77
Next, the Series 4 PES and EPES-250 membrane coupons were subjected to filtration
tests with solutions of different proteins, the permeate flux data for each protein solution
are presented in Table 4.6.
Table 4.6 Permeate Flux of Series 4 PES and EPES-250 membrane coupons for the
various feed protein solutions
Protein Trypsin
(MW 2300)
Pepsin
(MW 34500)
Egg albumin
(MW 42700)
BSA
(MW 67000)
Membrane PES EPES-
250 PES
EPES-
250 PES
EPES-
250 PES
EPES-
250
Average Flux
(A), (L m-2
h-1
) 92.2 127 82.4 108 78.4 93.5 84.3 91.5
Standard
deviation (SD),
(L m-2
h-1
)
1.70 14.8 1.96 3.96 1.70 4.08 3.5 5.57
A+1.96S
(L m-2
h-1
)
A-1.96S
(L m-2
h-1
)
95.5
↕
88.8
156
↕
98.2
86.2
↕
78.5
116
↕
100
82
↕
75.1
101
↕
85.5
91.2
↕
77.5
102
↕
80.6
% Flux
Reduction
(Cumulative)
27 47 35 55 38 61 34 62
A= average flux
Comparing Tables 4.5 and 4.6, the average permeate fluxes with the protein
solutions as feed are much lower than the PWP, 27- 38 % lower for the PES membrane
and 47- 62 % lower for the EPES-250 membrane. Table 4.6 shows the flux of the EPES-
250 membrane coupons are higher than that for the PES membrane coupons for each of
78
the protein solutions tested. Only for BSA there is an overlap in the 95% confidence
limits of the fluxes of the PES and EPES-250 membranes, the PES and EPES-250
membrane fluxes for the other protein solutions are statistically different.
As well, the fluxes decrease progressively from Trypsin to BSA as the molecular
weight of protein increases. This phenomenon is likely due to fouling by the solute
protein, consideration of the higher PWP of EPES than PES, and the severer pore
blocking by the larger protein.
4.2.2 Analysis of fouling by OR Water
The OR water fouling data shown in Figures 4.2, 4.3 and 4.4 were further
analyzed to determine the flux decrease due to compaction (Comp), due to the total
fouling (Rtotal), irreversible fouling (Rirr), and reversible fouling (Rrev). These parameters
were calculated using equations 4.3 to 4.5 which were adopted from Kanagaraj et al.,
2014. Those parameters are defined as,
Compac= (Jw0 – Jw1)/Jw0 (4.2)
Rtotal = (Jw1 - Jp)/Jw1 (4.3)
Rirr= (Jw1 - Jw2)/Jw1 (4.4)
Rrev= (Jw2 - Jp)/Jw1 (4.5)
Where:
Jw0: The first pure water flux (Lm-2
h-1
)
79
Jw1: The last pure water flux (Lm-2
h-1
) before the fouling experiment
Jw2: The last pure water flux (Lm-2
h-1
) of post fouling experiment
Jp: The last flux (Lm-2
h-1
) with OR Water (i.e., the fouling test)
Compac: Fractional flux reduction by compaction based on Jw0
Rtotal: Fractional flux reduction due to both irreversible and reversible fouling based on
Jw1, i.e., it equals Rirr + Rrev
Rirr: Fractional flux reduction due to irreversible fouling based on Jw1
Rrev: Fractional flux reduction due to reversible fouling based on Jw1.
As aforementioned, tangential cleaning, a rather cleaning process was applied in this
study since the filtration system did not allow performing membrane backwashing. Thus,
the reversible flux reduction calculated by Rrev is conservative as more intensive cleaning
methods (such as backwashing) and chemical cleaning methods will yield smaller Rirr
values and therefore larger Rrev values.
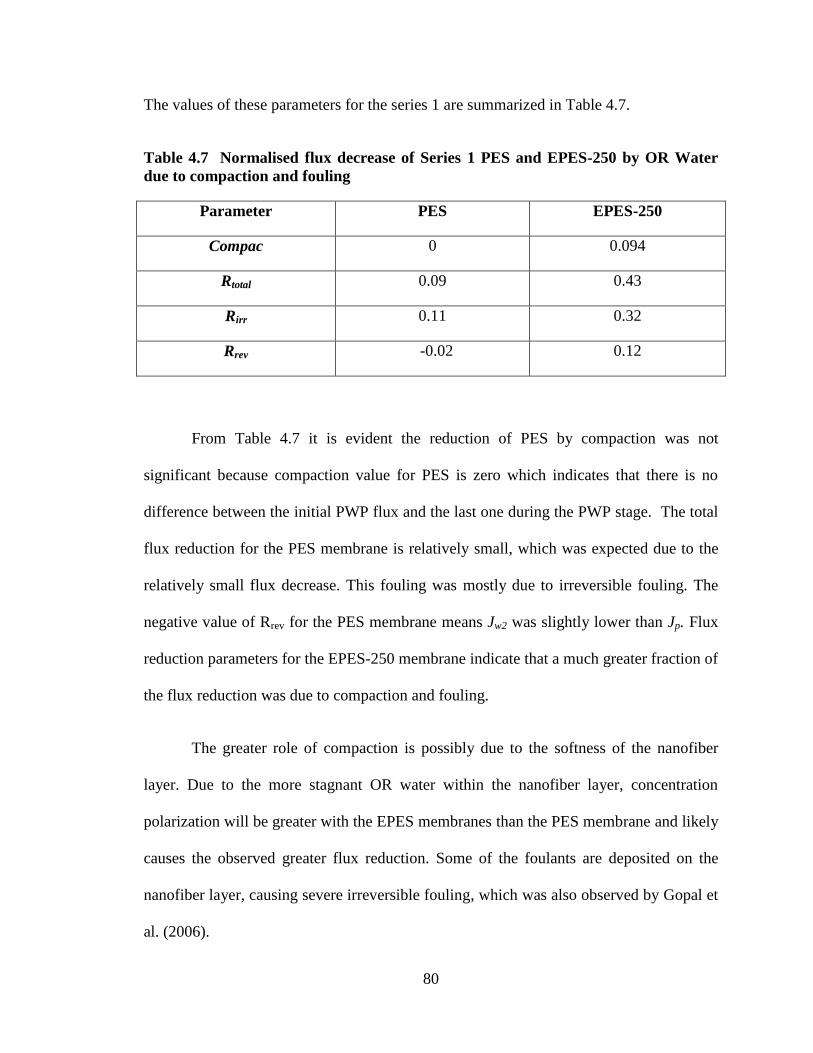
80
The values of these parameters for the series 1 are summarized in Table 4.7.
Table 4.7 Normalised flux decrease of Series 1 PES and EPES-250 by OR Water
due to compaction and fouling
Parameter PES EPES-250
Compac 0 0.094
Rtotal 0.09 0.43
Rirr 0.11 0.32
Rrev -0.02 0.12
From Table 4.7 it is evident the reduction of PES by compaction was not
significant because compaction value for PES is zero which indicates that there is no
difference between the initial PWP flux and the last one during the PWP stage. The total
flux reduction for the PES membrane is relatively small, which was expected due to the
relatively small flux decrease. This fouling was mostly due to irreversible fouling. The
negative value of Rrev for the PES membrane means Jw2 was slightly lower than Jp. Flux
reduction parameters for the EPES-250 membrane indicate that a much greater fraction of
the flux reduction was due to compaction and fouling.
The greater role of compaction is possibly due to the softness of the nanofiber
layer. Due to the more stagnant OR water within the nanofiber layer, concentration
polarization will be greater with the EPES membranes than the PES membrane and likely
causes the observed greater flux reduction. Some of the foulants are deposited on the
nanofiber layer, causing severe irreversible fouling, which was also observed by Gopal et
al. (2006).
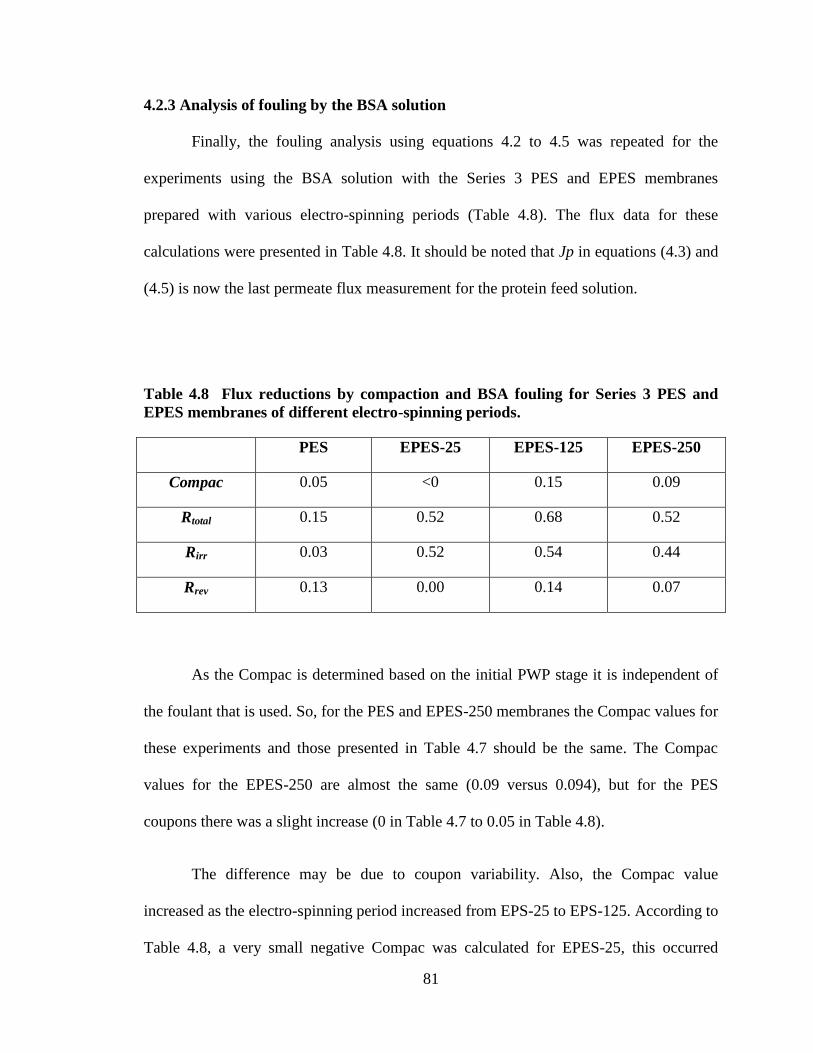
81
4.2.3 Analysis of fouling by the BSA solution
Finally, the fouling analysis using equations 4.2 to 4.5 was repeated for the
experiments using the BSA solution with the Series 3 PES and EPES membranes
prepared with various electro-spinning periods (Table 4.8). The flux data for these
calculations were presented in Table 4.8. It should be noted that Jp in equations (4.3) and
(4.5) is now the last permeate flux measurement for the protein feed solution.
Table 4.8 Flux reductions by compaction and BSA fouling for Series 3 PES and
EPES membranes of different electro-spinning periods.
PES EPES-25 EPES-125 EPES-250
Compac 0.05 <0 0.15 0.09
Rtotal 0.15 0.52 0.68 0.52
Rirr 0.03 0.52 0.54 0.44
Rrev 0.13 0.00 0.14 0.07
As the Compac is determined based on the initial PWP stage it is independent of
the foulant that is used. So, for the PES and EPES-250 membranes the Compac values for
these experiments and those presented in Table 4.7 should be the same. The Compac
values for the EPES-250 are almost the same (0.09 versus 0.094), but for the PES
coupons there was a slight increase (0 in Table 4.7 to 0.05 in Table 4.8).
The difference may be due to coupon variability. Also, the Compac value
increased as the electro-spinning period increased from EPS-25 to EPS-125. According to
Table 4.8, a very small negative Compac was calculated for EPES-25, this occurred
82
because the final PWP flux was slightly higher than the initial PWP flux. Flux reduction
by fouling (Rtotal) is more severe for the EPES membranes than the PES membrane, as
expected because of the trapped foulant on the surface of EPES membranes. The fouling
of the PES membranes was primarily reversible as Rrev was 0.13 while Rtotal was 0.15.
The fouling of the EPES membranes was also primarily irreversible as the ratio of Rirr to
Rtotal were 1, 0.79 and 0.85 for the EPES-25, EPES-125 and the EPES-250 membranes,
respectively.
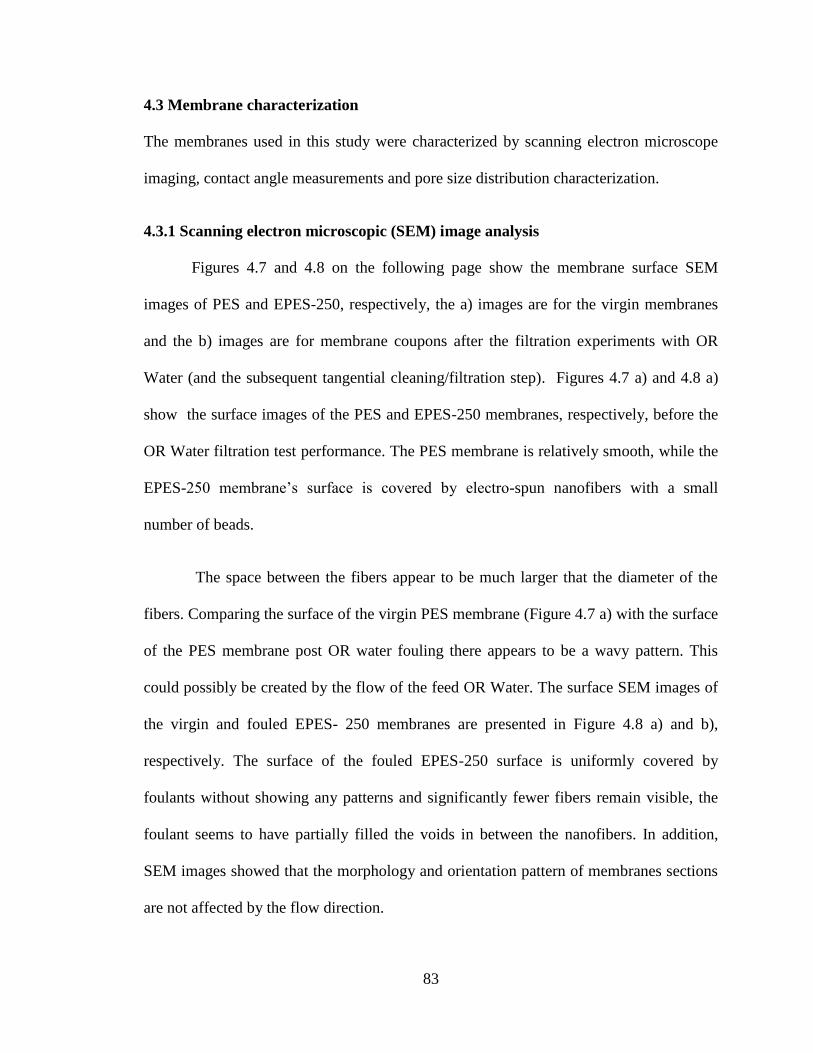
83
4.3 Membrane characterization
The membranes used in this study were characterized by scanning electron microscope
imaging, contact angle measurements and pore size distribution characterization.
4.3.1 Scanning electron microscopic (SEM) image analysis
Figures 4.7 and 4.8 on the following page show the membrane surface SEM
images of PES and EPES-250, respectively, the a) images are for the virgin membranes
and the b) images are for membrane coupons after the filtration experiments with OR
Water (and the subsequent tangential cleaning/filtration step). Figures 4.7 a) and 4.8 a)
show the surface images of the PES and EPES-250 membranes, respectively, before the
OR Water filtration test performance. The PES membrane is relatively smooth, while the
EPES-250 membrane’s surface is covered by electro-spun nanofibers with a small
number of beads.
The space between the fibers appear to be much larger that the diameter of the
fibers. Comparing the surface of the virgin PES membrane (Figure 4.7 a) with the surface
of the PES membrane post OR water fouling there appears to be a wavy pattern. This
could possibly be created by the flow of the feed OR Water. The surface SEM images of
the virgin and fouled EPES- 250 membranes are presented in Figure 4.8 a) and b),
respectively. The surface of the fouled EPES-250 surface is uniformly covered by
foulants without showing any patterns and significantly fewer fibers remain visible, the
foulant seems to have partially filled the voids in between the nanofibers. In addition,
SEM images showed that the morphology and orientation pattern of membranes sections
are not affected by the flow direction.
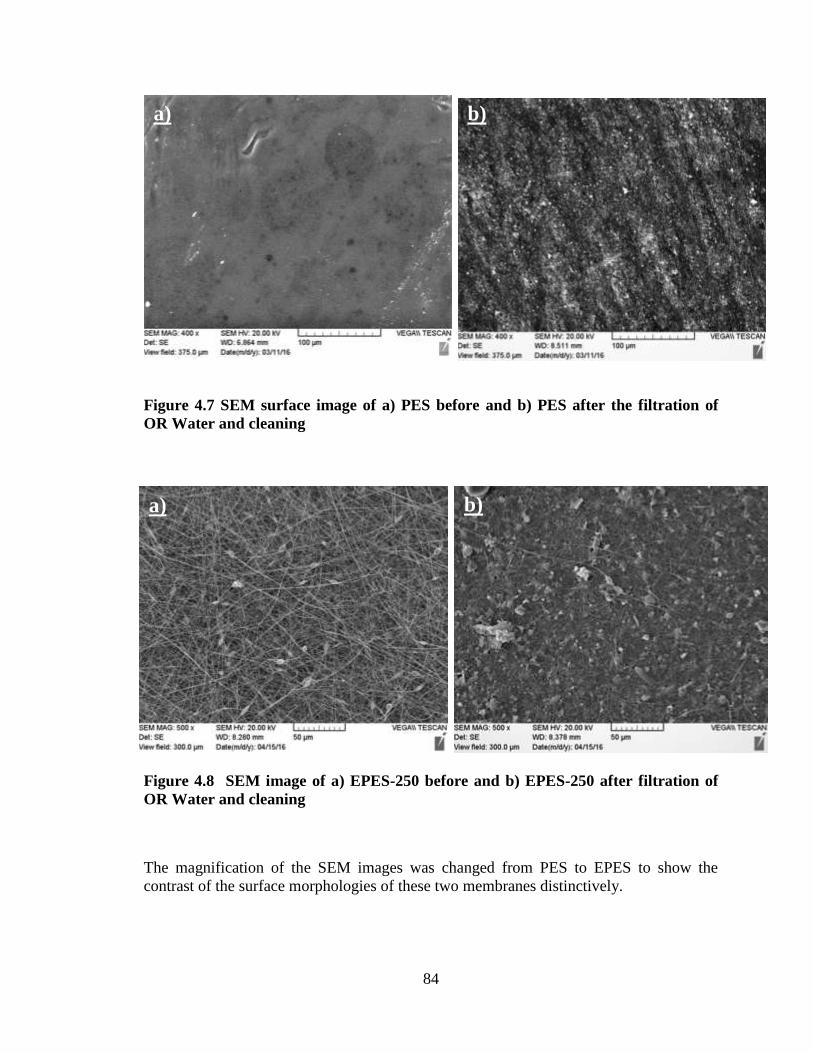
84
Figure 4.7 SEM surface image of a) PES before and b) PES after the filtration of
OR Water and cleaning
Figure 4.8 SEM image of a) EPES-250 before and b) EPES-250 after filtration of
OR Water and cleaning
The magnification of the SEM images was changed from PES to EPES to show the
contrast of the surface morphologies of these two membranes distinctively.
a) b)
a) b)
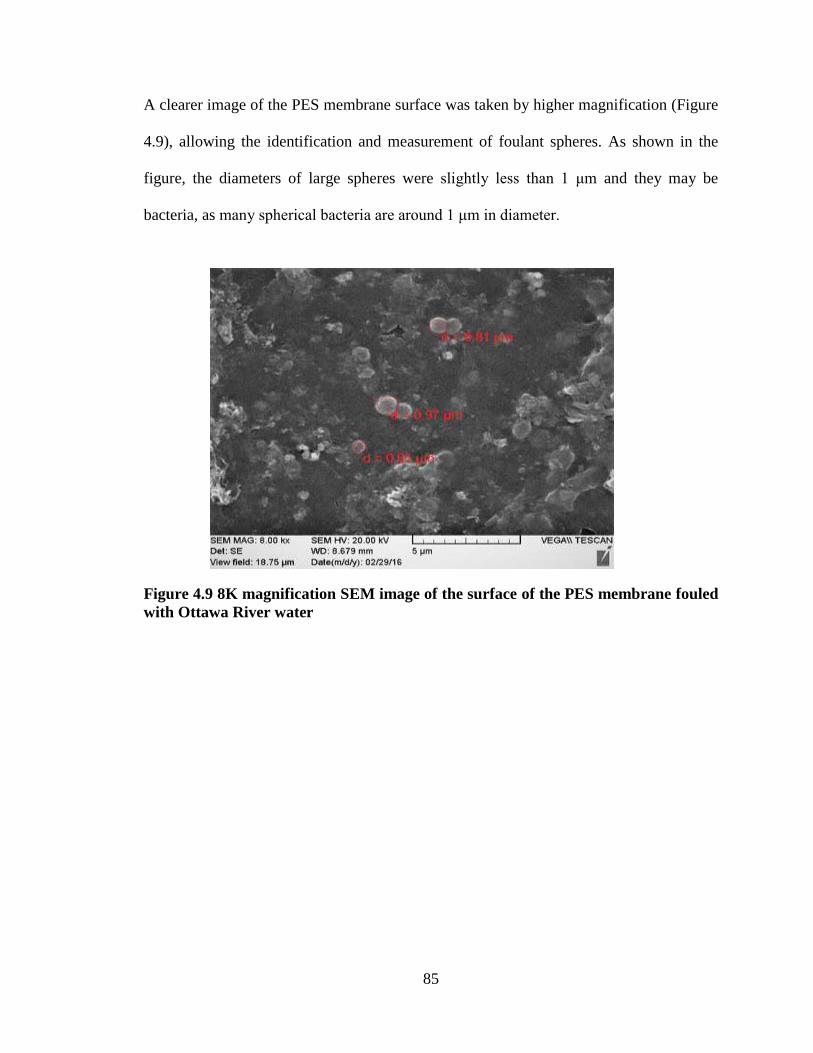
85
A clearer image of the PES membrane surface was taken by higher magnification (Figure
4.9), allowing the identification and measurement of foulant spheres. As shown in the
figure, the diameters of large spheres were slightly less than 1 μm and they may be
bacteria, as many spherical bacteria are around 1 μm in diameter.
Figure 4.9 8K magnification SEM image of the surface of the PES membrane fouled
with Ottawa River water
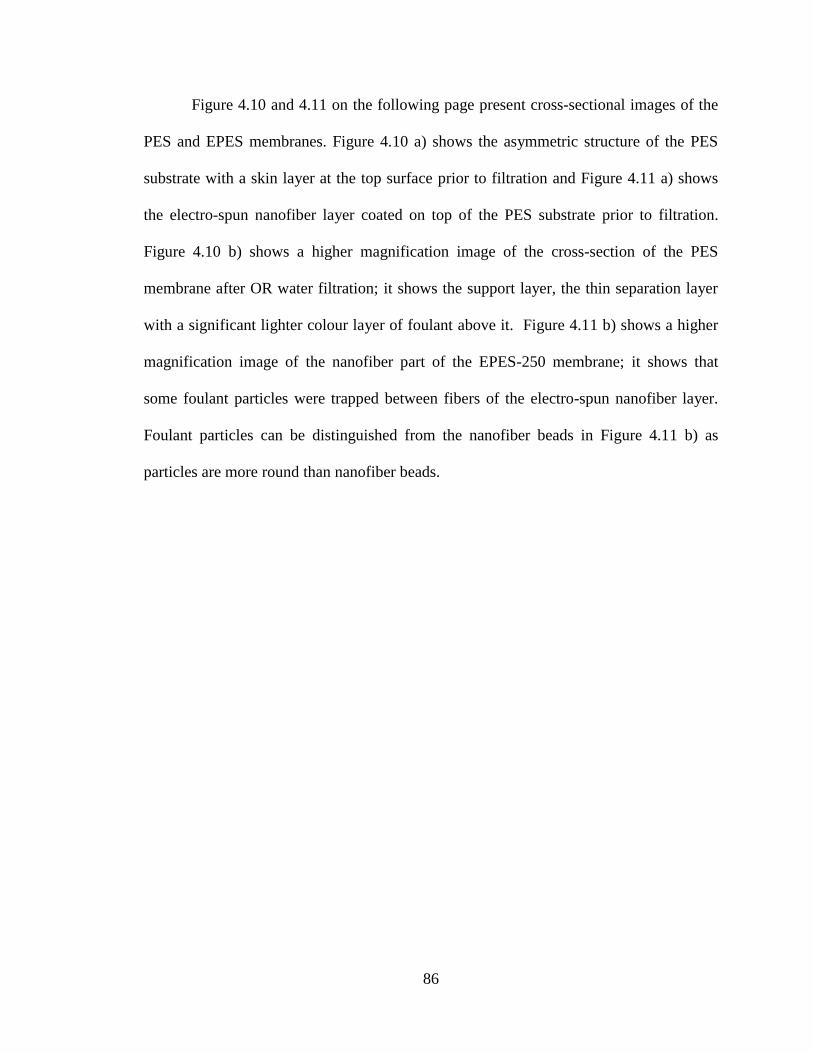
86
Figure 4.10 and 4.11 on the following page present cross-sectional images of the
PES and EPES membranes. Figure 4.10 a) shows the asymmetric structure of the PES
substrate with a skin layer at the top surface prior to filtration and Figure 4.11 a) shows
the electro-spun nanofiber layer coated on top of the PES substrate prior to filtration.
Figure 4.10 b) shows a higher magnification image of the cross-section of the PES
membrane after OR water filtration; it shows the support layer, the thin separation layer
with a significant lighter colour layer of foulant above it. Figure 4.11 b) shows a higher
magnification image of the nanofiber part of the EPES-250 membrane; it shows that
some foulant particles were trapped between fibers of the electro-spun nanofiber layer.
Foulant particles can be distinguished from the nanofiber beads in Figure 4.11 b) as
particles are more round than nanofiber beads.
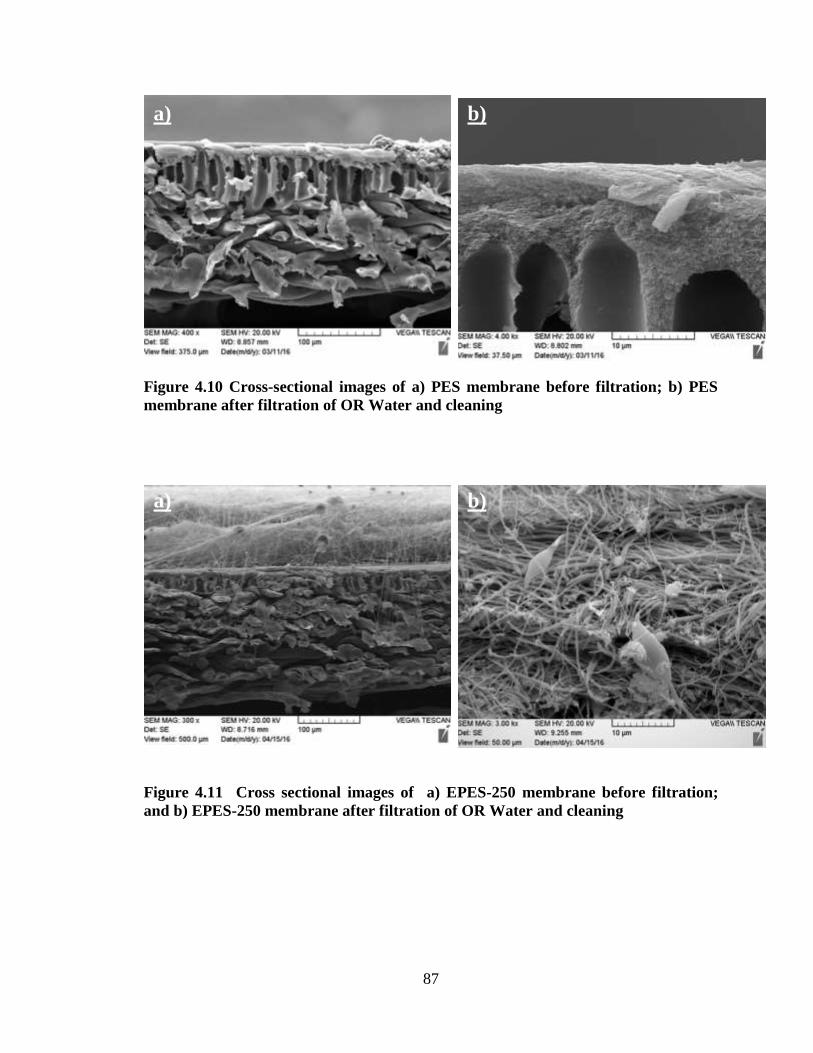
87
Figure 4.10 Cross-sectional images of a) PES membrane before filtration; b) PES
membrane after filtration of OR Water and cleaning
Figure 4.11 Cross sectional images of a) EPES-250 membrane before filtration;
and b) EPES-250 membrane after filtration of OR Water and cleaning
a) b)
a) b)
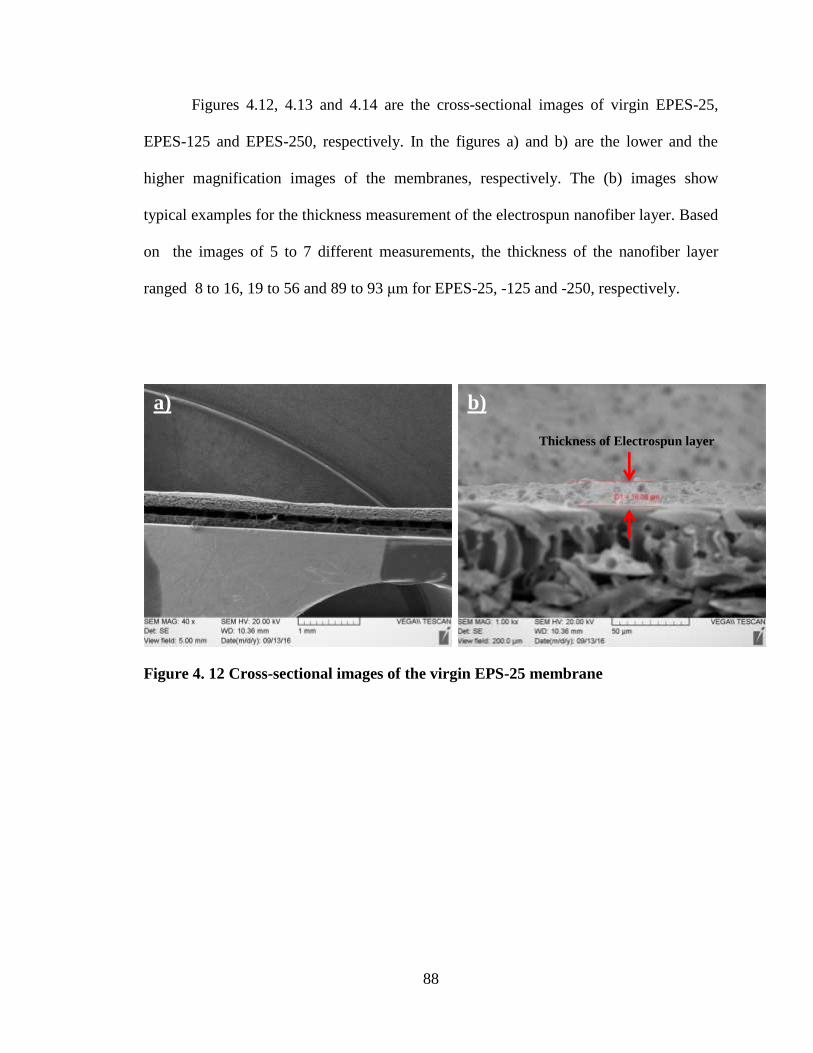
88
Figures 4.12, 4.13 and 4.14 are the cross-sectional images of virgin EPES-25,
EPES-125 and EPES-250, respectively. In the figures a) and b) are the lower and the
higher magnification images of the membranes, respectively. The (b) images show
typical examples for the thickness measurement of the electrospun nanofiber layer. Based
on the images of 5 to 7 different measurements, the thickness of the nanofiber layer
ranged 8 to 16, 19 to 56 and 89 to 93 μm for EPES-25, -125 and -250, respectively.
Figure 4. 12 Cross-sectional images of the virgin EPS-25 membrane
a) b)
Thickness of Electrospun layer
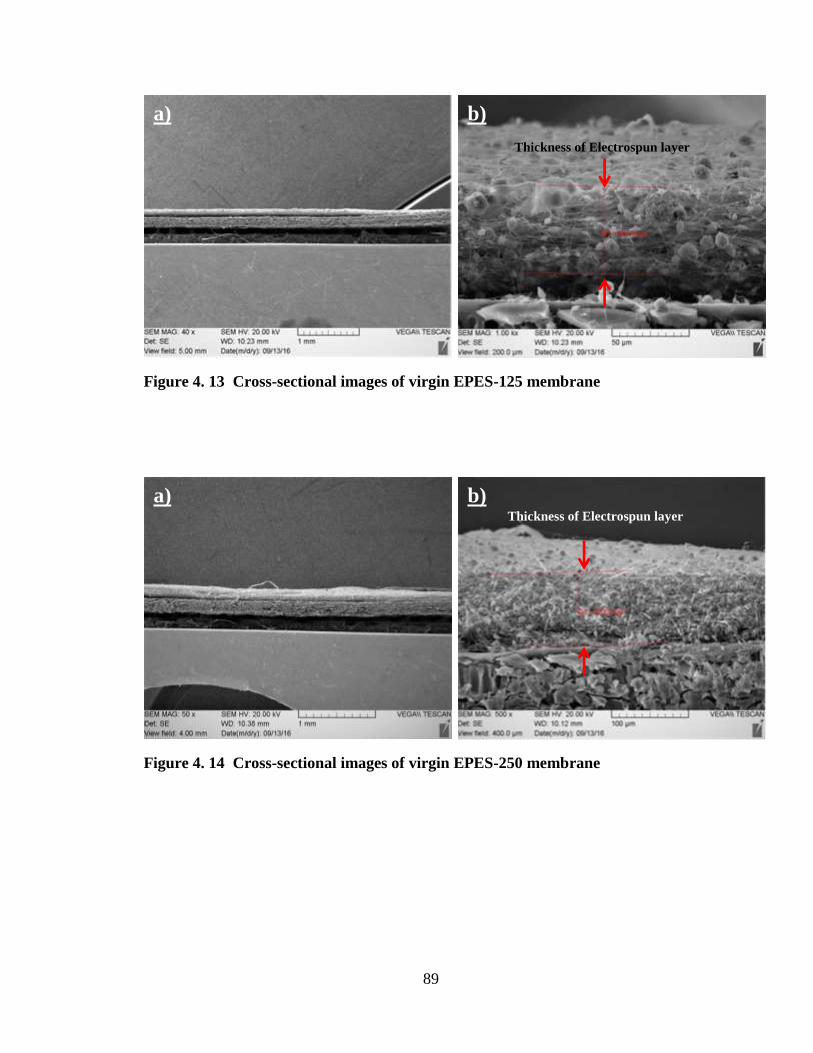
89
Figure 4. 13 Cross-sectional images of virgin EPES-125 membrane
Figure 4. 14 Cross-sectional images of virgin EPES-250 membrane
a) b)
a) b)
Thickness of Electrospun layer
Thickness of Electrospun layer
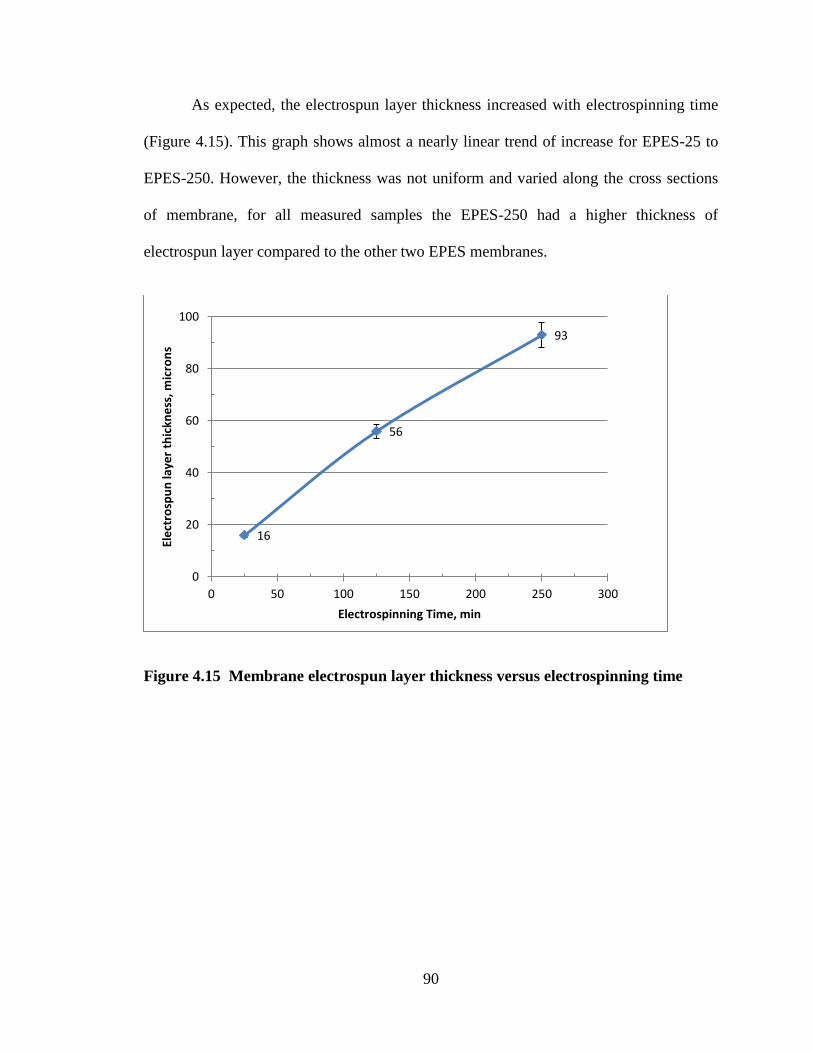
90
As expected, the electrospun layer thickness increased with electrospinning time
(Figure 4.15). This graph shows almost a nearly linear trend of increase for EPES-25 to
EPES-250. However, the thickness was not uniform and varied along the cross sections
of membrane, for all measured samples the EPES-250 had a higher thickness of
electrospun layer compared to the other two EPES membranes.
Figure 4.15 Membrane electrospun layer thickness versus electrospinning time
16
56
93
0
20
40
60
80
100
0 50 100 150 200 250 300
Ele
ctro
spu
n la
yer
thic
kne
ss, m
icro
ns
Electrospinning Time, min
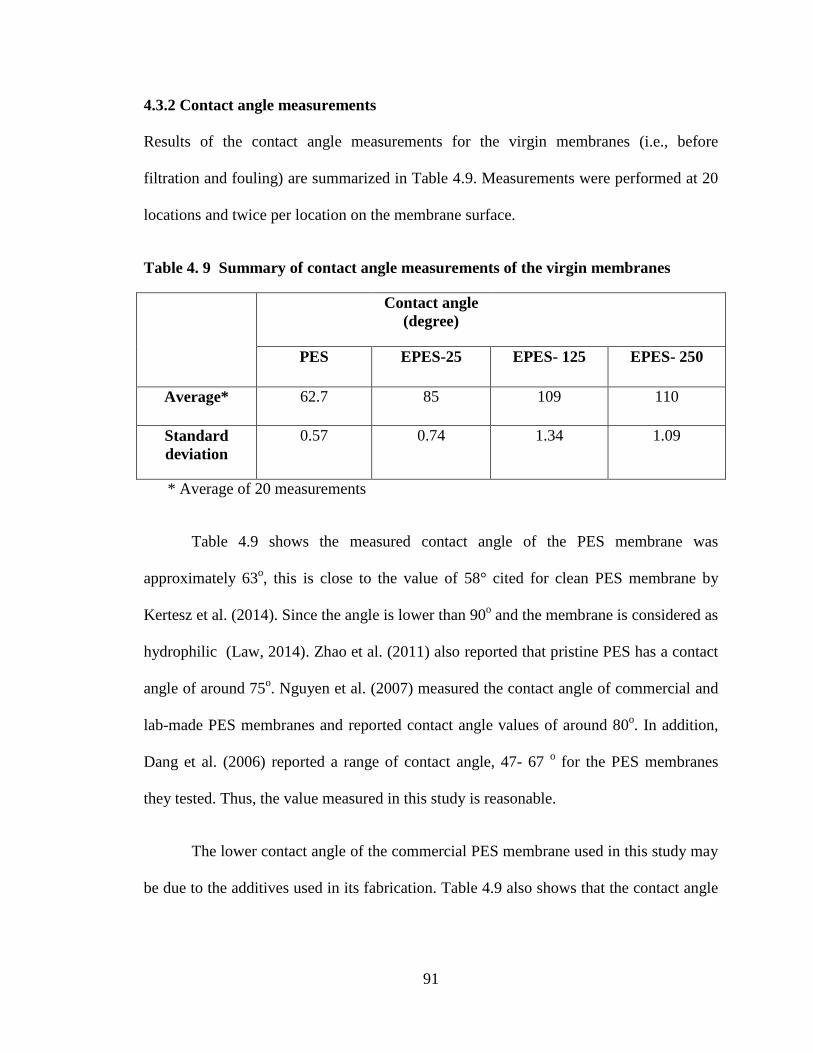
91
4.3.2 Contact angle measurements
Results of the contact angle measurements for the virgin membranes (i.e., before
filtration and fouling) are summarized in Table 4.9. Measurements were performed at 20
locations and twice per location on the membrane surface.
Table 4. 9 Summary of contact angle measurements of the virgin membranes
Contact angle
(degree)
PES EPES-25 EPES- 125 EPES- 250
Average* 62.7 85 109 110
Standard
deviation
0.57 0.74 1.34 1.09
* Average of 20 measurements
Table 4.9 shows the measured contact angle of the PES membrane was
approximately 63o, this is close to the value of 58° cited for clean PES membrane by
Kertesz et al. (2014). Since the angle is lower than 90o and the membrane is considered as
hydrophilic (Law, 2014). Zhao et al. (2011) also reported that pristine PES has a contact
angle of around 75o. Nguyen et al. (2007) measured the contact angle of commercial and
lab-made PES membranes and reported contact angle values of around 80o. In addition,
Dang et al. (2006) reported a range of contact angle, 47- 67 o for the PES membranes
they tested. Thus, the value measured in this study is reasonable.
The lower contact angle of the commercial PES membrane used in this study may
be due to the additives used in its fabrication. Table 4.9 also shows that the contact angle
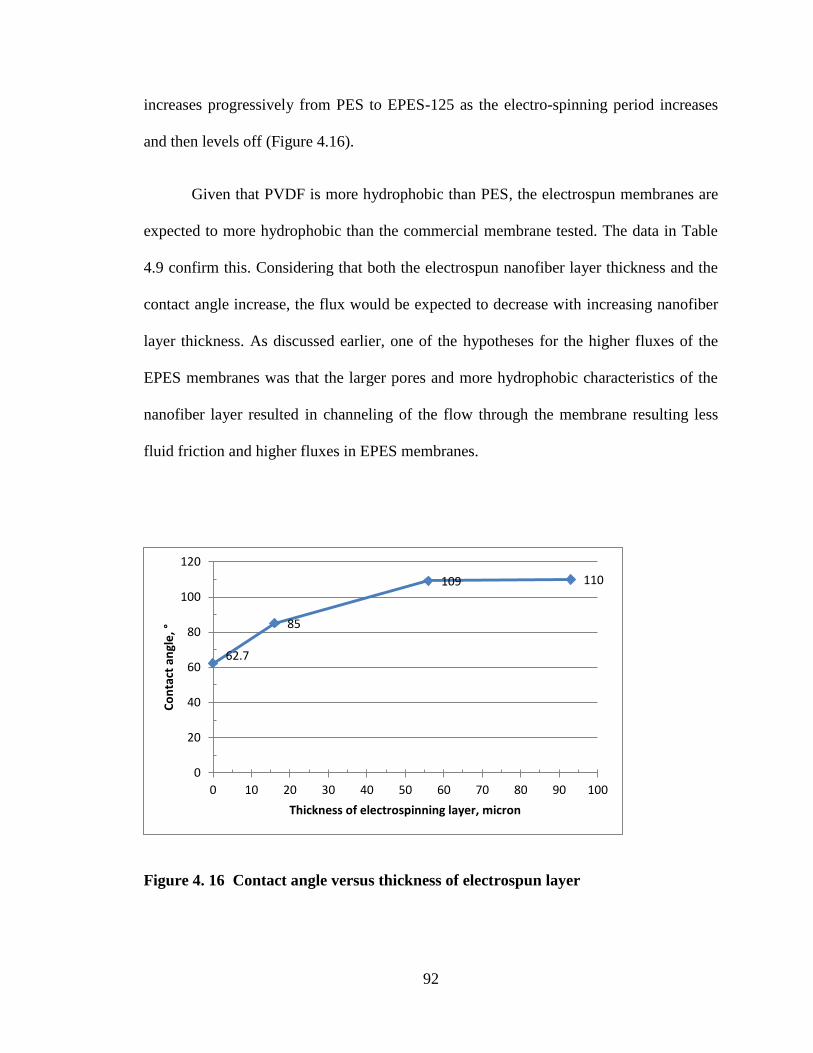
92
increases progressively from PES to EPES-125 as the electro-spinning period increases
and then levels off (Figure 4.16).
Given that PVDF is more hydrophobic than PES, the electrospun membranes are
expected to more hydrophobic than the commercial membrane tested. The data in Table
4.9 confirm this. Considering that both the electrospun nanofiber layer thickness and the
contact angle increase, the flux would be expected to decrease with increasing nanofiber
layer thickness. As discussed earlier, one of the hypotheses for the higher fluxes of the
EPES membranes was that the larger pores and more hydrophobic characteristics of the
nanofiber layer resulted in channeling of the flow through the membrane resulting less
fluid friction and higher fluxes in EPES membranes.
Figure 4. 16 Contact angle versus thickness of electrospun layer
62.7
85
109 110
0
20
40
60
80
100
120
0 10 20 30 40 50 60 70 80 90 100
Co
nta
ct a
ngl
e,
°
Thickness of electrospinning layer, micron
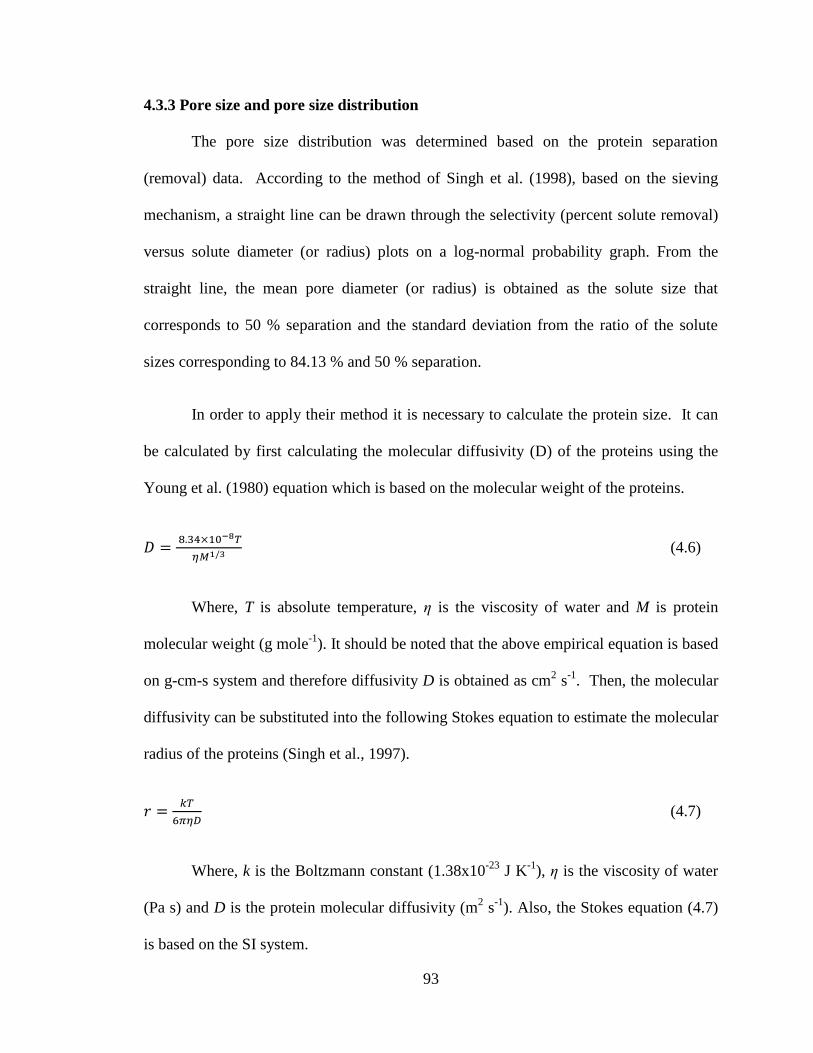
93
4.3.3 Pore size and pore size distribution
The pore size distribution was determined based on the protein separation
(removal) data. According to the method of Singh et al. (1998), based on the sieving
mechanism, a straight line can be drawn through the selectivity (percent solute removal)
versus solute diameter (or radius) plots on a log-normal probability graph. From the
straight line, the mean pore diameter (or radius) is obtained as the solute size that
corresponds to 50 % separation and the standard deviation from the ratio of the solute
sizes corresponding to 84.13 % and 50 % separation.
In order to apply their method it is necessary to calculate the protein size. It can
be calculated by first calculating the molecular diffusivity (D) of the proteins using the
Young et al. (1980) equation which is based on the molecular weight of the proteins.
𝐷 = 8.34×10⁻⁸𝑇
𝜂𝑀1/3 (4.6)
Where, T is absolute temperature, η is the viscosity of water and M is protein
molecular weight (g mole-1
). It should be noted that the above empirical equation is based
on g-cm-s system and therefore diffusivity D is obtained as cm2 s
-1. Then, the molecular
diffusivity can be substituted into the following Stokes equation to estimate the molecular
radius of the proteins (Singh et al., 1997).
𝑟 =𝑘𝑇
6𝜋𝜂𝐷 (4.7)
Where, k is the Boltzmann constant (1.38x10⁻²³
J K-1
), η is the viscosity of water
(Pa s) and D is the protein molecular diffusivity (m2 s
-1). Also, the Stokes equation (4.7)
is based on the SI system.
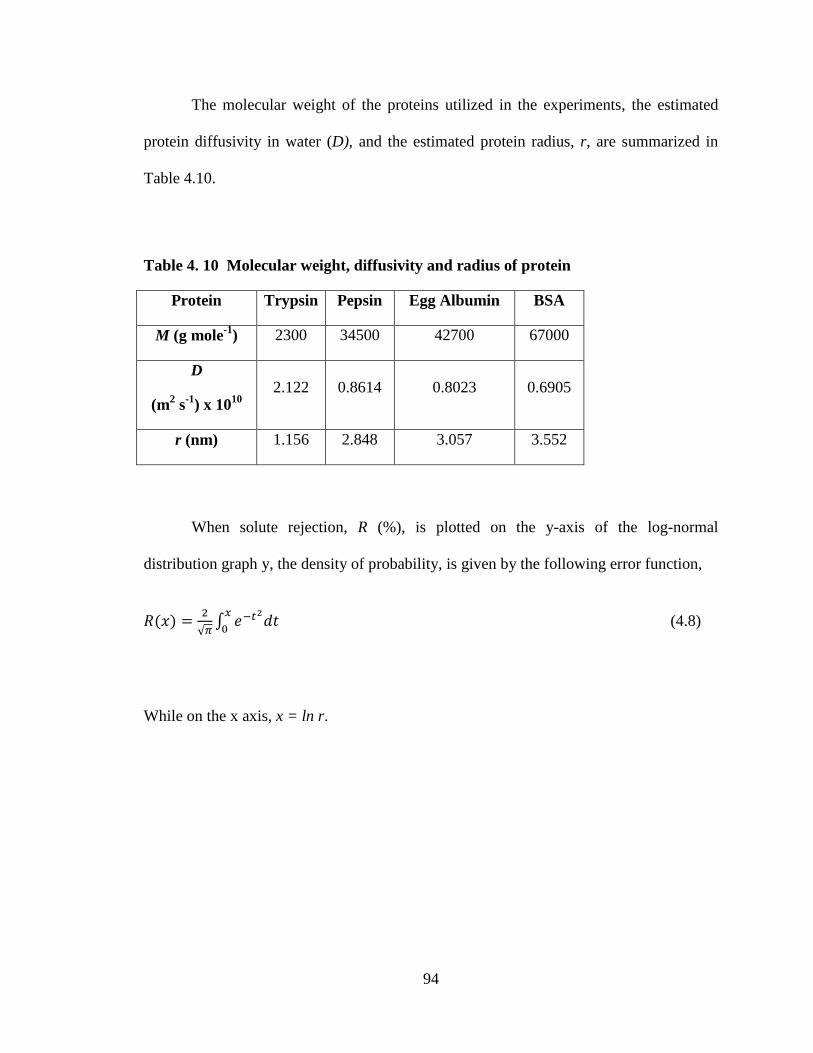
94
The molecular weight of the proteins utilized in the experiments, the estimated
protein diffusivity in water (D), and the estimated protein radius, r, are summarized in
Table 4.10.
Table 4. 10 Molecular weight, diffusivity and radius of protein
Protein Trypsin Pepsin Egg Albumin BSA
M (g mole-1
) 2300 34500 42700 67000
D
(m2 s
-1) x 10
10
2.122 0.8614 0.8023 0.6905
r (nm) 1.156 2.848 3.057 3.552
When solute rejection, R (%), is plotted on the y-axis of the log-normal
distribution graph y, the density of probability, is given by the following error function,
𝑅(𝑥) =2
√𝜋∫ 𝑒−𝑡2
𝑑𝑡𝑥
0 (4.8)
While on the x axis, x = ln r.
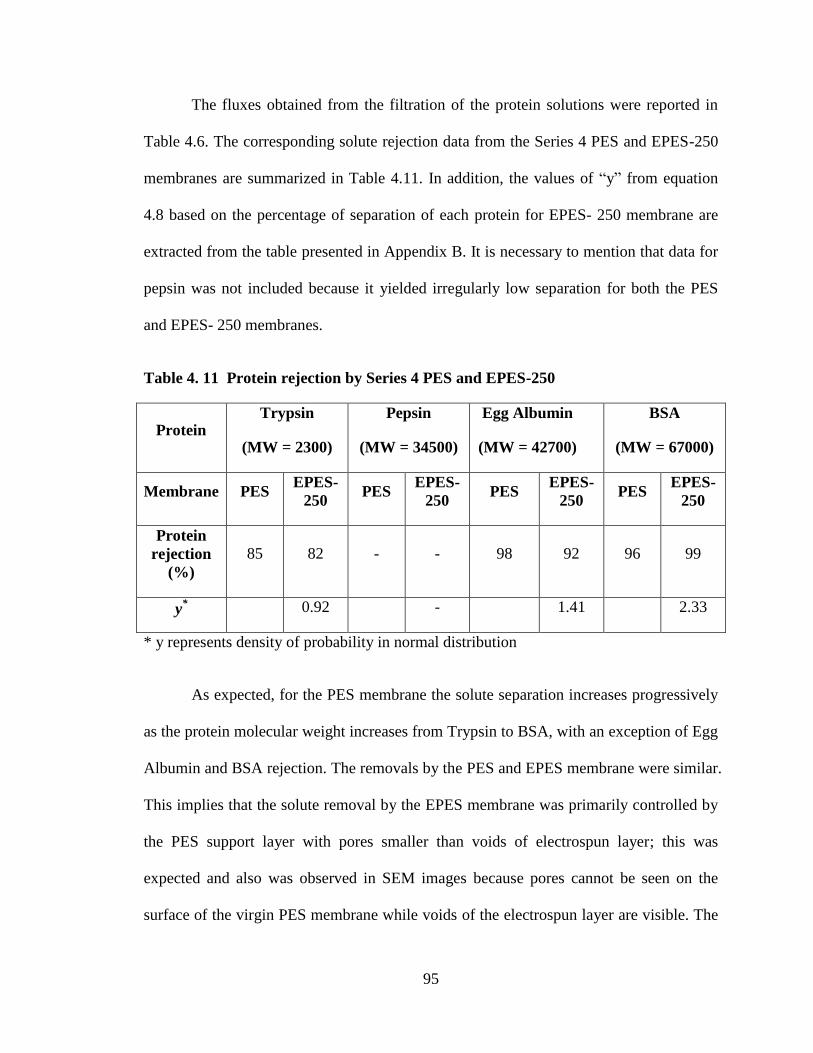
95
The fluxes obtained from the filtration of the protein solutions were reported in
Table 4.6. The corresponding solute rejection data from the Series 4 PES and EPES-250
membranes are summarized in Table 4.11. In addition, the values of “y” from equation
4.8 based on the percentage of separation of each protein for EPES- 250 membrane are
extracted from the table presented in Appendix B. It is necessary to mention that data for
pepsin was not included because it yielded irregularly low separation for both the PES
and EPES- 250 membranes.
Table 4. 11 Protein rejection by Series 4 PES and EPES-250
Protein Trypsin
(MW = 2300)
Pepsin
(MW = 34500)
Egg Albumin
(MW = 42700)
BSA
(MW = 67000)
Membrane PES EPES-
250 PES
EPES-
250 PES
EPES-
250 PES
EPES-
250
Protein
rejection
(%)
85 82 - - 98 92 96 99
y* 0.92 - 1.41 2.33
* y represents density of probability in normal distribution
As expected, for the PES membrane the solute separation increases progressively
as the protein molecular weight increases from Trypsin to BSA, with an exception of Egg
Albumin and BSA rejection. The removals by the PES and EPES membrane were similar.
This implies that the solute removal by the EPES membrane was primarily controlled by
the PES support layer with pores smaller than voids of electrospun layer; this was
expected and also was observed in SEM images because pores cannot be seen on the
surface of the virgin PES membrane while voids of the electrospun layer are visible. The
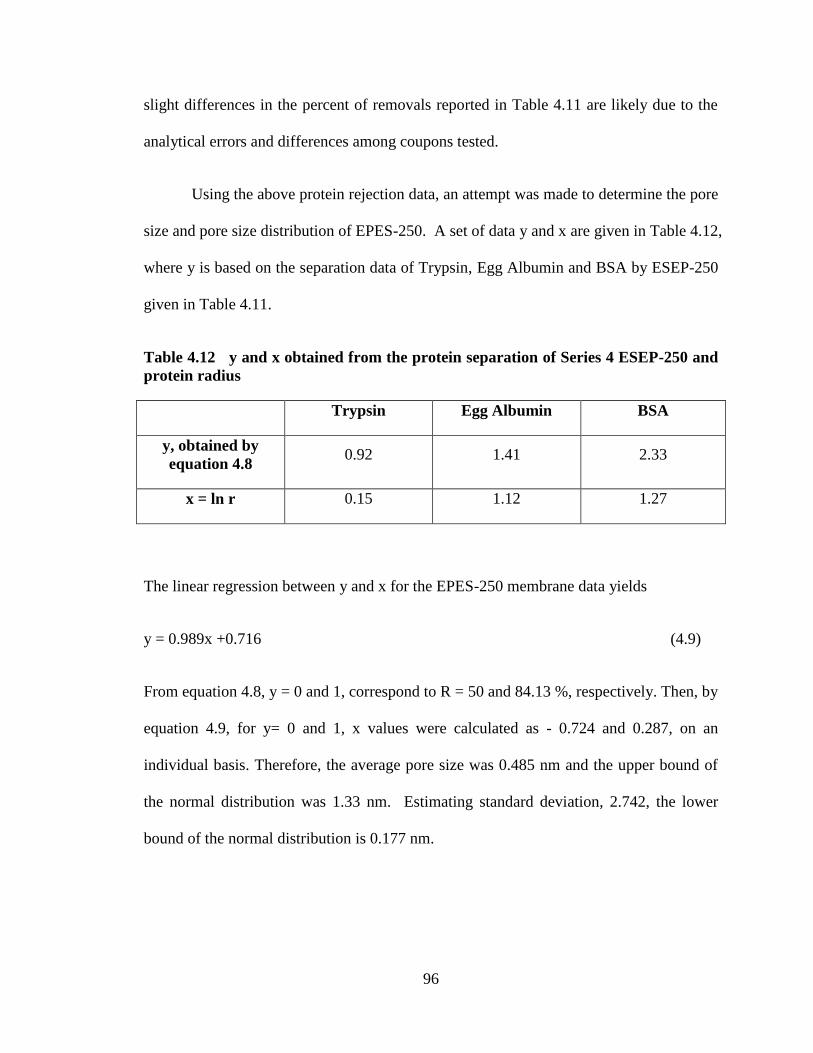
96
slight differences in the percent of removals reported in Table 4.11 are likely due to the
analytical errors and differences among coupons tested.
Using the above protein rejection data, an attempt was made to determine the pore
size and pore size distribution of EPES-250. A set of data y and x are given in Table 4.12,
where y is based on the separation data of Trypsin, Egg Albumin and BSA by ESEP-250
given in Table 4.11.
Table 4.12 y and x obtained from the protein separation of Series 4 ESEP-250 and
protein radius
Trypsin Egg Albumin BSA
y, obtained by
equation 4.8 0.92 1.41 2.33
x = ln r 0.15 1.12 1.27
The linear regression between y and x for the EPES-250 membrane data yields
y = 0.989x +0.716 (4.9)
From equation 4.8, y = 0 and 1, correspond to R = 50 and 84.13 %, respectively. Then, by
equation 4.9, for y= 0 and 1, x values were calculated as - 0.724 and 0.287, on an
individual basis. Therefore, the average pore size was 0.485 nm and the upper bound of
the normal distribution was 1.33 nm. Estimating standard deviation, 2.742, the lower
bound of the normal distribution is 0.177 nm.
97
The pore size at the lower bound seems unreasonable because it is in the sub-
nanometer range, but it can be concluded that the pore sizes are those of nano- to
ultrafiltration membranes. Since the pore size of the electrospun nanofiber layer is larger
than the proteins (see Figure 4.8 a), according to the protein rejection percent in Table
4.11, it can be concluded that the protein separation is primarily performed by the PES
sublayer, except for BSA. The nanofiber layer does not affect the structure of the base
membrane, as reported by Dobosz et al. (2017). The protein separations of EPES-250
membrane are slightly lower than those by the PES membrane presumably due to the
concentration polarization occurring in the electro-spun nanofiber layer.
Another attempt to evaluate the pore size was made applying the following pore radius
equation proposed by Kanagaraj et al. (2015).
𝑃𝑜𝑟𝑒 𝑟𝑎𝑑𝑖𝑢𝑠 = 100 × 𝑟
𝑅 (4.10)
Where r is the Stokes radius (nm) of the solute and R is the percentage of solute rejection.
Using this simple equation, pore radii for EPES- 250 are obtained as 1.38, 3.34 and 3.59
nm from Trypsin, Egg Albumin and BSA, respectively. Also, the pore size obtained by
this method depends on the solute and is larger than the average pore radius obtained by
Singh’s method.
98
Chapter 5
Conclusions and recommendations
5.1 Conclusions
From the experimental results the following conclusions can be drawn:
1) The permeate flux of a commercial PES ultrafiltration membranes was enhanced
by the coating of electro-spun PVDF nanofiber layer. It is hypothesized that the
electrospun layer makes the modified PES stronger so that its pores deform less than
those of the commercial PES membrane and/ or the larger pores of the hydrophobic
electrospun layer channel the flow, resulting in less friction and higher fluxes in
electrospun membranes.
2) The electro-spun nanofiber layer caused the fouling to be more severe than that
for the PES substrate membrane, yet, the flux of the nanofiber-coated membrane
remained higher than the pristine PES membrane during the 4h filtration period.
3) The Ottawa River water fouling of the PES substrate and nanofiber-coated
membranes was irreversible whereas the fouling caused by the BSA solutions was
reversible for the PES substrate membrane and irreversible for the nanofiber coated
membrane.
4) The thickness of the nanofiber layer increased proportionally with the electro-
spinning period.
99
5) The contact angle initially increased as the electro-spinning period was increased
and levelled for the longest electrospinning periods.
6) The separation of protein solute was governed by the PES substrate membrane
even after the coating of the nanofiber layer.
7) Based on the rejection of protein solute of various molecular sizes, it was
confirmed that the pore size and pore size distribution of electrospun PES (EPES)
membranes are in the ultrafiltration/nanofiltration range.
5.2 Recommendations
The following recommendations are made for the future work:
1) Longer filtration/fouling tests in terms of time should be carried out with OR
Water as well as with protein solutions in order to investigate the flux reduction trend and
fouling of EPES membranes and commercial PES over the time.
2) It is recommended that the electrospun membrane be also evaluated for the
filtration of solutions of hydrophilic macromolecular solutes, such as sodium alginate that
is a microbial polysaccharide as a potential foulant for drinking water treatment.
3) The unexpected behaviour of EPES-125 (lower permeate fluxes than the other
electrospun membranes) should be confirmed and explained by applying more related
experiments and using different foulants.
4) Prepare and test membranes with electrospun layers of different polymers to
determine the effect of hydrophobicity of the polymer on the flux enhancement.
100
5) Investigatation of alternative cleaning methods to achieve higher flux recoveries
for the EPES membranes.
101
References:
Al-Bastaki, N., & Abbas, A. (2001). Use of fluid instabilities to enhance membrane
performance: A review. Desalination, 136(1-3), 255-262.
Balmann, H., Nobrega,R., Aimar, P., & Sanchez, V. (1989). Transfer of dextran through
ultrafiltration membranes: A study of rejection data analyzed by gel formation
chromatography. Journal of Membrane Science, 45, 17-36.
Baker, R. W. (2012). Membrane technology and applications. Published by John Wiley
and Sons, Newark, NJ, 592.
Belfort, G., Davis, R. H., & Zydney, A. L. (1994). The behaviour of suspensions and
macromolecular solutions in crossflow microfiltration. Journal of Membrane
Science, 96, 1-58.
Bjorge, D., Daels, N., De Vrieze, S., Dejans, P., Van Camp, T., Audenaert, W.,
Westbroek, Ph., De Clerck, K., Boeckaert, Ch., & Van Hulle, S. W. H. (2010).
Initial testing of electrospun nanofibre filters in water filtration applications.
Water SA, 36(1), 151-156.
Buonomenna, M. G., Choi, S., Galiano, F., & Drioli, E. (2011). Membranes prepared via
phase inversion. Membranes for Membrane reactors: Preparation, Optimization and
Selection. Published by John Wiley and Sons, Newark, N J, 476–489.
https://doi.org/10.1002/9780470977569.ch21
Chen, A., Fan, Q., & Tian, Q. (2013). Study on dynamic of ultrafiltration membrane
materials preparing and used in drinking water treatment, International Journal of
Environmental Science and Development, 4(4), 383-385.
Chen, V., Mansouri , J., & Charlton, T. (2010). Biofouling in membrane systems ,
membrane for water treatment, Published by Wiley- VCH, Verleg, Weinheim,
Germany, 250.
Contreras, A., Kim, A., & Li, Q. (2009). Combined fouling of nanofiltration membranes:
Mechanisms and effect of organic matter. Journal of Membrane Science, 327(1-2),
87-95.
Crittenden, J. C., Trussell, R. R., Hand, D. W., Howe, K. J., & Tchobanoglous, G. (2012).
MWH's water treatment : principles and design. (Third ed.). Published by John
Wiley and Sons, Hoboken, NJ, 1901
Dang, H., Narbaitz, R.M., Matsuura, T., & Khulbe, K. (2006). A comparison of
commercial and experimental ultrafiltration membranes via surface property
analysis and fouling tests. Water Quality Research Journal of Canada, 41(1), 84-
93.
102
Dobosz, K., Kuo-Leblanc, C., Martin, T., & Schiffman, J. (2017). Ultrafiltration
membranes enhanced with electrospun nanofibers exhibit improved flux and
fouling resistance. Industrial and Engineering Chemistry Research, 56(19), 5724-
5733.
Duranceau, S. (2001). Membrane practices for water treatment. Published by AWWA,
Denver,Co, 589.
Edzwald, J. K. (2011). Water quality & treatment: a handbook on drinking water. (Sixth
ed.) Published by McGraw-Hill Education, New York, NY, 1696.
Efome, J., Rana, D., Matsuura, T., & Lan, C. (2016). Enhanced performance of PVDF
nanocomposite membrane by nanofiber coating: A membrane for sustainable
desalination through MD. Water Research, 89, 39-49.
Fane, A., & Fell, C. (1987). A review of fouling and fouling control in ultrafiltration.
Desalination, 62(C), 117-136.
Fang, X., Li, J., Li, X., Sun, X., Shen, J., Han, W., & Wang, L. (2015).
Polyethyleneimine, an effective additive for polyethersulfone ultrafiltration
membrane with enhanced permeability and selectivity. Journal of Membrane
Science, 476, 216-223.
Feng, C., Khulbe, K., Matsuura, T., Tabe, S., & Ismail, A. (2013). Preparation and
characterization of electro-spun nanofiber membranes and their possible
applications in water treatment. Separation and Purification Technology, 102,
118-135.
Field, R. (2010). Fundamentals of fouling. In R. Field, Membranes for water treatment
(Vol. 4, pp. 1-23). Published by WILEY-VCH Verlag GmbH & Co. KGaA
Weinheim, Weinheim, Germany, 1-23.
Foley, G. (2011). Adapted from PA website, dated November 2005, and National
drinking water clearing house website, dated March 1999. Membrane filtration: A
problem solving approach with MATLAB. Membrane filtration: A problem
solving approach with MATLAB, Chapter 19, Published by Cambridge
University Press, Cambridge, England, 327.
Gatenholm, P., Fell, C., & Fane, A. (1988). Influence of the membrane structure on the
composition of the deposit-layer during processing of microbial suspensions.
Desalination, 70(1-3), 363-378.
Geise, G., Lee, H.-S., Miller, D., Freeman, B., Mcgrath, j., & Paul, D. R. (2010). Water
Purificationby by Membranes: The Role of Polymer science. Polymer Science, 48,
1685- 1718.
103
Giaouris, E., Chorianopoulos, N., Skandamis, P., & Nychas, G. (2012). World ' s largest
Science , technology & medicine open access book, Salmonella: A dangerous
foodborne pathogen, Published by InTech, Rijeka, Croatia, 450.
Gopal, R., Kaur, S., Ma, Z., Chan, C., Ramakrishna, S., & Matsuura, T. (2006).
Electrospun nanofibrous filtration membrane. Journal of Membrane Science,
281(1-2), 581-586.
Huang, Z., Zhang, Y., Kotaki, M., & Ramakrishna, S. (2003). A review on polymer
nanofibers by electrospinning and their applications in nanocomposites.
Composites Science and Technology, 63(15), 2223-2253.
Idris, A., Mat Zain, N., & Noordin, M. (2007). Synthesis, characterization and
performance of asymmetric polyethersulfone (PES) ultrafiltration membranes
with polyethylene glycol of different molecular weights as additives. Desalination,
207(1-3), 324-339.
Introduction to charge retention on electrospun fibers. (2014). Retrieved (2014) from
electrospintech.com/introcharge.html
Jamshidi Gohari, R., Lau, W., Matsuura, T., & Ismail, A. (2013). Effect of surface pattern
formation on membrane fouling and its control in phase inversion process.
Journal of Membrane Science, 446, 326-331.
Jermann, D., Pronk, W., Meylan, S., & Boller, M. (2007). Interplay of different NOM
fouling mechanisms during ultrafiltration for drinking water production. Water
Research, 41(8), 1713-1722.
Kanagaraj, P., Neelakandan, S., & Nagendran, A. (2014). Poly(ether imide) membranes
modified with charged surface-modifying macromolecule - Its performance
characteristics as ultrafiltration membranes. Journal of Applied Polymer Science,
131(11), 1-8.
Kertész, S., Veszprémi, Á., László, Z., Csanádi, J., Keszthelyi-Szabó, G., & Hodúr, C.
(2015). Investigation of module vibration in ultrafiltration. Desalination and
Water Treatment, 55(10), 2836-2842.
Khamforoush, M., Pirouzram, O., & Hatami, T. (2015). The evaluation of thin film
composite membrane composed of an electrospun polyacrylonitrile nanofibrous
mid-layer for separating oil-water mixture. Desalination, 359, 14-21.
Khayet, M., & Matsuura, T. (2011). Membrane distillation: Principles and applications.
Published by Elsevier, Amsterdam, Netherland, 512.
Khulbe, K. (2008). 2 Synthetic membranes for membrane processes. Synthetic polymeric
membranes: Published by Springer-Verlag, Berlin, Germany, 5-18.
104
Ladewig, B., & Al-Shaeli, M. (2017). Fundamentals of Membrane Processes. Published
by Springer Nature Singapore Pte Ltd., Singapore, Singapore, 13-37.
Lau, W. J., & Ismail, A. F. (2011). Progress in interfacial polymerization technique on
composite membrane preparation. International proceedings of chemical, biological
and environmental engineering, 17, 173–177.
Law, K.-Y. (2014). Definitions for hydrophilicity, hydrophobicity, and
superhydrophobicity: getting the basics right. The Journal of Physical Chemistry
Letters, 5(4), 686-688.
Le-Clech, P., Chen, V., & Fane, T. (2006). Fouling in membrane bioreactors used in
wastewater treatment. Journal of Membrane Science, 284(1-2), 17-53.
Le, N. L., & Nunes, S. P. (2016). Materials and membranes technologies for water energy
sustainability. Journal of Sustainable Materials and Technologies, 7, 1-28.
Lee, J.-W., Jung, J. , Cho, Y. H., Yadav, S. K., Baek, K. Y., Park, H. B.,Hong, S. M., &
Koo, C. M. (2014). Fouling-tolerant nanofibrous polymer membranes for water
treatment. ACS Applied Materials & Interfaces, 6(16), 14600-14607.
Low, Z. X., Liu, Q., Shamsaei, E., Zhang, X., & Wang, H. (2015). Preparation and
characterization of thin-film composite membrane with nanowire-modified support
for forward osmosis process. Membranes, 5(1), 136–149.
https://doi.org/10.3390/membranes5010136
Maruf, S., Wang, L., Greenberg, A., Pellegrino, J., & Ding, Y. (2013). Use of
nanoimprinted surface patterns to mitigate colloidal deposition on ultrafiltration
membranes. Journal of Membrane Science, 428, 598-607.
Montgomery, D. C., & Runger G., C. (2011). Applied statistics and probability for
engineers (fifth ed.). Published by John Wiley & Sons, Hoboken, NJ, 811.
Mosqueda-Jimenez, D., Narbaitz, R. M., & Matsuura, T. (2004). Membrane fouling test:
Apparatus evaluation. Journal of Environmental Engineering-ASCE, 130(1), 90-
99.
Muthukumaran, S., Kentish, S., Lalchandani, S., Ashokkumar, M., Mawson, R., Stevens,
G., & Grieser, F. (2005). The optimisation of ultrasonic cleaning procedures for
dairy fouled ultrafiltration membranes. Ultrasonics Sonochemistry, 12(1-2 SPEC.
ISS.), 29-35.
Muthukumaran, S., Yang, K., Seuren, A., Kentish, S., Ashokkumar, M., Stevens, G., &
Grieser, F. (2004). The use of ultrasonic cleaning for ultrafiltration membranes in
the dairy industry. Separation and Purification Technology, 39(1-2 SPEC. ISS.),
99-107.
105
Nakao, S., Osada, H., Kurata, H., Tsuru, T., & Kimura, S. (1988). Separation of proteins
by charged ultrafiltration membranes. Desalination, 70(1-3), 191-205.
Nasreen, S., Sundarrajan, S., Nizar, S., Balamurugan, R., & Ramakrishna, S. (2013).
Advancement in electrospun nanofibrous membranes modification and their
application in water treatment. Membranes, 3(4), 266-284.
Naylor, T. V. (1996). Polymer membranes: materials, structures and separation
performance. Published by iSmithers Rapra Technology Limited, Shropshire,
England, 136.
Nguyen, A., Narbaitz, R. M., & Matsuura, T. (2007). Impacts of hydrophilic membrane
additives on the ultrafiltration of river water. Journal of Environmental
Engineering-ASCE, 133(5), 515-522.
Olson, W., Bethel, G., & Parker, C. (1977). Rapid delipidation of and Particulate removal
from human serum by membrane filtration in a tangential flow system.
Preparative Biochemistry, 7(5), 333-343.
Pezeshk, N. (2010). Modified PVDF ultrafiltration flat sheet membranes for water
treatment. MASc thesis, dept. of Civil Engineering, University of Ottawa, Ottawa,
Canada.
Pezeshk, N., Rana, D., Narbaitz, R. M., & Matsuura, T. (2012). Novel modified PVDF
ultrafiltration flat-sheet membranes. Journal of Membrane Science, 389, 280-286.
Pearce, G. (2011). UF/MF Membrane water treatment: Principles and design. Published
by Water Treatment Academy, Bangkok, Thailand, 387.
Pinnau, I. (1994). Recent advances in the formation of ultrathin polymeric membranes for
gas separations. Section title: Plastics fabrication and uses, 5(1), 733-744.
Pinnau, I., & Freeman, B. (2000). Membrane formation and modification (Vol. 744).
Published by ACS publications, Washington, DC, 361.
Rana, D., & Matsuura, T. (2010). Surface modifications for antifouling membranes.
Chemical Reviews, 110(4), 2448-2471.
Romijn, D., Brink, L. (1990). Reducing the protein fouling of polysulfone surfaces and
polysulfone ultrafiltration membranes : Optimization of the type of presorbed
layer. Desalination, 78(2), 209-233.
Schaefer, A. I.; Fane, A. G., Waite, T. D. (2005). Nanofiltration : principles and
applications. Published by Elesevier, Oxford, England, 620.
Shi, X., Tal, G., Hankins, N., & Gitis, V. (2014). Fouling and cleaning of ultrafiltration
membranes: A review. Journal of Water Process Engineering, 1, 121-138.
106
Singh, S., Khulbe, K., Matsuura, T., & Ramamurthy, P. (1998). Membrane
characterization by solute transport and atomic force microscopy. Journal of
Membrane Science, 142(1), 111-127.
Sourirajan, S., & Matsuura, T. (1985). Reverse osmosis/ultrafiltration process principles.
Published by National Research Council of Canada, Ottawa, 1113.
Tanny, G., Hauk, D., & Merin, U. (1982). Biotechnical applications of a pleated
crossflow microfiltration module. Desalination, 41(3), 299-312.
Tombácz, E., & Szekeres, M. (2006). Surface charge heterogeneity of kaolinite in
aqueous suspension in comparison with montmorillonite. Applied Clay Science,
34(1-4), 105-124.
Tombácz, E., Libor, Z., Illés, E., Majzik, A., & Klumpp, E. (2004). The role of reactive
surface sites and complexation by humic acids in the interaction of clay mineral
and iron oxide particles. Organic Geochemistry, 35(3), 257-267.
Ulbricht, M. (2006). Advanced functional polymer membranes. Polymer, 47(7), 2217-
2262.
Villaluenga, J. P. G., Khayet, M., Godino, P., Seoane, B., & Mengual J. I. (2005).
Analysis of the membrane thickness effect on the pervaporation separation of
methanol/ methyl tertiary butyl ether mixtures. Journal of Separation and
Purification Technology, 47(1-2), 80- 87
Wang, D., Lu, Q., Wei, M., & Guo, E. (2017). Electrospinning of flux-enhanced
chitosan–poly(lactic acid) nanofiber mats as a versatile platform for oil–water
separation. Journal of Applied Polymer Science, 135(6), 1-7.
Wang, R., Liu, Y., Li, B., Hsiao, B., & Chu, B. (2012). Electrospun nanofibrous
membranes for high flux microfiltration. Journal of Membrane Science, 392-393,
167-174.
Xu, B. (2015). Improved membrane pretreatment by flotation. MASc thesis, dept. of
Civil Engineering, University of Ottawa, Ottawa, Canada.
Yoon, K., Hsiao, B., & Chu, B. (2009). Formation of functional polyethersulfone
electrospun membrane for water purification by mixed solvent and oxidation
processes. Polymer, 50(13), 2893-2899.
Young, M., Carroad, P., & Bell, R. (1980). Estimation of diffusion coefficients of
proteins. Biotechnology and Bioengineering, 22(5), 947-955.
Zhang, L., Chowdhury, G., Feng, C., Matsuura, T., & Narbaitz, R. M. (2003). Effect of
surface-modifying, macromolecules and membrane morphology on fouling of
polyethersulfone ultrafiltration membranes. Journal of Applied Polymer Science,
88(14), 3132-3138.
107
Zhao, W., Huang, J., Fang, B., Nie, S., Yi, N., Su, B., Li, H., & Zhao, C. (2011).
Modification of polyethersulfone membrane by blending semi-interpenetrating
network polymeric nanoparticles. Journal of Membrane Science, 369(1-2), 258-
266.
Zhao, Y.-J., Wu, K.-F., Wang, Z.-J., Zhao, L., & Li, S.-S. (2000). Fouling and cleaning of
membrane - a literature review. Journal of Environmental Sciences, 12(2), 241-
251.
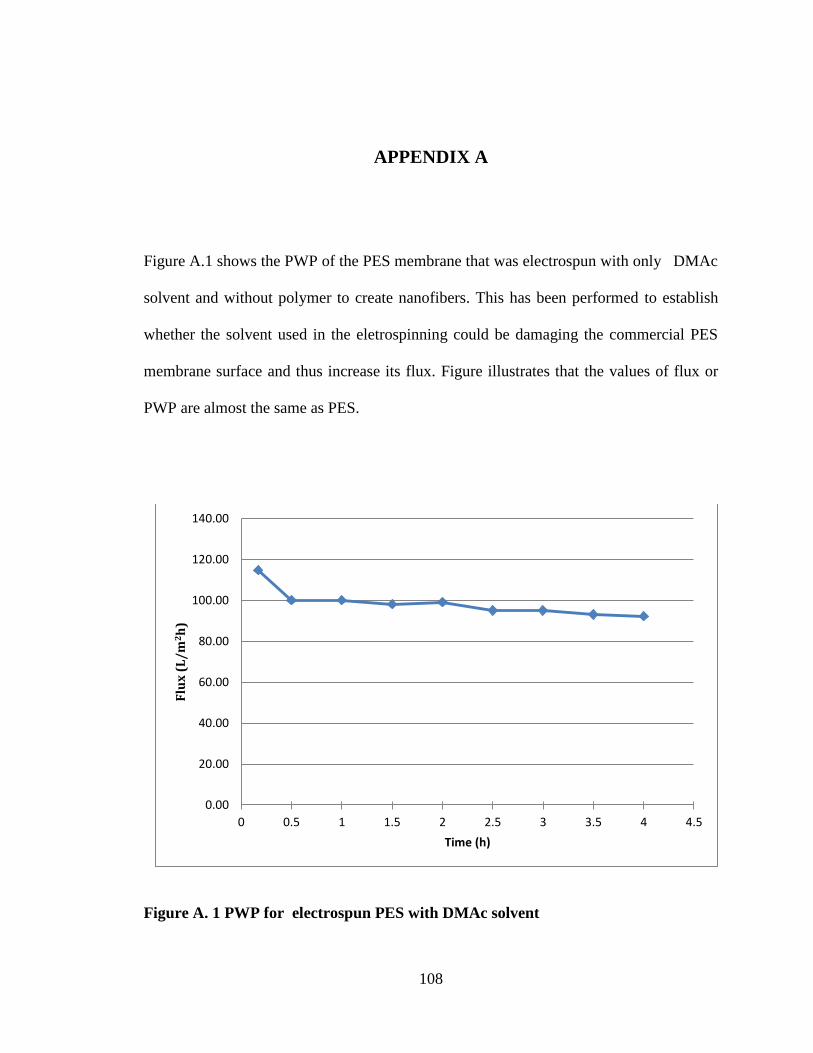
108
APPENDIX A
Figure A.1 shows the PWP of the PES membrane that was electrospun with only DMAc
solvent and without polymer to create nanofibers. This has been performed to establish
whether the solvent used in the eletrospinning could be damaging the commercial PES
membrane surface and thus increase its flux. Figure illustrates that the values of flux or
PWP are almost the same as PES.
Figure A. 1 PWP for electrospun PES with DMAc solvent
0.00
20.00
40.00
60.00
80.00
100.00
120.00
140.00
0 0.5 1 1.5 2 2.5 3 3.5 4 4.5
Flu
x (
L/
m2h
)
Time (h)
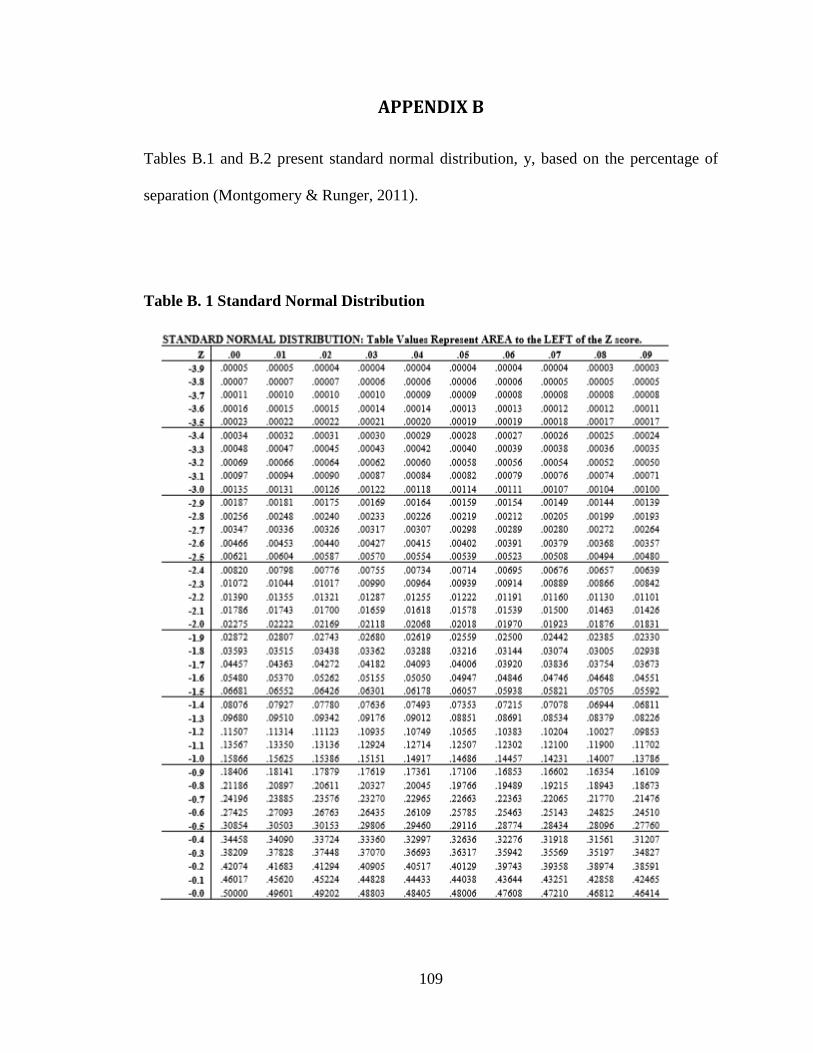
109
APPENDIX B
Tables B.1 and B.2 present standard normal distribution, y, based on the percentage of
separation (Montgomery & Runger, 2011).
Table B. 1 Standard Normal Distribution
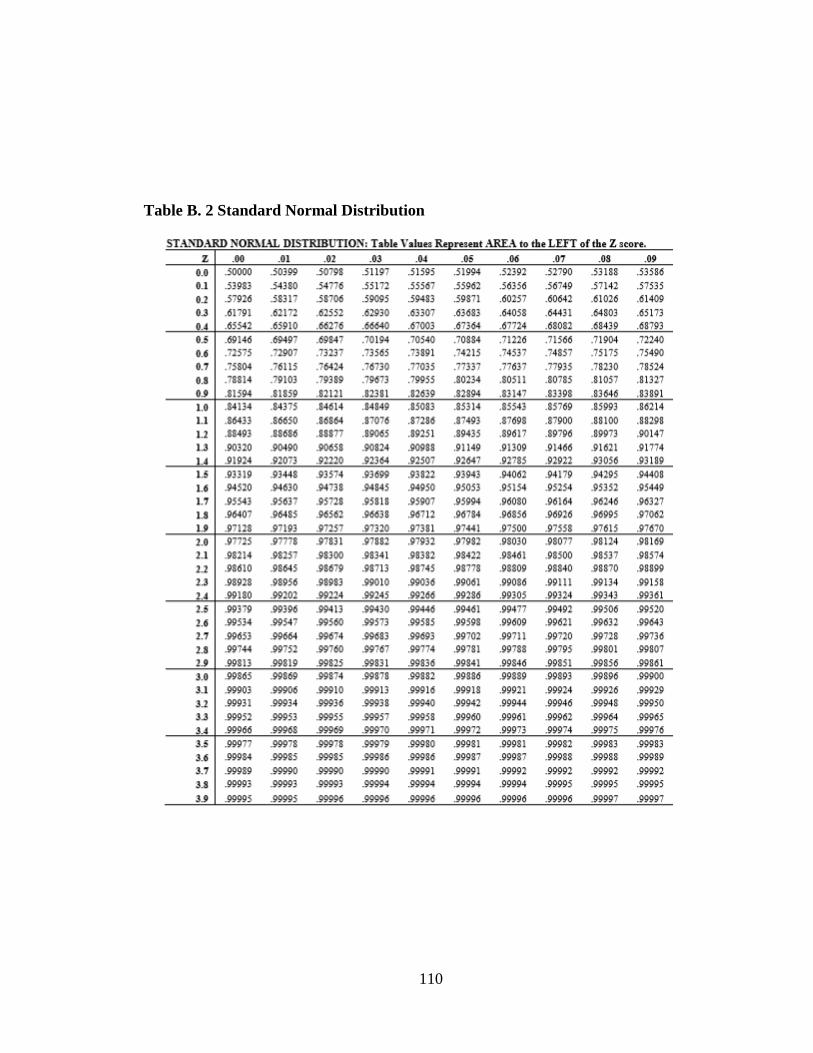
110
Table B. 2 Standard Normal Distribution