Effect of stoichiometry on the dielectric properties and ...lts.fzu.cz/pdfpub/13-apl.pdf · Effect...
5
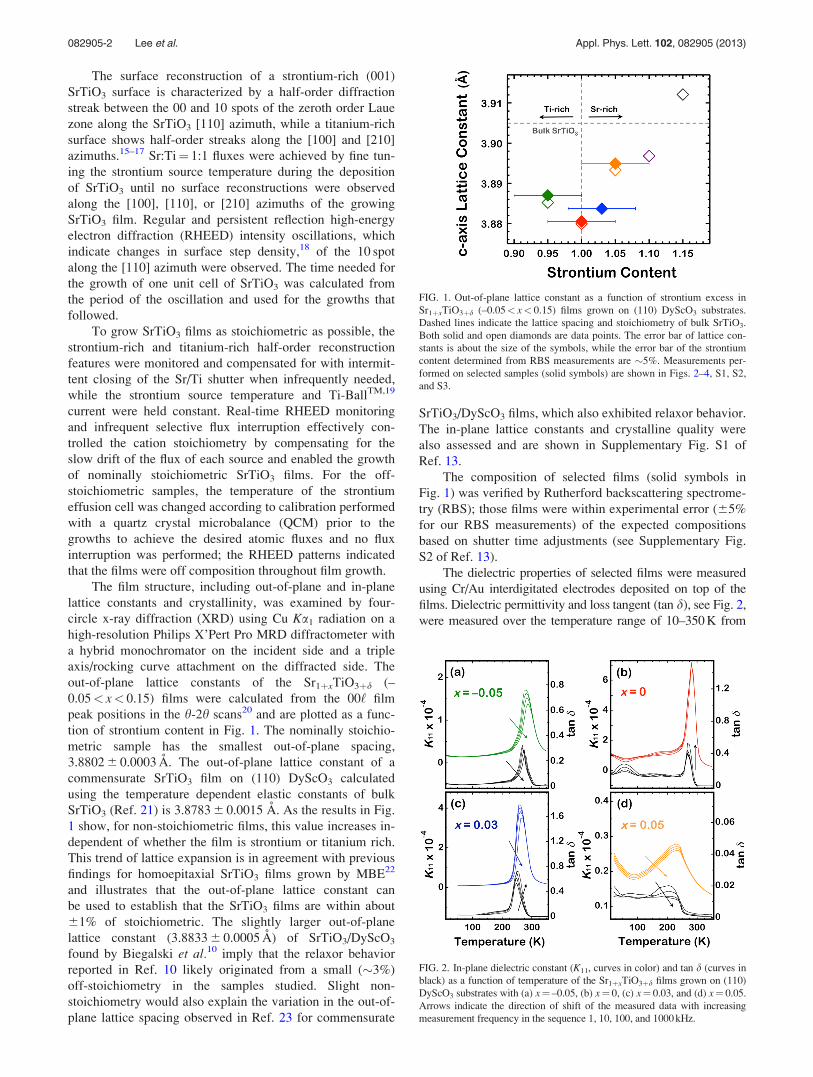
Effect of stoichiometry on the dielectric properties and soft mode behavior of strained epitaxial SrTiO 3 thin films on DyScO 3 substrates Che-Hui Lee, 1,2 Volodymyr Skoromets, 3 Michael D. Biegalski, 4 Shiming Lei, 2 Ryan Haislmaier, 2 Margitta Bernhagen, 5 Reinhard Uecker, 5 Xiaoxing Xi, 6 Venkatraman Gopalan, 2 Xavier Mart ı, 3,7 Stanislav Kamba, 3 Petr Ku zel, 3 and Darrell G. Schlom 1,8,a) 1 Department of Materials Science and Engineering, Cornell University, Ithaca, New York 14853, USA 2 Department of Materials Science and Engineering, Pennsylvania State University, University Park, Pennsylvania 16802, USA 3 Institute of Physics, ASCR, Na Slovance 2, 182 21 Prague 8, Czech Republic 4 Center for Nanophase Materials Sciences, Oak Ridge National Laboratory, Oak Ridge, Tennessee 37831, USA 5 Leibniz Institute for Crystal Growth, Max-Born-Straße 2, D-12489 Berlin, Germany 6 Department of Physics, Temple University, Philadelphia, Pennsylvania 19122, USA 7 Department of Physics, Faculty of Mathematics and Physics, Charles University, Prague, Czech Republic 8 Kavli Institute at Cornell for Nanoscale Science, Ithaca, New York 14853, USA (Received 3 December 2012; accepted 12 February 2013; published online 1 March 2013) The effect of stoichiometry on the dielectric properties and soft mode behavior of strained epitaxial Sr 1þx TiO 3þd films grown on DyScO 3 substrates is reported. Direct comparisons between nominally stoichiometric and non-stoichiometric films have been performed through measurements of lattice parameters, temperature-dependent permittivities, second harmonic generation, and terahertz dielectric spectra. The nominally stoichiometric film shows dispersion-free low-frequency permittivity with a sharp maximum and pronounced soft mode behavior. Our results suggest that strained perfectly stoichiometric SrTiO 3 films should not show relaxor behavior and that relaxor behavior emerges from defect dipoles that arise from non-stoichiometry in the highly polarizable strained SrTiO 3 matrix. V C 2013 American Institute of Physics.[http://dx.doi.org/10.1063/1.4793649] Pure bulk SrTiO 3 is a quantum paraelectric material at low temperatures where zero-point motion of the titanium ions suppresses the ferroelectric transition, 1 leading to so-called incipient ferroelectric behavior. 2 The static dielec- tric constant of single crystalline SrTiO 3 is around 300 at room temperature and rapidly increases upon cooling, satu- rating at near 24 000 at 4 K. 1 This delicate quantum paraelec- tric state can be easily upset by small perturbations such as impurity doping, 3,4 oxygen isotope substitution, 5 electric field, 6,7 and mechanical stress. 8 Biaxial tensile strain has been used to induce room-temperature ferroelectricity in SrTiO 3 thin films; 9 however, the dielectric constant and loss of such strained films were found to depend on frequency in a way consistent with them being relaxor ferroelectrics. 10,11 Although relaxor behavior was unexpected, it was pro- posed that all SrTiO 3 films and bulk crystals are relaxor ferro- electrics. 12 The origin of the relaxor behavior was attributed to pre-existing polar nanoregions originating from unintentional strontium non-stoichiometry in nominally stoichiometric sam- ples. 12 If this hypothesis is correct, precise composition control is critical to obtain the intrinsic and desirable properties of SrTiO 3 in both bulk and thin film forms, e.g., high dielectric permittivity, low dielectric loss, low leakage current, low fa- tigue, and dispersion-free permittivity. In this letter, we investigate the effect of stoichiometry on the dielectric properties and soft mode behavior of strained epitaxial Sr 1þx TiO 3þd (–0.05 < x < 0.05) films. The films are grown on DyScO 3 substrates, the same system in which relaxor ferroelectricity in the vicinity of room temper- ature was observed. 9–11 Although precise stoichiometry is difficult to measure in thin films, the dielectric properties were observed to change noticeably in the vicinity of stoichi- ometric SrTiO 3 . Films that were measurably off in stoichi- ometry (either strontium-rich or strontium-poor) showed relaxor ferroelectric behavior. In contrast, a predominantly displacive ferroelectric phase transition (and what we believe to be the intrinsic properties of strained SrTiO 3 ) was observed in nominally stoichiometric films, i.e., films with no detectable deviation from stoichiometric by our measure- ment methods. 50 nm thick Sr 1þx TiO 3þd films were grown on well- oriented (60.1 ) (110) DyScO 3 substrates by codeposition from strontium, titanium, and O 2 þ10% O 3 molecular beams in a Veeco GEN10 oxide molecular-beam epitaxy (MBE) system. The oxidant background pressure (O 2 þ10% O 3 ) was maintained at 5 10 –7 Torr during and after growth until the sample cooled below 200 C to minimize oxygen vacancies. The substrate temperature, measured by an optical pyrometer, was held at 700 C during growth. Additional details on film growth and in situ calibration are given in Supplementary Fig. S1 of Ref. 13. The (110) DyScO 3 sub- strate has an average in-plane pseudocubic lattice constant of 3.949 A ˚ at room temperature, 14 about 1% larger than SrTiO 3 . This allows for the growth of thin coherently strained SrTiO 3 films, in which the ferroelectric phase is stabilized by biaxial tensile strain and the transition temperature is promoted to the vicinity of room temperature. 9 a) Electronic mail: [email protected]. 0003-6951/2013/102(8)/082905/5/$30.00 V C 2013 American Institute of Physics 102, 082905-1 APPLIED PHYSICS LETTERS 102, 082905 (2013)
Transcript of Effect of stoichiometry on the dielectric properties and ...lts.fzu.cz/pdfpub/13-apl.pdf · Effect...
Effect of stoichiometry on the dielectric properties and soft mode behaviorof strained epitaxial SrTiO3 thin films on DyScO3 substrates
Che-Hui Lee,1,2 Volodymyr Skoromets,3 Michael D. Biegalski,4 Shiming Lei,2
Ryan Haislmaier,2 Margitta Bernhagen,5 Reinhard Uecker,5 Xiaoxing Xi,6
Venkatraman Gopalan,2 Xavier Mart�ı,3,7 Stanislav Kamba,3 Petr Ku�zel,3
and Darrell G. Schlom1,8,a)
1Department of Materials Science and Engineering, Cornell University, Ithaca, New York 14853, USA2Department of Materials Science and Engineering, Pennsylvania State University,University Park, Pennsylvania 16802, USA3Institute of Physics, ASCR, Na Slovance 2, 182 21 Prague 8, Czech Republic4Center for Nanophase Materials Sciences, Oak Ridge National Laboratory,Oak Ridge, Tennessee 37831, USA5Leibniz Institute for Crystal Growth, Max-Born-Straße 2, D-12489 Berlin, Germany6Department of Physics, Temple University, Philadelphia, Pennsylvania 19122, USA7Department of Physics, Faculty of Mathematics and Physics, Charles University, Prague, Czech Republic8Kavli Institute at Cornell for Nanoscale Science, Ithaca, New York 14853, USA
(Received 3 December 2012; accepted 12 February 2013; published online 1 March 2013)
The effect of stoichiometry on the dielectric properties and soft mode behavior of strained epitaxial
Sr1þxTiO3þd films grown on DyScO3 substrates is reported. Direct comparisons between nominally
stoichiometric and non-stoichiometric films have been performed through measurements of lattice
parameters, temperature-dependent permittivities, second harmonic generation, and terahertz dielectric
spectra. The nominally stoichiometric film shows dispersion-free low-frequency permittivity with a
sharp maximum and pronounced soft mode behavior. Our results suggest that strained perfectly
stoichiometric SrTiO3 films should not show relaxor behavior and that relaxor behavior emerges
from defect dipoles that arise from non-stoichiometry in the highly polarizable strained SrTiO3 matrix.VC 2013 American Institute of Physics. [http://dx.doi.org/10.1063/1.4793649]
Pure bulk SrTiO3 is a quantum paraelectric material at
low temperatures where zero-point motion of the titanium
ions suppresses the ferroelectric transition,1 leading to
so-called incipient ferroelectric behavior.2 The static dielec-
tric constant of single crystalline SrTiO3 is around 300 at
room temperature and rapidly increases upon cooling, satu-
rating at near 24 000 at 4 K.1 This delicate quantum paraelec-
tric state can be easily upset by small perturbations such as
impurity doping,3,4 oxygen isotope substitution,5 electric
field,6,7 and mechanical stress.8 Biaxial tensile strain has
been used to induce room-temperature ferroelectricity in
SrTiO3 thin films;9 however, the dielectric constant and loss
of such strained films were found to depend on frequency in
a way consistent with them being relaxor ferroelectrics.10,11
Although relaxor behavior was unexpected, it was pro-
posed that all SrTiO3 films and bulk crystals are relaxor ferro-
electrics.12 The origin of the relaxor behavior was attributed to
pre-existing polar nanoregions originating from unintentional
strontium non-stoichiometry in nominally stoichiometric sam-
ples.12 If this hypothesis is correct, precise composition control
is critical to obtain the intrinsic and desirable properties of
SrTiO3 in both bulk and thin film forms, e.g., high dielectric
permittivity, low dielectric loss, low leakage current, low fa-
tigue, and dispersion-free permittivity.
In this letter, we investigate the effect of stoichiometry
on the dielectric properties and soft mode behavior of
strained epitaxial Sr1þxTiO3þd (–0.05 < x < 0.05) films. The
films are grown on DyScO3 substrates, the same system in
which relaxor ferroelectricity in the vicinity of room temper-
ature was observed.9–11 Although precise stoichiometry is
difficult to measure in thin films, the dielectric properties
were observed to change noticeably in the vicinity of stoichi-
ometric SrTiO3. Films that were measurably off in stoichi-
ometry (either strontium-rich or strontium-poor) showed
relaxor ferroelectric behavior. In contrast, a predominantly
displacive ferroelectric phase transition (and what we believe
to be the intrinsic properties of strained SrTiO3) was
observed in nominally stoichiometric films, i.e., films with
no detectable deviation from stoichiometric by our measure-
ment methods.
50 nm thick Sr1þxTiO3þd films were grown on well-
oriented (60.1�) (110) DyScO3 substrates by codeposition
from strontium, titanium, and O2þ�10% O3 molecular
beams in a Veeco GEN10 oxide molecular-beam epitaxy
(MBE) system. The oxidant background pressure (O2þ�10%
O3) was maintained at 5� 10–7 Torr during and after growth
until the sample cooled below 200 �C to minimize oxygen
vacancies. The substrate temperature, measured by an optical
pyrometer, was held at 700 �C during growth. Additional
details on film growth and in situ calibration are given
in Supplementary Fig. S1 of Ref. 13. The (110) DyScO3 sub-
strate has an average in-plane pseudocubic lattice constant of
�3.949 A at room temperature,14 about 1% larger than
SrTiO3. This allows for the growth of thin coherently strained
SrTiO3 films, in which the ferroelectric phase is stabilized by
biaxial tensile strain and the transition temperature is promoted
to the vicinity of room temperature.9a)Electronic mail: [email protected].
0003-6951/2013/102(8)/082905/5/$30.00 VC 2013 American Institute of Physics102, 082905-1
APPLIED PHYSICS LETTERS 102, 082905 (2013)
The surface reconstruction of a strontium-rich (001)
SrTiO3 surface is characterized by a half-order diffraction
streak between the 00 and 10 spots of the zeroth order Laue
zone along the SrTiO3 [110] azimuth, while a titanium-rich
surface shows half-order streaks along the [100] and [210]
azimuths.15–17 Sr:Ti¼ 1:1 fluxes were achieved by fine tun-
ing the strontium source temperature during the deposition
of SrTiO3 until no surface reconstructions were observed
along the [100], [110], or [210] azimuths of the growing
SrTiO3 film. Regular and persistent reflection high-energy
electron diffraction (RHEED) intensity oscillations, which
indicate changes in surface step density,18 of the 10 spot
along the [110] azimuth were observed. The time needed for
the growth of one unit cell of SrTiO3 was calculated from
the period of the oscillation and used for the growths that
followed.
To grow SrTiO3 films as stoichiometric as possible, the
strontium-rich and titanium-rich half-order reconstruction
features were monitored and compensated for with intermit-
tent closing of the Sr/Ti shutter when infrequently needed,
while the strontium source temperature and Ti-BallTM,19
current were held constant. Real-time RHEED monitoring
and infrequent selective flux interruption effectively con-
trolled the cation stoichiometry by compensating for the
slow drift of the flux of each source and enabled the growth
of nominally stoichiometric SrTiO3 films. For the off-
stoichiometric samples, the temperature of the strontium
effusion cell was changed according to calibration performed
with a quartz crystal microbalance (QCM) prior to the
growths to achieve the desired atomic fluxes and no flux
interruption was performed; the RHEED patterns indicated
that the films were off composition throughout film growth.
The film structure, including out-of-plane and in-plane
lattice constants and crystallinity, was examined by four-
circle x-ray diffraction (XRD) using Cu Ka1 radiation on a
high-resolution Philips X’Pert Pro MRD diffractometer with
a hybrid monochromator on the incident side and a triple
axis/rocking curve attachment on the diffracted side. The
out-of-plane lattice constants of the Sr1þxTiO3þd (–
0.05< x< 0.15) films were calculated from the 00‘ film
peak positions in the h-2h scans20 and are plotted as a func-
tion of strontium content in Fig. 1. The nominally stoichio-
metric sample has the smallest out-of-plane spacing,
3.8802 6 0.0003 A. The out-of-plane lattice constant of a
commensurate SrTiO3 film on (110) DyScO3 calculated
using the temperature dependent elastic constants of bulk
SrTiO3 (Ref. 21) is 3.8783 6 0.0015 A. As the results in Fig.
1 show, for non-stoichiometric films, this value increases in-
dependent of whether the film is strontium or titanium rich.
This trend of lattice expansion is in agreement with previous
findings for homoepitaxial SrTiO3 films grown by MBE22
and illustrates that the out-of-plane lattice constant can
be used to establish that the SrTiO3 films are within about
61% of stoichiometric. The slightly larger out-of-plane
lattice constant (3.8833 6 0.0005 A) of SrTiO3/DyScO3
found by Biegalski et al.10 imply that the relaxor behavior
reported in Ref. 10 likely originated from a small (�3%)
off-stoichiometry in the samples studied. Slight non-
stoichiometry would also explain the variation in the out-of-
plane lattice spacing observed in Ref. 23 for commensurate
SrTiO3/DyScO3 films, which also exhibited relaxor behavior.
The in-plane lattice constants and crystalline quality were
also assessed and are shown in Supplementary Fig. S1 of
Ref. 13.
The composition of selected films (solid symbols in
Fig. 1) was verified by Rutherford backscattering spectrome-
try (RBS); those films were within experimental error (65%
for our RBS measurements) of the expected compositions
based on shutter time adjustments (see Supplementary Fig.
S2 of Ref. 13).
The dielectric properties of selected films were measured
using Cr/Au interdigitated electrodes deposited on top of the
films. Dielectric permittivity and loss tangent (tan d), see Fig. 2,
were measured over the temperature range of 10–350 K from
FIG. 1. Out-of-plane lattice constant as a function of strontium excess in
Sr1þxTiO3þd (–0.05< x< 0.15) films grown on (110) DyScO3 substrates.
Dashed lines indicate the lattice spacing and stoichiometry of bulk SrTiO3.
Both solid and open diamonds are data points. The error bar of lattice con-
stants is about the size of the symbols, while the error bar of the strontium
content determined from RBS measurements are �5%. Measurements per-
formed on selected samples (solid symbols) are shown in Figs. 2–4, S1, S2,
and S3.
FIG. 2. In-plane dielectric constant (K11, curves in color) and tan d (curves in
black) as a function of temperature of the Sr1þxTiO3þd films grown on (110)
DyScO3 substrates with (a) x¼ –0.05, (b) x¼ 0, (c) x¼ 0.03, and (d) x¼ 0.05.
Arrows indicate the direction of shift of the measured data with increasing
measurement frequency in the sequence 1, 10, 100, and 1000 kHz.
082905-2 Lee et al. Appl. Phys. Lett. 102, 082905 (2013)

1 kHz to 1 MHz using an Agilent E4980A high precision LCR
meter with a Lake Shore 332 temperature controller. The
in-plane dielectric constant (K11) was calculated using a partial
capacitance approach.24 The peak value (K11,max) �70 000 at
280 K of the x¼ 0 nominally stoichiometric sample is much
higher than those of the x¼ –0.05 and x¼ 0.03 off-
stoichiometric samples. In addition, the temperature of the per-
mittivity maximum (Tmax) of the x¼ –0.05 and x¼ 0.03 sam-
ples are �280 K and �265 K, respectively, and frequency
dependent, while Tc of the x¼ 0 sample is �280 K without fre-
quency dispersion. The paraelectric-to-ferroelectric transition
temperature (Tc) of the nominally stoichiometric sample is in
agreement with the predicted transition temperature from ther-
modynamic analysis.25
The ferroelectric transition in SrTiO3 is driven by the
soft mode, the transverse optical phonon with the lowest fre-
quency. According to lattice dynamical theory and the
Lyddane-Sachs-Teller relation, the dielectric permittivity is
inversely proportional to the square of the soft mode fre-
quency.26 Therefore, the degraded permittivity in the off-
stoichiometric SrTiO3 sample could be attributed to the
defect-sensitive soft mode behavior in the film (discussed
below). The structural disorder coming from the insertion of
extra SrO monolayers at random positions along {100}
SrTiO3 planes (i.e., Ruddlesden-Popper defects27) that shift
and terminate continuous Ti–O–Ti chains between TiO6
octahedra could be responsible for the lower observed
K11,max and Tmax. The structural relaxation in strontium-rich
samples is also a reason for the lower Tmax.
The presence of frequency dispersion in the vicinity of
the K11(T) peak is a universal signature of relaxor ferroelec-
trics. Compositional disorder and related random electric
fields are believed to cause the relaxor behavior of mixed
ABO3 perovskite oxides such as Pb(Mg1/3Nb2/3)O3 and
La-doped PbZr1�xTixO3.28 Relaxor behavior can also be
induced by introducing impurities into an incipient ferroelec-
tric (e.g., Ca-doped KTa1�xNbxO3,29 Ca- and Bi-doped
SrTiO33,4). or into a ferroelectric (e.g., Ce-doped BaTiO3
30).
Point defects, including impurity-oxygen vacancy clusters or
anti-site defects, can lead to the formation of dipolar entities
which polarize a small volume around them and form polar
nanoregions.28 These polar nanoregions can be reduced in
number by decreasing the point defect concentration as
occurs as the SrTiO3 films get closer to being stoichiometric;
such improvement would lead to a flattening of the permit-
tivity dispersion at low frequencies [Fig. 2(b)].
It is worthy to note that the frequency dependence of tan dbehaves differently in the films with x¼ –0.05 and x¼ 0.05
(Figs. 2(a) and 2(d)) than it does for the films with x¼ 0 and
x¼ 0.03 (Figs. 2(b) and 2(c)). For more stoichiometric films,
the maximum in tan d increases with increasing measurement
frequency. This is typical of a broad relaxation, which either
slows down or broadens towards lower frequencies with
decreasing temperature.31 The opposite trend is observed for
samples with x¼ –0.05 and x¼ 0.05, i.e., for samples with a
higher concentration of point defects. The observed behavior
may stem from the presence of a second low-frequency relaxa-
tion with the mean relaxation frequency below the spectral
range of our measurement, which slows down during cooling.
Such relaxation can be attributed to defects.
The onset of the absence of inversion symmetry was
probed optically by second harmonic generation (SHG).
SHG signal as a function of temperature of selected films
(solid symbols in Fig. 1) was measured on cooling and heat-
ing (Fig. 3). No SHG signal was observed from the bare
DyScO3 substrate indicating that the changes in the SHG sig-
nal only came from the Sr1þxTiO3þd thin films. In order to
make a relative comparison between different samples, the
incident laser power was kept constant. Table I summarizes
the Tmax measured at 1 kHz and the onset temperature of the
SHG signal (TSHG) measured on cooling and heating. While
cooling through TSHG, polar nanoregions start to nucleate
and the center of symmetry is locally broken in the film.
Such behavior is usually observed in relaxor materials at
their Burns temperature.28 Polar nanoregions have, however,
also been observed above Tc in ferroelectric BaTiO3
crystals.32 In this sense, it is not surprising that we observe
TSHG > Tmax even for the nominally stoichiometric sample.
In addition, the nominally stoichiometric film [Fig. 3(b)]
shows a discontinuous change in the slope of the SHG signal
versus temperature as well as a large hysteresis effect. The
sharp transition indicates that there is a critical onset of the
ferroelectric transition that is not smeared by the presence of
defects. The disappearance of the SHG signal at higher tem-
peratures on heating can be explained by the greater correla-
tion between polar nanoregions due to the reduced defect
density. The pronounced SHG hysteresis indicates that the
long-range polar order sets in more readily than in non-
stoichiometric samples where it is gradual. Since no discon-
tinuous jump is observed in the SHG signal of the nominally
stoichiometric sample, the transition is still second order, but
the Tc is well defined under heating and cooling, with a con-
comitant large hysteresis.
To characterize the soft mode, optical transmission meas-
urements were made in the THz-frequency regime on two of
the films (those with x¼ 0 and x¼ 0.03). The THz measure-
ments were performed using a custom-made THz time-domain
FIG. 3. SHG signal as a function of temperature of the Sr1þxTiO3þd films
grown on (110) DyScO3 substrates with (a) x¼ –0.05, (b) x¼ 0, (c) x¼ 0.03,
and (d) x¼ 0.05. Red arrows indicate the heating process. Blue arrows indi-
cate the cooling process. All of the SHG signal measurements were per-
formed at the same laser power intensity.
082905-3 Lee et al. Appl. Phys. Lett. 102, 082905 (2013)
spectrometer.33 The in-plane complex dielectric response of
the thin films was calculated36 from the complex transmittance
spectra measured in an optical cryostat or in a furnace.
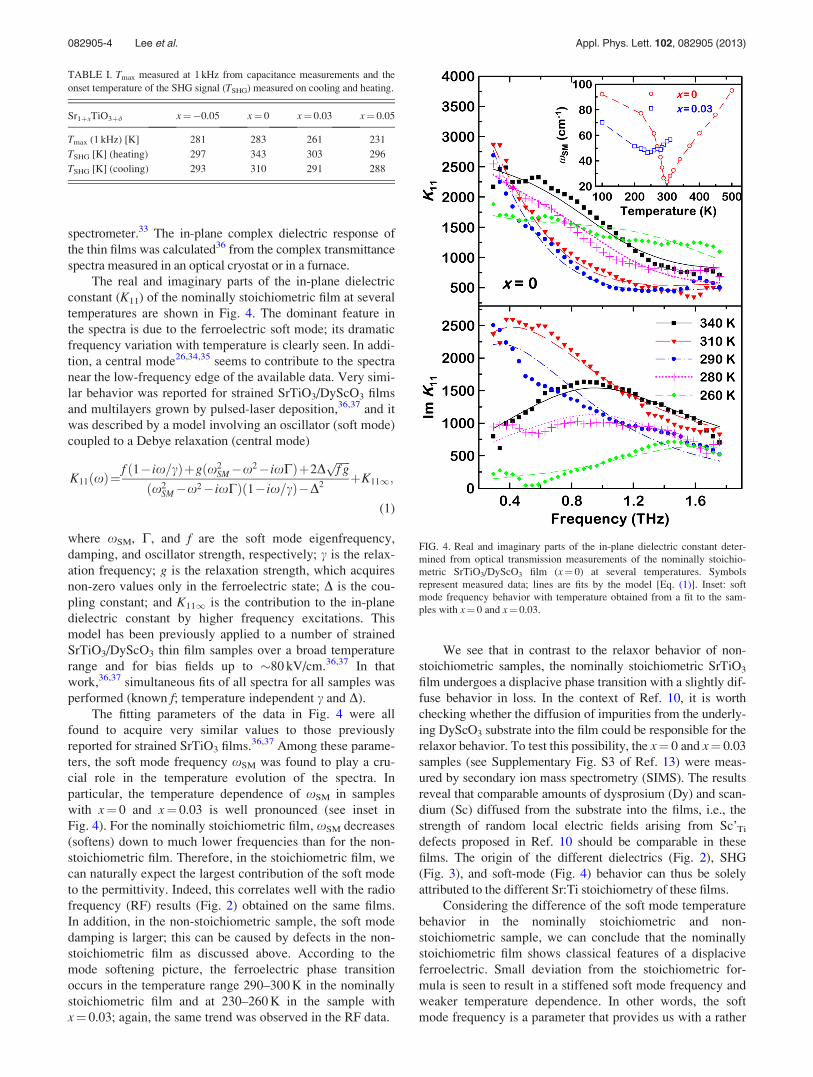
The real and imaginary parts of the in-plane dielectric
constant (K11) of the nominally stoichiometric film at several
temperatures are shown in Fig. 4. The dominant feature in
the spectra is due to the ferroelectric soft mode; its dramatic
frequency variation with temperature is clearly seen. In addi-
tion, a central mode26,34,35 seems to contribute to the spectra
near the low-frequency edge of the available data. Very simi-
lar behavior was reported for strained SrTiO3/DyScO3 films
and multilayers grown by pulsed-laser deposition,36,37 and it
was described by a model involving an oscillator (soft mode)
coupled to a Debye relaxation (central mode)
K11ðxÞ¼f ð1� ix=cÞþgðx2
SM�x2� ixCÞþ2Dffiffiffiffiffi
f gp
ðx2SM�x2� ixCÞð1� ix=cÞ�D2
þK111;
(1)
where xSM, C, and f are the soft mode eigenfrequency,
damping, and oscillator strength, respectively; c is the relax-
ation frequency; g is the relaxation strength, which acquires
non-zero values only in the ferroelectric state; D is the cou-
pling constant; and K111 is the contribution to the in-plane
dielectric constant by higher frequency excitations. This
model has been previously applied to a number of strained
SrTiO3/DyScO3 thin film samples over a broad temperature
range and for bias fields up to �80 kV/cm.36,37 In that
work,36,37 simultaneous fits of all spectra for all samples was
performed (known f; temperature independent c and D).
The fitting parameters of the data in Fig. 4 were all
found to acquire very similar values to those previously
reported for strained SrTiO3 films.36,37 Among these parame-
ters, the soft mode frequency xSM was found to play a cru-
cial role in the temperature evolution of the spectra. In
particular, the temperature dependence of xSM in samples
with x¼ 0 and x¼ 0.03 is well pronounced (see inset in
Fig. 4). For the nominally stoichiometric film, xSM decreases
(softens) down to much lower frequencies than for the non-
stoichiometric film. Therefore, in the stoichiometric film, we
can naturally expect the largest contribution of the soft mode
to the permittivity. Indeed, this correlates well with the radio
frequency (RF) results (Fig. 2) obtained on the same films.
In addition, in the non-stoichiometric sample, the soft mode
damping is larger; this can be caused by defects in the non-
stoichiometric film as discussed above. According to the
mode softening picture, the ferroelectric phase transition
occurs in the temperature range 290–300 K in the nominally
stoichiometric film and at 230–260 K in the sample with
x¼ 0.03; again, the same trend was observed in the RF data.
We see that in contrast to the relaxor behavior of non-
stoichiometric samples, the nominally stoichiometric SrTiO3
film undergoes a displacive phase transition with a slightly dif-
fuse behavior in loss. In the context of Ref. 10, it is worth
checking whether the diffusion of impurities from the underly-
ing DyScO3 substrate into the film could be responsible for the
relaxor behavior. To test this possibility, the x¼ 0 and x¼ 0.03
samples (see Supplementary Fig. S3 of Ref. 13) were meas-
ured by secondary ion mass spectrometry (SIMS). The results
reveal that comparable amounts of dysprosium (Dy) and scan-
dium (Sc) diffused from the substrate into the films, i.e., the
strength of random local electric fields arising from Sc’Ti
defects proposed in Ref. 10 should be comparable in these
films. The origin of the different dielectrics (Fig. 2), SHG
(Fig. 3), and soft-mode (Fig. 4) behavior can thus be solely
attributed to the different Sr:Ti stoichiometry of these films.
Considering the difference of the soft mode temperature
behavior in the nominally stoichiometric and non-
stoichiometric sample, we can conclude that the nominally
stoichiometric film shows classical features of a displacive
ferroelectric. Small deviation from the stoichiometric for-
mula is seen to result in a stiffened soft mode frequency and
weaker temperature dependence. In other words, the soft
mode frequency is a parameter that provides us with a rather
TABLE I. Tmax measured at 1 kHz from capacitance measurements and the
onset temperature of the SHG signal (TSHG) measured on cooling and heating.
Sr1þxTiO3þd x¼�0.05 x¼ 0 x¼ 0.03 x¼ 0.05
Tmax (1 kHz) [K] 281 283 261 231
TSHG [K] (heating) 297 343 303 296
TSHG [K] (cooling) 293 310 291 288
FIG. 4. Real and imaginary parts of the in-plane dielectric constant deter-
mined from optical transmission measurements of the nominally stoichio-
metric SrTiO3/DyScO3 film (x¼ 0) at several temperatures. Symbols
represent measured data; lines are fits by the model [Eq. (1)]. Inset: soft
mode frequency behavior with temperature obtained from a fit to the sam-
ples with x¼ 0 and x¼ 0.03.
082905-4 Lee et al. Appl. Phys. Lett. 102, 082905 (2013)
precise measure of the microscopic quality of the films.
Nevertheless, it should be stressed that the soft mode contri-
bution to the permittivity cannot completely account for the
temperature dependence of the low-frequency dielectric con-
stant. For the stoichiometric sample, the soft mode contribu-
tion to the in-plane dielectric constant at the phase transition
is about 7000, i.e., one order of magnitude smaller than K11
obtained in the kHz–MHz frequency range. The central
mode contribution always dominates near Tmax, so the phase
transition is displacive with crossover to order-disorder type
in the stoichiometric sample.
In conclusion, we have established the intrinsic dielectric
properties of SrTiO3 commensurately strained to (110)
DyScO3 using oxide MBE with meticulous control of the film
composition. The smallest out-of-plane lattice constant,
dispersion-free low-frequency permittivity, and a deep reduc-
tion of the soft mode frequency close to the ferroelectric tran-
sition were found in the nominally stoichiometric sample. We
suggest that SrTiO3 films should not show relaxor behavior as
long as defect concentrations are reduced by precise composi-
tion control. Defects induced by a small error in the stoichi-
ometry are likely responsible for the lack of repeatability in
the dielectric behavior38,39 as well as transport properties of
SrTiO3 (Refs. 40 and 41) and for the inferior dielectric proper-
ties of thin films when compared to equivalent bulk crystals.
This work highlights the sensitive coupling of the dielectric
properties and electrical phenomena in oxide heterostructures
with defects arising from non-stoichiometry.
The authors wish to thank P. Van�ek for his experimental
help. The work at Cornell was supported by the ARO (Grant
No. W911NF-09-1-0415). The work at Penn State was sup-
ported by the National Science Foundation through the
MRSEC program (Grant No. DMR-0820404 and DMR-
1210588). A portion of research was conducted at the Center
for Nanophase Materials Sciences, which is sponsored at
Oak Ridge National Laboratory by the Scientific User
Facilities Division, Office of Basic Energy Sciences, U.S.
Department of Energy. The work at Prague was supported
by the Czech Science Foundation (projects 202/12/1163 and
202/09/H041) and Czech-American project LH13048.
1K. A. M€uller and H. Burkard, Phys. Rev. B 19, 3593 (1979).2W. Zhong and D. Vanderbilt, Phys. Rev. B 53, 5047 (1996).3J. G. Bednorz and K. A. M€uller, Phys. Rev. Lett. 52, 2289 (1984).4C. Ang, Z. Yu, P. M. Vilarinho, and J. L. Baptista, Phys. Rev. B 57, 7403
(1998).5M. Itoh, R. Wang, Y. Inaguma, T. Yamaguchi, Y.-J. Shan, and T.
Nakamura, Phys. Rev. Lett. 82, 3540 (1999).6J. H. Barrett, Phys. Rev. 86, 118 (1952).7E. Hegenbarth, Phys. Status Solidi 6, 333 (1964).8H. Uwe and T. Sakudo, Phys. Rev. B 13, 271 (1976).9J. H. Haeni, P. Irvin, W. Chang, R. Uecker, P. Reiche, Y. L. Li, S.
Choudhury, W. Tian, M. E. Hawley, B. Craigo, A. K. Tagantsev, X. Q.
Pan, S. K. Streiffer, L. Q. Chen, S. W. Kirchoefer, J. Levy, and D. G.
Schlom, Nature 430, 758 (2004).
10M. D. Biegalski, Y. Jia, D. G. Schlom, S. Trolier-McKinstry, S. K.
Streiffer, V. Sherman, R. Uecker, and P. Reiche, Appl. Phys. Lett. 88,
192907 (2006).11M. D. Biegalski, E. Vlahos, G. Sheng, Y. L. Li, M. Bernhagen, P. Reiche,
R. Uecker, S. K. Streiffer, L. Q. Chen, V. Gopalan, D. G. Schlom, and S.
Trolier-McKinstry, Phys. Rev. B 79, 224117 (2009).12H. W. Jang, A. Kumar, S. Denev, M. D. Biegalski, P. Maksymovych, C.
W. Bark, C. T. Nelson, C. M. Folkman, S. H. Baek, N. Balke, C. M.
Brooks, D. A. Tenne, D. G. Schlom, L. Q. Chen, X. Q. Pan, S. V. Kalinin,
V. Gopalan, and C. B. Eom, Phys. Rev. Lett. 104, 197601 (2010).13See supplementary material at http://dx.doi.org/10.1063/1.4793649 for
additional details on film growth, in situ flux calibration, examination of
in-plane lattice constant and crystalline quality by XRD, composition
measurements by RBS, and interdiffusion analysis by SIMS.14B. Velickov, V. Kahlenberg, R. Bertram, and M. Bernhagen, Z. Kristallogr.
222, 466 (2007).15Z. Yu, R. Droopad, and C. Overgaard, U.S. Patent No. 6,667,196
(23 December 2003).16Z. Yu, Y. Liang, C. Overgaard, X. Hu, J. Curless, H. Li, Y. Wei, B.
Craigo, D. Jordan, R. Droopad, J. Finder, K. Eisenbeiser, D. Marshall, K.
Moore, J. Kulik, and P. Fejes, Thin Solid Films 462–463, 51 (2004).17P. Fisher, H. Du, M. Skowronski, P. A. Salvador, O. Maksimov, and X.
Weng, J. Appl. Phys. 103, 013519 (2008).18A. Ichimiya and P. I. Cohen, Reflection High-Energy Electron Diffraction
(Cambridge University Press, Cambridge, 2004).19C. D. Theis and D. G. Schlom, J. Vac. Sci. Technol. A 14, 2677 (1996).20J. B. Nelson and D. P. Riley, Proc. Phys. Soc. London 57, 160 (1945).21G. Rupprecht and W. H. Winter, Phys. Rev. 155, 1019 (1967).22C. M. Brooks, L. Fitting Kourkoutis, T. Heeg, J. Schubert, D. A. Muller,
and D. G. Schlom, Appl. Phys. Lett. 94, 162905 (2009).23M. D. Biegalski, D. D. Fong, J. A. Eastman, P. H. Fuoss, S. K. Streiffer, T.
Heeg, J. Schubert, W. Tian, C. T. Nelson, X. Q. Pan, M. E. Hawley, M.
Bernhagen, P. Reiche, R. Uecker, S. Trolier-McKinstry, and D. G.
Schlom, J. Appl. Phys. 104, 114109 (2008).24N. J. Kidner, A. Meier, Z. J. Homrighaus, B. W. Wessels, T. O. Mason,
and E. J. Garboczi, Thin Solid Films 515, 4588 (2007).25Y. L. Li, S. Choudhury, J. H. Haeni, M. D. Biegalski, A. Vasudevarao, A.
Sharan, H. Z. Ma, J. Levy, V. Gopalan, S. Trolier-McKinstry, D. G.
Schlom, Q. X. Jia, and L. Q. Chen, Phys. Rev. B 73, 184112 (2006).26A. S. Barker, Jr., Phys. Rev. B 12, 4071 (1975).27R. J. D. Tilley, J. Solid State Chem. 21, 293 (1977).28G. A. Samara, J. Phys.: Condens. Matter 15, R367 (2003).29G. A. Samara and L. A. Boatner, Phys. Rev. B 61, 3889 (2000).30C. Ang, Z. Yu, and Z. Jing, Phys. Rev. B 61, 957 (2000).31V. Bovtun, S. Veljko, S. Kamba, J. Petzelt, S. Vakhrushev, Y. Yakymenko,
K. Brinkman, and N. Setter, J. Eur. Ceram. Soc. 26, 2867 (2006).32E. Dul’kin, J. Petzelt, S. Kamba, E. Mojaev, and M. Roth, Appl. Phys.
Lett. 97, 032903 (2010).33P. Ku�zel, H. N�emec, F. Kadlec, and C. Kadlec, Opt. Express 18, 15338
(2010).34J. F. Scott, Rev. Mod. Phys. 46, 83 (1974).35J. Petzelt, G. V. Kozlov, and A. A. Volkov, Ferroelectrics 73, 101 (1987).36C. Kadlec, F. Kadlec, H. N�emec, P. Ku�zel, J. Schubert, and G. Panaitov,
J. Phys.: Condens. Matter 21, 115902 (2009).37C. Kadlec, V. Skoromets, F. Kadlec, H. N�emec, J. Schubert, G. Panaitov,
and P. Ku�zel, Phys. Rev. B 80, 174116 (2009).38T. Hirano, M. Taga, and T. Kobayashi, Jpn. J. Appl. Phys., Part 2 32,
L1760 (1993).39E. Breckenfeld, R. Wilson, J. Karthik, A. R. Damodaran, D. G. Cahill, and
L. W. Martin, Chem. Mater. 24, 331 (2012).40T. Ohnishi, K. Shibuya, T. Yamamoto, and M. Lippmaa, J. Appl. Phys.
103, 103703 (2008).41D.-W. Oh, J. Ravichandran, C.-W. Liang, W. Siemons, B. Jalan, C. M.
Brooks, M. Huijben, D. G. Schlom, S. Stemmer, L. W. Martin, A.
Majumdar, R. Ramesh, and D. G. Cahill, Appl. Phys. Lett. 98, 221904
(2011).
082905-5 Lee et al. Appl. Phys. Lett. 102, 082905 (2013)