Effect of processing on histamine levels in mackerel · Effect of processing on histamine levels in...
92
•
Transcript of Effect of processing on histamine levels in mackerel · Effect of processing on histamine levels in...

Loughborough UniversityInstitutional Repository
Effect of processing onhistamine levels in mackerel
This item was submitted to Loughborough University's Institutional Repositoryby the/an author.
Additional Information:
• A Master's Thesis. Submitted in partial fulfilment of the requirements forthe award of Master of Philosophy of Loughborough University.
Metadata Record: https://dspace.lboro.ac.uk/2134/14114
Publisher: c© A.S. Al-Kasadi
Please cite the published version.

This item was submitted to Loughborough University as an MPhil thesis by the author and is made available in the Institutional Repository
(https://dspace.lboro.ac.uk/) under the following Creative Commons Licence conditions.
For the full text of this licence, please go to: http://creativecommons.org/licenses/by-nc-nd/2.5/

•
..,
LOUGHBOROUGH UNIVERSITY OF TECHNOLOGY
LIBRARY
AUTHOR/FILING TITLE
. . AL-KA-SA-j)l A 5 ' .. ------------------- ------)-------------- ------- :
------------------------------------------------~ ACCESSION/COPY NO.
OO'(;OO~ /of ----------------- ---------------------------------
VOL. NO. CLASS MARK
2 9 APR JC .~ ..,;J
/
'/
\ \
• "' d t
~ ' :, ·~· ... ~';' ~ \ < • ! • ' ., •.,)"~

EFFECT OF PROCESSING
ON HISTAMINE LEVELS
IN MACKEREL
by
ABDULLA SAEED AL-KASADI
A Master's Thesis
submitted in partial fulfilment of the requirements for
the award of Master of Philosophy of the
Loughborough University of Technology, January. 1984.
(§} A.S. Al-Kasadi, 1984
Humberside College of Higher Education


- i -
ACKNOWLEDGEMENTS
I would like to express my sincere thanks to Dr. S.W •. Hansan,
Mr. M.J. Knawles and Prof. J. Mann for their supervision and guidance
throughout this study.
I would like to thank Dr. W.R.B. Arthur, Head of School of food
Studies, and Mr. J. May, the British Council representative, for their
help during my stay in the U.K.
I would like also to thank Mr. D. Redman, Mr. R. Wright, Miss L.
Payle and Mr. J. Kirman for their technical assistance during this
study.
My thanks go to my research colleagues Mr. A. Al-Salem,
Mr. I. Eshiet, Mr. G. Nyambati, Mr. R. Dhalla and Mr. K. McGuire
far their valuable discussions and goad company.
finally I would like to thank the Ministry of fish Wealth in
P.D.R. Yemen who nominated me to carry out this study,. the staff of
the "Project for Development of fisheries in Areas of the Red Sea and
Gulf of Aden" who collected the fish samples and the food and Agriculture
Organisation of the United Nations for the financial support.

•
- ii -
ABSTRACT
Histamine, which is produced by bacterial decarboxylation of
histidine in pelagic fish, is implicated in scombrotoxin poisoning.
This investigation was carried out to determine the effect of process
ing on histamine levels in the flesh of mackerel (Scomber scombrus).
Two methods of determining histamine in fish samples were
evaluated. A calorimetric method, involving coupling of histamine to
give an azo-dye, was found to be simple and reliable and was used to
determine histamine levels in a large number of canned and salted/dried
fish samples. A gas chromatographic method was found to be unsuitable
for use in determining histamine at levels found in fish and fish
products.
The stability of standard histamine solutions at different pH
values was investigated by subjecting to heat (121°C for 180 min).
This treatment showed a loss of less than 5%.
Various compounds (glucose, ribose, ascorbic acid and benzaldehyde)
that react with histamine, were added to standard histamine solutions to
investigate the possibility of decreasing histamine levels in canned
products. The' heat treated solutions showed a loss of histamine of less
than 10% and distinct browning occurred in the solutions containing
glucose and ribose.
The effect of heat treatment (115°C for 90 min) on histamine in the
presence of fish flesh was also examined. Variable results were
obtained with a mean loss of histamine of only about 16)\,. When this
experiment was repeated with the addition of glucose it gave a higher
loss of about 36%.
The effect of salting, drying and subsequent storage on the histamine
levels in mackerel was investigated. Increases in histamine were
observed during salting, drying and storage for both whole and gutted
fish, with greater increases in. general for whole fish. The increases
for both whole and gutted fish occurred under conditions in which
bacterial growth would be suppressed, indicating that another mechanism
of histamine formation might be operative.
2.
3.
4.
5.
6.
7.
CONTENTS
. ............... . INTRODUCTION ••••••••
LITERATURE SURVEY . . . . . . . . . . . . . . 2.1
2.3
2.4
2.5
. . . . . . Scombratoxin poisoning .. •• •• •• •• •• 2.1.1 Symptoms and occurrence •••• 2~1.2 Causative agents •••••••••••••• Histamine-properties and occurrence in food • 2.2 .1 Chemistry of histamine • • • • • • • • 2.2.2 Physiological effects of histamine •• 2.2.3 General survey of histamine in food Histamine in fish and fish products • • •.• • .• 2.3.1 Mechanism of histamine formation in fish 2.3.2 Histamine levels in fish and fish
products •• •• •• •• • ••••••••• Detection and determination of histamine in fish •• •••••••••••••• 2.4.1 Bioassays ••••••.• 2 •. 4.2 F luorimetric assay •
. .... .. . . . ..
2.4.3 Enzymatic isotopic assay ••••••• 2.4.4 Calorimetric assay ••••• 2.4.5 Chromatographic assays Aims of the present work ••
.. .... . ..
EX PER !MENTAL • • •'• •• . . 3.1 ~1aterials •.• 3.2 Equipment •• •• 3.3 Methods • •• . . .... . ...
3.3.1 Determination of histamine •• 3.3.2 3.3.3 3.3.4
Assessment of histamine stability • Mackerel canning •• ~· •• ~· ~· ~· Mackerel salting and drying •••••••
RESULTS AND DISCUSSION ••••• . . ... . . •·. 4.1 Selection and evaluation of methods for
4.2
histamine determination ............ . 4.1 .1 Calorimetric method .. .. ... ... .. . ... • • 4.1.2 Gas chromatographic method.. •• •• Histamine determination in fish products from P .. D.R. Yemen ... .... ... • .. •.• •• •• •• •·• ....
4.3 Effect of heat and food additives on histamine levels 4.3 .1
in canned fish ................. . Stability of histamine on prolonged heating ... . .. • .. • • ... . . ..• ..• • ... Stability of histamine on prolonged heating in the presence of food
3 3 4 6 9 9
11 12 15 15
20
26 26 27 27 29 29 31
32 32 32 33 33 36 37 37
40
40 40 48
49
54
55
additives ••• •• •• •• •• •• •• •.• •• 55 4.3.3 Stability of histamine on heating in the
presence of fish flesh •• •• •• •• •• 59 4.4 Changes in histamine levels during fish
salting, drying and subsequent storage •• 60
CONCLUSIONS ................ RECOMMENDATIONS FOR FUTURE WORK •
REFERENCES • • • . . . . . . . . .. . . .. . . . . . .
...... . . . . . . ... . .
72
73
74

- 1 -
INTRODUCTION
Fish is an important source of protein to much of the world's
population and an important ingredient in many popular recipes
throughout the world. Although fish are intrinsically safe to eat,
occasionally outbreaks of poisoning result from their consumption.
Many different types of fish poisoning occur, one of the
commonest being scombrotoxin poisoning. This is an allergy-like
condition resulting from the consumption of scombroid and other
pelagic fish. The symptoms of this poisoning clinically resemble
histamine toxicity and high levels of histamine have been associated·
with scombrotoxin poisoning outbreaks in many countries.
It has been suggested by several investigators that other
compounds are involved in scombrotoxin poisoning in addition to
histamine, since histamine orally taken does not produce the symptoms
of scombrotoxin poisoning. However, it is generally agreed that the
level of histamine in fish is a useful guide to its potential to
cause scombrotoxin poisoning and in general it is found that fish with
low levels of histamine do not cause scombrotoxin poisoning.
Histamine forms in fish post mortem from the decarboxylation of
the amino acid histidine. The rate of formation is temperature
dependent end if fish temperatures are high, particularly in fish
from warm tropical waters or during prolonged exposure on the hot deck
of the fishing vessel, high levels of histamine can be produced end
do not appear to decline during processing.
Large quantities of pelagic fish ere preserved by canning in
particular mackerel, tuna and sardines. Many cases of scombrotoxin
poisoning have resulted from canned pelagic fish with high histamine
levels and it is clear that normal processing does not lead to
reduction of histamine.
Many cases of scombrotoxin poisoning have also been reported as
resulting from the consumption of cured pelagic fish, in particular
smoked fish, and recent research has indicated that very high levels
of histamine can be found in salted/dried pelagic fish.

- 2 -
The investigation described in this report was carried out to
select and evaluate a simple analytical method for histamine
determination, to investigate the possibility of decreasing histamine
levels in canned fish and to study the changes in histamine levels
during fish salting and drying.

- 3 -
2. LITERATURE SURVEY
2.1 Scombrotoxin poisoning
The vast majority of fish are intrinsically safe to eat. However,
there are occasional outbreaks of poisoning caused by the consumption
of fish and fish products. The most important categories of poisoning
are: bacterial poisoning, poisoning by pollutants, and biotoxications.
Bacterial poisoning includes intoxications caused by eating fish
that contain harmful bacteria or their toxic products. Typical of
this category are botulism, staphylococcal poisoning and that caused
by Vibrio parahaemolyticus. Bacterial contamination of fish during
handling or processing can lead to poisoning, for example, Salmonella
contamination can cause typhoid and paratyphoid fevers (Cann, 1982).
Many cases of poisoning have been reported caused by pollutants
taken up by fish flesh, in particular metal poisoning. Mercury,
cadmium, lead, selenium and arsenic are accumulated by fish and can
cause injury to health through progressive and irreuersible accumula
tion in the human body as a result of ingestion of repeated small
amounts (Connell. 1980). Mercury and in particular methyl mercury has
been implicated in cases of poisoning which have proved fatal, for
example at Minamata Bay, Japan between 1953 and 1961.
Biotoxications are those cases of poisoning resulting from ingestion
of natural biotoxins present in the fish. For example, tetrodotoxin,
which is produced by puffer-fish and is not destroyed by narmal cooking
methods, leads to a number of fatalities each year in Japan (Schever,
1970). Another well known example of a biotoxin is ciguatoxin produced
by a dinoflagellate and transmitted through ocean food chains to both
fish and shellfish. The toxin, which causes diarrhoea, nausea, vomit
ing and tingling sensations in the extremities, cannot be removed by
salting, washing or cooking (Ayres, 1979).
Scombrotoxin poisoning does not clearly fit into the above
mentioned categories. It is an allergy-like condition produced occasion
ally on the consumption of fish, in particular scombroid fish, but also

- 4 -
clupeid and other pelagic fish, The cause of scombrotoxin poisoning
is not fully understood, as discussed below, although it shows
characteristics of both bacterial poisoning and biotoxications.
2.1 .1 Symptoms and occurrence
Scombrotoxin poisoning clinically resembles histamine toxicity,
even though it is not clear whether histamine itself is the main
causative agent. The onset of symptoms vary from victim to victim
and from outbreak to outbreak, i.e. several minutes to three hours
(Sapin-Jaloustre, 1957); five minutes to five hours (Kawabata, 1955)
and within ten minutes to two hours·after consuming the toxic fish
(Murray ~Al·• 1982). The symptoms characteristic of scombrotoxin
poisoning can be summarized as follows: sharp and peppery taste
(Halstead, 1967); flushirrg of the facial and neck area (5apin
Jaloustre, 1957); dizziness, faintness, itching, burning of the
mouth and throat, rapid and weak pulse, and inability to swallow
(Anon, 1975); rash on the face and neck accompanied by severe itching
(Halstead, 1967; Anon, 1975); shock, bronchospasms, suffocation and
severe respiratory distress (Halstead, 1967). The clinical features
of thirty of the first fifty incidents to be reported in Britain by
Gilbert ~sl· (1980) are summarized in Table 1.
Only recently has the extent of scombrotoxin' poisoning outbreaks
been recognised and at present only a few countries keep records of
outbreaks.
In the U.K. scombrotoxin poisoning only reached a significant
level in 1978 and records have only been kept since the middle of the
19708. (Cruickshank end Williams, 1978). The increase up to 1978 was
due to the increased consumption of mackerel which resulted after the
collapse of the herring fisheries in·the 197Da •. The first fifty
incidents to be reported during 1976 up to the end of 1979 were caused

- 5 -
Table 1: Symptoms associated with thirtv scombrotoxin poisoning
incidents in Britain
Symptoms
Diarrhoea
Hot flush and sweating
Rash-Bright red
Nausea
Headache
Stomach pain
Palpitations
Burning in mouth
Vomiting
feverish
Giddy or dizzy
Tight chest
Respiratory distress
Swelling of face
Source: Gilbert et .!!1• (1960).
No. of incidents
24
15
14
13
13
6
6
5
4
3
2
1
1
1

- 6 -
mainly by smoked mackerel (Gilbert et Al•o 1980). However, between
March 1979 and March 1980, twentysix incidents involving canned fish
(mackerel, tuna, sardines, pilchards and anchovies) were reported by
Murray ~A!· (1982). These cans were either produced in the U.K. or
were imported from Morocco, Thailand, Taiwan, Fiji, Peru, Malaysia,
Japan, Spain, Philippines and Solomon Islands.
Incidents of scombrotoxin poisoning in the United States are now
reported through the Centers for Disease Control in Atlanta, Georgia.
They reported forty scombrotoxin outbreaks between 1975 and 1979
(C.D.C., 1981 ), In Japan, "Samma sakura-boshi", dried seasoned saury
(Cololabis sairal is implicated in many outbreaks of scombrotoxin
poisoning (Kawabata, 1955). Among other cases of scombrotoxin or
scombrotoxin-like poisoning reported are in Norway from canned tuna
(Thunnus thynnusl (Strom and Lindberg, 1945), in Indonesia from the
consumption of skipjack tuna (Katsuwonas pelamis) (Van Veen and
Latuasan, 1950) and in New Zealand from the consumption of kingfish
and kahawai (foo, 1975).
In the author's home country, P.D.R. Yemen, no figures are avail
able for scombrotoxin poisoning, however in the author's experience
cases of allergy-like response to scombroid fish do occur and need to
be further investigated.
Causative agents
Scombrotoxin poisoning is caused by a toxin or toxins which
accumulate(s) in the fish flesh during storage. The poisoning has
been associated with high levels of histamine in the fish flesh.
However histamine does not appear to be the sole causative agent,
because when taken orally it fails to produce any subjective effect
(Weiss ~~ •• 1932), except when administered in massive doses which
result in headaches, flushing, etc. (Douglas, 1982).

- 7 -
Hughes (1959) found higher values of histamine during post
mortem storage of herring than Hardy and Smith (1976) found in
mackerel. ··But the literature evidence for illness caused by the
consumption of herring is negligible compared with that of scombroid
fish.
A number of investigators have discussed various substances that
may be involved with histamine in causing scombrotoxin poisoning
(Geiger, 1955; Durand, 1973; Foo, 1976; Arnold and Brown, 1976).
It has been suggested by Geiger (1955) that alterations of
conditions of the intestinal tract, due to the consumption of highly
seasoned hot dishes prepared from spoiled fish or the simultaneous
consumptio·n of alcoholic beverages, might cause histamine to be
absorbed at an increased rate such that detoxification could not keep
up with the entry of histamine into the circulation.
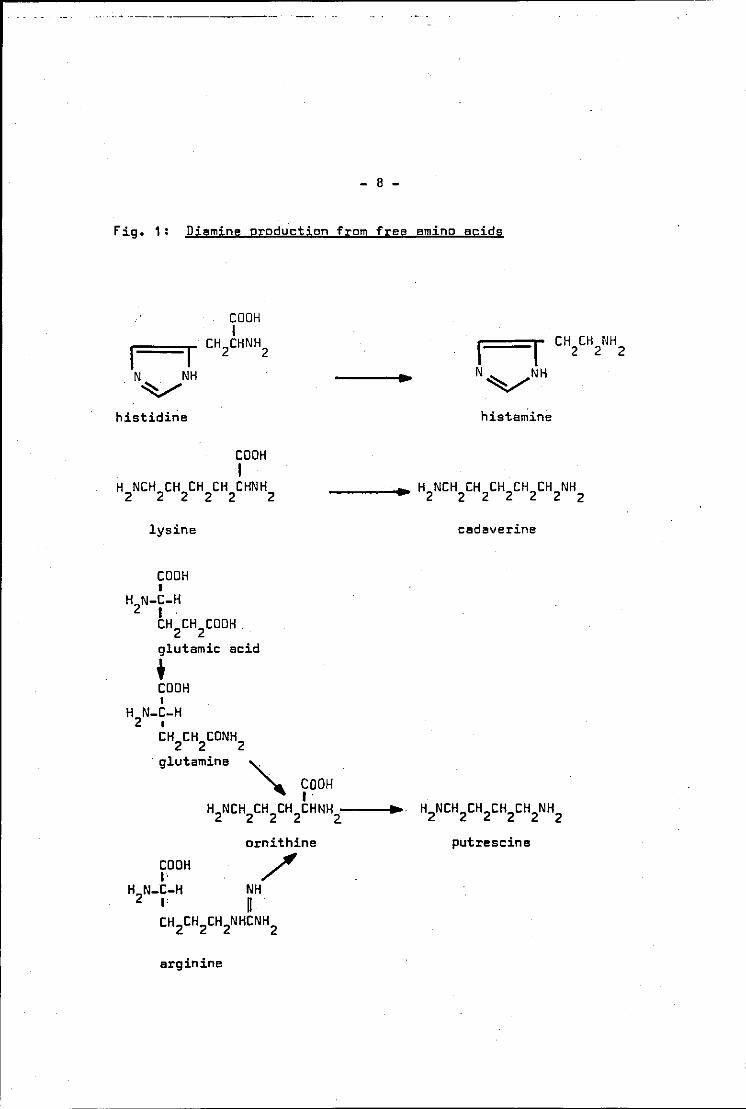
Diamines such as cadaverine and putrescine may enhance the
toxicity of histamine by facilitating its passage through the intestinal
barrier (Ienistea, 1973). These diamines are produced by enzymes of
spoilage bacteria acting on free amino acids (see Fig. 1) in a
similar manner to the formation of histamine from histidine. Putrescine
has been shown to potentiate the peroral ~oxicity of subsequent doses
of histamine in guinea pigs (Parrot and Nicot, 1966). Cadaverine
causes·a pronounced incr8ase in the toxicity of histamine on simultan
eous administration of the two compounds (Bjeldanes ~A!., 1976).
Moreover, cadaverine appears to occur at increased levels in toxic
tuna and therefore, might be significant in accounting for histamine
toxicity (Kim and Bjeldanes, 1979).
The oxidative deamination pathway of histamine to imidazoleacetic
acid by the enzyme histaminase (see Section 2.2.2) is important in
the stomach in decreasing histamine absorption, Suppression of
histamine inactivation leads to increasing the absorption of histamine
- 8 -
Fig. 1: Diamine production from free amino acids
I N NH ~
histidine
CDDH I
hista~ine
CH CH NH 2 2 2
H NCH CH CH CH CHNH 2 2 2 2 2 2
___ ..,. H2
NCH CH CH2
CH2
CH NH 2 2 2 2
lysine
CDDH I
H N-C-H 2 I .
CH 2CHlDDH
glutamic acid
' CDDH I
H N-C-H 2 I
CHlHlDNH2 glutamine
COOH I .
H2NCH CH CH CHNH .--_. 2 2 2 2.
CDDH ,. H2N-C-H ,,
arginine
ornithine
/
cadaverine
putrescine

- 9 -
(Widmann, 1950). Histaminase has been shown to be inactivated by
various materials such as histidine, pyridoxine, cysteine, etc.
It has been suggested that bacterial endotoxins might act
synergistically with histamine in' fish which had been subjected to
significant microbiological spoilage (Arnold and Brown, 1978) but
this needs further investigation.
From the available. evidence, it is difficult to conclude that
histamine is the sole causative agent in scombrotoxin poisoning.
The problem of identifying the other agents remains unresolved and
further investigation is required in this field, particularly with
respect to the synergistic effects of other diamines, suppression of his
taminase- activity and the effects of bacterial endotoxins. However,
it seems beyond question that there is a direct correlation between
high levels of histamine in fish and scombrotoxin poisoning.
2.2 Histamine - properties and occurrence in food
2.2.1 Chemistry of histamine
Histamine is a white crystalline solid with melting point 83-84°C
and boiling point 2D9-210°C. It is soluble in water, slightly
soluble in alcohol and insoluble or very slightly soluble in organic
solvents.
The structure of histamine is given by the two tautomeric forms:
CH CH2
NH F =1r 2 2 I . N~_...}-H

- 10 -
i.e. it is an imidazole with an ethylamine substituent as indicated
by its systematic name imidazole-4-ethylamine or 4(aminoethyl}
imidazole.
Histamine is a basic diamine that has a strong basic group, as
in ethylamine, as well as relatively weak basic group, as in imidazole.
In solutions histamine is protonated as follows:
+ CH CH
2NH
r==1f 2 3 H+
/~N ~ 1 r
Histamine exhibits aromatic properties due to the electron shell
of 6 rr-electrons i.e. 2 C = C electrons, 2 C • N electrons and 2
lone pair electrons from the non-protonated nitrogen atom. Due to
its aromaticity, it undergoes substitution reactions rather than
addition. This has been studied in detail for the parent heterocyclic
compound, imidazole, which undergoes sulphonation and nitration in
the 4 (5} position and bromination appears to follow the following
sequence (Finer, 1975):
Br

- 11 -
Electrophilic substitution of histamine occurs at the 5 position
rather than the 4 ·position which is blocked by the ethylamino group.
The primary amino group on the side chain of the ring enables
histamine to react with carbonyl groups:
' _, c = 0 + H N-2 ' ,.....c = N-
and for example this permits histamine to be involved in non-enzymic
browning (fennema, 1976).
Histamine can be commercially manufactured by utilizing the
wastes from certain fish in which histamine is readily produced
(Geiger, 1954). Histamine can be synthesized from 2-butyne-1,4-diol
(fraser and Raphael, 1952).
Physiological effects of histamine
Histamine was first isolated from completely fresh samples of
liver and lung in 1927 by Best, Dale, Dudley and Thorpe, proving that
histamine is a.natural constituent of the human body. However, its
concentration differs markedly from one tissue to another. The main
site of histamine storage is the mast cell (a granular cell found in
connective tissue) or, in the blood, the basophil (a white blood cell
concerned with inflamatory response to injury). These cells synthesize
histamine and store it in secretory granules (Douglas, 1982). The
turnover rate of histamine in these cells is slow. There are other
sites for histamine formation or storage i.e. cells of the epidermis,
cells within the central nervous system (probably neurons), and cells
·in regenerating or rapidly growing tissues. The turnover rate of
histamine here is rapid since it is being released. Histamine is
released during hypersensitivity (allergic) reactions and upon cellular
injury.

- 12-
There are two major pathways of histamine metabolism in the body
(see Fig. 2). The first, which is the most important one, involves
ring methylation and is catalysed by the enzyme histamine-N-methyl
transferase. Most of N-methylhistamine is converted by monoamine
oxidase to N-methyl imidazoleacetic acid. In the second pathway,
histamine undergoes oxidative deamination catalysed mainly by the
enzyme histaminase resulting in the production of imidazoleacetic
acid and eventually its riboside after conjugation with ribose
(Douglas, 198 !1; Beaven, 1978).
In addition to allergic reactions, histamine is also involved in
many diverse physiological processes such as the physiological
regulation of gastric secretion and, apparently, as a chemical
transmitter or modulator with the brain.
There is strong response of smooth muscles towards histamine,
the best example being the contraction of intestinal muscle. The
contraction effect of histamine on the terminal ileum of the guinea
pig forms the basis for the classical bioassay of histamine (see
Section 2.4.1 ).
2.2.3 General survey of histamine in food
Histamine can be found in a large variety of foods, especially
in those that have been subjected to deliberate or accidental
bacterial contamination.
Various dairy products have been examined for histamine content.
High concentrations are found in various cheeses, especially well
matured ones, such as Cheddar (see Table 2). The histamine concentra
tion in a sample of dried milk was found to be 0.042 mg/100 g, while
unpasteurised milk powder stored for 2 days at 25°C before freeze
drying contained 0.28 mg/100 g (Grove and Terplan, 1975).
Blackwell tl..!!l•, ( 1969 l examined the histamine level in yeast
extracts provided by different manufacturers and values of 0.21-2.83
mg/100 g were found. Histamine is found in alcoholic drinks i.e.
-wine and beer. The histamine levels were found to be 1.6 and 1 mg/100
ml in samples of white and red wine respectively ( Jacob, 1978 l.

- 13 -
Fig. 2: 5ymthesis and catabolism of histamine
histidine
/
"'"''"'~'"'''"'""'""'"'
r 1
cH2
cH2
NH2 N-methylhistamine N
~_,.N "'V" 'eH I 3
monoamineloxidase
~-----~ CH 2CDDH
N~, CH
3
N-methyl-imidazole acetic acid
501Jrce :: Douglas ( 19BZ l.
CH CH NH 2 2 2
L-histidine
histamine
histaminase (diamine oxidase)
r:::l =,.,.,,,... CHlDDH
N N H/ "-.tY
I imidazole acetic acid
conjugation ~ith ribose
1 _____
1 CH
2CODH
N:::::,.. N. ~ 'R"b 1 ose
imidazole acetic acid ribose

- 14 -
Table 2: Histamine in cheese
Cheese mg/100 g
Cheddar 3.7-130
Roquefort 5-230
Gouda 5-45
Bleu de Bresse tr-410
Sap-Sago 260
Swiss 0.4-250
Provolone 2-23.5
Source: Smith ( 1980).

.--------------------------------- ---
- 15 -
High levels of histamine can be found in some plant products
such as in spinach (4D mg/10D g) (Gardner ~Al., 1967), in
sauerkraut could increase to 16 mg/1DD g after fermentation for 1D
wee~s (Mayer~ al., 1974), even though it is now considered that it
is unlikely this can reach hazardous concentrations (Taylor et Al·, 197Bb).
Low concentrations of histamine were found ·in various meat
products · but beef liver was found to contain 6. 5 mg/1 DD g (Boulton
~al., 197D). High concentrations were found in the skin of poultry
(Henry, 196D).
Levels of histamine found in fish, together with the mechanism
of histamine formation are discussed in the next section.
2.3 Histamine in fish and fish products
The presence of histamine in fish extracts was first reported
in 19D9 by Suzuki giAl. At a later stage the association of histamine
with scombrotoxin poisoning stimulated many studies into the mechanism
of formation of histamine in fish. These will be discussed first
before discussing the levels of histamine found in fish and fish
products.
2. 3.1 Mechanism of histamine formation in fish
It has been shown that freshly caught fish are essentially devoid
of histamine · F e_rnandez-Salguero and Mackie ( 1979).
It is now well documented that histamine is produced post
mortem by the decarboxylation of the amino acid histidine (Arnold and
Brown, 1978). High levels of histidine in dark-fleshed fish have
been reported by many research workers, for example, Mackie and Ritchie
(1974) reported that free histidine is the major component of the
nitrogenous extractives from scombroid fish. Fernandez-Salguero ~nd Mackie

- 16 -
(1979) studied the changes in the concentration of histidine in
various preparations of mackerel stored at different temperatures
(see Table 3). They found a decrease in the concentration of
histidine in the muscle (whole fish) at all storage temperatures.
However in sterile muscle the histidine content remained almost
constant. A different situation exists in the liver, where in all
storage experiments, the histidine rose steadily. The activity of
proteolytic enzymes, either autolytic proteases of the liver cells
or proteolytic enzymes of contaminant microflora, apparently release
more histidine from proteins than is converted by the catabolic
processes. From Table 4, the histamine levels of the muscle (whole
fish) showed a slight increase at 0 and 2°C, but a large increase at
10 and 23°C. For sterile muscle the histamine level remain steady
or showed only a slight increase even after 25 days at 0°C. A
different situation occurred in the liver, where the histamine level
increased at all storage temperatures.
The rate of increase in the histamine content at temperatures
higher then 0°C can be explained both in terms either of an increase
in rate of autolysis or an increase in bacterial activity, as also
can the feet that histamine formation becomes slower at temperatures
much above ambient (Frank et al., 1981).
Initial studies concentrated on the possibility of histamine
formation by autolysis. Igarashi (1939) reported that comparatively
large amounts of histamine were produced in the muscle tissue of
chub mackerel (Scomber japonicus) even when the fish were treated with
antiseptic solutions. Accordingly, he concluded that histamine was
produced through autolysis. Other studies performed on muscle
suspensions under aseptic conditions, resulted in the formation of
only very small amounts of histamine by the action of enzymes inherent
in the muscle tissue (Geiger ~Jil., 1944; Kimata and Kawai, 1953a;
Ferencik, 1970). It is now generally accepted that the bacterial
decarboxylation is the predominant process in conversion of histidine
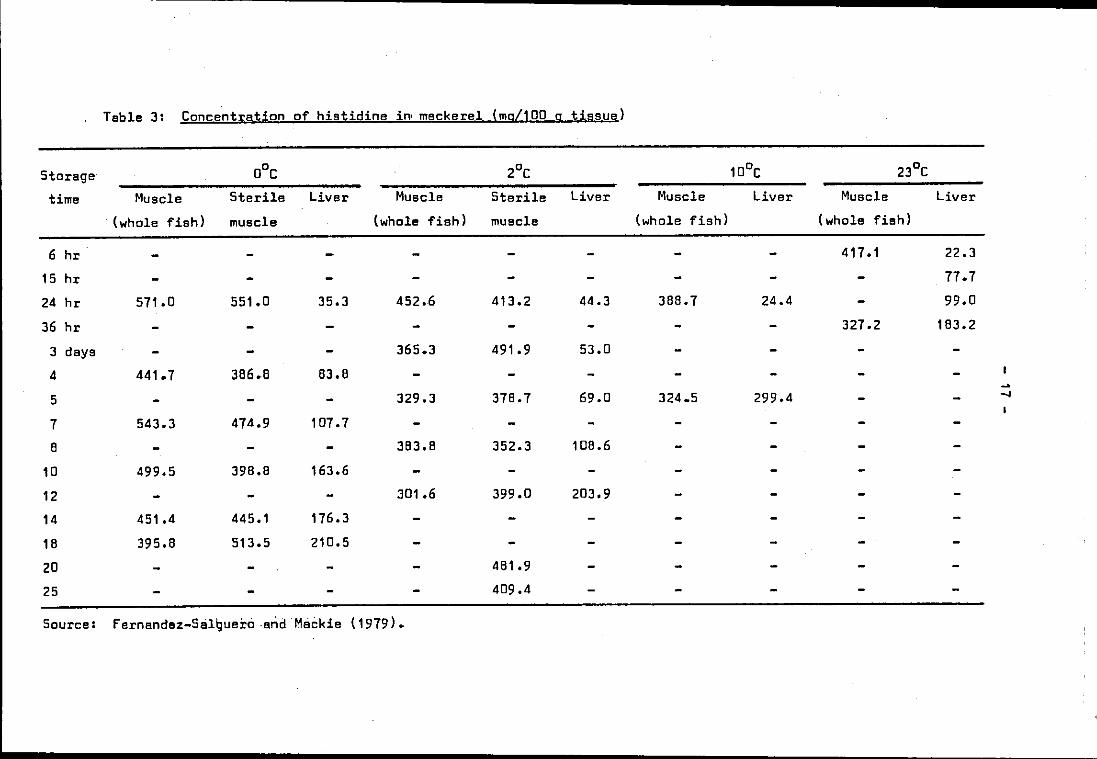
Table 3: Concent[ation of histidine in' mackerel !mgLJDD g ti§SUe)
Storage D°C 2°C 1DoC 23°C
time Muscle Sterile Liver Muscle Sterile Liver Muscle Liver Muscle Liver
(whole fish) muscle (whole fish) muscle (whole fish) (whole fish)
6 hr 417.1 22.3
15 hr 77.7
24 hr 571.0 551.0 35.3 452.6 413.2 44.3 388.7 24.4 99.0
36 hr 327.2 183.2
3 days 365.3 491.9 53.0
4 441.7 386.8 83.8 ~
5 329.3 378.7 69.0 324.5 299.4 .....
7 543.3 474.9 107.7
8 383.8 352.3 108.6
10 499.5 398.8 163.6
12 301 .6 399.0 203.9
14 451.4 445.1 176.3
18 395.8 513.5 210.5
20 481.9
25 409.4
Source: fernandez-Salguero . arid Mackia (1979) •

Table 4: Con~ent;t:a:!;ion of histamine in mackerel !mgL1DD g tissue)
Storage D°C 2°C 10°C 23°C
time Muscle Sterile Liver Muscle Sterile Liver Muscle Liver Muscle Liver
(whole fish) muscle (whole fish) muscle (whole fish) (whole fish)
6 hr 0,012 0.025
15 hr - 0,051 0.136 ' 24 hr 0,007 0,.008 0.025 0.009 0,007 0.041 0.020 0.058 0.214 5.637
36 hr 5.000 18.683
3 days 0.012 o.oo8 0,047 0.200 18.DSD
4 0,013 0,005 0,038
5 0.017 0.012 0.174 182.083 133.000
7 0.043 0,012 0.487 ~
"' 8 0.219 0.010 10.417
10 0.092 0.011 2.541
12 1.406 0,013 22.473
14 0.114 0,008 5.985
18 0.186 0.006 54.625
20 0,011
25 0.024
Source: F ernande-z-S Eilgue±ci and Mackia (1979). ·- - "

- 19 -
to histamine.
Early microbial studies showed that many bacterial species are
able to decarboxylate amino acids, for example, Escherichia,
Klebsiella, Salmonella, Shigella, Clostridium, Proteus, ·Bacillus and
Streptococcus (Eggerth, 1939; Gale, 1946; Ehrismann and Werle, 1948).
Isolation and identification of bacterial species, from fish implicated
in food poisoning outbreaks, have been performed since 1950. Van Veen
end Latuasan (1950) isolated from skipjack tuna (Katsuwonus pelamis)
two strains of bacteria that produce histamine from histidine in fish
muscle. These strains were identified only as a small gram-positive
coccus and gram-positive rod. In 1953, Kimata and Kawai isolated a
"new" species of bacteria from spoiled fish. This bacterium was able
to produce large amounts of histamine and hence was called "Achromobacter
histaminium. Further work on this organism identified it as Proteus
morganii (Kimata ~sl·• 1958; Kimata and Kawai, 1958). f. morganii
has been implicated as the key histamine producing micro-organism in
several scombrotoxin poisoning outbreaks associated with the consumption
of fish in Japan. Taylor ~~· (1978c)tested a total of 112 bacterial
strains, representing 38 species, for histamine accumulation and
found that f. morganii was the most active.
From the above it can be concluded with regard to histamine
formation from histidine thati
al bacterial action is predominant in unprocessed fish stored
at 0°C and above, although this will not necessarily be the
case in fish products where bacterial action.is suppressed;
b) the rate of histamine formation increases with temperature 0 above 0 C but becomes slower at temperatures much above
ambient (as discussed further in the next section).

- 20 -
2.3.2 Histamine levels in fish and fish products
In previous sections, the involvement of histamine in scombro
toxin poisoning was discussed and the mechanism of its formation by
the bacterial decarboxylation of the amino acid histidine was outlined.
Since the formation of histamine appears to be dependent on bacterial
action, clearly the levels of histamine in fish and fish products will
depend very much on how the fish are handled, stored and processed.
In this section the effects of handling and storage before processing
will be discussed initially, followed by the effects of processing
methods commonly used with pelagic fish i.e. canning, drying, salting
and smoking.
Fish handling and storage
As discussed above, histamine formation is dependent on the
temperature at which the fish are held. Hardy and Smith (1976)
reported that there was no increase in the histamine level up to 15
days for gutted and ungutted mackerel stored in ice and up to 72 weeks
at -14°, -12° and -29°C (see Table 5). At ambient temperature a
different situation exists; the histamine level can rise rapidly
during storage after a lag period. This increase is more apparent
with the ungutted than gutted fish (Smith ~Ai•r 1980). Frank et Ai·
(1981) found the optimum temperature for histamine production during
storage of skipjack tuna (Katsuwonus pelamisl was 37.B°C when levels
of about 500 mg/100 g were found in all regions of the fish after 24 h
incubation. In some species of Japanese fish rapid histamine formation
was found to occur at 20°C (Kimata and Kawai, 1953c; Ienistea, 1973).
It is important therefore to chill the fish soon after capture
and maintain it in a chilled condition to avoid increases in histamine
levels and if practicable also to gut the fish after capture. It is
particularly important to avoid high levels of histamine in fish that
are to be subjected to further processing and storage, since histamine
levels might then increase further.

Table 5: Histamine deyelopment in mackerel held at various temperatures (mg/100 g fish)
fish held at ambient temperature
Ungutted
Storage
(hours)
0
8
16
27
39
51
62
81
152
Histamine
0
0
0
0
0.06
0.32
0.43
2.62
203.00
Gutted
Storage Histamine
(hours)
0 0
9t 0
21t 0
JJt 0.21
46 0
57 0.98
76 1.35
147 49.2
Source: Hardy and Smith (1976).
fish held in ice
Ungutted
Storage
(days)
0-10
15
Histamine
0
0.4
Gutted
Storage Histamine
(days)
0-14t 0
frozen fish
held at -14,
-21 and -29°C
No histamine
up to 72
weeks stor-
age. N -

- 22 -
Canning
Canned fish may be defined as fish packed in containers which
have been hermetically sealed and sufficiently heated to destroy or
inactivate all micro-organisms that will grow at any temperature
at which the product is likely to be held and that will cause spoil
age or thet might be harmful (D.E.C.D •. , 1978). Sprats, herring,
pilchard, mackerel, sardines and tuna, all of which are pelagic fish,
have been canned in large quantities in many countries. It has been
suggested that the presence of histamine in sterilized cans is due to
its heat resistance i.e •. it is found in cans when the temperature at
which sterilization is carried out is too low to destroy the amine
(Gounelle, 1960; Gounelle and Pointeau-Pouliquen, 1961). However,
there is evidence that heating only slightly reduces the histamine
levels. for example, Ienistea (1973) reported that histamine is
only partially destroyed in 3h at 102°C, and 90 min at 116°C in 250 g
cans. The stability of histamine during canning needs to be invest
igated further.
Several surveys have been made of histamine levels in canned
fish (Igarashi, 1949; Meitz and Karmas, 1977; Taylor ~A!., 1978a,b;
Murray ~JLL., 1982). Some of the results are given in Table 6. The
range of values, on a wet weight basis, for the tuna samples is
0.66-450 mg/100 g, for the mackerel samples is 0.18-4.93 mg/100 g,
for the sardines samples is 1.31-100 mg/100 g and for the anchovy
samples is 2.3-306 mg/100 g. The seasoned whale and pink salmon
contained only 1.13 and 0.23 mg/100 g respectively.
Since canned fish have been implicated in many scombrotoxin
outbreaks (see Section 2.1) it is important that quality checks are
made. It has been suggested that processors should aim to have no
more than 5 mg histamine/100 gin the finished products (Murray ~sl·•
1982) end such limits should be relatively easily maintained if good
manufacturing practice is followed.

- 23 -
Table 6: Histamine content in canned fish products
Product mg/1 DD g mg/1DD g Source
product dry matter
tuna D.1-B,D 2
tuna 45D 5
tuna 2 4
tuna 118 4
tuna 26 4
alba core tuna D.66-2.21 3
seasoned tuna 6.38 16.21 1
seasoned tuna 9.98 27.SD 1
seasoned bonito 5.99 15.63 1
seasoned bonito 15.69 48.95 1
light tuna 1.6D-7.41 3
mackerel 5
mackerel 1.2D-4.5D 3
seasoned mackerel D.18 D.63 1
seasoned mackerel 4.93 14.86 1
oil sardine 5.79 11 .31 1
sardines 83-1DD 5
sardines D.31-1.38 3
seasoned sardines 1 • 31 4.8
seasoned sardines 8.16 2D.31 1
anchovies 2·3-3D6 5
seasoned whale 1-13 3.49
pink salmon D-23 D.66
Source: 1 :·. Igarashi (1949). 2 • Meitz and Karmas (1977).
'3 1• Taylor ,!ll _e.l, ( 1978 h). 4 .• Smith (198D).
'5 ;. Murray ,!ll £!. (1982).

- 24 -
Drying
Large quantities of pelegic fish are preserved simply by drying,
normally in the tropics by sun-drying. The lower water content and ·
hence lower water activity results in a longer storage life. Fish
with a low oil content are usually more suitable for drying than fish
with a high oil content since the latter tend to go rancid rapidly,
although this may be acceptable to the consumer.
Igarashi (1949) analysed dried fish from the Japanese market for
histamine content (see Table 7). Levels of 12.4 and 30.1 mg/100 g
were found in dried sardine and herring respectively. Histamine was
found in dried fish at a level of 400 mg/100 g by Van Veen end
Latuasen (1950) although the species was not given. Park~~. (1961)
found that histamine content of sun-dried products of mackerel pike
and Spanish mackerel were higher than the raw material or salted or
hot-air dried products. The effects of drying on histamine levels
requires further study.
Salting end salting/drying
The main characteristic of salting is the removal of part of the
water content from the fish flesh and its partial replacement by salt.
Salting is sometimes followed by drying. Lean fish can be dry salted
but this technique cannot be applied to fatty fish because of rancidity
development. Fatty fish are in general either brine cured or cured by
addition of dry salt to the fish, in a container which retains the
pickle, so preventing oxygen access. In the tropics, the salted fish
ere often then sun-dried.
Relatively little data has been obtained for salted fish.
Igarashi (1949) found a level of 9.63 mg/100 gin salted herring,
2.2S mg/100 g in salted trout and 0.51 mg/100 g in salted herri~g roe.

- 25 -
Table 7: Histamine content in cured fish products
Product
Dried fish
sardine
her:~ring
sand eel
squid
shark fin.
Salted fish
herring
trout
her:~ring roe
Salted/dried fish
Spanish mackerel
mackerel pike
Rastrelliger sp.
tuna
Sardinella
sardinl!
anchovy
gutted cod
mixed fish
Smoked fish
hl!rring
salmon
mackerel
herring roes
tuna
mg/100 g
product
12.42
30.09
3.95
2.60
0.18
9.B3
2.25
0.51
9-61
29.7B
46
412
66-216
1.50
19
0.07
5-94
34.52
1.66
148
1.2-35.0
11
Source: ;1:. lgarashi (1949).
2 .• Smith (19BO).
'3. Hanson .!!!.~· (19B4).
mg/100 g
dry matter
15.09
36.62
4.85
3.45
0.20
20.07
4.8B
1.17
.17-107'
52.2B
BB.
722
116--254
2.33
30-16
0.10
. '9'-141
52.02
2.49
1'4 .
Source
1
1
1
1
1
1
3
3
3
3
1
3
1
3
1
1
2
2
3

- 26 -
Several different types of salted/dried fish have been analysed for
histamine (Table 7) and levels up to 412 mg/100 g have been found.
There is no information in the literature as to whether histamine
levels in~rease during salting and subsequent drying or even during
storage. This is an area that requires further study.
Smoking
Smoking is a method of extending the fish shelf life by the
preservative action of smoke and often also salt. A certain amount
of dehydration also occurs during smoking.
Several investigators have reported histamine levels in smoked
fish as given in Table 7. In the report by Gilbert~ al. (1980) on
the first 50 incidents of scombrotoxin poisoning in Britain, 44
incidents were caused by smoked mackerel. They examined samples of
fish (remnants from meal or from same batch) from 37 of the 50 incidents
and found the median level of histamine was 145 mg/100 g.
There is no information in the literature about the changes in
histamine levels during smoking and hence further work is needed in
this field.
2.4 Detection and determination of histamine in fish
2.4.1 Bioa9says
The guinea pig ileum contraction method was one of the earliest
methods used to detect the presence of histamine. The standard
methods are based on the procedures suggested by Barsoum and Gaddum
(1935). They proposed that if a test material is applied to guinea
pig ileum and rectal cacum of a fowl and causes contraction, it is
considered to be histamine without further confirmation. Geiger (1944)
was the first to report the ·application of this method to the analysis

- 27 -
of histamine in fish tissue. This method of bioassay is now widely
used for detection and determination of histamine.
Other possible bioassays have been assessed by De Waart ~A!·.
(1972). They evaluated a total of 32 biological test systems,
including, 4 fish species and 9 micro-organisms for their sensitivity
to a variety of microbial toxins and histamine. Daphnia (a small fresh
water crustacean) was found to be particularly sensitive to histamine
and may form the basis of a future method of bioassay.
2.4.2 Fluorimetric assay
Shore~~. (1959) reported a relatively simple fluorimetric
method. It involves the extraction of histamine from alkalinized
perchloric acid tissue extracts with n-butanol, and its ultimate
condensation with ortho-phthalaldehyde (OPT) to· yield a stable and
strongly fluorescing product. Heyl et al. (1948) suggested the
structure given in fig. 3, for the fluorescing product, although
subsequent rearrangement and air oxidation may occur. A detailed
description is available in a review by Shore (1971). Lerke and Bell
(1976) used a similar method, the only difference being that the
histamine extraction involved ion exchange chromatography.
fluorescamine has been shown to react with primary amines, amino
acids, peptides and proteins to yield highly fluorescent products
(Udenfriend ~A!., 1972). This method can detect amines such as
histamine in1 the picomole range. However since histamine levels in
fish are much higher, this sensitivity is not normally necessary from
the practical viewpoint.
2.4.3 Enzymatic isotopic assay
Snyder ~~. (1966) proposed a method involving the incubation
of tissue samples with trace amounts of (3H)-histamine and ( 14cl-5-adenosylmethionine in the presence of the enzyme histamine methyl-

- 26 -
fig. 3: The condensation between histamine and ortho-phthalaldehyde
OCHO · HC C-CH-CH- NH
+ I 1 2 2 2
CHO H,..N........._C~N I H

- 29 -
transferase, which methylates the histamine. The amount of histamine
present in the incubation mixture can be calculated from the ratio
of (14c):( 3H) in the methylhistamine.
2.4.4 Colorimetric assay
Quantitative determination of histamine by colorimetric methods
involves either the reactioro with 2,4-dinitrofluorobenzene, or more
commonly coupling with e diazotised aromatic amine to produce an azo
dye (Code and Mclntire, 1956).
A diazo coupling method was used by Hardy and Smith (1976).
This method involved coupling of histamine extracts with diazotised
p-bromoaniline (s~e Fig. 4) prepared according to Grundemeier and
Andrews{ 1965). It is important in this method to separate histamine
from interfering substances such as histidine. Several methods have
been developed including use of ion-exchange chromatography (Tsuda
Jl.i .!!!.. , 1959), cotton acid succinate column ( Weissback Jl.i ..!!!.•, 195 8),
or cationic exchange resin (Kawabata Jl.iAl•o 1960).
The method used by Hardy and Smith (1976) is frequently used by
investigators because of its simplicity; no sophisticated laboratory
facilities are necessary.
Chromatographic essays
Histamine can be detected and determined by thin layer chromatro
grephy (Schwartzmsnn, 1973; Schwartzmann and Halliwell, 1975: Lin
.!l.i .!!!.·, 1977; Schutz .!l.i .!!1•, 1976).
Gas chromatographic analysis of standard histamine solutions was
reported by fales and Pisano in 1962 employing a column containing 4~
SE-30 siloxane polymer as the liquid phase, however they did not
attempt to analyse histamine from complex matrices such as fish flesh.

--------------------------------------
- 30 -
fig. 4: Histamine coupling with p-bromodiazonium chloride
j=jCH CH NH + I I 2 2 2
HN~ Br
•

- 31 -
Another gas chromatographic method has been described by
Navert (1975), which analyses histamine as heptafluorobutyric
acid anhydride derivative. This method is said to separate adequately
histidine, histamine and naturally occurring methylhistamines, however
it was not used for complex matrices such as fish flesh.
Henion ~~· (1961) described a method to determine histamine
in the complex tissue extract by capillary gas chromatography-
mass spectrometry as trimethylsilyl derivative.
High-speed liquid chromatography-fluorescence analysis of
histamine has been described by Yasuto ~~. (1976). This method
can determine as little as 0.2 picomoles of histamine in 1 ml of
plasma. As mentioned previously, histamine levels in fish are much
higher, which renders the sensitivity of this method unnecessary.
2.5 Aims of the present work
The aims of the present work are:
a) To select and evaluate a simple analytical method for
histamine determination and to assess histamine levels
in fish products produced in the author's home country.
b) To investigate the possibility of decreasing histamine
levels in canned fish by assessing the effects of
prolonged heat treatment, or the addition of food
additives.
c) To study the changes in histamine levels during fish
salting, drying and subsequent storage.

3.1 Materials
- 32 -
EXPERIMENTAL
Histamine (free base) was supplied by Sigma London Chemical
Company Ltd., Dorset, England.
Food grade salt manufactured by British Salt Ltd., Middlewich,
United Kingdom was used in the dry salting of mackerel.
The reagents used throughout this study were of Analar grade if
available.
The cans used were UB open top processed food cans, size
300 x 207 produced by Metal Box Ltd.
Mackerel (~. scombrus) were obtained in ice directly from Grimsby
Docks and were used either for canning, or salting and drying, without
further storage. The fish used were of grade E (EEC grading scheme)
or at the top of grade A.
Canned mackerel (~. japonicus), dried sardines (Sardinella
longiceps), dried sea bream (Nemipterus japonicus), salted and dried
catfish (Arius maculatus), salted and dried shark (Carcharinus
melanopterus) and dried sea cucumber, were collected in P.D.R. Yemen
by staff of the "Project for Development of Fisheries in Areas of the
Red Sea and Gulf of Aden, F.A.O. U.N." and were transported to the
U.K. by air.
3.2 Equipment
The following pieces of equipment were used:
A MB-1A vacuum closing machine, made by Metal Box Ltd. was used
to seam the cans.
A vertical stationary retort, made by Leeds and Bradford Boiler
Co. England, was used in the sterilization of cans.
An Ultra-turax type homogeniser TP-1B/10 made by Junkie and
Kunkel, Germany was used to homogenise fish and fish products.

- 33 -
An MSE, Spectroplus-D (MSE Scientific Instruments, Sussex,
England) was used to measure absorbances.
A Status autoclave (Northern media, North Cave, East Yorkshire,
England) was used in heat treating standard histamine solutions.
A digital pH meter PW 9410, made by Philips, Great Britain,
was used to determine pH values.
A Shimadzu gas chromatograph GC-R1A connected to a Shimadzu
GC-Processor RPR-01 was used for histamine analysis.
3.3 Methods
3.3.1 Determination of histamine
al Calorimetric method (Hardy and Smith, 1976)
Preparation of extract
20 g of fresh fish or other fish product (canned, salted, dried,
etc) were homogenised with 200 ml of 2.5% trichloroacetic acid (T.C.A.)
and the homogenate was filtered using a Buchner funnel.
Separation of histamine from interfering substances
A slurry of 1 g of Amberlite Resin CG-50, Chromatographic Grade
Type 1, 100-200 mesh, in 10 ml of buffer solution was poured into the
chromatographic column Ci.d. 12 mm) Buffer solution of pH 4.63 was
prepared by mixing equal volumes of 0.2 M acetic acid and 0.2 M
sodium acetate solution.. The resin was washed with 150 ml of buffer
solution.
V ml of the sample extract was neutralized to pH 7.0 with 1 M
potassium hydroxide (V being 75, 25, 1S, 10 or 5 ml according to the
expected histamine in the sample being analysed). This neutralized
extract was added to the column, washed with 150 ml of buffer solution
to remove interfering substances and the absorbed histamine was eluted

- 34 -
with exactly 25 ml of 0.2 M hydrochloric acid. A blank was prepared
by following through the same procedure.
Colour development
1 ml of the acid eluate was added to 15 ml of 5% sodium carbonate
solution in a stoppered test tube, previously cooled in an ice water
bath, followed by 2 ml of the chilled diazotising solution, prepared
according to Grundemeir and Andrews (1965). After mixing and allowing
the contents to stand at 0°C for 10 minutes, the absorption was
measured at 495 nm using distilled water as reference. The concentra
tion of )1istamine (H pg/ml) was then read off from· the standard
calibration curve (see below) and the histamine content of the fish
sample was calculated as follows:
H JJg histamine are present in 1 ml eluate
H X 25 IJg histamine are present in 25 ml eluate
H x 25 IJg histamine are present in V ml ~xirAc\
but 20 g sample gives 20M ( 200 + 100
) ml of homogenate
where M is the percentage moisture content of
The histamine content of 20 g of sample = H x
The histamine content of the sample = H (1000 +M) 40 V
mg/100 g

- 35 -
Preparation of standard calibration curve
A standard solution containing 1 mg of histamine free base
in ml of 0.2 M hydrochloric acid was prepared. O, 2, 4, 6 and B ml
of this solution were pipetted into 100 ml graduated flasks and made
up with 0.2 M hydrochloric acid. These solutions contain O, 20, 40,
60 and BD ~g/ml. 1 ml aliquots of these standard solutions were
treated as for the acid eluate, as described above. Another series
of standard histamine free base solutions containing 0, 500, 1000,
1500 and 2000 ~g were treated as for the sample extract, i.e. passed
through an ion-exchange column before colour development, as
described above. The absorbances obtained were plotted against the
concentration of histamine in ~g/ml.
b) Gas chromatographic method
Samples of histamine, and other amines, in various solvents
were injected on to a 1 meter glass column. Various injection temper
atures and column temperatures were used. The carrier gas used was
nitrogen and detection by flame ionisation. The column was prepared
as follows:
The stationary phase support (Gas-Chrom P, 80-100 mesh) was
treated with hydrochloric acid (12 M) and washed to neutrality. It
was then siliconized with dimethyldichlorosilane in toluene followed
by anhydrous methanol rinse. The support was then suspended in 4% w/ V
General Electric SE-30 siloxane polymer in toluene and filtered by
suction to remove the non-adsorbed phase and solvent. The column was
conditioned at 230°C under continuous nitrogen flow before use.

- 36 -
3.3 .2 Assessment of histamine stability
Preparation· of model system
A standard solution containing 100 mg histamine in 50 ml
distilled water was prepared and titrated against 0.02 M hydrochloric
acid using a pH meter. The titration curve was obtained by plotting
the volume of the acid against the pH values obtained.
Standard histamine solutions of various pH values were prepared
by adding 100 mg histamine free base to 100 ml graduated flask, the
required volume of 0.2 M hydrochloric acid (based on the results for
the titration curve) and was made up to the mark with distilled water.
The final pH value of the solution was noted. 10 ml of this solution
was pipetted into an ampoule which was then sealed in a bunsen burner
flame.
To study the effect of retorting, 3 ampoules were retorted at
121°C for 3 h while 3 controls were kept without retorting.
To study the effect of food additives, a ratio of 5:1 food
additive to histamine was used. 0 3 ampoules were retorted at 121 C
for 3 h while 3 controls were kept without retorting. The food
additives used were glucose, ribose, ascorbic acid and benzaldehyde.
Each ampoule was opened by breaking off the neck, the contents
were washed with 0.2 M hydrochloric acid into 200 ml graduated flask
and made up to the mark with 0.2 M hydrochloric acid.
Analysis of model system
The solutions were treated as for the eluted samples in Section
3.3.1a. The absorbance was noted and calculations were made as
follows:

- 37 -
The percentage recovery = A sample A control
x 100
The percentage loss = 1 00 -[A sample x 1 ool' LA control 'j
where A is the mean value of absorbance readings.
3.3.3 Mackerel canning
Mackerel were filleted and the belly flaps removed. The fillets
were cut into portions (to enable the cans to be packed easily), the
portions were washed with tap water and 160 g amounts were placed in·
UB cans and filled with 50 ml of either distilled water or standard
histamine solution (1 mg/ml). To some cans 250 mg of glucose was
also added. The cans were vacuum sealed.
3 cans were heat processed in a vertical retort at 115°C for
90 min. The processed cans were cooled with cold water, wiped and
dried. 3 control cans were kept without heat processing.
Each can was opened and the contents were mixed thoroughly in a
mortar. The contents were treated and analysed as in Section 3 •. 3.1a.
The absorbance was noted and the percentage loss calculated.
3.3.4 Mackerel salting and drying
Batches of fish were treated according to the scheme shown in
fig. 5, although not all the stages were carried out for each batch.
Histamine was analysed for at various stages as indicated.

- 38 -
fig. 5: flow diagram of mackerel salting and drying
Fresh mackerel
H
Whole & Gutted
24 h. storag .. 48 h. storage
Salting Salting Salting
H
Drying Drying Drying
Storage Storage Storage
(i)
® = Histamine analysis

- 39 -
Salting
Whole or gutted mackerel were mixed with salt (5 times the
weight of the fish) in a plastic box end left 0 for 46 hours at 3D C 0 or 20 C. The pickle was retained in the box. The fish were then
washed with tap water to remove excess salt.
Drying
The whole salted mackerel were split through the dorsal side
and washed with tap water after removal of the viscera and gills.
The gutted fish were split through the ventral side. The split fish
were transferred to a drying cabinet and dried at either 4B°C for 96
hours or 3D°C for 120 hours.
Storage
The dried salted fish were left at room temperature in a plastic
tray at 2D°C. Histamine was determined after 2 weeks, 3 weeks and
5 weeks storage.

- 40 -
4. RESULTS AND DISCUSSION
4.1 Selection end evaluation of methods for histamine determination
As mentioned under the aims of the present work (Section 2.5)
the initial part of this investigation was concerned with selecting
and evaluating a simple method for histamine determination. It was
hoped to find a method that could be used in developing countries in
the absence of very sophisticated equipment and with a lack of highly
trained personnel.
Two of the methods mentioned in Section 2.4 were investigated in
detail. The colorimetric method of Hardy and Smith (1976) and the
gas chromatographic method of Fales and Pisano (1962). The color
imetric method was selected as it offered the opportunity for
histamine analysis in the absence of eny expensive equipment i.e.
the colour could if necessary be determined using coloured discs or
Nessler tubes, even in the field. The gas chromatographic method was
selected even though it involved' a fairly expensive piece of equipment,
a gas chromatograph. Simple gas chromatographs are now becoming
fairly common pieces of equipment for quality control checks even in
developing countries and the method described by Fales and Pisano
appeared to permit determination of histamine and other diamines such
as cadaverine and putrescine directly without.derivatisation. Methods
involving fluorimetry, high performance liquid chromatography or
bioassays were considered to be inappropriate because of the equipment
required or the skills necessary in the operatives, and the high
sensitivity offered by some of these methods (i.e. determination of
histamine at the picomole level) is unnecessary when working on fish
and fish products.
4.1 .1 Calorimetric method
The method reported by Hardy and Smith (1976) depends on the

- 41 -
coupling of histamine with diazotised p-bromoaniline to yield a red
azo-dye, which is measured at 495 nm. The amount of histamine in
sample solutions is determined using a calibration curve.
Some potential problems with the method were investigated
including the stability of the diazotising solution, the stability
of the azo-dye when formed, and the effect of high histidine and
sodium chloride levels in the fish samples. The stability of histamine
solutions in the presence of light was also investigated.
The stability of the diazotising solution was examined by
reacting standard solutions of histamine (80 pg/ml) with diazotising
solutions that had been stored in ice for various periods of time.
The absorbances obtained did not vary by more than ~2% when using
diazotising solutions stored up to 6 hours, but for solutions stored
for longer periods of time progressively lower absorbances were
obtained. All subsequent histamine determinations were carried out
within 6 hours of preparing the diazotising solution.
In order to check the stability of the azo-dye formed, standard
solutions of histamine were reacted with the diazotising solution and
the intensity of the absorbances was measured after 10 min, 20 min
and 30 min storage in ice. The absorbances obtained for the histamine
solutions varied only slightly over the experimental period with the
20 ~g/ml and 40 ~g/ml absorbances increasing and the 80 ~g/ml absorbance
decreasing. The blank however showed the greatest change with the
absorbance increasing from 0.03 at 10 min to 0.06 at 20 min and 0.11
at 30 min. As a result of this experiment, it was decided that all
the absorbance values should be read at 10 min using distilled water
as the reference solution.
Whilst carrying out the above experiments it was noted that the
5% sodium carbonate solution added in the colour development step was

- 42 -
critical with regard to the intensity of the colour obtained. for \
example, when the sodium carbonate solution was made up from solid
sodium carbonate that had absorbed moisture (about 24%) during
storage, the absorbances were only about SO% of those obtained using
sodium carbonate solution made up from solid sodium carbonate contain
ing less than 1% moisture.
In the Hardy and Smith method the histamine extracts of the fish
were subjected to an ion-exchange resin treatment to remove interfering
substances. One common interfering substance is histidine, which can
be present in fish flesh in very large concentrations (see Section 2.3.1).
Histidine was found in this investigation to give a red colour with the
diazotising solution with an absorbance at 495 nm, which was about 60%
of that obtained with histamine solutions of the same concentration
(~g/ml). The ion-exchange column procedure for removing histidine was
checked and no histidine was found to be eluted with the histamine.
Hardy and Smith used this ion-exchange column clean-up procedure
only on fish that had not been processed and that contained no additives.
The effect of high sodium chloride levels was therefore assessed in
order to check the applicability of this method to salted and salted/
dried fish products. Solutions containing standard amounts of sodium
chloride in addition to histamine were subjected to the ion-exchange
column and colour development procedures. The sodium chloride was
found to cause a slight decrease in the absorbances and it is important
therefore that when dealing with salted fish products this
decrease is taken into account. This aspect needs to be further
investigated.
The stability of histamine solutions in the presence of light was
investigated in order to determine whether any decomposition took place
if samples were stored in clear glass containers or whether dark glass

.-----------------------------------
- 43 -
containers and other precautions were required. This was also
important with regard to carrying out the procedure in the field
in tropical countries.
Standard histamine solutions (50 ~g/ml) at different pH values
were prepared (in the same manner as those subjected to heat treatment,
see Section 3) and placed in ampoules that were sealed. Some were
exposed to light in the laboratory window for 12 days (in May);
controls were kept in the dark in a cupboard.
As can be seen from the results in Table B, exposure of pure
standard histamine solutions to light resulted in only small decreases
in histamine. The percentage losses were found to be in the range of
0.5-1.9% (mean value 1.09,SD 0.47) with pH having no significant
effect on the losses. These results indicate that provided histamine
solutions are used within a few days of preparation and direct sunlight
is avoided then losses are negligible when compared with other experi
mental errors discussed later.
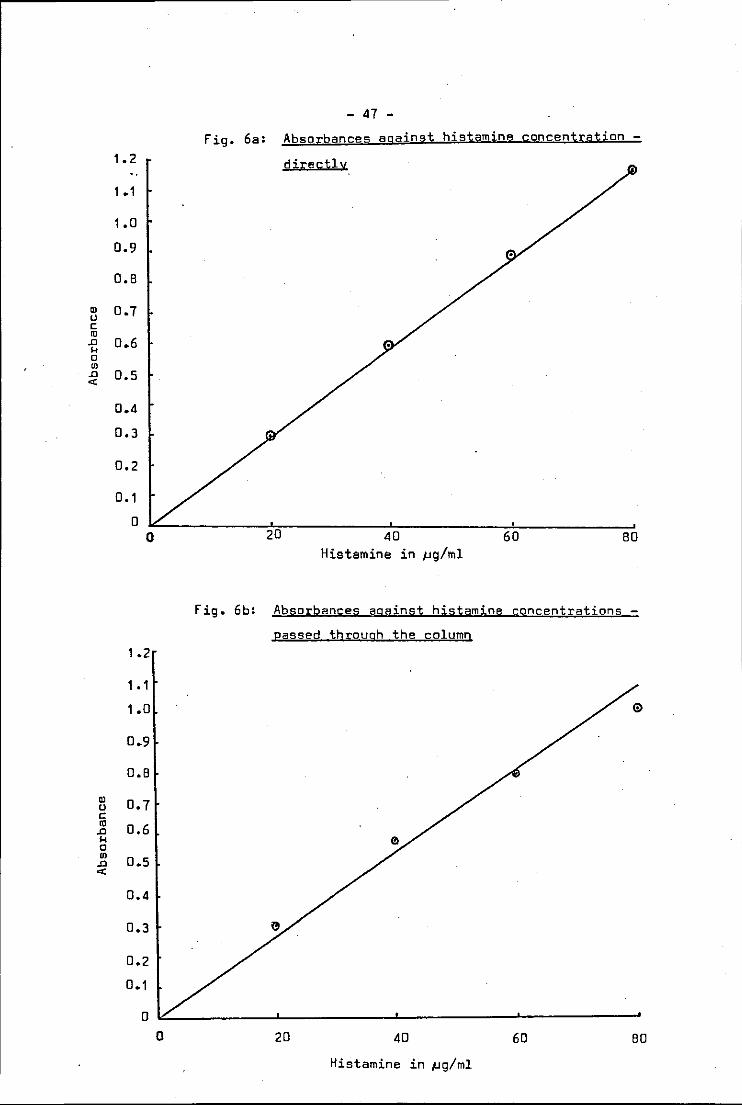
To prepare a standard calibration curve, histamine solutions
containing O, 20, 40, 60 and 80 ~g/ml were reacted with the diazotising
solution and the absorbances measured. The results are shown in
Table 9 and fig. 6a. Also, standard histamine solutions containing D,
500, 1000, 1500 and 2000 ~g histamine were passed through the ion
exchange column according to the standard procedure used with fish
extracts, the eluted solutions ~ontaining D, 20, 40, 60 and BD ~g/ml)
were reacted with the diazotising solution and absorbances measured.
The results are shown in Table 10 and, plotted in fig. 6b.
When the data in Table 9 are compared with those in Table 10, it
is seen that on passing the histamine through the column less consist
ent results were obtained as shown by the standard devi·ations of the
means for each of the concentrations, which are on average about twice
as high for solutions passed through the column as those analysed

- 44 -
Table 8: The effect of light on standard histamine solutions
*
pH % Loss*
2.6
2.7
3.3
4.9
6.6
6.9
10.1
10.7
The figures are means of triplicates.
are given in parentheses.
0.6 ( 0.1 )
1 .1 (0.9)
1 .1 (0.5)
0. 9 (2.0)
1 • 6 (2.2)
1 .o (0.2)
1.9 (0.9)
0. 5 (0.3)
Standard deviations
'

Table 9: Absorbances obtained from standard histamine solution - directly
Experiment Absorbance!'!. correlation
number Histamine concentration in )Jg/ml coefficient, r
0 20 40 60 80
0.012 0.295 0.572 0.878 1 .136 0.9998
2 0.013 0.297 0.588 0.879 1 .146 0.9999
3 0.017 0.299 0.594 0.912 1 .187 0.9998
4 0.019 0.296 0.612 0.696 1 .206 0.9996 "" "' 5 0~017 0.298 0.606 0.905 1 .197 0.9999
6 0.013 0.296 0.578 0.879 1 .141 0.9996
X 0.015 0.297 0.592 0.892 1 .169 0.9999
so 0,003 0,002 0,016 0.015 0.032

Table 10: Absorbances obtained from standard histamine solutions - after passing through
the ion-exchange column
Experiment Absorb13nces
number Histamine concentration in }Jg/ml
0 20 40 60 BD
1 0.010 0.303 0.594 0.775 0.975
2 0.013 0.330 0.548 0.798 1. 245
3 0.016 0.290 0.587 0.758 0.958
4 0.011 0.287 0.593 0.848 0.986
5 0.014 0.293 0.585 0.827 0.986
6 0.019 0.312 0.547 0.786 1. 218
" 0.014 0.302 0.576 0.799 1 .061
50 0.003 0.016 0.022 0.034 0.132
correlation
coefficient, r
0.9939
0.9915
0.9940
0.9923 .. "' 0.9944
0.9927
0.9931
- 47 -Fig. 6a: Absorbances agains:t histamine !;;;Oncen:t;ra:tion -
1.2 di;t:e~~llo(
1 .1
1. D
D.9
D.B
" D.7 u c 10 .a D.6 k 0 m .a D.S et
D.4
D.3
D.2
D.1
D 0 2D 4D 6D BD
Histamine in JJg/ml
Fig. 6b: Absorbances against histamine concent;rations -
eassed th;~:ough the column
1 .2
1 • 1
1 .D
D.9
D.B
" D.7 u c 10 D.6 .a k 0
" D.S .a <C
D.4
D.3
D.2
D.1
D 0 2D 4D 6D BD
Histamine in }Jg/ml

- 48 -
directly. It is also seen that lower correlation coefficients are
obtained for histamine through the column, indicating a less good
linear relationship possibly due to lower absorbances at higher
histamine concentrations as a result of some histamine being washed
off the column with the interfering compounds. (see Figs. 6a and 6b).
4.1 .2 Gas chromatographic method
The method reported by Fales and Pisano (1962) was selected as
one of the two methods investigated in detail because it offered the
possibility of determining putrescine and cadaverine in addition to
histamine. However Fales and Pisano were working with standard pure
solutions and not with food extracts.
The method described by Fales and Pisano involved using a column
with a Gas-Chrom P, 80-100 mesh, support and glasswool for the flash
heater zone, both treated with hydrochloric acid (12N) and washed to
neutrality. After acid treatment the support material was siliconized
with dimethyldichlorosilane in toluene followed by an anhydrous
methanol rinse. The support was then suspended in 4% w/v General
electric SE-30 siloxane polymer in toluene and filtered by suction to
remove the non-adsorbed phase and solvent. After drying at 100°C over-
night, the
for 2 to 3
column was packed and was ready for use after conditioning
hours at 250°C.
The column used in this investigation was prepared according to
Fales and Pisano and the gas chromatograph conditions were set initially
as described in their paper. Various amines such as benzylamine,
aniline and pyridine either pure or in chloroform were injected onto
the column and sharp peaks were obtained. Histamine is insoluble in
most organic solvents and reacts with others, for example, acetone,
and therefore some difficulty was experienced in obtaining solutions
for injection. The most suitable solvents were found to be water,

- 49 -
0.2M hydrochloric acid, ethanol and propanol. Pure histamine and
standard histamine solutions at different concentrations were injected
onto the column. The gas chromatograph conditions were adjusted to
obtain the best peaks with least tailing. The results obtained when
using propanol as solvent are shown in Fig. 7. It was found that
decreasing the concentration of histamine solutions from 50% to 14%
resulted in longer retention times and broader peaks. Similar
results were obtained with other solvents. Attempts to improve the
peak shape by, for example, increasing the temperatures of the
injection and the column end by inactivating the column with concent
rated hydrochloric acid proved unsuccessful. This made the method
unsuitable for estimating histamine in fish since it would prove
impractical to concentrate the histamine levels sufficiently.
Although methods for histamine analysis involving derivatisation
before gas liquid chromatography have been suggested (see Section 2.4),
it was decided for this investigation to use the calorimetric method
rather than spend time in developing these gas chromatographic methods.
4.2 Histamine determination in fish products from P • .D.R. Yemen
Before commencing the investigation of changes in histamine levels
during processing, several samples of various fish products from P.D.R.
Yemen (the author's home country) were analysed for histamine in order
to assess the suitability of the calorimetric method for large numbers
of determinations on processed fish.
Canned mackerel (1. japonicusl in tomato sauce, brine or oil
produced by two different canneries were analysed. The mackerel were
caught off the P •. n.R. Yemen on December 6th, 1982, frozen on board the 0
fishing vessel, stored at -18 C, unloaded at two nearest ports to the
canneries, transported by road in refrigerated vehicles and canned
during January 1983 (Cannery A) and February 1983 (Cannery B).

50 -
Fig. 7: Gas chromatography peaks for histamine solutions in propanol
1.61 min propanol
5o% solution
1. 7 min 3'ffo solution
--,~-~==================================================~ (
7 1. C:8 min 2'5fo solution
2.33 min 2CJ% solution
3.09 min 17% solution
-14% solution

- 51 -
The results of histamine analysis of these samples are shown in
Table 11. The pH values of samples were also assessed in order to
select the pH values under which further experiments on canning could
be performed later in this investigation. The histamine content was
found to be in the range of 0.7-4.8 mg/100 g product. Scottish
canneries maintain a standard limit for histamine of not greater than
5 mg/100 g of finished product. The above analysed canned samples
were found to have levels below this limit, although in some cases
only just below.
The relatively low histamine levels obtained indicates that the
handling of the raw material prior to canning was satisfactory for
these samples. However in practice toxic effects result from occasional'
batches of fish with high histamine levels due to poor handling. Even
though low levels were obtained in the analysed samples, it is
important that checks are kept on the products and advice given to
the producers on handling the raw material and the cannery workers to
maintain good handling and to achieve low levels of histamine in the
end-product.
In addition to the canned fish products, dried and salted/dried
fish products were analysed for their histamine content. The moisture,
salt and water activity were also determined in order to check if
microbial growth was still possible during storage. In each case, no
microbial growth would be possible i.e. the water activities are 0.64
or less. The fish products analysed were: salted and dried cat fish
(Arius maculatus), dried sardines (Sardinella longiceps), dried sea
bream (Nemipterus japonicus) and dried sea cucumber. The histamine
levels (given in Table 12) are in the range 0.0-5.5 mg/100 g product.
These results are far below the levels that may be expected to cause
scombrotoxin poisoning (about 100 mg/100 g) and are much below the
levels obtained for various samples of cured fish from South East
Asia reported by Hanson ~si· (1984) (see Section 2.3, Table 7).

Table 11: Histamine content in canned mackerel
Cannery A Cannery B
Can tomato sauce brine oil tomato sauce
number pH Hi~t8mine pH Histamine pH His~i;aTnine pH Histamine mg/100 g mg/100 g mg/100 g mg/100 g
1 5.63 2.4 5.94 3.8 5.92 4.3 6.00 3.2
2 5.49 2·2 5.95 4.6 5.93 4.0 5.73 3.6 U1
"' 3 5.59 3 .1 6.05 3.6 5.95 4.1 5.75 3.0
4 5.52 2.5 5.97 4.7 5.95 4.0 5.61 2.5
5 5.72 0.7 6 .01 4.8 5.92 4.1 5.77 2.6
6 5.47 2.9 5.92 3.5 5.97 4.1 5.77 2.6
7 5.57 2.6 5.96 3.5 5.70 2.5
8 5.71 3.3 5.90 4.2 5.73 3.2
9 5.53 2.7 5.95 4.1 5.72 3.8
-X 2.5 4. 1 4.1 2.96
SD o. 75 0.52 0.11 0.48

- 53 -
Table 12: Analysis of salted and salted/dried fish samples*
moisture
catfish 15.2
sardine 16.52
sea bream 16.58
shark 15.31
sea cucumber 15.96
salt
%
32.56
11.79
11 • B 1
19.69
9.38
a w
0.48
0.64
0.63
0.48
0.52
histamine
mg/100 g
o.o
1.2-5.5
2.6
1. 5
o.o
* The figures for moisture, salt, aw and histamine are averages of
triplicates except for sardines when the histamine figures were
obtained for 6 batches each analysed in triplicate and hence are
given as a range.

- 54 -
However the South East Asian samples were obtained from retailers,
often after prolonged storage, Hansan and McGuire (1982), whereas
the P.D.R. Yemeni samples were obtained directly from a government
corporation.
Of interest here is the research work being carried aut at
Tarry Research Station, Aberdeen, Ministry of Agriculture, fisheries
and food: a comprehensive programme to analyse the histamine content
of various fish and fish products either produced in the U.K. er
imparted from other countries. The aim of this work is to establish
a standard histamine level in fish and fish products to be used as a
standard guide in the U.K. The proposed maximum level is 5 mg/100 g
(Murray, 1963). This proposed histamine level will be further
discussed with other countries and when agreed upon it might be used
as an international standard.
These analyses of the P.D .R •. Yemeni fish samples showed the
calorimetric method can be used without difficulty an large numbers
of fish products and it appears to be suitable fer use with minimum
facilities and under field-work conditions.
4.3 Effect of heat and food additives on histamine levels
in canned fish
The second major aim of this investigation was to attempt to
decrease histamine levels in canned fish, i.e. assuming that there
are already high histamine levels in fish flesh before canning, due
presumably to poor handling, then is it possible to reduce these
levels? This is of particular importance in developing countries
where it can be difficult always to obtain material far canning that
is in good condition. Initial experiments to assess the effect of
heat and various food additives on histamine were carried aut with
standard histamine solutions (10 mg in 10 mll in sealed ampoules in
the absence of fish flesh. Later experiments were carried aut with
mackerel flesh "spiked" with standard amounts of histamine, in the
absence and presence of glucose.

- 55 -
4.3.1 Stability of histamine on prolonged heating
It has been suggested by some research workers that stronger
heat treatments applied to the canned product would lead to lowering
of histamine levels (see Section 2.3).
To study the effect on histamine of prolonged heat treatment,
pure standard histamine solutions were retorted at 121°C for 180 min
at different pH values. This is equivalent to an fo of 180 and
clearly is much greater heat treatment than is possible with canned
fish, where typically fo values of about 14 are used. The resultg
calculated and expressed as the percentage loss compared with controls
that were not heat treated are shown in Table 13~
It can be seen that there is a wide variation in the results
for each individual experiment, as would be expected from the experi-
mental errors involved in the calorimetric method, as discussed above.
Therefore for each pH value a total of 18 determinations were carried
out in order to obtain reliable results. The mean percentage loss
falls within a fairly narrow range, 3-4.7%, for all pH values studied,
i.e. no pH effect was observed within the range investigated.
It can be concluded that the heating given to cans during heat
processing, for example, 90 min at 115°C, would lead to only negligible
loss of histamine if no other interactions were occurring, and altering
the pH of the canned material within reasonable acceptable limits
would not have any effect on this.
4 .3 •. 2 Stability of histamine on prolonged heating in the
presence of food additives
It was decided to add food additives that could react with
histamine in solution to study their effect on the, stability of
histamine when subjected to prolonged heat treatment. It was hoped
in this way to be able to decrease the histamine levels in canned fish.

Table 13: The percentage losS in histamine on heating at 121°C for 180 min*
pHt Percentage loss - six experiments
1 2 3 4 5 6 Overall mean
2.8 2.8 ( 1 • 8) 4.2 ( 0.3) 5.9 ( 2. 8) 1 .1 ( 2. 6) 1.2 ( 0. 6) 4.1 (0.2) 3.2 ( 1 • 9 )
5.0 2.4 ( 1 • 6) 6.8 (4.0) 4.9 ( 1 .1) 0.3 (0.8) 1 • 1 ( 0. 1 ) 3.0 (0.5) 3.0 (2.4)
6.0 0.8 (0.3) 1.7 (3.0) 10.5 ( 1 • 6) 4.2 ( 1 • 1 ) 5.3 ( 1 • 9) 3.7 ( 2. 1 ) 4.4 (3.4) U1
7.0 0.6 ( 1 • 7) 1 .2 ( 1.3) 1.4 ( 1 .4) 9.3 (2.9) 1 o. 9 ( 3.1 ) 4.7 ( 1. 5) 4.7 (4. 5) 0\
1 D. 5 1.9 (2.9) 10.4 ( 1.5) 7.0 ( 1 0.3) 0.4 ( 1 • 5 ) 1 • 3 ( 0.6) 7.1 (4. 2) 4.7 ( 3. 5)
* The figures are means of triplicates. Standard deviations are given in parentheses.
t The pH ranges were 2.8! 0.1, 5.0 + 0.1, 6.0 + 0.1, 7.0 + 0.3 and 10.5 + 0.2.
- 57 -
Various food additives were added to standard histamine solutions
that were subjected to prolonged heat treatment (121°C for 180 min),
as mentioned in the Experimental Section, Losses were calculated
relative to controls which were not heat treated. Two factors were
taken into consideration when selecting the food additives: firstly,
food additives that might be able to decrease the histamine levels
and secondly, food additives that do not cause any hazard to human
health when added to fish products prior to canning and are legally
permitted.
As described in the literature survey (Section 2.2) histamine
can undergo various reactions, including those involving the primary
amino group, e.g. in non-enzymic browning reactions with reducing
sugars such as glucose.
Initial experiments involved the addition of D-(+)-glucose to
standard histamine solutions in the ratio of 5:1 (w/w) at different
pH values. The results are shown in Table 14. A large number of
replicates were carried out in each case in order to obtain reliable
results. The loss of histamine was about twice that obtained when
retorting standard histamine solutions in the absence of glucose,
except for the alkaline solutions (pH 10.5) when the losses were far
higher. This increased loss in the alkaline solution was in accord
ance with the intensity of the brown colour obtained after retorting;
it was observed that, the higher the pH, the greater the brown colour
obtained. This suggests that a non-enzymic browning reaction has
occurred, thus rendering the histamine unavailable for coupling with
the diazonium solution.
A second series of experiments involved addition of other food
additives to standard histamine solutions. Only one pH value was
used for this experiment, i.e. a pH value of 6.0 ! 0.2, which is
typical of commercially canned fish (see Table 11 above). The

- 56 -
Table 14: The percentage loss in histamine on heating
(121°C for 160 minl in the presence of
D-(+l-glucose
pH* Number of Percentage
replicates losst
3.0 16 7.3 ( 6 .B)
6.0 16 7.1 (3.0)
6.5 12 7.1 (9.7)
10.5 B 23.7 ( 9.1 )
*
t
The pH rangeswere 3.0 + 0.5, 6.0 + 0.2, 6.5 + 0.2 and
10.5 + 0.1.
Standard deviations are given in parentheses.

- 59 -
additives used were ribose (a reducing sugar that also undergoes
non-enzymic browning), ascorbic acid and benzaldehyde, in addition
to glucose. ·The results were calculated and expressed as the
percentage loss compared to controls which were not heat treated.
The means percentage loss for three replicates in each case
are as follows, with standard deviation given in parentheses:
ribose 8.1% (4.7), ascorbic acid 4.2% (5.5), benzaldehyde 3.8% (3.1).
Glucose gave a mean percentage loss of 7.9% (3.0), in good agreement
with the previous results for glucose. The brown colour obtained
with ribose was more intense than that obtained with glucose. Frotm
the processing point of view, if ribose is added prior to canning to
fish flesh containing histamine, the brown colour that will be
obtained in the end-product might render it unacceptable to the
consumer.
4.3. 3 Stability of histamine on heating in the presence of
fish flesh
The effect of heat treatment on standard histamine solutions in
the presence of fish flesh was also studied, both without and with
added glucose, i.e. "spiked" samples of mackerel flesh were subjected
to the canning process. Glucose was the only additive assessed in
this way since it gave higher losses in the previous experiments than
ascorbic acid and benzaldehyde and is less expensive and more readily
available than ribose. Histamine was added at a level of about 25 mg
per 100 g of can content (i.e. 50 mg per can), glucose was added in a
5:1 ratio (w/w) to histamine i.e. about 125 mg/100 g of can content,
which is well below the taste" threshold of glucose.
Mackerel (~. scombrus) were filleted, cut into portions to achieve
good packing in the U8 can, "spiked" with standard histamine or
histamine/glucose solutions and heat processed at 115°C for 90 min.
- 60 -
The temperature and time were selected in order to work with the same
conditions as used in commercial production of canned mackerel, The
percentage loss (for triplicates) was calculated compared to controls
which were not heat processed.
In the absence of glucose a loss of histamine of about 16%
(16 replicates, S.D. 17.7) occurred while with glucose the loss was
about 36% (5 replicates, S.D. 7.9), Only a very slightly increased
browning was observed with added glucose.
The percentage loss obtained with added glucose needs to be
confirmed in further experiments and at different concentrations of
histamine and glucose, although these preliminary results suggest
that this could be a way of substantially reducing histamine levels
in canned fish. Further investigation should be carried out to see
if the reduction in histamine levels also leads to a reduction in
the potential for causing scombrotoxin poisoning.
4.4 Changes in histamine levels during fish salting. drying
and subsequent storage
Salting and drying are among the most important methods for
processing fish throughout the world in particular in developing
countries. High levels of histamine have been reported in many samples
of salted/dried fish (see Section 2.3.2) and a few cases have been
notified of illness due to the consumption of these fish. However it
should be noted that the countries where large amounts of salted/dried
pelagic fish are consumed, are in general those that do not keep a
check on scombrotoxin poisoning outbreaks (see Section 2.1.1), and
therefore the incidence of scombrotoxin poisoning due to salted/dried
fish may be higher than is at present apparent.

- 61 -
The third aim of this investigation was to study the changes
in the histamine levels during fish salting, drying and subsequent
storage. The fish species used in this investigation was mackerel
(5. scombrus) as it is closely related to several species of fish
that are commonly salted and dried in many countries (see Section
2.3.2).
The effect of salting was studied either directly on the fish
as received, or after 24 or 48 hours held at room temperature, in
order to increase histamine levels before processing, i.e. simulating
poor handling. The effect of gutting the fish before processing was
also studied. Two different temperatures, 20°C and 30°C, were
selected for salting, although the lower temperature is more typical
of the temperature found in salting tanks, even in tropical countries
and therefore this temperature was used for most of the experiments.
The effect of drying was studied initially at 48°C but it was found
that at this temperature partial cooking of the fish flesh occurred
and subsequent drying experiments were carried out at 30°C. The
final batch was stored for five weeks at 20°C. The histamine levels
were determined at each step of the processing.
for whole mackerel (Batch 1) on salting at 30°C
The results obtained
and drying at 48°C D
are given in Table 15, for whole and gutted mackerel salted at 20 C
are given in Table 16 (Batch 2) and Table 17 (Batch 3); for whole
and gutted mackerel (Batch 4) salted at 20°C and dried at 30°C are D given in Table 18 and on subsequent storage at 20 C in Table 19.
The results given in the tables are means for three individual fish
and quoted in terms of mg per 100 g of sample, i.e. not in terms of
dry weight basis. The results were not corrected for lowering of
absorbance in the calorimetric determination of histamine by the
presence of salt, as previously discussed, however the percentage
correction is small (less than +4%) even at the highest histamine
levels and does not significantly affect the trends observed.

- 62 -
Table 15: Histamine concentrations in the flesh of whole mackerel
(Batch ll pn salting (48 hr at 30 + 2°C) and drying
(96 hr at 48°C + 1°C) ---
Time in hours
stored at 30+2°C -before salting
0
24
Histamine
before
salting
0.8
4.0
concentration
after
salting
13.8
ao.o
(mg/100 g)
after
drying
30.3
470.0

- 63 -
Table 16: Histamine concentrations in the flesh of whole and
gutted mackerel (Batch 2) on salting (48 h at 20 ! 3°C)
Whole ( W) Time in hours Histamine concentration(mg/100g)
or stored at 20+3°C before after
Gutted (G) before salting salting salting
w 0 1. 7 23.8
w 24 9.2 84.0
w 48 95.0 210.8
G 0 1.7 5.2
G 24 12.0 36.6
G 48 49.3 137.3

- 64 -
Table 17: Histamine concentrations in the flesh of whole and gutted
mackerel (Batch 3) on salting (48 h at 20 ~ 3°C)
Whole (W)
or
Gutted (G)
w w w G
G
G
Time in hours
stored at 20+3°C
before salting
0
24
48
0
24
48
Histamine concentration(mg/100g)
before
salting
0.5
1 • 9
13.2
0.5
2.2
12.0
after
salting
2.8
31 .3
167.8
2. 1
25.1
116. 3
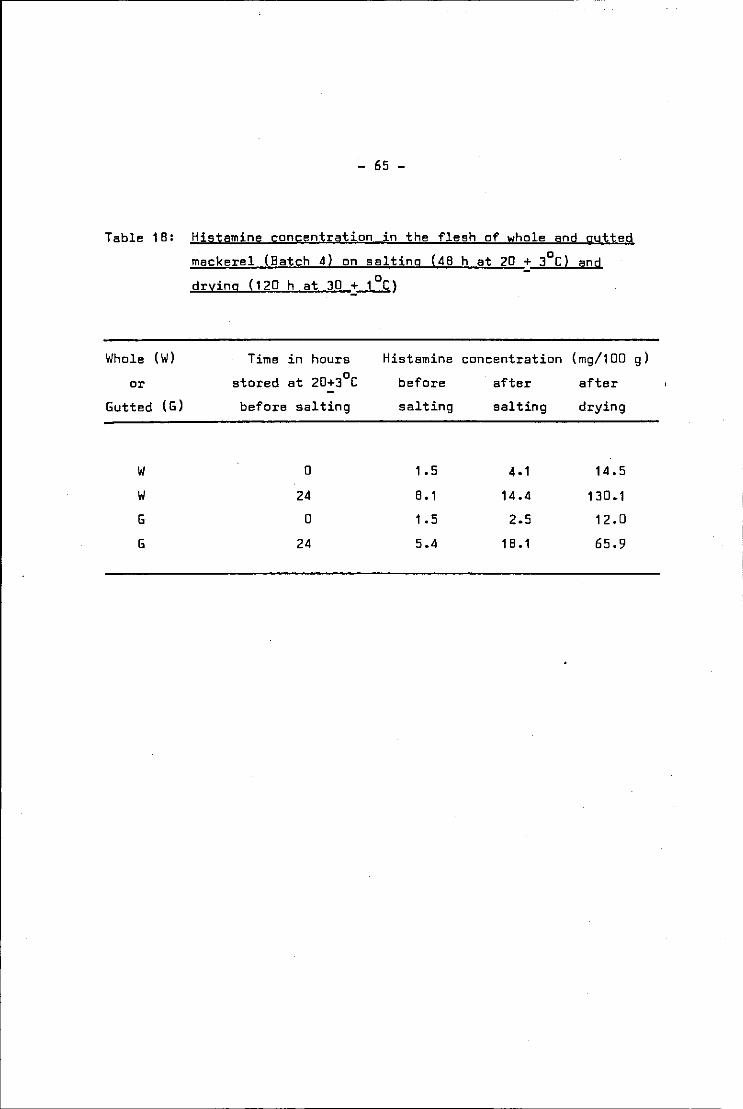
- 65 -
Table 1B: Histamine concentration in the flesh of whole and gutted
mackerel (Batch 4} on salting (4B h at 20 + J°C} and
drying (120 h at 30 :~>
Whole (W}
or
Gutted (G)
w w G
G
Time in hours
stored at 20+3°C
before salting
0
24
0
24
Histamine concentration (mg/100 g)
before
salting
1 • 5
B. 1
1.5
5.4
after
salting
4-1
14.4
2.5
1 B .1
after
drying
14.5
130.1
12.0
65.9

- 66 -
Table 19: Histamine concentrations in the salted/dried flesh of
whole and gutted mackerel (Batch 4) on storage at
20 + 3°C -----
Whole ( W) Histamine concentration (mg/100 g)
or on storage (weeks)
Gutted (G) 0* 2 3
w 14.5 24.2 25.6
w 130.1 137.3 155.1
G 12.0 14.2 14.6
G 65.9 101.3 96.2
* Initial values are after drying for the same samples as given
in the previous table.
5
62.9
242.1
35.2
126.6

- 67 -
On leaving the fish for a period of 24 hours prior to salting
it can be seen from the results obtained that this leads approximately
to a five-fold increase in the histamine level for both whole and
gutted fish. Similarly a five-fold increase occurs on leaving for a
further 24 hours. This is in agreement with previous studies which
indicate that histamine increases rapidly in storage at these temper
atures (see Section 2.3.2).
An initial experiment was carried out on salting whole fish at
30°C. The histamine level was found to increase about twenty-fold
(see Table 15). Repeating the salting experiment with both whole and
gutted fish at 20°C again showed very large increases in the histamine
levels, with increases in general higher for the whole rather than the
gutted fish. When all the data at 20°C are considered, data for
each of whole and gutted fish (from Tables 16, 17 and 18), then
correlation coefficients are obtained of D.BD (significant at 2.5%
level) for the whole and Q .• 84 (significant at 1% level) for the gutted
fish. In Fig. 8 the concentrations of histamine before and after salt
ing are plotted, but only for histamine concentrations before salting
in the range 0-14 mg/100 g. Where the concentrations of histamine
before salting is well above this range (one value for whole and one
value for.gutted) then these values are excluded from the graph for
convenience with respect to the graph scales. When these seven data
for each of the whole and gutted fish are considered, then correlation
coefficients are obtained of 0.85 .!significant at 2.5% level) for the
whole and D.BD (significant at 5%· level) for the gutted. In Fig. 8 the
best straight lines are plotted for the two sets of seven data and the
eq~ations of the lines are y • 1Dx - 6.3 for the whole and y = 6.45x -
3 •. 1 for the gutted. It is seen that whereas the histamine concentration
of the whole fish increases by about ten-fold on salting, that of the
gutted increases only by about six-fold. However more results are
needed in order to confirm this effect of gutting.
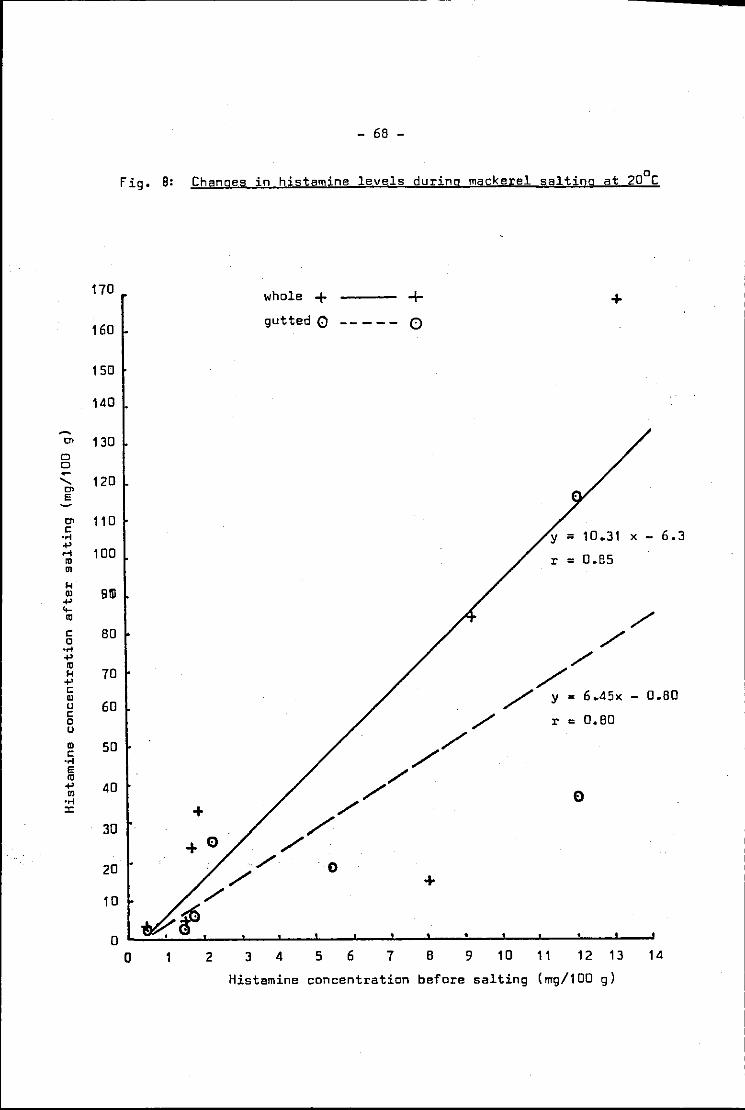
- 68 -
Fig. 8: Changes in histamine levels during mackerel salting at 20°C
170 whole + + +
160 gutted 0 ----- 0
150
140
0> 130 0 0 ~ ...... 0>
120 E
0> 110 1: .... " 10.31 X - 6.3 +' .... 100 0.85 "' r = " " Q) BID +' .... "' 1: BD 0 .... +'
"' " 70 +' 1: 6.45x - o.ao " y = u 60 1: 0 r = o.ao u
" 50 1: .... E
"' +' 40 Ill 0 .... :I: +
30
20 0 +
10
0 0 2 3 4 5 6 7 8 9 10 11 12 13 14
Histamine concentration before salting (mg/100 g)

- 69 -
Drying at both 30°C and 48°C resulted in an increase in the
amount of histamine per 100 g of sample (see Tables 15 and 18). The
whole fish were split and opened before drying, hence "whole" and
"gutted" in Tables 15 and 18 (and also Table 19) refers to the state
of the fish before salting that were subjected to drying. The results
can also be considered on a salt-free dry weight basis in order to
check if histamine is actually produced during drying, or if the
increased concentration is simply due to the concentrating effect of
moisture loss. The salt-free dry matter was found to increase from
about 30% before salting to about 40j' after salting to about 55%
after drying, and remained almost constant during the subsequent
storage.Clearly, even when the results are considered on this basis,
histamine is definitely produced during drying.
Finally the last batch was subjected to storage after drying for
a period of five weeks (see Table 19). The results obtained are
plotted in Fig. 9. The histamine concentrations during storage
generally reflect how the fish were treated before salting, i.e. higher
for those held for 24 h before salting and higher for the fish salted
whole. It is clear that there is an increase in the histamine levels
compared to the initial levels after drying with this increase contin
uing even up to 5 weeks. Further storage trails need to be carried
out to.confirm and explain these trends.
From the results obtained in this investigation, it is clear that
there is an actual increase in the histamine levels for both whole and
gutted fish during salting, drying and subsequent storage. When the
fish were held at room temperature to simulate poor handling, as is the
case in many developing countries, the increase was even higher than
in those salted directly as received. Gutting the fish prior to salt
ing appears to slow down the rate of histamine production and this is
clearly of importance in preventing high histamine levels in the end
product, especially when these samples are subjected to drying and
storage.

- 70 -
Fig. 9: Changes in histamine concentration levels during storage
of salted/dried mackerel (Batch 4)
~
D D ... " ~ E
c 0 ·~ ~ m ~ ~ c ID u c 0 u ID c ·~ E m ~ m ·~ ~
W24 - samples held 24 hours before salting whole
G24 - samples held 24 hours before salting gutted
W - samples salted directly whole
G - samples salted directly gutted
260
240
no
200
180
160
140
120
100
80
60 -40
20
0 0 1 2 3 4
Weeks of storage after drying
5

- 71 -
It has been generally accepted that histamine is produced by
the bacterial decarboxylation of the amino acid histidine rather than
by autolysis (see Section 2.3.1). The histamine forming bacteria are
not salt tolerant and their growth would be suppressed during the
processes studied in this investigation, but that does not apply to
the bacterial decarboxylase activity which can continue after bacter
ial growth ceases.
The increases in histamine levels that were observed in this
investigation are probably due in part to bacterial decarboxylase
activity, possibly in localised areas of the fish flesh where salt
penetration and drying were relatively slow, but may also be due to
the bacterial decarboxylase enzymes even when bacterial growth has been
suppressed. Additionally, autolysis may also be operative when the
bacterial growth is suppressed. The mechanism of production of hist
amine under these conditions therefore needs to be investigated
further so that methods to prevent or minimise histamine production
may be developed.

-72-
5. CONCLUSIONS
The following conclusions can be drawn from this investigation:
1. The colorimetric method for histamine determination was
found to give reliable results on analysing a large
number of fish samples. This method, in addition to
being reliable, is also a simple low cost technique
which can be performed relatively easily.
2. . The gas chromatographic method reported by fales and
Pisano (1962) was found to be unsuitable for deter
mining histamine in fish samples.
J.. Histamine was found to be relatively stable when standard
histamine solutions were subjected to prolonged heating
(121°C for 180 min). The loss of histamine was less
than 5%. This loss increased in the presence of ribose
and glucose. Moreover, working with the same conditions
as used in commercial production of canned fish (115°C
for 90 min) the loss of histamine was about 16% in the
presence of fish flesh and up to about 36% in the presence
of fish flesh and glucose. It is suggested that the
addition of glucose to canned mackerel prior to heat
processing may assist in decreasing existing histamine
levels.
4. Histamine concentrations were found to show large increases
during salting, drying and subsequent storage o·f mackerel.
The increases were more apparent with whole than with gutted
fish. Leaving the fish prior to salting for a period of
time at higher temperatures resulted in high levels of
histamine. Accordingly, if fish are meant for salting,
then in order to avoid high histamine levels, they need to
be correctly handled, and gutted as soon as possible,
particularly if they are to be subjected to drying and
prolonged storage.

- 73 -
6. RECOM,1ENDATIONS FUR FUTURE WORK
Based on the results obtained from this investigation the
following further work is recommended:
1. Assessment of the effect of sodium chloride in combination
with different histamine concentrations on the colorimetric
method will help to confirm its applicability to the
analysis of histamine in salted/dried fish products.
2. Assessment of the build-up of histamine levels in sccmbroid
fish in P.D.R. Yemen during handling, processing and
distribution chains will help to develop guidelines for the
fishery sector on how to handle these fish in order to
minimise histamine levels.
3. The percentage loss of histamine obtained with added glucose
in the presence of the fish flesh needs to be confirmed in
further experiments and at different concentrations of histamine
and glucose. This could be a way of substantially reducing
histamine levels in canned fish. If successful then, clinical·
trials would need to be carried cut to see if the potential
for causing scombrotcxin poisoning is also reduced.
4. The mechanism of histamine formation when microbial growth
is suppressed, i.e. during salting and drying, needs to be
fully studied.
5. Assessment of the changes in the histamine levels during
smoking of pelagic fish also needs to be investigated since
similar increases in histamine levels may occur.

- 74 -
7. REFERENCES
Anon (1975). Scombroid poisoning. New York City. ~1orbid. Mortal., ].!, 342-347.
Arnold, S.H. and Brown, \I.D. (1978). Histamine (7) Toxicity from fish products. Adv. Fd Res., Vol. 24, 113-154.
Ayres 1 P.A. ( 1979). Biotoxins in fish: a review. Middlesbrough: Association of Sea and Air Port Health Authorities.
Barsoum, G.S. and Gaddum, J.H. (1935). The pharmacological estimation of adenosine and histamine in blood. J. Phys. lend., .Jl..2., 1-14 •.
Beaven, M.A. (1978). Histamine: Its role in physiological and pathological processes. Monographs in Allergy, Vol. 13, 5. Karger-Basel, London.
Best, C.H., Dale, H.H., Dudley, H.W. and Thorpe, W.V. (1927). The nature of the vasodilator constituents of certain tissue extracts. J. Phys., fl, 397-417.
Bjeldanes, L.F., Schutz, D. and Morris, M. (1978). On the etiology of scombroid poisoning: Cadaverine potentiation of histamine toxicity in guinea pig. Fd cosmet. Toxicol., ~,157.
Blackwell, B., Mabbitt, L..A. and Marley, E. (1969). Histamine and tyramine content of yeast products. J. Fd Sci., ].!, 47-51.
Boulton, A.A., Cookson, B. and Poulton, R. (1970). Hypertensive crisis in a patient on MAOI antidepressants following a meal of beef liver. Can. Med. Assoc. J., j]Z, 1394-1395.
Cann, D.C. (1982). Hygiene. In "Fish Handling and Processing". Ed. by A. Aitken, I.M. Mackie, J.H. Merritt and M.L. Windsor, pp. 168, 191. Her Majesty's Stationery Office, Edinburgh.

- 75 -
c .. D.C. (Canters for Disease Control, 1981 ). Foodborne Disease Surveillance. Annual Summary 1979. U.S. Department of Health and Human Services.
Code, C.S. and Mcintire, f.C. (1956). Quantitative determination of histamine. Methods Biochem. Anal.,~. 49-95.
Connell, J.J. (1980). Control of fish Quality. 2nd Edition, pp. 21, 222. fishing News (Books) Ltd., farnham, Surrey, England.
Cruickshank,.J.G. and Williams, H.R. (1978). Scombrotoxic fish poisoning. Br. Mad. J., _I, 739-740.
\ De Waart, J., Van' Aken, f. and Pouw, H. (1972l.
Detection of orally toxic microbial metabolites in food with bioassay systems. Zentralbl. Bakteriol •• Parasitenkd., Infektionskr. Hyg., Abt. 1 'Orig., 211., 96-114.
Douglas, W.W. (1982). Histamine and 5-Hydroxytryptamine (Serotinin) and their Antagonists. In "Pharmacological Basis of Therapeutics". 6th Ed., Chapter 26, June, 1982. Ed. by L.S. Goodman and A.G. Gilman, Macmillan, New York.
Durand, G. (1973). In "Histamine", Ed. C. Mastinski, p. 149. Dowden Hutchinson and Ross, Stroudsburg, PA.
Eggerth, A.H. (1939). The production of histamine in bacterial cultures. J. Bacterial., 11, 516-519,
Ehrismann, 0. and Werle, E. ( 194 8). Uber Histidindecarboxylase, Histidindecarboxylase und Histaminase der Bacterien. Biochem. Z,, ~. 560-578 •
•

- 76 -
Fales, H.M. and Pisano, J,J, (1962). Gas chromatography of biologically important amines. Anal. Biochem., ]., 337-342.
Fennema, D.R. (1976). Principles of Food Science. Part 1: Food Chemistry, pp. 83-87. Marcel Dekker, New York.
Ferencik, M. (1970). Formation of histamine during bacterial decarboxylation of histidine in the flesh of some marine fishes. J. Hyg. Epidem. Microb. and Imunol., 1!, 52-60,
Fernandez-Salguero, J. and Mackie, !.M. (1979). Histidine metabolism in mackerel (Scomber scombrus). Studies on histidine decarboxylase activity and histamine formation during storage of flesh and liver under sterile and non-sterile conditions. J. Fd Technol., 1!, 131-139.
Finar, I.L. (1975). Organic Chemistry, Vol. 2. Stereochemistry and the chemistry of natural products. 5th edition, pp. 614-617. English Language Book Society and Longman Group Limited.
F oo, L. Y. ( 1 97 5) • Scombroid-type poisoning induced by the ingestion of smoked kawai. New Zealand M, J,, ~. (..!l.l), 476-477.
F oo, L. Y. ( 1976) • Scombroid poisoning. Isolation and Identification of "Saurine". J, Sci. Fd Agric., .zl., 807-810,
Frenk, H.A., Yoshinaga, D.H. and Nip, W. (1981). Histamine Formation and Honeycombing During Decomposition of Skipjack Tuna 1 Katsuwonus pelamis, at Elevated temperatures.· Marine Fisheries Review·, .&1 (J.Q), 9-14.
Fraser, M.M. and Raphael, R.A. (1952). In: Reagents for organic synthesis. Ed. by L.F. Fieser and M. Fieser. PP• 658-659, 1457. John Wiley and Sons, Inc. U.S.A.

- 77 -
Gale, E.f. (1946). The bacterial amino acid decarboxylases. Adv •. Enzymol. Relet. Subj. Biochem., i, 1-32.
Gardner, R.L., Kerst, A.f., Wilson, D.M. and Payne, M.G. (1967). Beta vulgaris L: The characterization of three polyphenols isolated from the leaves. Phytochem., i, 417-422.
Geiger, E. (1944). Histamine content of unprocessed and canned fish. A tentative method for quantitative determination of spoilage. fd Res., .2., 293-297.
Geiger, E. (1954). On the role of histamine in poisoning with spoiled fish. Proc. Symposium on Cured and frozen fish. Technol. Swed. Inst. fd Preserv. Res. (Goteborg) 1953 Bubl. No. 100.
Geiger, E. (1955). Role of histamine in poisoning with spoiled fish. Science, 121.. 665-666 •.
Geiger, E., Courtney, G. and Schnakenberg, G. (1944). The content and formation of histamine in fish muscle. ·Arch. Biochem., _1, 311-319.
Gilbert, R.J. ,· Hobbs, G., Murray, C.K., Cruickshank, J.G. and Young Susan, E.J. (1960). Scombrotoxic fish poisoning : features of the first 50 incidents to be reported in Britain (1976-9). Br. Med. J., 2!ll.o 71-72.
Gounelle, H. (1960). In "Significance and Detection of Histamine in food". By Ienistea, C. In "The microbiological safety of food", PP• 327-343. Ed. by Betty, C. Hobbs and J.H.B. Christian. Academic Press, New York.
Gounelle, H. and Pointeau-Pouliquen, M.A. (1961). In "Significance and Detection of Histamine in food". By Ienistea, C. In "The microbiological safety of food", pp. 327-343. Ed. by Betty, C. Hobbs and J.H.B. Christian. Academic Press, New York.

- 78
Grove, H.H. and Terplan, G. (1975). In "Amines in food". Ed. T .A. Smith. fd Chem., Vol. 6 (.~), 169-200.
Grundemeier, E.w. and Andrews, A.C. (1965). Spectrophotometric determination of histidine and histamine in their mixtures. Trans Kans Acad. Sci, 68 (1), 62-64.
Halstead, B.W. (1967). Poisonous and veno~ous marine animals of the world Vol. 1. Washington, D.C., U.S. Government Printing Office.
Hanson, S.W. and McGuire, K.J. (1982). Investigation into post harvest losses of cured fish in South-East Asia, RJ69J. Report 2. Analytical data for cured fish from South-East Asia. Overseas Development Administration, London.
Hanson, S.W., Al-Kasadi, A.S., McGuire, K.J. and Wright, R. Investigation into post harvest losses of cured fish in South-East Asia, RJ693. Report 4. Preliminary evaluation of potentially harmful compounds in cured fish. Overseas Development Administration, London.
Hardy, R. and Smith, J.G.M. (1976). The storage of mackerel (Scomber scombrus). Development of Histamine and Rancidity. J. Sci. fd Agric., 21, 595-599.
Henion, J.D., Nosanchuk, J.S. and Bilder, B.M. (1981). Capillary gas chromatographic-mass spectrophotometric determination of histamine in tuna fish causing scombroid poisoning. J. Chromat., _zu, 4 75-480.
Henry, M. (1960). Dosage biologique de Thistamine dens les aliments. Ann. fols. Exp. Chim., 53,, 24-33.
Heyl, D., Luz, E., Harris, S.A. and folkers, K. (1948). J. Amer. Chem. Soc., 70, 3669.
Hughes, R.B. (1959). Chemical studies on the herring. ( Clupea harengus). II. The free amino acids of herring flesh ~nd their behaviour during post-mortem storage. J. Sci. fd Agric., jQ, 5S8-564.

- 79 -
Ienistea, C. (1973) • Significance and detection of histamine in food. In "The microbiological safety of food". pp. 327-343, Ed. by Betty, C. Hobbs end J.H.B. Christian. Academic Press, New York.
Igarashi, H. (1939). The pungent principles fishes produced by decrease in freshness, Part II. Bull- Japan Soc. Sci. Fisheries, A, 158-160.
Igarashi, H. (1949). In "The histamine problem". By Kimata, M. In "Fish as Food". Ed. by G. Borgstrom. Chapter 10, Vol. 1, 329-252. Academic Press, New York.
Jaoob, L. (1978). In "Amines in Food". Ed. T.A. Smith. Fd Chem., Vol. 6 (~), 169-200. Ed. G.G. Birch and Green, L.F. Appl• Sci. Publishers Ltd., England.
Kawabata, S. (1955). Poisoning by putrefaction. Allergy-like food poisoning. Kaqaku (Tokvol 12, 336-341 •
. Kawabata, T., Uchida, Y. andAkano, T. (1960). A simple and rapid method for the determination of histamine in fish flesh. Nippon Suisan Gakkaishi, za, 1183-1191.
Kim, I.S. and Bjeldanes, L.F • (1979). Amine content of toxic and wholesome canned tuna fish. J. Fd Sd., 44, 922.
Kimata, M. and Kawai, A. (1953a). The freshness of fish and the amount of histamine presented in the meat. V. On the production of histamine during the autolysis. 3 Kvoto Daigaku Shokuryo Kageku Kenkyusho Hokoku, .!!, 88-95.
Kimata, M. and Kawai, A. (1953b). A new species of bacterium which produces large amounts of histamine'in fish meats, found in spoiled flesh fish. Mem. Res. Inst. Fd Sci. s. 1-2. Kyoto Un~v., Japan. '
Kimata, M. and Kawai, A. (1953c). Production of histamine by bacteria causing spoilage of fish. Bull. Res. Inst. Fd Sci. Kyoto Univ., jz, 29.

- BD -
Kimata, M. and Kawai, A~ (1958). Studies on the histamine formation of Proteus morganii. Mem. Col!. Agric., No. (June), 92-99. Kyoto Univ. Japan.
Kimata, M., Kawai, A. and Akmatsu, M. (1958). Classification and identification of the bacteria having an activity which can produce a large amount of histamine. Mem. Res. Inst •• Fd Sci., 1!, 33-41. Kyoto Univ. Japan.
Lerke, P.A. and Bell, L.D. (1976). A rapid fluorometric method for the determination of histamine in canned tuna fish. J. Fd Sci., &, 1282-1284.
Lin, J.S., Baranowski, J.D. and Dlcott, H.S. (1977). Rapid thin-layer chromatography-densitometry determination of histamine in tuna. J. Chromat., jlQ, 426-430.
Mackie, I.M. and Ritchie, A.H. (1974). Free amino acids of fish flesh. Proc. IV Int. Congress Fd Sci~ and Technol., Vol. 1, 29-38.
Mayer, K., Pause, G. and Vetsch, U. (1974). Garverlauf und Histaminbildung bei der Sauerkrauterzeugung. Mitt. Gebiete Lenbensmitt. Hyg., Si, 234-238.
Meitz, J.L. and Karmas, E. (1977). Chemical quality index of canned tuna as determined by HPLC. J. Fd Sci., AZ, 155-158.
Murray, C.K., .Hobbs, G. and Gilbert, R.J. (1982). Scombrotoxin and scombrotoxin-like poisoning from canned fish. J. Hyg Camb., M, 215-220.
Murray, C.K. (1983). Personal communication.
Navert, H. (1975). New approach to the separation and identification of some methylated histamine derivatives by gas chromatography. J. Chromat., 106, 218-224.

- 61 -
O.E • .C.D. ·( 1976). Multilingual dictionary of fish and fish products, p. 42. Fishing News (Books) Ltd., Farnham, Surrey, England.
Park, Y.H., Kim, S.B., Jeong, H.K., Koh, K.B., and Kim, D.S. (1961). Changes of histamine contents in the muscle of darkfleshed fishes during storage and processing. Changes of histamine contents in the muscle of mackerel pike. Bulletin of the Korean fisheries Society 14 (3) 122-129. Dep. of Food Sci. and Techn., Nat. fisheries Univ. of Busan, Busan, S. Korea. fSTA Vol. 15 (1963) No. 6.
Parrot, J. and Nicot, G. (1966). Pharmacology of histamine. In "Handbach der Experimentellen Pharmakologie", Vol. 16, P• 148. Springer-Vortag, New York.
Sapin-Jaloustre, H. and J. (1957). Une toxi-infection alimentaire peu connue : L'intoxication histaminique par le then. A little-known food poisoning: Histamine poisoning from tuna. J. Concours Medical, ]i, 2705-2706.
Schever, P.J. (1970). Toxins from fish and other marine organisms. Adv. Fd Res., l.!l., 141-161.
S~hutz, D.E., Chang, G.W. end Bjeldanes, L.F. (1976). Rapid thin-layer chromatographic method for detection of histamine in fish products. J. As sec. Off. Anal. Chem., ..22., 1224-1225 •
Schwartzman, R.M. and Halliwell, R.E.W. (1975). Thin-layer chromatographic assays of histamine and its metabolites in urine of man and dog. J. Chromat., ill, 129-138.
Schwartzman, R.M. (1973). Quantitative thin-layer chromatography of histamine · and its metabolites. J. Chromat., ~. 263-266.

- 82 -
Shore, P.A. (1971). The chemical determination of histamine. Methods Biochem. Anal. Suppl., Vol. 89-97.
Shore, P.A., Burkhalter, A. and Cohn, V.H. Jr. (1959). A method for the fluorometric assay of histamine in tissues. J •. Pharmacal. Exp. Ther., .!Z.l, 182-186.
Smith, J.G.M., Hardy, R. and Young, K.W. (1980). A seasonal study of the storage characteristics of mackerel stored at chill and ambient temperatures. In: "Adv. in fish Sci. &. Tech." Ed. by J,J, Connell. 372-378. fishing News (Books) Ltd., England.
Smith, T.A. ( 1980). Amines in food. fd Chem., V61. 6 (3), 169-200, Ed. G.G. Birch and Green, L.f •. Appl. Sci. Publishers Ltd., England.
Snyder, S.H., Baldessarini, R.J. and Axelrod, J. (1966), A sensitive and specific enzymatic isotopic assay for tissue histamine. J. Pharmacal. Exp. Ther_., ID, 544-549.
Str!lm, A. and Lindberg, W. (1945). In "Histamine (?) toxicity from fish products. By: S.H. Arnold and w.n. Brown. Adv. fd Res., Vol. 24.
Suzuki 1 U., Yoshimuru, K., Yamakawa, M, and Iric, Y. (1909). Uber die Extraktivstoffe des fischfleisches und der Muscheln. Hoppe-Seyler's z. Physiol. Chem •. , .§.Z., 1-35.
Taylor, S.L., Lieb,er, E.R. and Leatherwood, M. (1978aJ. A survey of histamine levels in commercially processed scombroid fish products. J. fd Qual., Vol. 1 (4), 393-397. Letterman Army Inst. of Res. Dep. of Nutr. fd Hyg. Div., Presidio of San Francisco, California 94129 1 U.S.A.
Taylor, S.L., Lieber, E.R. and Leatherwood (1978b). A simplified method for histamine analysis of foods. J. fd Sci., ~. 247-350.

- 83 -
Taylor, S.L., Guthertz, L.S., Leatherwood, M., Tillman, f. and Lieber, E.R. (1978c). Histamine Production by food-Borne Bacterial Species. J. fd Safety,~. 173-187.
Tsuda, A., Mori, K. and Tomiyama, T. (1959). Studies on the method for testing the spoilage of food. X. Errors involved in Ota's method for determination of histamine~
Nippon Suisan Gakkaishi, ~. 361-367.
Udenfriend, S., Stein, S., Bohlen, P. and Dairman, W. (1972). fluorescamine : a reagent for assay of amino acids, peptides, proteins and primary amines in the picomole range. Sience, .11.§.; 871-872.
Van Veen, A.G. and Latuasan, H.E. (1950). fish poisoning caused by histamine in Indonesia. Doe. Neerl. Indones. Morbis Trop., z, 18-20.
Widmann, R.R. (1950). Composition to increase the absorption of tissue histamine. Nature, Lond •• ~. 882-883.
Weiss, 5., Robb, G.P. and Ellis, L.B. (1932). The systemic effects of histamine in man. Arch. Int. Med., ~. 360-396.
Weissback, H., Waalkes, T. and Udenfriend, S. (1958). A simplified method for measuring serotonin in tissues; simultaneous assays ·,f both serotonin and histamine. J. Biol. Chem., ZIQ, 865-871.
-~--~· _,·--Yasuto, T., Kohashi, K. and Ohkura, Y. (1978).
Determination of histamine in plasma by high-speed liquid chromatography. J. Chromat., ~. 490-493.

----------------