EFFECT OF POULTRY MANURE AND P SOLUTION …ijaeb.org/uploads2018/AEB_03_121.pdffood production in...
14
International Journal of Agriculture, Environment and Bioresearch Vol. 3, No. 01; 2018 ISSN: 2456-8643 www.ijaeb.org Page 30 EFFECT OF POULTRY MANURE AND P SOLUTION CONCENTRATIONS ON THE YIELD OF SOYBEANS IN SOME SOILS OF BENUE STATE – NIGERIA F. Ibrahim*, Bemgba Anjembe and O. Olatunji Department of Soil Science, University of Agriculture Makurdi, Benue State - Nigeria ABSTRACT A pot experiment was conducted at the Teaching and Research Farm of the University of Agriculture Makurdi - Nigeria using soils collected from 6 locations (Daudu, Ayati, TseAgbakor, TseKough, Ayange, and Mbachor) to determine the effect of poultry manure and P solution concentrations on the yield of soybeans. Six levels of P solution concentration (0, 0.150, 0.175, 0.20, 0.225, 0.250 mg l -1 ) 2 levels of poultry manure (0 and 6 t ha -1 ) and six soils factorially combined constituted the experimental treatments. Four Kg of the soils were weighed into perforated plastic pots of 5 liters capacity and the treatments applied accordingly. Each pot received an initial application of 60 kg N ha -1 as urea, and 30 kg K ha -1 in the form of KCl as basal application and the pots were arranged in a Completely Randomized Design (CRD) with three replications. Three soybean seeds of the variety TGX 1935-3F were planted per pot and later thinned to 2 at two weeks after planting. The crops were grown to maturity and all agronomic practices carried out as at when necessary. Data collected were subjected to the analysis of variance. Results indicate that the soils under study had low to moderate levels of available P. The addition of Poultry manure contributed significantly to the yield of the crop. P solution concentration for optimal soybeans production on these soils varied from 0.175 mg l -1 at Ayati and Ayange to 0.225 mg l -1 at TseKough. For Daudu, TseAgbakor and Mbachor it was 0.200 mg l -1 . Keywords: Poultry Manure, Alfisols, Inceptisols, Solution Concentration, Phosphorus Introduction Phosphorus (P) is one of the essential elements for plant growth, the total quantity of P in most native soils is low with most of what is present unavailable to plants (Brady and Weil, 2014). Adequate phosphorus results in higher grain production, improved crop quality, greater stalk strength, increased root growth and earlier crop maturity as it enhances the fundamental processes of photosynthesis, nitrogen fixation, flowering, fruiting and maturation (Brady and Weil, 2014). Warren (1992) stated that phosphorus deficiency is one of the largest constraints to food production in tropical African soils due to low native P and high fixation by iron and aluminum oxides. It has also been reported that phosphorus is relatively unavailable for plant uptake in highly weathered tropical soils (Iyamuremye et al., 1996). In order to meet the crop need of phosphorus in these soils, farmers make use of inorganic fertilizers for their crops. However, P fertilizer is not readily available to these farmers because of scarcity in some cases and also due to the high cost of these fertilizers.
Transcript of EFFECT OF POULTRY MANURE AND P SOLUTION …ijaeb.org/uploads2018/AEB_03_121.pdffood production in...

International Journal of Agriculture, Environment and Bioresearch
Vol. 3, No. 01; 2018
ISSN: 2456-8643
www.ijaeb.org Page 30
EFFECT OF POULTRY MANURE AND P SOLUTION CONCENTRATIONS ON THE
YIELD OF SOYBEANS IN SOME SOILS OF BENUE STATE – NIGERIA
F. Ibrahim*, Bemgba Anjembe and O. Olatunji
Department of Soil Science, University of Agriculture Makurdi, Benue State - Nigeria
ABSTRACT
A pot experiment was conducted at the Teaching and Research Farm of the University of
Agriculture Makurdi - Nigeria using soils collected from 6 locations (Daudu, Ayati, TseAgbakor,
TseKough, Ayange, and Mbachor) to determine the effect of poultry manure and P solution
concentrations on the yield of soybeans. Six levels of P solution concentration (0, 0.150, 0.175,
0.20, 0.225, 0.250 mg l-1) 2 levels of poultry manure (0 and 6 t ha-1) and six soils factorially
combined constituted the experimental treatments. Four Kg of the soils were weighed into
perforated plastic pots of 5 liters capacity and the treatments applied accordingly. Each pot
received an initial application of 60 kg N ha-1 as urea, and 30 kg K ha-1 in the form of KCl as
basal application and the pots were arranged in a Completely Randomized Design (CRD) with
three replications. Three soybean seeds of the variety TGX 1935-3F were planted per pot and
later thinned to 2 at two weeks after planting. The crops were grown to maturity and all
agronomic practices carried out as at when necessary. Data collected were subjected to the
analysis of variance. Results indicate that the soils under study had low to moderate levels of
available P. The addition of Poultry manure contributed significantly to the yield of the crop. P
solution concentration for optimal soybeans production on these soils varied from 0.175 mg l-1 at
Ayati and Ayange to 0.225 mg l-1 at TseKough. For Daudu, TseAgbakor and Mbachor it was
0.200 mg l-1.
Keywords: Poultry Manure, Alfisols, Inceptisols, Solution Concentration, Phosphorus
Introduction
Phosphorus (P) is one of the essential elements for plant growth, the total quantity of P in most
native soils is low with most of what is present unavailable to plants (Brady and Weil, 2014).
Adequate phosphorus results in higher grain production, improved crop quality, greater stalk
strength, increased root growth and earlier crop maturity as it enhances the fundamental
processes of photosynthesis, nitrogen fixation, flowering, fruiting and maturation (Brady and
Weil, 2014). Warren (1992) stated that phosphorus deficiency is one of the largest constraints to
food production in tropical African soils due to low native P and high fixation by iron and
aluminum oxides. It has also been reported that phosphorus is relatively unavailable for plant
uptake in highly weathered tropical soils (Iyamuremye et al., 1996). In order to meet the crop
need of phosphorus in these soils, farmers make use of inorganic fertilizers for their crops.
However, P fertilizer is not readily available to these farmers because of scarcity in some cases
and also due to the high cost of these fertilizers.

International Journal of Agriculture, Environment and Bioresearch
Vol. 3, No. 01; 2018
ISSN: 2456-8643
www.ijaeb.org Page 31
Poultry manure has long been recognized as the most desirable organic fertilizer. It improves soil
fertility by adding both major and essential nutrients as well as soil organic matter which
improve moisture and nutrient retention (Farhad et al., 2009). Poultry manure may be used for
crop production as a substitute for the chemical fertilizers because; continuous use of chemical
fertilizers creates potential polluting effect in the environment (Oad et al., 2004) and because of
their high cost of production. However, the use of organic manure without chemical fertilizers
seems to be impossible because of the growing demand for food necessitated by the growing
world population.
The present study therefore was carried out to determine the effect of poultry manure and
solution P concentrations on the yield of soybean.
MATERIALS AND METHODS
Surface soil samples (0 - 20 cm) were collected from six different locations in Benue State
(Daudu, Ayati, TseAgbakor, TseKough, Ayange, and Mbachor); these soils were earlier
classified as Alfisols and Inceptisols (Table 1). Poultry manure was sourced from the University
of Agriculture Makurdi Livestock Teaching and Research Farm.
Routine Analysis
The collected soil samples were air-dried and ground to pass through 2mm sieve. Soil pH was
determined in a 1:1 soil-water suspension by the glass electrode method, particle size analysis by
the hydrometer method of Bouyoucos (1951). Total organic carbon by the chromic acid
oxidation procedure of Walkley and Black (1934), exchangeable bases by the neutral ammonium
acetate saturation. Na and K in the extracts were determined by the flame photometer while Ca
and Mg were determined with the Atomic Absorption Spectrophotometer (AAS), exchange
acidity by the 1M KCl extraction and 0.01M NaOH titration. Nitrogen in the samples was
determined by the Marco Kjeldahl method, Free Fe and Al oxides (Total oxides) were extracted
by the citrate dithionate – bicarbonate method (Mebra and Jackson, 1960). Iron and Aluminum
oxides in the extracts were determined with an Atomic Absorption Spectrophotometer (AAS).
A sample of the poultry manure used in the experiment was air dried and ground to pass 2 mm
sieve. The ground poultry manure sample was analyzed for N using the Marco Kjeldal method of
Isaac and Johnson and total P by the NaOH digestion method (Mehra et al., 1954). Ca and Mg
were determined using Atomic Absorption Spectrophotometer (AAS) while K and Na was
determined using flame photometer.
Table 1: Soil Classification of the Study Sites
S/N Location GPS Coordinates Soil Class
1 Daudu N 70 55.06’, E 80 35.74’ TypicPaleustalf (USDA)
OrthicLuvisol (FAO)

International Journal of Agriculture, Environment and Bioresearch
Vol. 3, No. 01; 2018
ISSN: 2456-8643
www.ijaeb.org Page 32
2 TseKough N 70 28.83’, E 80 37.35’ TypicHaplustalf (USDA)
OrthicLuvisol (FAO)
3 Ayange N 70 20.00’, E 80 34.00’ Aquichaplustalf (USDA)
Orthicluvisol (FAO)
4 TseAgbakor N 70 27.94’, E 80 35.73’ TypicTropaquept (USDA)
GleyicCambisol (FAO)
5 Mbachor N 70 17.80’, E80 29.18’ OxicUstropept (USDA)
EutricCambisol (FAO)
6 Ayati N 70 56.68’, E 80 34.84’ OxicUstropept (USDA)
EutricCambisol (FAO)
Pot Experiment
A pot experiment was conducted at the Teaching and Research Farm of the University of
Agriculture Makurdi using soils collected from six locations (Daudu, Ayati, TseAgbakor,
TseKough, Ayange, and Mbachor). Six levels of Phosphate solution concentrations (0, 0.150,
0.175, 0.20, 0.225, 0.250 mg l-1), 2 levels of poultry manure (0 and 6 t ha-1) and six soils
factorially combined constituted the experimental treatments (Table 2) and were arranged in a
Completely Randomized Design (CRD) with three replications.
Four (4) Kg of the soils were weighed into perforated plastic pots of 5litres capacity in two sets.
Phosphorus was added in the form of K2HPO4 at different rates equivalent to 0, 0.150, 0.175,
0.20, 0.225, 0.250 mg l-1 to the plastic pots. One set of the soils in addition to the added
Phosphorus fertilizer received additions of poultry manure at the rate of 6 t ha-1 and the other set
left without poultry manure addition. Each pot received an initial application of 60 Kg N ha -1 as
urea, and 30 Kg K ha-1 as KCl (Yusuf and Idowu, 2001)
Three soybean seeds of the variety TGX 1935-3F (test crop) was planted per pot and later
thinned to 2 two weeks after planting. The crops were grown to maturity and all agronomic
practices were carried out as at when necessary.
Table 2: Experimental Treatments
Soil
Location
Poultry
Manure
(t ha-1)
Fertilizer P
solution
concentration
( mg l-1)
Soil Location Poultry
Manure
(t ha-1)
Fertilizer P
solution
concentration
(mg l-1)
Daudu 0 0.000 TseAgbakor 0 0.000
0.150 0.150
0.175 0.175
0.200 0.200
0.225 0.225
0.250 0.250
6 0.000 6 0.000

International Journal of Agriculture, Environment and Bioresearch
Vol. 3, No. 01; 2018
ISSN: 2456-8643
www.ijaeb.org Page 33
0.150 0.150
0.175 0.175
0.200 0.200
0.225 0.225
0.250 0.250
TseKough 0 0.000 Mbachor 0 0.000
0.150 0.150
0.175 0.175
0.200 0.200
0.225 0.225
0.250 0.250
6 0.000 6 0.000
0.150 0.150
0.175 0.175
0.200 0.200
0.225 0.225
0.250 0.250
Ayange 0 0.000 Ayati 0 0.000
0.150 0.150
0.175 0.175
0.200 0.200
0.225 0.225
0.250 0.250
6 0.000 6 0.000
0.150 0.150
0.175 0.175
0.200 0.200
0.225 0.225
0.250 0.250
Data Collection and Statistical Analysis Agronomic data collected include number of pods per plant, number of seeds per pod, 100 pod
weight, 100 grain weight and grain yield at harvest. These were subjected to the analysis of
variance (ANOVA) using Genstat Discovery Edition 4 at 5 % level of probability. Where
significant differences among means were observed, Least Significant Difference (LSD) was
used to separate means.
RESULTS
Physical and Chemical Properties of the Experimental Soils
Some selected properties of the experimental soils are presented on Table 3. pH (H2O) values
ranged from 5.00 at Daudu to 6.86 at Mbachor indicating that the soils are acid to slightly acidic.
International Journal of Agriculture, Environment and Bioresearch
Vol. 3, No. 01; 2018
ISSN: 2456-8643
www.ijaeb.org Page 34
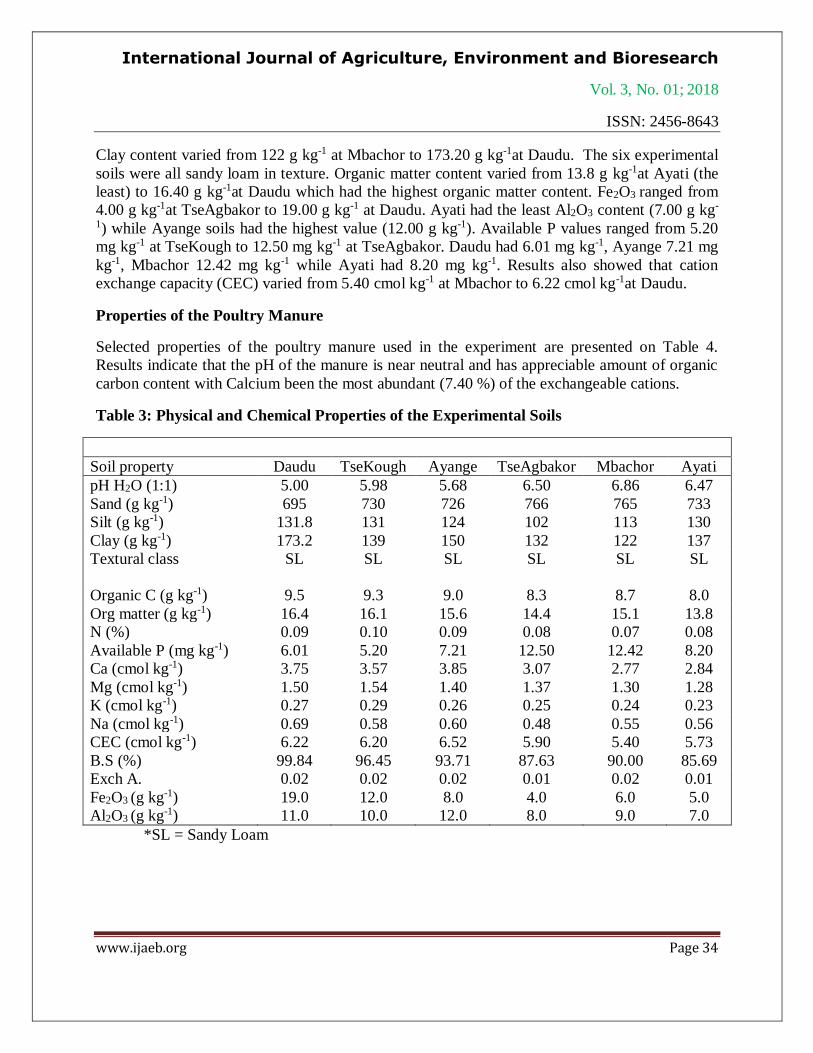
Clay content varied from 122 g kg-1 at Mbachor to 173.20 g kg-1at Daudu. The six experimental
soils were all sandy loam in texture. Organic matter content varied from 13.8 g kg-1at Ayati (the
least) to 16.40 g kg-1at Daudu which had the highest organic matter content. Fe2O3 ranged from
4.00 g kg-1at TseAgbakor to 19.00 g kg-1 at Daudu. Ayati had the least Al2O3 content (7.00 g kg-
1) while Ayange soils had the highest value (12.00 g kg-1). Available P values ranged from 5.20
mg kg-1 at TseKough to 12.50 mg kg-1 at TseAgbakor. Daudu had 6.01 mg kg-1, Ayange 7.21 mg
kg-1, Mbachor 12.42 mg kg-1 while Ayati had 8.20 mg kg-1. Results also showed that cation
exchange capacity (CEC) varied from 5.40 cmol kg-1 at Mbachor to 6.22 cmol kg-1at Daudu.
Properties of the Poultry Manure
Selected properties of the poultry manure used in the experiment are presented on Table 4.
Results indicate that the pH of the manure is near neutral and has appreciable amount of organic
carbon content with Calcium been the most abundant (7.40 %) of the exchangeable cations.
Table 3: Physical and Chemical Properties of the Experimental Soils
Soil property Daudu TseKough Ayange TseAgbakor Mbachor Ayati
pH H2O (1:1) 5.00 5.98 5.68 6.50 6.86 6.47
Sand (g kg-1) 695 730 726 766 765 733
Silt (g kg-1) 131.8 131 124 102 113 130
Clay (g kg-1) 173.2 139 150 132 122 137
Textural class SL SL SL SL SL SL
Organic C (g kg-1) 9.5 9.3 9.0 8.3 8.7 8.0
Org matter (g kg-1) 16.4 16.1 15.6 14.4 15.1 13.8
N (%) 0.09 0.10 0.09 0.08 0.07 0.08
Available P (mg kg-1) 6.01 5.20 7.21 12.50 12.42 8.20
Ca (cmol kg-1) 3.75 3.57 3.85 3.07 2.77 2.84
Mg (cmol kg-1) 1.50 1.54 1.40 1.37 1.30 1.28
K (cmol kg-1) 0.27 0.29 0.26 0.25 0.24 0.23
Na (cmol kg-1) 0.69 0.58 0.60 0.48 0.55 0.56
CEC (cmol kg-1) 6.22 6.20 6.52 5.90 5.40 5.73
B.S (%) 99.84 96.45 93.71 87.63 90.00 85.69
Exch A. 0.02 0.02 0.02 0.01 0.02 0.01
Fe2O3 (g kg-1) 19.0 12.0 8.0 4.0 6.0 5.0
Al2O3 (g kg-1) 11.0 10.0 12.0 8.0 9.0 7.0
*SL = Sandy Loam

International Journal of Agriculture, Environment and Bioresearch
Vol. 3, No. 01; 2018
ISSN: 2456-8643
www.ijaeb.org Page 35
Table 4: Properties of the Poultry Manure used in the Experiment
Parameter Value
pH (1:1) 6.80
N (g kg-1) 50.2
P (mg kg-1) 5.00
K (cmol kg-1) 0.90
Ca (cmol kg-1) 7.40
Mg (cmol kg-1) 0.52
Na (cmol kg-1) 0.98
Org C. (g kg-1) 121.0
Effect of Fertilizer P Solution Concentration on the Yield of Soybeans
The effect of solution P concentrations on the yield of soybean is presented in Table 5.
Significant differences were observed in all the variates studied. It was observed that the number
of pods produced per plant increased with increasing levels of P concentration in solution and
later declined. 0.00 mg P kg-1 yielded 27.33 numbers of pods while solution P concentration of
0.200 mg P kg-1 gave the highest value (92.58) in terms of number of pods produced. Numbers
of pods produced at each P solution concentration were significantly (P ˂ 0.05) different.
Significant differences were observed in the number of seeds per pod. 0.225 mg kg -1 gave the
highest numbers of seed (2.80) per pod which was significantly higher than those of the other
treatments. However, no significant differences were observed when the number of seeds per
pod of the control (0.00 mg P kg-1), 0.150 mg kg-1 and 0.175 mg kg-1 were compared.
Results for 100 pod weight (Table 5) shows that 0.200 mg P kg-1 solution concentration gave the
highest weight (35.98 g) per 100 pods which was significantly (P˂ 0.05) higher than those of
other treatments. The control (0.00 mg kg-1) had the least weight per 100 pods (30.47 g)
Significant differences were obtained in the 100 grain weight of soybeans at the various solution
P concentrations (Table 5) with 0.200 mg kg-1 giving the highest weight (14.41 g)which was
significantly (P ˂ 0.05) higher than the other treatments. There was however, no significant
difference between the 100 grain weights obtained with 0.150 mg kg-1 and 0.175 mg kg-1 P
respectively.
Results similar to that of 100 grain weight were observed with the grain yield (t ha-1) with 0.200
mg kg-1 yielding significantly (P ˂ 0.05) higher than the other P solution concentrations with
grain yield of 3.02 t ha-1.

International Journal of Agriculture, Environment and Bioresearch
Vol. 3, No. 01; 2018
ISSN: 2456-8643
www.ijaeb.org Page 36
Table 5: Effect of Fertilizer P Solution Concentration on the Yield of Soybeans
Fert P conc
(mg kg-1)
Number of
pods/plant
Number of
seeds/pod
100 pod
weight (g)
100grain
weight (g)
Grain yield
(t ha-1)
0.000 27.33 1.97 30.47 11.24 2.02
0.150 34.44 1.99 28.81 12.03 2.25
0.175 41.61 2.01 31.52 12.31 2.47
0.200 92.58 2.10 35.98 14.41 3.02
0.225 71.42 2.80 33.89 13.35 2.68
0.250 51.25 2.20 32.37 12.73 2.85
LSD (0.05) 6.106 0.05012 1.433 0.6145 0.1510
Effect of Poultry Manure on the Yield of Soybean
Results on Table 6 indicate that poultry manure addition had no significant effect on the number
of seeds per pod and 100 pod weight of soybeans. However, significant differences were
observed in number of pods per plant where poultry manure addition raised the number of pods
produced per plant from 48.19 to 58.02, and 100 grain weight which increased from 12.50 g to
12.85 g. poultry manure addition raised the grain yield significantly from 2.51 t ha-1 without
poultry manure addition to 2.59 t ha-1 upon poultry manure addition.
Table 6: Effect of Poultry Manure on the Yield of Soybeans
Poultry
manure (t ha-1)
Number of
pods/plant
Number of
seeds/pod
100 pod
weight (g)
100 grain
weight (g)
Grain yield
(t ha-1)
0 48.19 2.10 32.01 12.50 2.51
6 58.02 2.09 32.34 12.85 2.59
LSD (0.05) 3.525 NS NS 0.35 0.08
Effect of Soil Location on the Yield of Soybeans
Results shown on Table 7 indicate significant differences in all the variates studied across the
different soils with the exception of number of seeds per pod. Number of pods per plant ranged
from 46.33 at Ayange to 59.11 at Mbachor. Number of pods per plant produced by soils from
TseAgbakor (55.92), Mbachor (59.11), Ayati (56.56) and Daudu (53.72) were significantly
higher than those of TseKough (47.00) and Ayange (46.33). However, no significant differences
were observed in-between them.
One hundred pod weight showed that soils from Daudu had the highest weight (34.82 g) this was
however not significantly different from the weight obtained at Mbachor (33.61 g) Ayange had
the least 100 pod weight (29.21 g) while 100 pod weight obtained from Agbakor (31.47 g) and
Ayati (31.00 g) did not vary significantly (P ˂ 0.05) from each other.

International Journal of Agriculture, Environment and Bioresearch
Vol. 3, No. 01; 2018
ISSN: 2456-8643
www.ijaeb.org Page 37
Significant differences were obtained in the 100 grain weight with Ayange (13.39), TseAgbakor
(13.52) and Mbachor (13.08) having significantly higher 100 grain weight than the other soils
though no significant difference was observed among these three soils.
In terms of grain yield (t ha-1), results contained in Table 7 showed TseAgbakor to have
performed significantly (P ˂ 0.05) better than soils from other locations. The yield values varied
from 2.23 t ha-1 at TseKough to 2.83 t ha-1 at TseAgbakor.
Table 7: Effects of Soil Location on the Yield of Soybeans
Location Number of
pods/plant
Number of
seeds/pod
100 pod
weight (g)
100 seed
weight (g)
Grain yield
(t ha-1)
Daudu 53.72 2.09 34.82 12.33 2.29
TseKough 47.00 2.12 32.92 10.91 2.23
Ayange 46.33 2.08 29.21 13.39 2.51
TseAgbakor 55.92 2.12 31.47 13.52 2.83
Mbachor 59.11 2.08 33.61 13.08 2.78
Ayati 56.56 2.08 31.00 12.84 2.66
LSD (0.05) 6.106 NS 1.433 0.6145 0.1510
Integrated Effect of Fertilizer P Solution Concentration and Poultry Manure on the Yield
of Soybean
Table 8 contains results of the integrated effect of poultry manure and fertilizer P concentration
on the yield of soybeans. The addition of poultry manure enhanced though not significantly the
performance of the crop in most of the variates studied. Significant differences were however
observed in the number of pods produced per plant where at a solution P concentration of 0.150
mg kg-1 addition of poultry manure significantly raised the number of pods produced per plant
from 29.78 to 39.11 and from 87.56 to 97.61 at 0.200 mg kg-1. However, even with the addition
of poultry manure, the number of pods produced per plant decreased significantly at levels of P
concentration beyond 0.200 mg kg-1.
Table 8: Integrated Effect of Poultry Manure and Fertilizer P solution concentration on the
Yield of Soybean
Poultry
Manure
Fert P
conc
(mg kg-1)
Number of
pods/plant
Number of
seeds/pod
100 pod
weight (g)
100 grain
weight (g)
Grain yield
(t ha-1)
0 0.000 24.39 1.96 28.63 11.04 2.13
0.150 29.78 2.00 30.29 11.77 2.32
0.175 64.56 2.30 31.43 14.18 2.49
0.200 87.56 2.13 36.19 12.60 3.08

International Journal of Agriculture, Environment and Bioresearch
Vol. 3, No. 01; 2018
ISSN: 2456-8643
www.ijaeb.org Page 38
0.225 45.56 2.24 33.51 13.33 2.84
0.250 37.33 2.00 31.98 12.09 2.70
6 0.000 30.28 2.00 28.98 11.44 1.91
0.150 39.11 2.00 30.65 12.28 2.18
0.175 78.28 2.27 31.62 14.64 2.87
0.200 97.61 2.07 35.77 12.86 2.97
0.225 56.94 2.16 34.26 13.37 2.44
0.250 45.89 2.03 32.75 12.53 2.66
LSD (0.05) 8.635 NS NS NS NS
Integrated Effect of Poultry Manure and Soil Location on Soybean Yield
Significant differences were observed in the integrated effects of poultry manure and soil
location on the yield of soybeans with regards to most of the variates studied (Table 9). With the
addition of poultry manure to the Daudu soils, the 100 pod weights and grain yield increased
significantly (P ˂ 0.05) from 33.67 g and 2.10 t ha-1 to 35.98 g and 2.48 t ha-1 respectively. The
different soils upon poultry manure addition performed significantly (P ˂ 0.05) better in most of
the parameters studied. Also, TseAgbakor had significantly (P ˂ 0.05) higher number of pods
(72) than the other soils however, no significant differences were observed among the other
variates.
Integrated Effect of Fertilizer P and Soil Location on Yield of Soybeans
The effects of P solution concentration and soil location on the yield of soybean are shown on
Table 10. Number of pods produced per plant in the Daudu soil increased significantly with
increase in solution P concentration up to 0.200 mg kg-1 (91.50) and decreased thereafter. Similar
trends were observed with number of seeds per pod, 100 pod weight, 100 grain weight and grain
yield though no significant differences were observed in these variates. The highest grain yield
(2.60 t ha-1) was obtained with 0.200 mg kg-1 P consequently; the quantity of fertilizer P required
to achieve this level of solution P concentration in this soil was calculated as 1.60 mg kg -1 soil.
This is equivalent to 204.18 kg ha-1 and was therefore taken as the SPR value for the Daudu soil.
Table 9: Integrated Effect of Poultry manure and Soil on the yield of soybean
Poultry
Manure
Soil
Location
Number of
pods/plant
Number of
seeds/pod
100 pod
weight (g)
100 seed
weight (g)
Grain yield
(t ha-1)
0 Daudu 50.89 2.09 33.67 11.92 2.10
TseKough 41.61 2.12 30.34 13.10 2.15
Ayange 39.56 2.12 28.44 13.08 2.49
TseAgbakor 39.83 2.11 28.73 10.33 2.52
Mbachor 61.28 2.07 33.51 13.09 2.87
Ayati 56.00 2.11 30.63 12.61 2.52
6 Daudu 56.56 2.11 35.98 12.75 2.48

International Journal of Agriculture, Environment and Bioresearch
Vol. 3, No. 01; 2018
ISSN: 2456-8643
www.ijaeb.org Page 39
TseKough 52.39 2.10 35.51 13.98 2.30
Ayange 53.11 2.05 29.99 13.69 2.52
TseAgbakor 72.00 2.14 34.20 11.48 2.79
Mbachor 56.94 2.08 33.71 13.07 3.04
Ayati 57.11 2.05 31.37 13.08 2.80
LSD (0.05) 8.635 0.0708 2.027 0.8690 0.2136
Table 10: Effect of Fertilizer P Solution Concentration and Soil on the Yield of Soybeans
Soils Fert P conc
(mg kg-1)
Number of
pods/plant
Number of
seeds/pod
100 pod
weight
(g)
100 grain
weight (g)
Grain yield
(t ha-1)
Daudu 0.000 28.50 2.02 31.59 11.12 1.88
0.150 35.17 2.00 32.63 11.83 2.07
0.175 42.67 2.02 33.79 12.08 2.31
0.200 91.50 2.20 39.32 13.38 2.60
0.225 73.80 2.22 36.55 12.78 2.41
0.250 50.67 2.14 35.07 12.35 2.48
TseKough 0.000 25.67 2.00 29.05 12.00 1.73
0.150 38.83 2.00 31.30 12.93 1.93
0.175 42.00 2.00 32.20 13.18 2.08
0.200 47.83 2.00 32.63 13.50 2.28
0.225 70.67 2.35 38.08 14.93 2.85
0.250 57.00 2.30 34.28 14.57 2.48
Ayange 0.000 32.00 2.00 25.98 11.90 1.69
0.150 45.67 2.00 27.68 12.67 2.13
0.175 81.17 2.00 32.13 15.38 3.19
0.200 53.67 2.05 29.62 13.98 2.65
0.225 39.17 2.30 31.00 13.40 2.95
0.250 26.33 2.15 32.13 12.98 2.43
TseAgbakor 0.000 29.50 1.94 28.85 9.85 2.31
0.150 32.00 1.98 30.30 10.70 2.50
0.175 43.50 2.32 30.60 10.70 2.75
0.200 97.00 2.22 33.95 12.10 3.33
0.225 83.00 2.25 33.05 11.10 3.12
0.250 50.00 2.05 31.80 11.00 2.98
Mbachor 0.000 22.33 1.92 30.06 11.81 2.23
0.150 32.33 2.00 32.15 12.37 2.46
0.175 42.50 2.00 32.60 12.62 2.67
0.200 96.17 2.05 37.38 14.92 3.28
0.225 90.00 2.30 35.98 13.85 3.10
0.250 61.33 2.20 33.46 12.91 2.98

International Journal of Agriculture, Environment and Bioresearch
Vol. 3, No. 01; 2018
ISSN: 2456-8643
www.ijaeb.org Page 40
Ayati 0.000 26.33 1.98 27.04 10.77 2.27
0.150 32.00 2.00 28.78 11.65 2.40
0.175 81.17 2.00 35.01 15.29 3.02
0.200 53.67 2.30 31.61 13.80 2.79
0.225 39.17 2.10 32.47 13.21 2.92
0.250 45.67 2.10 31.10 12.33 2.57
LSD (0.05) 14.956 NS NS 1.5051 0.3700
The effects of P solution concentration and soil location on the yield of soybean in TseKough
soil (Table 10) shows that the number of pods per plant, number of seeds per pod, 100 pod
weight, 100 seed weight and grain yield increased significantly with increase in solution P
concentration up to 0.225 mg kg-1 attaining the highest grain yield (2.85 t ha-1) at this level. This
solution concentration therefore appears to be the optimum solution P concentration for soybean
on this soil. Consequently the quantity of fertilizer P required to achieve this level of solution
concentration was calculated to be 1.75 mg kg-1 therefore this value was taken to be the standard
phosphate requirement for the TseKough soil which is equivalent to 223.32 kg P ha-1
Similar results as with the other Alfisols were obtained with the Ayange soil (Table 10). Values
of all the variates increased with increasing solution P concentration up to 0.175 mg kg-1 before
declining. The maximum grain yield (3.19 t ha-1) was obtained at 0.175 mg kg-1 P solution
concentration and was therefore taken to be the optimum SPC for this soil. Consequently the
amount of fertilizer P needed to attain this concentration was calculated to be 1.07 mg kg-1which
is equivalent to 136.55 kg P ha-1 and taken to be the SPR for the Ayange soil
TseAgbakor obtained the highest values of number of pods produced per plant (97), 100 pod
weight (33.95 g), 100 seed weight (12.10 g), and grain yield (3.33 t ha-1) at solution
concentration of 0.200 mg kg-1. Therefore 0.200 mg kg-1P solution concentration was taken to be
the optimum concentration for the TseAgbakor soil. The amount of fertilizer P required to
achieve this solution concentration was calculated to be 0.8 mg kg-1 (SPR). This is equivalent to
102.09 kg P ha-1
The Mbachor soil, an Inceptisol had the highest grain yield value of 3.28 t ha-1 at a solution
concentration of 0.200 mg kg-1therefore this solution concentration was taken to be the optimum
SPC and the amount of fertilizer P needed to attain the solution concentration was calculated to
be 0.47 g kg-1 soil which is an equivalent of 59.98 kg P ha-1 and was therefore taken to be the
SPR for the Mbachor soil.
There was response of soybean to fertilizer P applications in the Ayati soil as the concentration
of solution P was increased. The highest number of pods produced per plant (81.17), 100 pods
weight (35.01 g), 100 seed weight (15.29 g) and grain yield (3.02 t/ha) were obtained at a
solution P concentration of 0.175 mg kg-1 consequently this solution concentration level is taken
to be the optimum solution P concentration for soybean on this soil. The quantity of fertilizer P
needed to achieve this solution concentration was calculated to be 0.34 g kg-1 soil which is
International Journal of Agriculture, Environment and Bioresearch
Vol. 3, No. 01; 2018
ISSN: 2456-8643
www.ijaeb.org Page 41
equivalent to 43.39 kg P ha-1 and taken to be the standard phosphate requirement for the Ayati
soil.
DISCUSSION
The properties of the soils indicate that the soils are acid to slightly acid with the Alfisols having
more acidic tendency than the Inceptisols. The soils were generally low in Potassium, organic
carbon content and total Nitrogen content this may be due to the practice of slash and burn which
is still very common in the state and the seasonal indiscriminate burning of vegetation by wild
fires as reported by (Anjembe, 2004) which prevents the formation of organic matter which is
also the store house of most nutrients. The results agrees with the observation of Aduayi et al.,
(2002) that most Nigerian soils are deficient in nitrogen, phosphorus and potassium, where for
this elements less than 1.5 g kg-1 Total N, less than 8 mg kg-1 (Bray- 1 P) and less than 0.20 C
mol kg-1 K are considered respectively to be below critical levels. Available P in the soils was
low in the Alfisols (5.20 – 7.21 mg kg-1) and of moderate values in the Inceptisols (8.20 – 12.50
mg kg-1). Generally the Alfisols had more clay, Fe2O3, and Al2O3 content with average values of
154.1g kg-1, 13.0 g kg-1 and 11.0 g kg-1 respectively as against 130.3 g kg-15.0 g kg-1 and 8.0 g
kg-1 average values for the Inceptisols. This may have been responsible for the differences
observed in their sorption behaviour.
The main effects of fertilizer P on the yield of soybeans indicated that solution concentration of
0.200 mg l-1 P resulted in optimum yield of the crops. This is the quilibrium soil solution
concentration that has been suggested for obtaining 95% of the maximum yield of soybean (Fox,
1981). This result is however contrary to the reports of Anjembe (2012) who obtained optimum
yield of soybean with lesser solution concentrations.
Observing the yield performances of the different soils, it could be seen that the soils performed
differently in the different variates studied, the number of pods per plant was highest in the
Mbachor soil, Daudu soil had the highest pod weight while TseAgbakor performed the best in
terms of 100 grain weight and total grain weight (t ha-1). This results may be attributed to the
variance in some physical and chemical properties of the soils and as well as their adsorption and
buffering capacities. It could also be traced to the initial p concentrations of these soils as
TseAgbakor had the highest value of available P followed by the Mbachor soil.
Effect of poultry manure on the yield of soybeans (Table 9) revealed that additions of poultry
manure did not affect significantly some of the parameters studied. However, the number of pods
per plant and the total grain yield were increased significantly. This could be ascribed to the
beneficial effects of poultry manure on the chemical, physical and biological properties of the
soil. Most of these effects are due to an increase in soil organic matter (Shirani et al., 2002;
Liang et al., 2011; Bakayoko et al., 2009) resulting from manure application. Previous studies
also revealed that Organic matter is an ion exchanger and has a net negative charge (Parfitt,
1990). They block sites on which phosphate could sorb. Wandruszka (2006) revealed that
manure not only affects sorption and precipitation of P, but often contains significant amounts of
the element which are thereby deliberately or incidentally added to the soil alongside other
nutrient elements such as N, K and Ca.
International Journal of Agriculture, Environment and Bioresearch
Vol. 3, No. 01; 2018
ISSN: 2456-8643
www.ijaeb.org Page 42
CONCLUSION
The soils under study had low to moderate levels of available P. The addition of Poultry manure
contributed significantly to the yield of the crop. Fertilizer P solution concentration for optimal
soybeans production on these soils varied from 0.175 mg l-1 at Ayati and Ayange to 0.225 mg l-1
at TseKough. For Daudu, TseAgbakor and Mbachor it was 0.200 mg l-1.
REFERENCES
Aduayi, E. A,V. O. Chude, B. A. Adebusuyi and S.O. Olayiwola eds.(2002). Fertilizer use and
management practices for crops in Nigeria. 3rd ed. S.B.Garko international limited. 67-70.
Anjembe, B. C. (2004). Evaluation of Sulphur status for groundnut production in some selected
soils of Benue state, Nigeria. M.Sc Thesis.University of Agriculture, Abeokuta, Nigeria.
Anjembe, B. C. (2012). Phosphorus buffering capacity, Equilibrium Phosphate Concentration
and yield of soybeans Glycine (L.)Merr.In some soils of Benue state, Nigeria.Ph D. thesis,
University of Agriculture, Abeokuta, Nigeria.
Brady, N. C., Weil, R. R., (2014). The nature and properties of soils, 14thedition., Prentice Hall,
Upper Saddle River, NJ. 1046 pp
Farhad, W., M. F. Saleem, M. A. Cheema and H. M. Hammad. 2009. Effect of poultry manure
levels on the productivity of spring maize (Zea mays L.) The J. Ani.& Plant Sci., 19(3): 122-125
Fox, R. L. (1981). External Phosphorus Requirements of Crops.Chemistry in the Soil
Environment. American Society of Agronomy, Madison, WI, pp. 224 – 239
Iyamuremye, F., Dick R. P., Baham, J. (1996). Organic amendments and phosphorusdynamics:
1. Phosphorus chemistry and sorption. Soil Science Journal 161, 426–435
Liang W, Wu X, Zhang S, Xing Y, Wang R (2011). Effect of organic amendments on soil water
storage in the aeolian sandy land of northeast China. Proceedings of the Electrical and Control E
Engineering (ICECE), International Conference on 16th – 18th Sept. 2011. pp. 1538-1540.
Mebra, O.P and M.I Jackson (1960) Iron oxide removal from soils and clays by a dithionate-
citrate system buffered with sodium bicarbonate. Proceedings of 7th National Conference on
clays and clay minerals pp 317 – 327.Paragon press, New York.
Mehra N.O Legg, J.C, Goring CAI & Black CA (1954) Determination of organic phosphorus in
soil: 1. Extraction methods. Soil science society of America proceedings 18: 443-449.
Oad, F.C., U.A. Buriro and S.K. Agha (2004).Effect of organic and inorganic fertilizer
application on maize fodder production. Asian J. Plant Sci., 3(3): 375-377.

International Journal of Agriculture, Environment and Bioresearch
Vol. 3, No. 01; 2018
ISSN: 2456-8643
www.ijaeb.org Page 43
Olsen, S. R. and F. E. Khasawneh (1980).Use and limitations of physical – chemical criteria for
assessing the status of phosphorus in soils. In: Khasawneh et al., (eds.) The role of Phosphorus in
Agriculture, USA Madison W.I.
Parfitt R. L. (1990). Phosphate adsorption on an Oxisol. Soil Sci. Soc. Am. 41 : 1064 – 1067
Shirani H, Hajabbasi MA, Afyuni M, Hemmat A (2002). Effects of farmyard manure and tillage
systems on soil physical properties and corn yield in central Iran. J. Soil Till. Res., 68(2): 101-
108.
Walkley, A., and I. A. Black. (1934). An examination of Degtjareff method for determining soil
organic matter and proposed modification of the chromic acid in soil analysis.1. Experimental
soil science 79: 459-465.
Wandruszka, R. (2006). Phosphorus retention in calcareous soils and the effect of organic matter
on its mobility. Geo. Trans. 7:6 [doi: 10.1186/1467- 4866- 7 -6].
Warren G.P. (1992). Fertilizer phosphorus: Sorption and residual value in Tropical African Soils.
NRI Bulletin 37, Chatham, UK: Natural Research Institute.
Yusuf I.A and A.A Idowu (2001) NPK requirement for soybean production in the Southern
Guinea Savannah. Tropical oil seeds journal 6:50-56.