
Effect of pass schedule and groove design on the metal ...
14
S¯ adhan¯ a Vol. 41, No. 1, January 2016, pp. 111–124 c Indian Academy of Sciences Effect of pass schedule and groove design on the metal deformation of 38MnVS6 in the initial passes of hot rolling R S NALAWADE ∗ , V R MARJE, G BALACHANDRAN and V BALASUBRAMANIAN Kalyani Carpenter Special Steel Pvt. Ltd., Mundhwa, Pune 411036, India e-mail: [email protected]; [email protected]; [email protected]; [email protected] MS received 29 October 2014; revised 9 June 2015; accepted 1 September 2015 Abstract. The deformation behaviour of a hot rolled micro-alloyed steel bar of grade 38MnVS6 was examined using an FEM model during the initial passes in a blooming mill, as a function of three different pass schedules, roll groove depth, collar taper angle and corner radius. The simulations predicted the effective strain penetration, load, torque, fish tail billet end shapes, and metal flow behaviour at a chosen temperature, mill rpm and draft. The model predictions were validated for typical groove geometry and a typical pass schedule. Lower collar taper angle, lower corner radius and higher depth of groove in hot rolling enabled achievement of higher strain penetration, higher mill load and lower fish tail formation. The present study establishes the capability of the model to improve the internal quality of the rolled billet as measured by effective strain which was corroborated to the rolled bar macrostructure and microstructure. The model enables yield improvement by the choice of draft to minimise fish tail losses. The surface quality is improved by the ability to avoid fin formation that occurs at certain conditions of rolling. Thus, the groove geometry, roll pass schedule and rolling mill parameters and temperature can be optimised for best product quality and yield. Keywords. Hot rolling; groove geometry; pass design; rolling load; FEM simulation. 1. Introduction The quality and productivity of hot rolled bar steel products strongly depends on hot rolling parameters such as strain, strain rate, temperature, groove design and rolling sequence. It influences the metal deformation behaviour within the pass and mill load requirement apart from roll wear. The metal flow behaviour in a hot rolling process is a complex phenomenon, which is complicated due to tensorial stress distribution that is influenced by the material properties and deformation parameters. The knowledge of the in-process deformation and microstructural changes is critical for the optimisation of the pass design, the pass schedule and ulti- mately, the properties of the as rolled product. Computer based FEM simulations incorporating deformation mod- els can be used to develop optimum process sequences to obtain steels with sound quality, desirable microstructure and mechanical properties by controlling the hot rolling process parameters. In the hot rolling of bars, the material characteristics, rolling load, angle of bite, the roll groove geometry and roll pass sequence are reported to influence metal defor- mation and properties [1]. Using FEM based model on a rigid-plastic and slightly compressible material, the veloc- ity field during the isothermal steady and unsteady plane ∗ For correspondence strain rolling condition was investigated and correlated the front and back end shapes [2]. Heavier reductions in the ini- tial passes during ensured better void closure, cast structure break down, minimisation of fish tail and grain refinement [3, 4]. In an FEM model for the deformation of an alu- minium alloy, predictions of temperature, the front and the tail end deformation were closely matched with experimen- tal values, although the flow stress values showed variation depending on the choice of constitutive equations used for thermo-mechanical deformation namely, hyperbolic sine method, Hensel and Spittel model and Norton Hoff models [5]. Using a coupled thermo-mechanical and empirical mod- els, prediction of geometric parameters such as spread, cross sectional area, plastic strain and rolling force was deter- mined and experimentally validated for the hot rolling of an aluminium alloy [6]. A 3D-thermo mechanical coupled FEM elasto-plastic model was applied for the prediction of stress, strain, temperature, rolling force and torque for the two-pass and four pass roll schedules in the continuous hot rolling of a large diameter mandrel bar [7]. A large- deformation constitutive model to evaluate roll force and torque in heavy-reduction was found to be in agreement with Misaka–Yoshimoto model for dynamic recrystalliza- tion [8]. A variation in the rolling load was predicted as a result of non-uniform heating of the slab, in a grooved bar rolling using an FEM model, which was validated by experiments [9]. The strength of rolled flat bar material has 111
Transcript of Effect of pass schedule and groove design on the metal ...
Sadhana Vol. 41, No. 1, January 2016, pp. 111–124 c© Indian Academy of Sciences
Effect of pass schedule and groove design on the metal deformation of
38MnVS6 in the initial passes of hot rolling
R S NALAWADE∗, V R MARJE, G BALACHANDRAN and V BALASUBRAMANIAN
Kalyani Carpenter Special Steel Pvt. Ltd., Mundhwa, Pune 411036, India
e-mail: [email protected]; [email protected]; [email protected]; [email protected]
MS received 29 October 2014; revised 9 June 2015; accepted 1 September 2015
Abstract. The deformation behaviour of a hot rolled micro-alloyed steel bar of grade 38MnVS6 was examined
using an FEM model during the initial passes in a blooming mill, as a function of three different pass schedules,
roll groove depth, collar taper angle and corner radius. The simulations predicted the effective strain penetration,
load, torque, fish tail billet end shapes, and metal flow behaviour at a chosen temperature, mill rpm and draft.
The model predictions were validated for typical groove geometry and a typical pass schedule. Lower collar
taper angle, lower corner radius and higher depth of groove in hot rolling enabled achievement of higher strain
penetration, higher mill load and lower fish tail formation. The present study establishes the capability of the
model to improve the internal quality of the rolled billet as measured by effective strain which was corroborated to
the rolled bar macrostructure and microstructure. The model enables yield improvement by the choice of draft to
minimise fish tail losses. The surface quality is improved by the ability to avoid fin formation that occurs at certain
conditions of rolling. Thus, the groove geometry, roll pass schedule and rolling mill parameters and temperature
can be optimised for best product quality and yield.
Keywords. Hot rolling; groove geometry; pass design; rolling load; FEM simulation.
1. Introduction
The quality and productivity of hot rolled bar steel products
strongly depends on hot rolling parameters such as strain,
strain rate, temperature, groove design and rolling sequence.
It influences the metal deformation behaviour within the
pass and mill load requirement apart from roll wear. The
metal flow behaviour in a hot rolling process is a complex
phenomenon, which is complicated due to tensorial stress
distribution that is influenced by the material properties and
deformation parameters. The knowledge of the in-process
deformation and microstructural changes is critical for the
optimisation of the pass design, the pass schedule and ulti-
mately, the properties of the as rolled product. Computer
based FEM simulations incorporating deformation mod-
els can be used to develop optimum process sequences to
obtain steels with sound quality, desirable microstructure
and mechanical properties by controlling the hot rolling
process parameters.
In the hot rolling of bars, the material characteristics,
rolling load, angle of bite, the roll groove geometry and
roll pass sequence are reported to influence metal defor-
mation and properties [1]. Using FEM based model on a
rigid-plastic and slightly compressible material, the veloc-
ity field during the isothermal steady and unsteady plane
∗For correspondence
strain rolling condition was investigated and correlated the
front and back end shapes [2]. Heavier reductions in the ini-
tial passes during ensured better void closure, cast structure
break down, minimisation of fish tail and grain refinement
[3, 4]. In an FEM model for the deformation of an alu-
minium alloy, predictions of temperature, the front and the
tail end deformation were closely matched with experimen-
tal values, although the flow stress values showed variation
depending on the choice of constitutive equations used
for thermo-mechanical deformation namely, hyperbolic sine
method, Hensel and Spittel model and Norton Hoff models
[5]. Using a coupled thermo-mechanical and empirical mod-
els, prediction of geometric parameters such as spread, cross
sectional area, plastic strain and rolling force was deter-
mined and experimentally validated for the hot rolling of
an aluminium alloy [6]. A 3D-thermo mechanical coupled
FEM elasto-plastic model was applied for the prediction
of stress, strain, temperature, rolling force and torque for
the two-pass and four pass roll schedules in the continuous
hot rolling of a large diameter mandrel bar [7]. A large-
deformation constitutive model to evaluate roll force and
torque in heavy-reduction was found to be in agreement
with Misaka–Yoshimoto model for dynamic recrystalliza-
tion [8]. A variation in the rolling load was predicted as
a result of non-uniform heating of the slab, in a grooved
bar rolling using an FEM model, which was validated by
experiments [9]. The strength of rolled flat bar material has
111
112 R S Nalawade et al
been improved by varying the accelerated cooling rate dur-
ing rolling using FEM simulation technic [10]. The influence
of the bloom geometry, friction coefficient, temperature and
the degree of reduction in hot rolling was input in a thermo-
mechanical model where the metal deformation could be
correlated with the product integrity and mechanical prop-
erties [11]. Bar rolling with a revised pass design and mod-
ified friction coefficient was simulated using an FEM based
deformation model which predicted experimental deforma-
tion [12]. The bloom geometry and rolling parameters such
as rolling speed, temperature, friction coefficient on the
stress–strain state of the system during rolling was optimised
using FEM based model that enabled improvement of prod-
uct mechanical properties [13]. The prediction of stress and
strain field using rigid plastic finite element model could
be assessed and the reliability was established with pub-
lished literature [14]. Using a reverse material tracking FEM
simulation technique, the end shapes of rolled bloom were
predicted which enabled reduction in the end crop losses
due to fishtail formation [15]. The modification of the ini-
tial preform to be rolled with convex end shapes minimised
fish tail in hot rolling [16]. Using a non-linear finite ele-
ment method a new flat-oval groove with a multi-direction
low temperature deformation was proposed for ultra-fine
grain development [17]. Using a FEM based simulation on
hot deformation of steel prediction of load, torque, tem-
perature distribution, metal flow behaviour, macrostructure,
microstructure and austenitic grain size was validated with
experimental data [18]. Roll pass design developed by ana-
lytical method was further optimised by FEM based model
in a round bar rolling and in an oval-round roll pass and a
combination of flat and round pass [19].
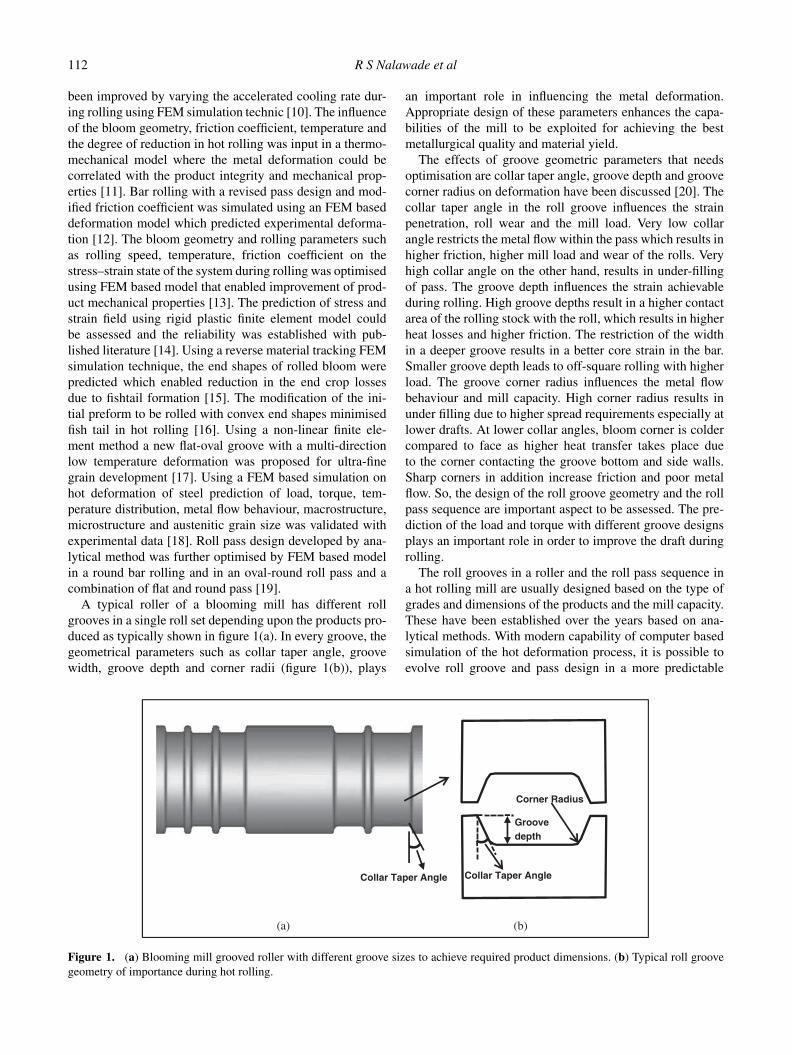
A typical roller of a blooming mill has different roll
grooves in a single roll set depending upon the products pro-
duced as typically shown in figure 1(a). In every groove, the
geometrical parameters such as collar taper angle, groove
width, groove depth and corner radii (figure 1(b)), plays
an important role in influencing the metal deformation.
Appropriate design of these parameters enhances the capa-
bilities of the mill to be exploited for achieving the best
metallurgical quality and material yield.
The effects of groove geometric parameters that needs
optimisation are collar taper angle, groove depth and groove
corner radius on deformation have been discussed [20]. The
collar taper angle in the roll groove influences the strain
penetration, roll wear and the mill load. Very low collar
angle restricts the metal flow within the pass which results in
higher friction, higher mill load and wear of the rolls. Very
high collar angle on the other hand, results in under-filling
of pass. The groove depth influences the strain achievable
during rolling. High groove depths result in a higher contact
area of the rolling stock with the roll, which results in higher
heat losses and higher friction. The restriction of the width
in a deeper groove results in a better core strain in the bar.
Smaller groove depth leads to off-square rolling with higher
load. The groove corner radius influences the metal flow
behaviour and mill capacity. High corner radius results in
under filling due to higher spread requirements especially at
lower drafts. At lower collar angles, bloom corner is colder
compared to face as higher heat transfer takes place due
to the corner contacting the groove bottom and side walls.
Sharp corners in addition increase friction and poor metal
flow. So, the design of the roll groove geometry and the roll
pass sequence are important aspect to be assessed. The pre-
diction of the load and torque with different groove designs
plays an important role in order to improve the draft during
rolling.
The roll grooves in a roller and the roll pass sequence in
a hot rolling mill are usually designed based on the type of
grades and dimensions of the products and the mill capacity.
These have been established over the years based on ana-
lytical methods. With modern capability of computer based
simulation of the hot deformation process, it is possible to
evolve roll groove and pass design in a more predictable
(a)
Collar Taper Angle Collar Taper Angle
(b)
Corner Radius
Groove
depth
Figure 1. (a) Blooming mill grooved roller with different groove sizes to achieve required product dimensions. (b) Typical roll groove
geometry of importance during hot rolling.

Effect of rolling strategy on metal flow of 38MnVS6 steel 113
manner. The metal deformation behaviour within the given
rolls can be correlated to the chosen pass design and rolling
parameters.
In this study, the effect of metal flow behaviour in a single
groove with variation of groove geometry and pass sequence
designs has been studied for the initial few passes in detail,
using a finite element based deformation model in a reversi-
ble two high rolling mill. Literature review shows that hardly
simulations are there which have studied the influence of
groove geometry on metal flow behaviour on internal metal
quality at the blooming mill stage. The present model asses-
ses the parameters such as temperature distribution, strain
penetration, fishtail formation, microstructure rolling load,
torque, in the hot rolling of a typical micro alloyed steel
grade. Micro-alloyed steels are an important grade produced
in significant quantities by the company for a wide variety
of automotive end users. This grade is sensitive to thermo-
mechanical processing and the ability to observe the defor-
mation behaviour in hot rolling is of interest.
2. FEM model
In the present work, FEM based FORGE simulation soft-
ware is used to study the metal flow behaviour in the hot
rolling process. The rolls are considered as rigid objects
while the metal deformed is plastic. The elastic effect is
neglected for bloom. The model uses purely visco-plastic
approximations. The constitutive equations of the metal flow
behaviour at a given temperature, deformation load, friction
and the geometry are based on 3D isotropic visco-plastic
behaviour of Norton Hoff law (Eq. 1);
S = 2K(√
3εeq
)m−1εvp, (1)
where s – Deviatoric stress tensor, εeq– Equivalent strain
rate, εvp – Viscoplastic strain rate, K, m – material parameters.
The mechanical law (Eq. 2) used in the model is isotropic
with an additive decomposition of the strain rate:
εeq = εe + εp (2)
where εe is the elastic strain rate and εp the plastic or visco
plastic strain rate.
The plastic law (Eq. 3) is expressed by a Power law:
εp = 1
K
[
σ − R
K
]1m
−1
σ , (3)
where σ ’ is the deviatoric stress tensor, σ is the usual equiv-
alent stress, K is the consistency constant and m is the strain
rate sensitivity.
The flow stress at elevated temperature at different strain
and strain rates is evaluated by Hensel–Spittel model (Eq. 4)
[24]. It is temperature dependent and takes strain hardening
or softening behaviour into account.
σf = Aem1T T m9εm2em4ε (1 + ε)m5T em7ε εm3 εm8T (4)
where σf is flow stress, ε is equivalent strain, ε is strain
rate, T is temperature given in Celsius, m1 and m9 define
the material’s sensitivity to temperature, m5 term coupling
temperature and strain, m8 term coupling temperature and
strain rate, m2, m4, and m7 define the material’s sensitiv-
ity to strain, m3 depends on the material’s sensitivity to
the strain rate. These constants for the material under study
were taken as an output from JMAT Pro software. The val-
ues of constants in Hensel Spittel flow stress equation are
A = 1809.2421, m1 = −0.0029, m2 = −0.14227, m3 =0.14102, m4 = −0.05764, m5 = 0, m6 = 0, m7 = 0, m8 =0,
m9 = 0. In order to cross check the correctness of these
values, the flow stress calculated based on the Hensel Spit-
tel equation at various strain rates as shown in figure 2 was
compared with the flow stress values published [23] where
good correlation could be established.
The thermal history during the hot rolling process is
obtained by the general heat equation (Eq. 5) which considers
internal heat generation parameter,
ρc = dT
dt= div (kgrad (T )) + qv (5)
The input boundary conditions as in figure 3 are imposed
in the model as per following equations:
Figure 2. Comparison of the flow stress values of literature and predicted by Hensel Spittel equation at various temperature.

114 R S Nalawade et al
Figure 3. Different boundary conditions used during the rolling simulation.
The heat transfer due to convection with water cooling
of rollers was taken into account by the input of a variable
heat transfer coefficients along the length of the bloom as
shown in figure 4. The heat transfer due to surface radiation
is defined by the following equation:
− kdT
dt= εrσr
(
T 4 − T 4ext
)
(6)
where εr is the emissivity, σr is the Stefan’s constant, and
Text is outside temperature. The heat transfer with the roller
is given by the following equation:
ϕ = kgrad (T ) = α (T − Text ) , (7)
where α is heat transfer coefficient.
At the interface between part and tool the friction shear
stress can be modelled by a “Viscoplastic Coulomb” law
(Eq. 8) as used by Duan et al [5].
τ = −αf |σn| �V
|�V |1−p(8)
where αf is the friction coefficient.
The friction between the roll and the bloom surface
depends upon the amount of reduction, temperature, surface
roughness of the rollers and rolling velocity. Based on the
Batchinov friction equation [8], a friction coefficient of 0.5
was used in the present model.
A Johnson-Mehl Avrami law is used to compute the
fraction of ferrite, pearlite or bainite transformed
y = ymax
(
1 − e−btn)
,
where y is the transformed fraction for each phase and ymax
is the maximum phase fraction which can be transformed
Figure 4. Variable heat transfer coefficients for convective heat
transfer to take into account of effect of water splashes on rolls.
function of the temperature; t is the elapsed time since the
growth began; B and n are the Avrami law coefficients.
During the simulation that involves very large deforma-
tion, some elements become much more distorted and are
not appropriate for further computation. Hence the model
has the ability to regenerate the mesh several times in order
to complete the simulation. Use of 3D tetrahedral elements
with 20 mm mesh size is made. The tetrahedral mesh is
found to suit the complex shapes in deformation and for
automatic meshing and remeshing. The FEM mesh of the
bloom consisted of 18300 nodes and 83973 elements. The
rollers are considered as rigid body and meshed in 2D. The
simulation was run on a – 64GB RAM and 8 cores server.
In the present work, the rolling mill roll configuration and
the bloom were modelled using the Solid Edge software. The
input parameters are given in table 1. In the present study,
Effect of rolling strategy on metal flow of 38MnVS6 steel 115
Table 1. Input parameters used for deformation simulation.
Bloom cross section 320 × 400 mm2
Bloom length 3,480 mm
Input bloom temperature 1,235◦C
Initial temperature of rollers 65◦C
Roller Dia. 925 mm
Rolling speed 60 RPM
Heat transfer coefficient in air (W/m2K) 10
Heat transfer coefficient in deformation (W/m2K) 10,000
Coefficient of friction 0.5
an initial bloom size of 320 × 400 mm2 cross section with
material properties of steel 38MnVS6 grade has been con-
sidered. The chemical composition is 0.38% C, 1.4%Mn,
0.53% Si, 0.014% P, 0.16% Cr, 0.09% V, 0.07% Ti, 0.04%
Cu. To define the material grade, the physical properties and
flow stress data at elevated temperature are incorporated in
the simulation. The values of physical properties are specific
heat = 778 J/kg-K, density = 7850 kg/m3, conductivity =35 W/m-K. The initial rolling temperature was 1,235◦C as
per experimental observation With the above common input
parameters and boundary condition, the metal deformation
behaviour simulated at various designs of the initial stages
of roll pass schedules and roll grooves are described below.
2.1 Simulation on metal flow at varying initial pass
schedule during hot rolling
The simulation was attempted for only the initial few passes
of the blooming mill. Three roll pass schedules (a), (b) and
(c) were chosen as shown in table 2. These pass schedules
were designed in order to understand the effect of deforma-
tion strain per pass and pass sequence strategy on the metal
flow behaviour. The pass schedule (a) consisted of lighter
reduction per pass with overall deformation strain of 31%
after four roughing passes. Pass schedule (b) has only one
forward pass with 18% strain followed by reverse pass with
7% strain without tilt and ends with 24% overall deforma-
tion strain. In this case, higher width spread was possible
during forward pass while due to pass filling reverse draft is
lower to get a product free of fin formation. The pass sched-
ule (c) has a forward pass of 18% strain followed by a 90◦
tilt followed by a reverse pass of 19% strain, with an overall
deformation strain of 32.5%.
2.2 Simulation on metal flow at varied roll groove
geometry
The present study examines the influence of collar taper
angle with the pass schedule (a) in table 2 on metal deforma-
tion behaviour at various conditions. The collar taper angles
considered were 9◦, 15◦, 25◦ and 35◦ (figure 1) The effect of
roll groove depth on metal flow behaviour was studied for a
Table 2. Three types of pass schedules used during hot rolling.
Deformation strain Overall deformation Reduction
Pass no. per pass strain ratio
Pass schedule (a)
Forward 1 13 13 1.15
Reverse 2 5 14 1.16
90◦ tilt
Forward 3 10 24 1.31
Reverse 4 9 31 1.45
Pass schedule (b)
Forward 1 18 18 1.21
Reverse 2 7.5 24 1.31
Pass schedule (c)
Forward 1 18 18 1.21
90◦ tilt
Reverse 2 19 32.5 1.48
Note: % Reduction per pass = (area at input of pass−area after the pass) ×100/( area at input of pass).
% Overall deformation strain = (Initial bloom area−area after pass) ×100/(Initial bloom area).
Reduction ratio = Initial bloom area/area after pass.
Area implies cross section area.
single pass with a constant draft of 80 mm at groove depths
of 50 mm, 63 mm and 80 mm. The effect of corner radius
of the rolling groove on the metal flow was simulated for a
pass schedule (a) in table 2 at three different corner radiuses
of R-15 mm, R-30 mm and R-45 mm
3. Experimental validation on simulation trials
The simulation results were validated by experimental stud-
ies on one typical roll groove geometry in the two-high
reversible hot rolling mill. The experimental study was con-
ducted using the similar input parameter as in table 1. The
experiments validated the rolling load torque, macrostruc-
ture and microstructure during hot rolling. The experimental
validation was done with a pass schedule (a) using a roll
groove with collar taper angle of 9◦, corner radius of 30 mm
and groove depth of 63 mm. The experimental rolling load
was calculated by using different analytical models given in
table 3. The rolling load is calculated by consideration of
strain, strain rate, temperature and composition of the steel
using Misaka’s equation [21]. The mill current value for a
given deformation strain was measured and was converted to
the rolling torque. The final rolled bar was allowed to cool in
air to room temperature. The macrostructure and microstruc-
ture were analysed at various sections of the hot rolled bar.
The macrostructure of the billet was obtained by etching in
35% hydrochloric acid and the microstructure was examined
by etching with 5% nital. The microstructure samples were
examined under Zeiss Axio-Tech optical microscope with
Axiovision analyser software.

116 R S Nalawade et al
Table 3. Analytical models used for the calculation of the rolling load.
Rolling load circulation model L = σ ∗ W0 ∗√
R�h ∗{
1 + μ∗√
R�h
2∗(
hi− �h2
)
}
Where L = Rolling load
σ = Mean resistance to deformation
Wo= Initial width
R= Roller radius
�h = Height reduction
hi= initial height
Misaka’s flow stress model σ = f ∗ {exp(0.126 − 1.75C + 0.594C2 σ = mean resistance to
+ 2851+2968C−1120C2T
)} deformation (kg/mm2),
∗ε∧0.21 ∗ ε∧0.13 ε = strain
f = 0.916 + 0.18Mn + 0.389V + 0.191Mo + 0.004Ni ε = strain rate
C = Carbon content (%)
Mn= Manganese content (%)
V= Vanadium content (%)
Mo= Molybdenum (%)
Ni= Nickel content %
T= temperature (◦K)
Average strain calculation model ε = 2√3
√
ε21 + ε2
2 + ε23 ε = Avg. strain
ε1 = ln(Li
Lf), ε2 = ln(
Hi
Hf), ε3 = ln(
wi
Wf) ε1 = Strain in length direction
ε2 = Thickness strain
ε3 = Strain in width direction
Li ,Hi ,Wi = Initial length, height and width
Lf ,Hf ,Wf = Final length, height and width
Strain rate calculation model ε = εtp
ε = Strain rate
tp = 60Lp
2πNRtp = contact time
Lp = Length of arc of contact
N= Rotational speed
R= Roller radius
4. Results and discussion
The investigation is focused on assessing the influence of
initial roll pass sequence in a break down mill with var-
ied drafting schedule in a two-high reversible rolling mill.
In every pass, if the maximum deformation suitable to the
mill load capacity is achieved then the internal quality and
productivity would increase. In steel plants, a wide range of
product cross sections have to be manufactured and hence
there are different grooves in a single roller with varying
internal geometry. In addition, the formability of the work
piece material decides the extent of deformation. Hence, an
optimum deformation strain and strain rate is maintained
during rolling. Highest deformation may not be possible in
every pass as there could be problems of restriction of mill
load and fin formation due to restriction of the groove width.
Very high deformation also produces excessive heat that
may deteriorate the microstructure. In the present study, the
effect of changing the deformation strain during hot rolling
in the initial passes on the metal flow behaviour in a typical
single groove has been examined
In any hot rolling process the material at the surface
layer tends to flow more than the bulk leading to fish tail
formation. This fish tail formation starts increasing with
Figure 5. The effective strain at core and amount of end crop loss
due to fishtail formation with the rolling pass sequences (a), (b)
and (c) (table 2). (Roll groove with collar taper angle of 9◦, corner
radius of 30 mm and groove depth of 63 mm).
reduced strain per pass or increasing the number of passes.
The minimisation of the fish tail formation has a direct influ-
ence on the yield of the material. The present study examines
the formation of fish tail and associated material yield.
Effect of rolling strategy on metal flow of 38MnVS6 steel 117
4.1 Influence of roll pass schedules on deformation
behaviour
The effect of deformation strain per pass and pass sequence
on the deformation behaviour is important in order to design
the proper rolling pass schedule. The pass schedule should
be designed in such a way that, it ensures good deformation
of the material in every pass with proper utilization of the
mill capacity. It has to also deliver better quality products
by achieving higher strain penetration, improvement of yield
and product without defects. The present study establishes
the metal flow behaviour in the rolling of the steel bloom in a
single groove through three different pass schedules (a), (b)
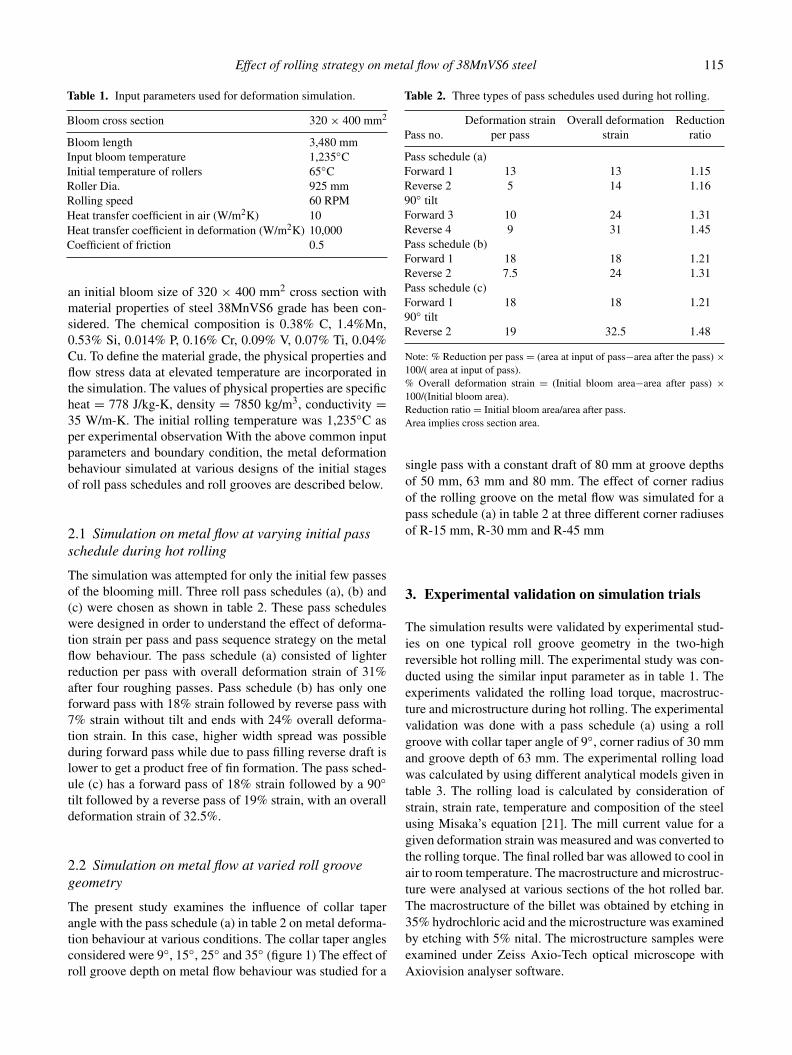
Figure 6. Effect of pass schedule on strain distribution on rolled
material cross section and fishtail (roll groove with collar taper
angle of 9◦, corner radius of 30 mm and groove depth of 63 mm).
and (c) as shown in table 2 The variation in core strain and
the fish tail formed in each of the pass schedule is shown in
figure 5 and figure 6.
It is seen that the pass schedule (a) (table 2) gave an effec-
tive strain of 0.54 at the core and with a fish tail loss of
14 kg. This pass schedule has lighter deformation strain per
pass and an overall 31% deformation strain. The pass sched-
ule (b) (table 2) shows highest effective strain of 0.57 in the
core Although the deformation strain is 24% the fish tail loss
is 14.1 kg. The pass schedule (c) with highest deformation
strain of 32% shows an effective strain of 0.5 but the fish tail
loss is 11 kg. Thus, it could be realised that modification of
roll pass schedule can affect the strain penetration and the
fish tail formation.
The pass schedule (a) has two forward passes and two
reverse passes. The forward pass has higher deformation
strain compared to reverse pass. This is followed by a 90◦
tilt and the next two passes follow a pattern similar to the
first two passes. From figure 6 it can be seen that the strain
variation from the surface to centre is more. This leads to
non-uniform metal deformation along the cross section. The
strain is concentrated on the surface and the highest fish tail
Figure 8. Variation of rolling load with respect to deformation
strain at different collar taper angles (roll groove with corner radius
of 30 mm and groove depth of 63 mm).
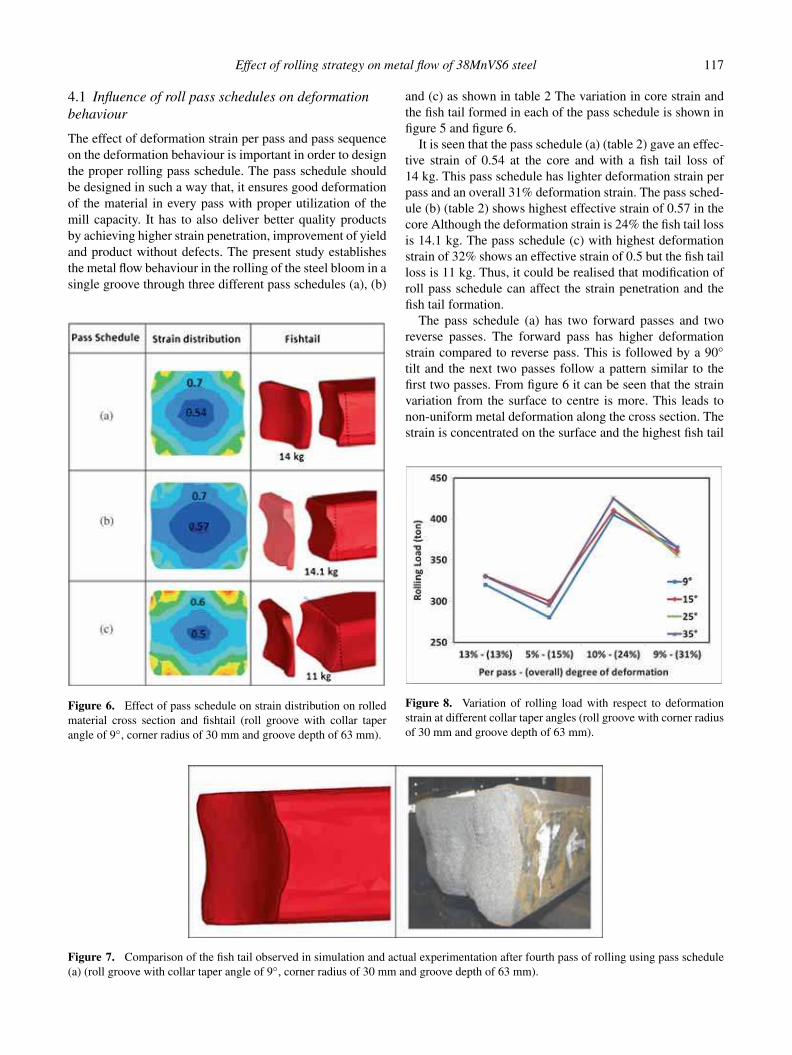
Figure 7. Comparison of the fish tail observed in simulation and actual experimentation after fourth pass of rolling using pass schedule
(a) (roll groove with collar taper angle of 9◦, corner radius of 30 mm and groove depth of 63 mm).
118 R S Nalawade et al
loss was observed in this case The pass schedule (b) has 18%
deformation strain in the forward pass and 7.5% deforma-
tion degree in reverse pass without a tilt. In other words good
deformation on one side of the bloom with a total deforma-
tion strain of 24% resulted in good strain penetration in the
core but a higher fish tail formation. In this pass schedule
higher strain in the reverse pass is limited by the groove
width and the associated fin formation due to overfilling. The
pass schedule requires higher mill load as well.
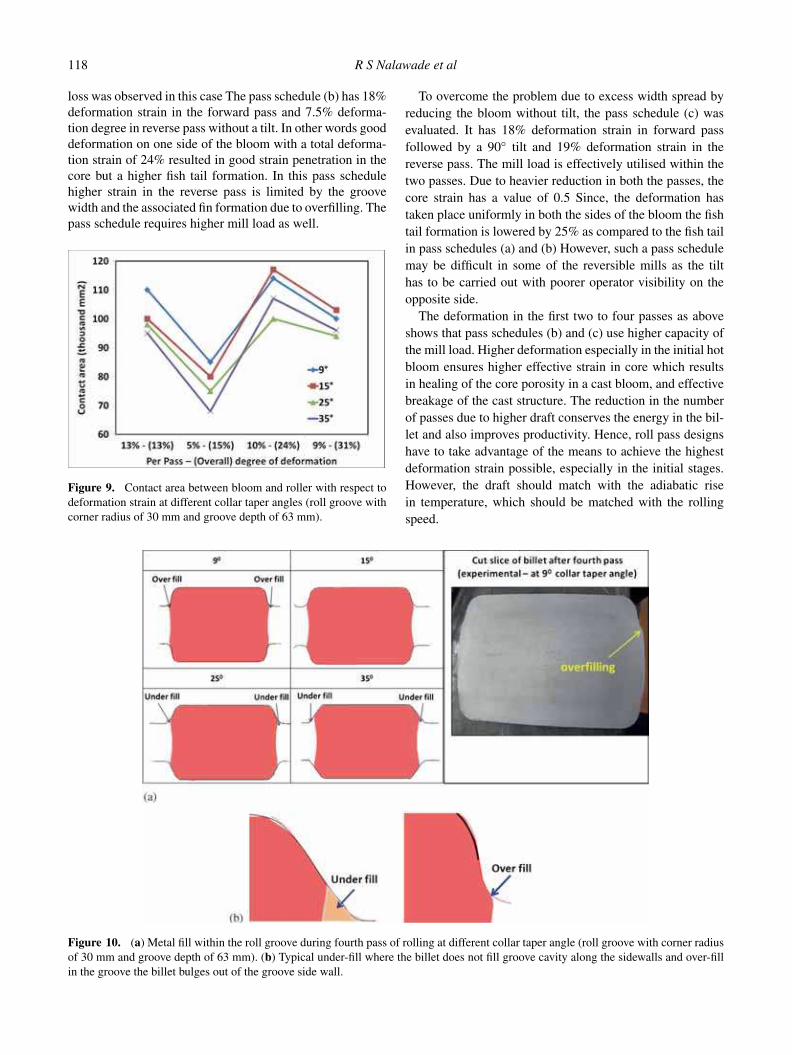
Figure 9. Contact area between bloom and roller with respect to
deformation strain at different collar taper angles (roll groove with
corner radius of 30 mm and groove depth of 63 mm).
To overcome the problem due to excess width spread by
reducing the bloom without tilt, the pass schedule (c) was
evaluated. It has 18% deformation strain in forward pass
followed by a 90◦ tilt and 19% deformation strain in the
reverse pass. The mill load is effectively utilised within the
two passes. Due to heavier reduction in both the passes, the
core strain has a value of 0.5 Since, the deformation has
taken place uniformly in both the sides of the bloom the fish
tail formation is lowered by 25% as compared to the fish tail
in pass schedules (a) and (b) However, such a pass schedule
may be difficult in some of the reversible mills as the tilt
has to be carried out with poorer operator visibility on the
opposite side.
The deformation in the first two to four passes as above
shows that pass schedules (b) and (c) use higher capacity of
the mill load. Higher deformation especially in the initial hot
bloom ensures higher effective strain in core which results
in healing of the core porosity in a cast bloom, and effective
breakage of the cast structure. The reduction in the number
of passes due to higher draft conserves the energy in the bil-
let and also improves productivity. Hence, roll pass designs
have to take advantage of the means to achieve the highest
deformation strain possible, especially in the initial stages.
However, the draft should match with the adiabatic rise
in temperature, which should be matched with the rolling
speed.
Figure 10. (a) Metal fill within the roll groove during fourth pass of rolling at different collar taper angle (roll groove with corner radius
of 30 mm and groove depth of 63 mm). (b) Typical under-fill where the billet does not fill groove cavity along the sidewalls and over-fill
in the groove the billet bulges out of the groove side wall.

Effect of rolling strategy on metal flow of 38MnVS6 steel 119
Figure 11. Core strain with respect to deformation strain, collar taper angle and strain distribution across the cross section after fourth
pass at different collar taper angles (roll groove with corner radius of 30 mm and groove depth of 63 mm).
Figure 12. Comparison of simulated and experimental results for
torque during different passes of rolling shows approximately sim-
ilar trend in both cases. (Roll groove with collar taper angle of 9◦,
corner radius of 30 mm and groove depth of 63 mm).
The simulation results of hot rolling the bloom as per
pass schedule (a) was matched with experimental results for
the rolling load, torque, macrostructure (strain penetration),
microstructure and end shape (fish tail). The fishtail shape
formed after the rolling of the bloom in the initial four passes
in the simulation and the experiment showed a close match
as in figure 7. The fish tail observed by simulation was found
to be 14 kg while the rolled bar showed a value of 18 kg.
4.2 Influence of collar taper angle on metal
deformation
Proper design of the collar taper angle of a roller groove
leads to better metal flow within the pass minimizes the mill
load, avoidance of defects like overlap and fins. The taper
Figure 13. Comparison of simulated and experimental results
for mill load produced during different passes of rolling, shows
approximately similar trend in both cases. (Roll groove with collar
taper angle of 9◦, corner radius 30 mm and groove depth 63 mm).
permits free entry and delivery of the stock accommodating
the width spread of material in the groove, which results in
smooth flow of the metal. Generally, the collar angle for a
roughing mill groove is maintained between 9◦ and 20◦ [1]
The frictional losses due to higher metal flow in the pass can
be minimized by designing proper collar taper angle. Hence,
in the present study, simulation was carried out at the collar
taper angles of 9◦, 15◦, 25◦ and 35◦ using a pass schedule
(a) as shown in table 2.
The rolling load with respect to the deformation strain for
the different collar taper angle is shown in figure 8. The load
distribution after the first forward pass of 13% with differ-
ent collar taper angle shows a load value varying between
320 and 340 tons. The load at 9◦ collar angle is lower, while
the load at 15◦ and 25◦ is equal and higher. In the reverse
pass, the reduction per pass is just 5% and the load value
120 R S Nalawade et al
is lower varying between 280 and 305 tons. Similar trend is
observed in the second pass. In the third forward pass after a
90◦ tilt and at 10% reduction per pass, the load increases to
values between 405 and 425 tons. The collar angles 9◦ and
15◦ take a lower limit of the load and the higher angles take
the upper load limit. The load increase in the third pass may
be attributed to the higher input thickness, larger reduction
and strain hardening of the steel. In the fourth reverse pass
with 9% deformation strain, the load value ranges between
355 and 365 tons. The load observed in the case of 9◦ collar
angle shows higher value than other collar angle. The load
exerted in a groove is dependent on the contact area of the
bloom and the roller. During the initial three passes, the load
observed in the case of 9◦ collar angle is less as compared to
15◦, 25◦ and 35◦. This can be justified by the highest contact
area between the bloom and the roller, which results in low-
ering the rolling pressure and load as in figure 9. In the fourth
pass, the load observed is more in case of 9◦ collar angle due
to the overfilling of the pass. The experimentally rolled bil-
let cut after the fourth pass was correlated with simulation
results, where overfilling behaviour was observed as shown
in figure 10(a) and (b). There is no complete pass filling in
the case of 25◦ and 35◦ collar angle figure 10(b).
The effective strain at the core during each rolling pass for
the different collar angles is shown in figure 11. With in-
creasing deformation the effective strain increased with all
taper angles. Higher strain was seen with 9◦ angle, probably
due to the higher restriction of the metal within the pass.
Thus, the lower collar taper angle of the groove ensures
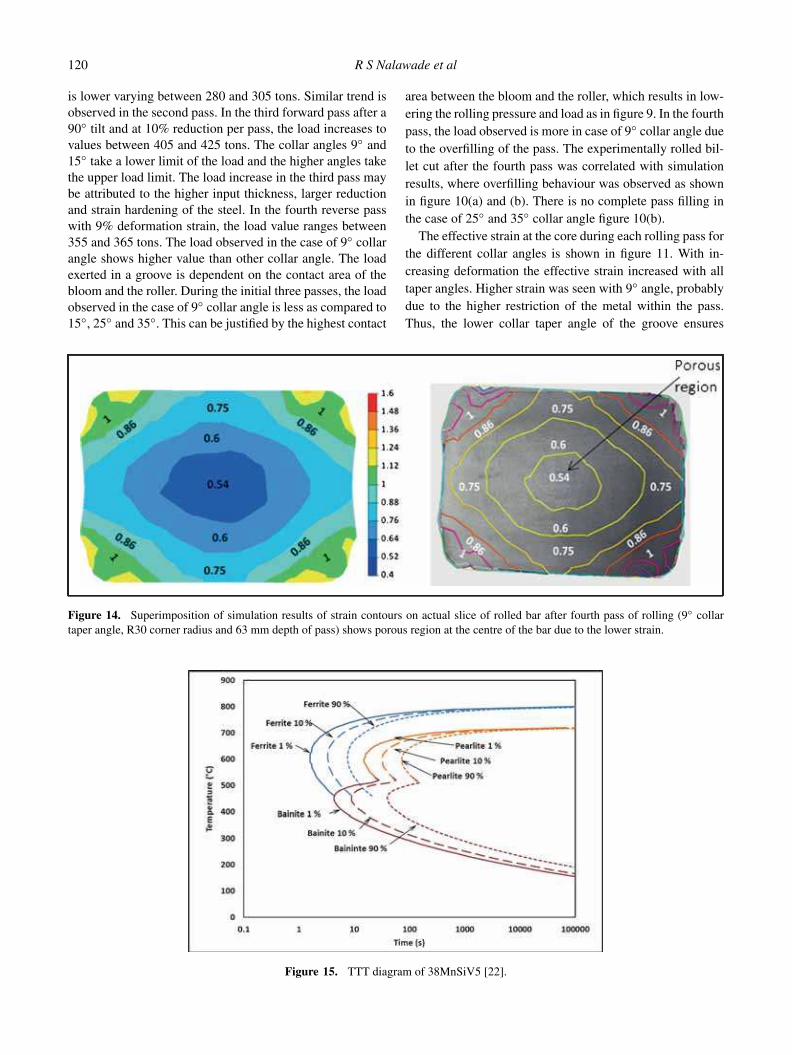
Figure 14. Superimposition of simulation results of strain contours on actual slice of rolled bar after fourth pass of rolling (9◦ collar
taper angle, R30 corner radius and 63 mm depth of pass) shows porous region at the centre of the bar due to the lower strain.
Figure 15. TTT diagram of 38MnSiV5 [22].

Effect of rolling strategy on metal flow of 38MnVS6 steel 121
Figure 16. Experimental and simulation result of microstructural investigations shows phase distribution (roll groove with collar taper
angle of 9◦, corner radius of 30 mm and groove depth of 63 mm).
Figure 17. Rolling load as a function of the deformation strain at
different corner radius (roll groove with collar taper angle of 9◦ and
groove depth of 63 mm).
higher deformation penetration and lower loads during
deformation.
Using the experimentally measured rolling mill motor
current values, the rolling torque was calculated and val-
idated with simulation as shown in figure 12. The torque
values of the experimental and simulation results show sim-
ilar trend in both cases with small variation. This small
variation may be attributed to the deviations in the measured
current value, which could be due to fluctuation of current
values caused by thermal gradient in the bar [9]. The ana-
lytical and predicted results from simulation of rolling load
during the different rolling passes are shown in figure 13.
The strain contours obtained from the simulation was
superimposed with the macrographs of rolled billet after
fourth pass as shown in figure 14. The amount of strain
between each bounded region is shown in figure 14. The
super imposed result clearly shows that the central regions
Figure 18. Contact area as a function of the deformation strain at
different corner radius (roll groove with collar taper angle of 9◦ and
groove depth of 63 mm).
with lower strain values are less consolidated as evidenced
from darker porosity spots. The surface region with higher
strain shows dense recrystallized structure.
Analysis was carried out on the ability of the model to
predict the microstructure in terms of percentage of phases
after the fourth pass of rolling. In both the experimental and
simulation evaluations, the final rolled bar was allowed to
cool in normal air up to the room temperature. The simulated
microstructure at various location of the billet was based on
super imposition of the cooling rates on the TTT-diagram
(figure 15) in the model. The experimental analysis of the
microstructure at various locations of the billet showed
about 16–18% of pro-eutectoid ferrite in a pearlite matrix,
while the predicted microstructure showed a pro-eutectoid
ferrite of 19–20% in pearlitic matrix as shown in figure 16.
In the present study, only a limited number of passes have
been considered to assess the capability of the model to

122 R S Nalawade et al
predict and the accuracy of the results. The model can be
extended for the entire pass schedule chosen. In addition, if
multi-stand rolling is considered, it is possible to assess the
grain structure evolution by incorporation of the dynamic
and metadynamic recrystallization that takes place during
the deformation and interpass duration. The recrystallization
equation based on Zener Holloman parameters is available
for the present steel grade [23].
Figure 19. Core strain, end cut weight due to fishtail and rolling
load variation with different groove depths (roll groove with collar
taper angle of 9◦ and corner radius 30 mm).
4.3 Influence of corner radius on deformation
behaviour
In order to understand, the effect of corner radius of a
grooved pass on the metal flow behaviour within the pass,
rolling simulations were carried out with varying corner
radius. In this case, the variation of the mill load with
respect to the deformation strain was studied with rolling
pass schedule (a) as shown in table 2. Three different cor-
ner radius of curvature R15, R30 and R45 was considered.
The dependence of load per pass on the deformation strain
for the three radii of curvatures is shown in figure 17. The
rolling load in each pass is found to increase with the radius
of curvature. The load requirement is found to be less in the
case of corner radius R15, which may be attributed to the
more surface contact area as shown in figure 18. The experi-
mental results of the rolling load, torque, macrostructure and
microstructure in a groove dimension of R30 at 63 mm draft
and 9◦ collar taper angle was validated with model results as
shown in figures 12–15.
4.4 Influence of groove depth on metal deformation
The effective roll radius is one of the factors, which influ-
ences the roll separating force and the flow of the material
within the pass. In the case of grooved rollers, the effective
roller radius depends on the depth of the groove. Gener-
ally, the depth of a groove pass is maintained less than a
Figure 20. Strain distribution and end cut due to fishtail formation after rolling through grooved pass with varying pass depth (roll
groove with collar taper angle of 9◦ and corner radius 30 mm).
Effect of rolling strategy on metal flow of 38MnVS6 steel 123
sixth of the roller diameter Single pass rolling at three dif-
ferent groove depths (50 mm, 63 mm and 80 mm) was
simulated and compared with the experimental mill load and
macrostructure The comparison of the core strain penetra-
tion, end cut weight loss due to fishtail formation and the
rolling load in all the three cases is shown in figure 19. The
results show that the core strain penetration increases with
increase in the groove depth. This is probably due to more
restriction in the width spread in a deeper groove which
increases the surface contact area between the roller and the
bloom. The rolling load is found to significantly decrease
with increasing groove depth. The larger groove depth con-
strains the metal flow within the pass and ensures better
strain penetration at the centre which further reduces the
fishtail formation as well. The fishtail at each end was about
9.4 kg (i.e. yield loss of 0.54%) in the case of smaller pass
depth of 50 mm and 7.05 kg (i.e. yield loss of 0.40%) with
the larger pass depth of 80 mm as shown in figure 20. The
increase in groove depth can improve the degree of deforma-
tion which results in improved strain penetration, reduction
in rolling load and reduced fishtail formation. But, increas-
ing the groove depth may lead to temperature loss, more
wear, more frictional power loss and reduced service life of
the rolls.
In summary, the metal flow behaviour as a function of
groove geometry and pass schedule in a blooming mill
was established using FEM model and validated by typical
experimental results. Lower collar taper angle, lower cor-
ner radius and higher depth of groove in hot rolling enable
achievement of higher strain penetration, optimum mill load
and lower fish tail formation. The model is capable of pre-
dicting the load, torque and microstructure. This sort of
analysis enables to virtually foresee the quality of the steel
and achieve optimum conditions for maximising yield and
productivity of the mill.
5. Conclusion
• The metal flow behaviour, strain distribution, temper-
ature distribution, mill load, microstructure was pre-
dicted in the hot rolling of 38MnVS6 steel bar using
Forge FEM simulation software. The effect of pass
schedule for the initial few passes, and the roll groove
geometry parameters were examined.• The investigation examined three different pass sched-
ules to achieve the same reduction in the initial few
passes. It was observed that light drafts with higher
number of passes leads to lower effective strain and
gave more fish tail formation. Increasing the draft on
same side of the billet to achieve the same reduction
gave higher strain penetration, higher load and larger
fish tail formation. Higher draft with single tilt gave
better strain penetration with lower fish tail formation
and with higher mill productivity.
• The effect of groove collar taper angle showed that
the lowest collar taper angle of 9◦ gave lowest load,
with desired groove filling. The load is higher for collar
angle up to 35◦. The effect of groove depth showed that
higher groove depth gave better strain penetration with
lower mill load and lower fish tail formation. The effect
of groove corner radii showed that the load increases
with increase in corner radius.• The result obtained in the simulation was validated
in an experimental groove and good correlation was
obtained between the simulated groove geometry and
the experimental groove. The simulation predicted the
rolling load, strain penetration, microstructure, and fish
tail formation at various stages and this was found
to show good match with experimental investigation.
Thus, the FEM based simulation could be successfully
applied for arriving at the roll groove design and pass
schedule during hot rolling.
References
[1] Wasatowski Z 1969 Fundamentals of rolling 1st ed., Perga-
mon Press, pp. 25–150
[2] Mori K, Osakada K and Oda T 1982 Simulation of plane-
strain rolling by the rigid plastic finite element method. Int. J.
Mech. Sci. 24: 519–527
[3] Robert W L 1983 Hot rolling of steel, 1st ed. Markel Dekker,
pp. 1–50
[4] Stahalberg U and Goransson A 1986 Heavy reduction by
means of ‘Non Bite rolling’ including some observation on
work piece shape. J. Mech. Working Technol. 12: 373–384
[5] Duan X and Sheppard T 2001 Prediction of temperature evo-
lution by FEM during multi-pass hot flat rolling of aluminium
alloys. Modelling Simulation Mater. Sci. Eng. 9: 525
[6] Biswas S, Joseph J, Gutierrez H and Kiefer B V 2003 User-
oriented three-dimensional finite element modelling of high
speed bar and rod rolling. In: Proceeding of 45th iron & steel
society mechanical working and steel processing conference
[7] Hong H, Kang Y, Feng C and Chen X 2003 Three dimen-
sional thermo mechanical coupled FEM simulation for hot
continuous rolling of large diameter mandrel bar. J. Mater. Sci.
Technol. 19: 228–230
[8] Byon S M, Kim S I and Lee Y 2004 Predictions of roll force
under heavy- reduction hot rolling using a large-deformation
constitutive model. Proc. Inst. Mech. Eng. B 218: 483–494
[9] Mróz S, Jagieła K and Dyja H 2007 Determination of
the energy and power parameters during groove-rolling. J.
Achievement Mater. Manuf. Eng. 2: 59–62
[10] Stefanik A, Szota P and Dyja H 2009 Numerical modelling
of the microstructure during 50 × 20 MM flat bars rolling
process. Arch. Metall. Mater. 54: 589–596
[11] Motallebi S R 2010 Investigation of influence parameters
on the hot rolling process using finite element method. In:
Proceeding of 2nd international conference on engineering
optimization, pp. 332–338
[12] Tomas Kubina, Miroslav Kucera and Rostislav Kocur 2010
Mathematical simulation of bar rolling with refined friction
coefficient. Rožnov pod Radhoštem, Ceská Republika

124 R S Nalawade et al
[13] Shevchenko D V, Saraev D Y, Nesterenko D L and Borovkov
AI 2011 FEM study of metal rolling in grooved rolls. In:
Proceedings of the 8th European LS-DYNA users conference
[14] Licheng Y, Jinchen J, Jinxiang H and Liwei N 2011 Prediction
of process parameters on stress and strain field in hot rolling
process using finite element method. Inf. Technol. J. 10: 2406–
2412
[15] Nalawade R S, Date P P, Mahadik K N and Cheekatla V S
K 2011 Control of end defect on rolled bar. Proceedings of
the International Conference on Technology of Plasticity, pp.
61–66
[16] Nalawade R S, Date P P, Mahadik K N, Cheekatla V S K,
Balasubramanian V and Singh R 2012 A novel method to
reduce end crop loss on rolled bars. Steel Tech. J. 6: 57–
66
[17] Xuetong Li, Lei Cao, Minting Wang and Fengshan Du 2012
Groove design and microstructure research of ultra-fine grain
bar rolling. Model. Numer. Simul. Mater. Sci. 2: 67–75
[18] Nalawade R S, Puranik A J, Balachandran G, Mahadik K N
and Balasubramanian V 2013 Simulation of hot rolling defor-
mation at intermediate passes and its industrial validity. Int. J.
Mech. Sci. 77: 8–16
[19] Aksenov S A, Chumachenko E N, Logashina I V and Kubina
T 2015 Numerical simulation in roll pass design for bar
rolling. Metalurgija 54: 75–78
[20] British Steel Corporation 1975 Roll pass design. Chorley &
Pickersgill Ltd., pp. 20–70
[21] Manohar P, Kyuhwan L, Rollett A D and Lee Y 2003 Compu-
tational exploration of microstructural evolution in a medium
C-Mn steel and applications to rod mill. ISIJ Int. 43: 1421–
1430
[22] Werke M, Kristoffersen H, Haglund S, Svensson L and
Nord A 2008 Predicting residual stresses and hardness of
a critical component using a combination of numerical and
empirical methods. Steel Res. Int. J. ISSN 1611-3683, 2: 812–
819
[23] Sen-dong G, Li-wen Zhang, Jin-hua R, Ping-zhen Z and
Yu Z 2014 Constitutive modelling of dynamic recrys-
tallization behaviour and processing map of 38MnVS6
non-quenched steel. J. Mater. Eng. Performance 23: 1062—
1068
[24] Hadasik E, Jedrusik D and Kawalla R 2004 Comparison of the
flow stress functions determined in the hot compression and
torsion tests. Acta Metall Slovaca 10: 271–278