Effect of Particle Loading Ratio and Orifice Exit Velocity on a Particle- Laden Jet
9
Copyright ⓒ The Korean Society for Aeronautical & Space Sciences 296 http://ijass.org pISSN: 2093-274x eISSN: 2093-2480 Technical Paper Int’l J. of Aeronautical & Space Sci. 12(3), 296–304 (2011) DOI:10.5139/IJASS.2011.12.3.296 Effect of Particle Loading Ratio and Orifice Exit Velocity on a Particle- Laden Jet Kyong-Yup Paik 1 , Jungsoo Yoon 1 , Jeongjae Hwang 1 , Jae Mook Chung 1 , Nicolas Bouvet 2 and Youngbin Yoon* School of Mechanical and Aerospace Engineering, Seoul National University, Seoul 151-742, Korea Abstract In order to design a shear coaxial injector of solid particles with water, basic experiments on a particle laden jet are necessary. e purpose of the present study is to understand the effect of particle loading ratio on the particle spray characteristics (i.e. spreading angle, distribution of particle number density, velocity profiles, and particle developing region length). Hydro-reactive Al2O3 particles with a primary particle diameter of 35~50 μm are used in this experiment. An automated particle feeder was designed to supply constant particle mass flowrates. Air is used as the carrier gas. To determine the air velocity at the orifice exit, tracers (aluminum oxide, 0.5~2 μm primary diameter) are also supplied by a tracer feeder. A plain orifice type injector with 3 mm diameter, and 20 mm length was adopted. Particle image velocimetry is used to measure the mean and fluctuating velocity components along the axial and radial directions. Key words: Particle-laden jet, Two-phase jet, Particle loading ratio, Spreading angle, Particle number density, Particle developing region, Turbulent intensity Nomenclature D orifice exit diameter L orifice length L developing length of the particle developing region m a air mass flow rate m p particle mass flow rate N c particle number density along the centerline N r particle number density along the radial direction r radial distance r 1/2 radial distance at 50 % velocity of centerline velocity U c mean axial velocity of centerline U o mean axial air velocity of orifice exit U r mean axial velocity along the radial direction V r mean raial velocity along the radial direction u’ rms velocity fluctuation x distance from the orifice exit φ particle loading ratio, (= m p / m a ) µ a kinetic viscosity coefficient of air ρ a air density 1 Graduated student, School of Mechanical and Aerospace Engineering 2 Post doctoral fellow, School of Mechanical and Aerospace Engineering * Corresponding author. Professor, School of Mechanical and Aerospace Engineering * E-mail address: [email protected] Received: July 19, 2011 Accepted: September 14, 2011
-
Upload
mustafa-al-dulaimi -
Category
Documents
-
view
227 -
download
3
Transcript of Effect of Particle Loading Ratio and Orifice Exit Velocity on a Particle- Laden Jet
Copyright ⓒ The Korean Society for Aeronautical & Space Sciences 296 http://ijass.org pISSN: 2093-274x eISSN: 2093-2480
Technical PaperInt’l J. of Aeronautical & Space Sci. 12(3), 296–304 (2011)DOI:10.5139/IJASS.2011.12.3.296
Effect of Particle Loading Ratio and Orifice Exit Velocity on a Particle-Laden Jet
Kyong-Yup Paik1, Jungsoo Yoon1, Jeongjae Hwang1, Jae Mook Chung1, Nicolas Bouvet2 and
Youngbin Yoon*School of Mechanical and Aerospace Engineering, Seoul National University, Seoul 151-742, Korea
Abstract
In order to design a shear coaxial injector of solid particles with water, basic experiments on a particle laden jet are necessary.
The purpose of the present study is to understand the effect of particle loading ratio on the particle spray characteristics (i.e.
spreading angle, distribution of particle number density, velocity profiles, and particle developing region length). Hydro-reactive
Al2O3 particles with a primary particle diameter of 35~50 μm are used in this experiment. An automated particle feeder was
designed to supply constant particle mass flowrates. Air is used as the carrier gas. To determine the air velocity at the orifice exit,
tracers (aluminum oxide, 0.5~2 μm primary diameter) are also supplied by a tracer feeder. A plain orifice type injector with 3
mm diameter, and 20 mm length was adopted. Particle image velocimetry is used to measure the mean and fluctuating velocity
components along the axial and radial directions.
Key words: Particle-laden jet, Two-phase jet, Particle loading ratio, Spreading angle, Particle number density, Particle developing
region, Turbulent intensity
NomenclatureD orifice exit diameter
L orifice length
Ldeveloping length of the particle developing region
ma air mass flow rate
mp particle mass flow rate
Nc particle number density along the centerline
Nr particle number density along the radial direction
r radial distance
r1/2 radial distance at 50 % velocity of centerline velocity
Uc mean axial velocity of centerline
Uo mean axial air velocity of orifice exit
Ur mean axial velocity along the radial direction
Vr mean raial velocity along the radial direction
u’ rms velocity fluctuation
x distance from the orifice exit
φ particle loading ratio, (= mp / ma)
µa kinetic viscosity coefficient of air
ρa air density
1 Graduated student, School of Mechanical and Aerospace Engineering2 Post doctoral fellow, School of Mechanical and Aerospace Engineering* Corresponding author. Professor, School of Mechanical and Aerospace Engineering * E-mail address: [email protected]
Received: July 19, 2011 Accepted: September 14, 2011
297
Kyong-Yup Paik1 Effect of Particle Loading Ratio and Orifice Exit Velocity on a Particle-Laden Jet
http://ijass.org
1. Introduction
Supercavitation underwater vehicles use rocket propulsion
systems with combustion of hydro-reactive metal fuel unlike
other conventional underwater vehicles using the propeller
propulsion systems. When a vehicle moves under the
water, cavitation occurs on the body surface due to velocity
difference between the body and the water. The cavitation on
the surface develops rapidly with increasing velocity, and if
this cavitation becomes supercavitation it is enough to wrap
the whole body, subsequently the underwater vehicle escapes
from the high drag force of water, and can potentially reach
high speeds over 400 km/h. Moreover, a supercavitation
underwater vehicle using a rocket propulsion system has
a higher propulsive efficiency per fuel unit volume as
compared to conventional underwater vehicles, because the
surrounding water can directly serve as the oxidizer.
Aluminum (Al2O3) and magnesium (MgO2) are mostly used
as hydro-reactive metal fuels. The combustion mechanism
differs from other conventional particles (for example, coal or
gunpowder). Indeed, oxide films covering the metal surface
under normal state should be melted prior to the reaction
with H2O. A uniform distribution of the metal particles in
the jet helps their total surface to be larger, so the oxide films
are able to melt easier. In the combustion reaction of water
and hydro-reactive particles, Foote et al. (1996) reported that
uniform mixing performance of water and the hydro-reactive
particles causes a decrease of the ignition temperature and
increase of the flame propagation speed, which indicate an
increase in the specific impulse. Therefore, in order to design
shear coaxial injectors that are able to uniformly spray water
and particles, basic experiments on spray characteristics
of the solid particles with the fluidization medium are
required.
Investigations about particle injection have been actively
carried out to develop coal combustors, which are part of the
integrated gasification combined cycle plants since 1980.
Modarress et al. (1984) investigated the effect of particle size, jet
exit velocity, and loading ratio for an axisymmetric turbulent
jet by measuring mean velocities, turbulent intensity, and
shear stress. With increase of a particle loading ratio, a linear
increase of jet center velocity at x/D = 20, a reduction of
particle spreading angle, and a decrease of turbulent intensity
are observed. Fleckhaus et al. (1987) examined the effect of
the particle primary diameter on a particle-laden jet. They
also fitted their experimental results with a set of analytical
functions for improving the basic understanding of two
phase flow phenomena. They concluded that the decrease
of the particle primary diameter causes a reduction of the
air velocity decay rate and the particle spreading angle, due
to a decrease in the turbulent intensity. Gillandt et al. (2001)
investigated the effects of influence turbulence modulation
by analyzing the one-dimensional energy spectra of the axial
velocity fluctuations for single and two phase jet flows. The
addition of the particles to the jet causes turbulence intensity
decrease because turbulence energy in the jet is dissipated by
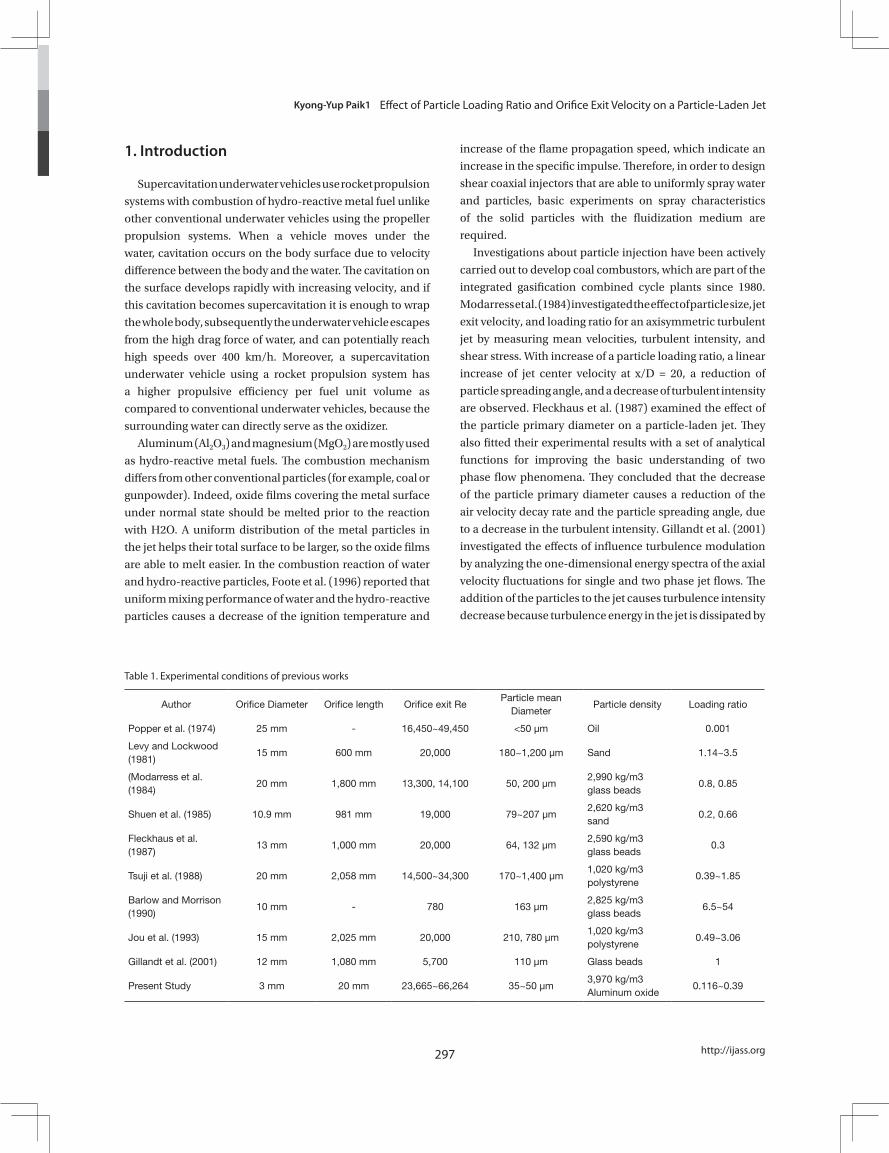
Table 1. Experimental conditions of previous works
Author Orifice Diameter Orifice length Orifice exit ReParticle mean
DiameterParticle density Loading ratio
Popper et al. (1974) 25 mm - 16,450~49,450 <50 μm Oil 0.001
Levy and Lockwood (1981)
15 mm 600 mm 20,000 180~1,200 μm Sand 1.14~3.5
(Modarress et al. (1984)
20 mm 1,800 mm 13,300, 14,100 50, 200 μm2,990 kg/m3glass beads
0.8, 0.85
Shuen et al. (1985) 10.9 mm 981 mm 19,000 79~207 μm2,620 kg/m3sand
0.2, 0.66
Fleckhaus et al. (1987)
13 mm 1,000 mm 20,000 64, 132 μm2,590 kg/m3glass beads
0.3
Tsuji et al. (1988) 20 mm 2,058 mm 14,500~34,300 170~1,400 μm1,020 kg/m3polystyrene
0.39~1.85
Barlow and Morrison (1990)
10 mm - 780 163 μm2,825 kg/m3glass beads
6.5~54
Jou et al. (1993) 15 mm 2,025 mm 20,000 210, 780 μm1,020 kg/m3polystyrene
0.49~3.06
Gillandt et al. (2001) 12 mm 1,080 mm 5,700 110 μm Glass beads 1
Present Study 3 mm 20 mm 23,665~66,264 35~50 μm3,970 kg/m3Aluminum oxide
0.116~0.39
DOI:10.5139/IJASS.2011.12.3.296 298
Int’l J. of Aeronautical & Space Sci. 12(3), 296–304 (2011)
friction with the particle surface (Gillandt et al., 2001). Thus,
it was found that the turbulent intensity is decreased with
increasing total particle surface in the jet. Decreasing the
turbulent intensity is related to diminishing the momentum
exchange between the jet and the surrounding gas. As such,
the decrease of the turbulent intensity causes the change in
the jet velocity profile. The centerline velocity decay of the
two phase jet is slower than that of a single phase jet, and
the radial velocity profile of the two phase jet is steeper than
that of the single phase jet (Laats, 1969). Additionally, the slip
velocity is lessened by lowering decay rate of the gas phase
due to diminishing the momentum exchange (Modarress et
al., 1984).
Experiment conditions of previous works are listed in
Table 1. As shown in Table 1, all previous research adopted
long orifice lengths from 600 mm to 2,025 mm, and large
orifice diameters from 10 mm to 25 mm. Due to the
limitation of space in the underwater vehicle, the orifice
length and diameter should be downsized as compared
with other investigations. In this study, with particle image
velocimetry (PIV) measurement, the profiles of particles
velocity, turbulent intensity, and number density of particles
are investigated to know the effect of the loading ratio on the
particle developing region and the particle spreading angle
of the two phase jet using the plain orifice type injector.
2. Experimental Arrangement
The experiment setup is shown in Fig. 1. Air is used as
the carrier gas, and the air flow rate is measured by a mass
flow meter (M-1500SLPM-D; Alicat Scientific, Tucson,
AZ, USA), and manually controlled with a gas regulator.
A pressure sensor (PTAF0020KAA; Sensys, Ansan, Korea)
is used for a secondary measurement to check the air flow
rate. Particles of primary size 35~50 µm are supplied to the
pipeline via a particle feeder using an automated feeding
screw. To determine the orifice exit velocity, tracer particles
with a primary size of 0.5~2 µm are respectively provided
in the pipeline by a tracer feeder. A damping chamber is
installed on the experimental rig to eliminate the pulsation
of the particle flow rate. The injector shown in Fig. 2 is placed
on a vertical traverse to enable vertical adjustment. The
experimental rig is sealed with transparent polycarbonate
covers with the ceiling open, and the rig size designed in
order to avoid the boundary effect of 1,000 × 1,000 × 1,500.
A PIV measurement is used to measure the air and particles
velocities, respectively.
The laser system used in the experiment is a dual head
PIV Nd-YAG laser (Surelite II-PIV). A pulsed laser sheet
beam with a 10 Hz pulse frequency, made by a digital pulse
generator (DG535; Stanford Research Systems, Sunnyvale,
CA, USA) and optical lenses, passed vertically through the
jet center, and particle scattering images are captured by a
charge-coupled device (CCD) camera (MegaPlus ES2020;
Princeton Instruments, Trenton, NJ, USA) with a 1,200 ×
1,600 size. In each case, 300 pairs of CCD images are acquired
to obtain averaged velocity vector fields. For the CCD image
processing, in-house PIV code is used (Hart, 1998).
Figure 3 shows an automated particle feeder designed to
supply constant particle mass flow rates. A cone structure
inside of the particle feeder is sealed with a polycarbonate
cover and pressurized to the same pressure using a tube
where the air passes through to prevent a backward flow of
particles. A screw, which is put inside the particle feeder, is
rotated by an AC variable speed motor attached to an end of
the screw. When the screw spins, particles loaded between
the screw`s pitch are transported to an air line. The particles
fluidized by the air are then sprayed through the injector
orifice. In order to get particle flow rates for each feeding
Fig. 1. Experimental apparatus.

299
Kyong-Yup Paik1 Effect of Particle Loading Ratio and Orifice Exit Velocity on a Particle-Laden Jet
http://ijass.org
condition, particles sprayed through the orifice are collected
into a flask filled with sticky syrup for a certain period of time,
and then mass changes are measured by a load cell. Figure
4 shows averaged particle flow rates. In Fig. 4, the “Direct”
condition means the particle supply rates of the particles
coming out from the particle feeder exit are collected on the
load cell and measured directly. Motor rpm levels, which
represent gradations on the motor control panel, are arbitrary
experimental conditions to get the constant particle flow
rates. Direct points grow linearly with increasing motor rpm
levels in Fig. 4. As such, it can be seen that the rotational speed
of the screw increases linearly with increasing the motor rpm
level step by step. Comparing “Direct” with other particle
mass flow rates measured from the orifice exit, all feeding
conditions are well supplied without any accumulation in
the line except for the condition of air flow rate 1.184 g/s and
the highest rpm condition. In the condition of air flow rate
1.184 g/s, the air velocity is not enough to carry the particles,
so particles are believed to deposit in the damping chamber.
The particle mass loading ratio is the ratio of particle mass
flow rate to the gas mass flow rate. The mass loading ratios
obtained from the experimental conditions are shown in
Table 2. More information about the experiment is listed in
Table 3.
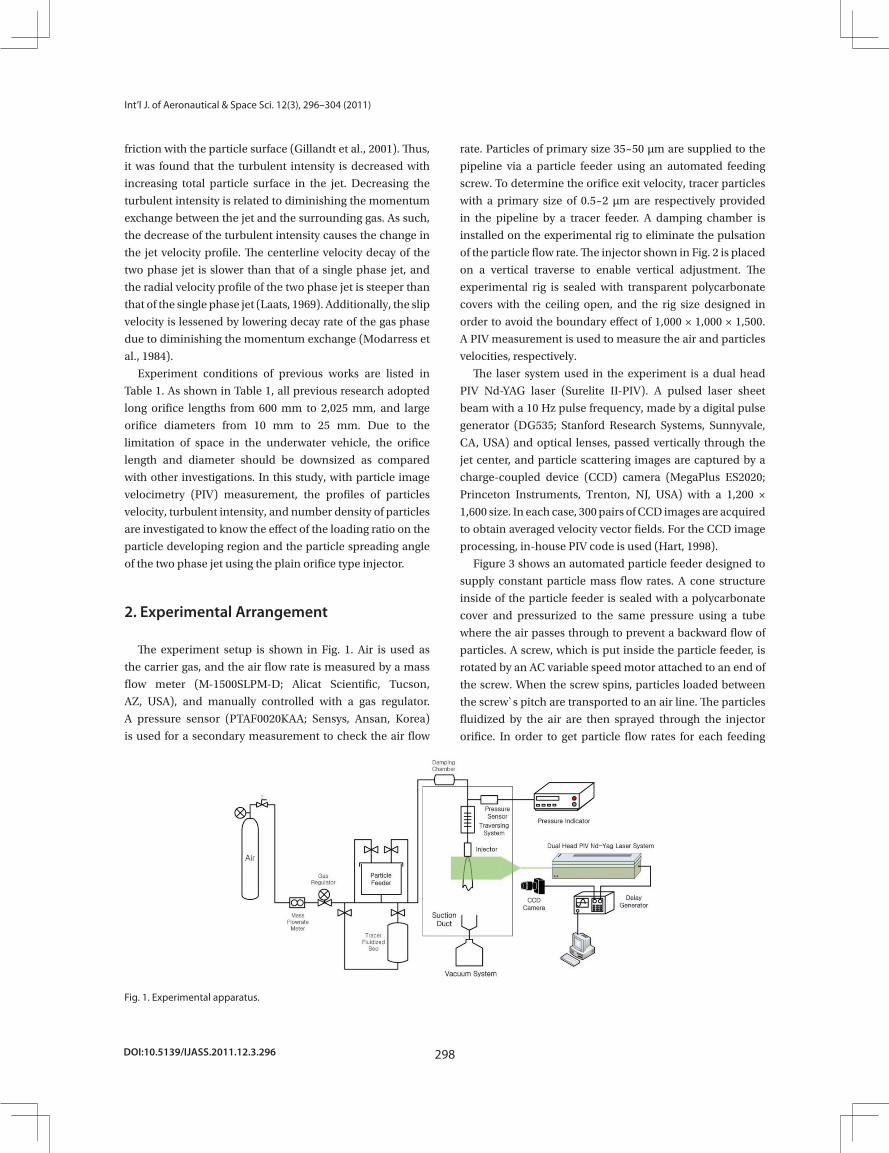
3. Results and Discussion
In this experiment, the particle-laden jet shows the
particle developing region, which is defined as a zone from
the orifice exit to the point where particle velocity reaches
maximum, as shown in Fig. 5. If the orifice length is short, the
particles accelerated by drag force from the orifice entrance
are not able to reach the air exit velocity due to their inertia,
and so the particle developing region appears. After the
particle developing region, the particle velocity dwindles,
and the turbulent intensity increases. It is considered that
Fig. 2. Plain orifice type injector.
Fig. 3. Automated particle feeder.
Table 2. Loading ratios
Rpm levels
Air flow rate (g/s)
1 2 3 4
1.184 0.116 0.139 0.195 0.227 1.579 0.216 0.287 0.340 0.386 1.973 0.178 0.227 0.248 0.275 2.368 0.138 0.179 0.232 0.280
Fig. 2. Plain orifice type injector.
Fig. 4. Particle feeding rate test (data points represents an average of 10 runs; direct: particle collected at the feeder exit, other symbols: particle collected at the orifice exit).
Table 3. Experimental conditions
Air flow rate (g/s) 1.184, 1.579, 1.973, 2.368
Air temperature (℃) 18.5 Particle feeding rate (g/s) 0.137~0.664 Orifice diameter (mm) 3.0 Orifice length (mm) 20 Nd-YAG Laser pulse freq. (Hz) 10 Beam delay (μs) 4
Particle and Tracer density (g/cm3) Al
2O
3, 3.97
Particle primary diameter (µm) 35~50 Tracer primary diameter (µm) 0.5~2
3. Results and Discussion
In this experiment, the particle-laden jet shows the particle developing region, which is defined as a zone from the orifice exit to the point where particle velocity reaches maximum, as shown in Fig. 5. If the orifice length is short, the particles accelerated by drag force from the orifice entrance are not able to reach the air exit velocity due to their inertia, and so the particle developing region appears. After the particle developing region, the particle velocity dwindles, and the turbulent intensity increases. It is considered that the particles exchange momentum with surrounding gas entrained in the jet center after the particle developing region. From the orifice exit, the longer the particle developing region, the farther a spot where particles actively diffuse. Thus, it is believed that the length of the particle developing region contains information of the particle diffusivity along the axial direction.
Fig. 4. Particle feeding rate test (data points represents an average of 10 runs; direct: particle collected at the feeder exit, other sym-bols: particle collected at the orifice exit).
Fig. 2. Plain orifice type injector.
Fig. 3. Automated particle feeder.
Table 2. Loading ratios
Rpm levels
Air flow rate (g/s)
1 2 3 4
1.184 0.116 0.139 0.195 0.227 1.579 0.216 0.287 0.340 0.386 1.973 0.178 0.227 0.248 0.275 2.368 0.138 0.179 0.232 0.280
Fig. 3. Automated particle feeder.
Table 2. Loading ratios
Rpm levelsAir flow rate (g/s)
1 2 3 4
1.184 0.116 0.139 0.195 0.227
1.579 0.216 0.287 0.340 0.386
1.973 0.178 0.227 0.248 0.275
2.368 0.138 0.179 0.232 0.280
Table 3. Experimental conditions
Air flow rate (g/s)1.184, 1.579,1.973, 2.368
Air temperature (℃) 18.5
Particle feeding rate (g/s) 0.137~0.664
Orifice diameter (mm) 3.0
Orifice length (mm) 20
Nd-YAG Laser pulse freq. (Hz) 10
Beam delay (μs) 4
Particle and Tracer density (g/cm3) Al2O3, 3.97
Particle primary diameter (µm) 35~50
Tracer primary diameter (µm) 0.5~2
DOI:10.5139/IJASS.2011.12.3.296 300
Int’l J. of Aeronautical & Space Sci. 12(3), 296–304 (2011)
the particles exchange momentum with surrounding gas
entrained in the jet center after the particle developing region.
From the orifice exit, the longer the particle developing
region, the farther a spot where particles actively diffuse.
Thus, it is believed that the length of the particle developing
region contains information of the particle diffusivity along
the axial direction.
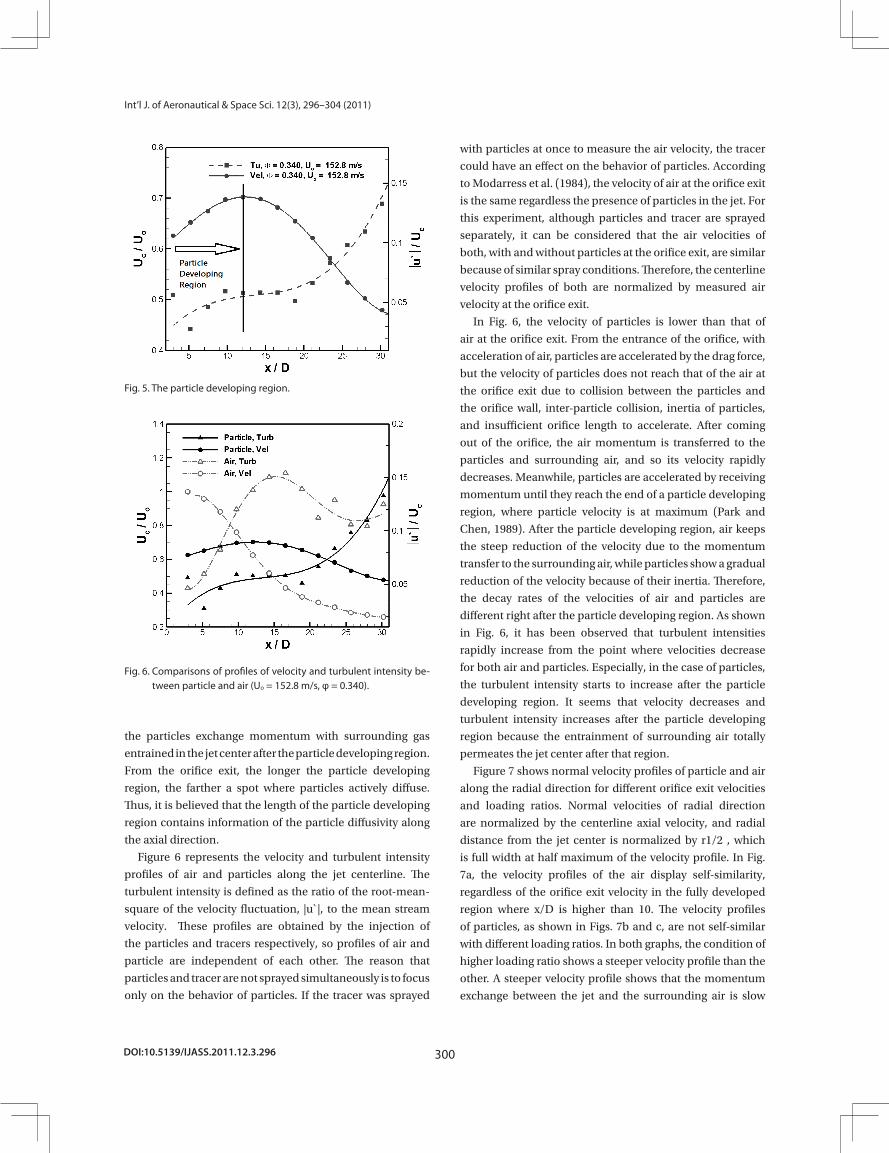
Figure 6 represents the velocity and turbulent intensity
profiles of air and particles along the jet centerline. The
turbulent intensity is defined as the ratio of the root-mean-
square of the velocity fluctuation, |u`|, to the mean stream
velocity. These profiles are obtained by the injection of
the particles and tracers respectively, so profiles of air and
particle are independent of each other. The reason that
particles and tracer are not sprayed simultaneously is to focus
only on the behavior of particles. If the tracer was sprayed
with particles at once to measure the air velocity, the tracer
could have an effect on the behavior of particles. According
to Modarress et al. (1984), the velocity of air at the orifice exit
is the same regardless the presence of particles in the jet. For
this experiment, although particles and tracer are sprayed
separately, it can be considered that the air velocities of
both, with and without particles at the orifice exit, are similar
because of similar spray conditions. Therefore, the centerline
velocity profiles of both are normalized by measured air
velocity at the orifice exit.
In Fig. 6, the velocity of particles is lower than that of
air at the orifice exit. From the entrance of the orifice, with
acceleration of air, particles are accelerated by the drag force,
but the velocity of particles does not reach that of the air at
the orifice exit due to collision between the particles and
the orifice wall, inter-particle collision, inertia of particles,
and insufficient orifice length to accelerate. After coming
out of the orifice, the air momentum is transferred to the
particles and surrounding air, and so its velocity rapidly
decreases. Meanwhile, particles are accelerated by receiving
momentum until they reach the end of a particle developing
region, where particle velocity is at maximum (Park and
Chen, 1989). After the particle developing region, air keeps
the steep reduction of the velocity due to the momentum
transfer to the surrounding air, while particles show a gradual
reduction of the velocity because of their inertia. Therefore,
the decay rates of the velocities of air and particles are
different right after the particle developing region. As shown
in Fig. 6, it has been observed that turbulent intensities
rapidly increase from the point where velocities decrease
for both air and particles. Especially, in the case of particles,
the turbulent intensity starts to increase after the particle
developing region. It seems that velocity decreases and
turbulent intensity increases after the particle developing
region because the entrainment of surrounding air totally
permeates the jet center after that region.
Figure 7 shows normal velocity profiles of particle and air
along the radial direction for different orifice exit velocities
and loading ratios. Normal velocities of radial direction
are normalized by the centerline axial velocity, and radial
distance from the jet center is normalized by r1/2 , which
is full width at half maximum of the velocity profile. In Fig.
7a, the velocity profiles of the air display self-similarity,
regardless of the orifice exit velocity in the fully developed
region where x/D is higher than 10. The velocity profiles
of particles, as shown in Figs. 7b and c, are not self-similar
with different loading ratios. In both graphs, the condition of
higher loading ratio shows a steeper velocity profile than the
other. A steeper velocity profile shows that the momentum
exchange between the jet and the surrounding air is slow
Fig. 5. The particle developing region.
Fig. 6. Comparisons of profiles of velocity and turbulent intensity between particle and air (Uo = 152.8 m/s, φ = 0.340).
Figure 6 represents the velocity and turbulent intensity profiles of air and particles along the jet centerline. The turbulent intensity is defined as the ratio of the root-mean-square of the velocity fluctuation, |u`|, to the mean stream velocity. These profiles are obtained by the injection of the particles and tracers respectively, so profiles of air and particle are independent of each other. The reason that particles and tracer are not sprayed simultaneously is to focus only on the behavior of particles. If the tracer was sprayed with particles at once to measure the air velocity, the tracer could have an effect on the behavior of particles. According to Modarress et al. (1984), the velocity of air at the orifice exit is the same regardless the presence of particles in the jet. For this experiment, although particles and tracer are sprayed separately, it can be considered that the air velocities of both, with and without particles at the orifice exit, are similar because of similar spray conditions. Therefore, the centerline velocity profiles of both are normalized by measured air velocity at the orifice exit.
In Fig. 6, the velocity of particles is lower than that of air at the orifice exit. From the entrance of the orifice, with acceleration of air, particles are accelerated by the drag force, but the velocity of particles does not reach that of the air at the orifice exit due to collision between the particles and the orifice
Fig. 5. The particle developing region.
Fig. 5. The particle developing region.
Fig. 6. Comparisons of profiles of velocity and turbulent intensity between particle and air (Uo = 152.8 m/s, φ = 0.340).
Figure 6 represents the velocity and turbulent intensity profiles of air and particles along the jet centerline. The turbulent intensity is defined as the ratio of the root-mean-square of the velocity fluctuation, |u`|, to the mean stream velocity. These profiles are obtained by the injection of the particles and tracers respectively, so profiles of air and particle are independent of each other. The reason that particles and tracer are not sprayed simultaneously is to focus only on the behavior of particles. If the tracer was sprayed with particles at once to measure the air velocity, the tracer could have an effect on the behavior of particles. According to Modarress et al. (1984), the velocity of air at the orifice exit is the same regardless the presence of particles in the jet. For this experiment, although particles and tracer are sprayed separately, it can be considered that the air velocities of both, with and without particles at the orifice exit, are similar because of similar spray conditions. Therefore, the centerline velocity profiles of both are normalized by measured air velocity at the orifice exit.
In Fig. 6, the velocity of particles is lower than that of air at the orifice exit. From the entrance of the orifice, with acceleration of air, particles are accelerated by the drag force, but the velocity of particles does not reach that of the air at the orifice exit due to collision between the particles and the orifice
Fig. 6. Comparisons of profiles of velocity and turbulent intensity be-tween particle and air (Uo = 152.8 m/s, φ = 0.340).

301
Kyong-Yup Paik1 Effect of Particle Loading Ratio and Orifice Exit Velocity on a Particle-Laden Jet
http://ijass.org
compared to the less steep one. If the jet contains more
particles, large eddies, which are produced by entrained
air, easily break up into small eddies (Gillandt et al., 2001).
This phenomenon causes that the momentum exchange
to become small, and therefore the velocity profile of the
particles becomes steep.
Figure 8a shows the changes in the profiles of velocity
and turbulent intensity with different loading ratios in the
same orifice exit velocity. According to Biing-Hwang Jou
et al. (1993), the particle’s axial mean velocity is almost
independent of the particle loading ratio. However, in this
experiment, it has been found that the decay rate of the axial
velocity becomes slow as the loading ratio increases. This is
wall, inter-particle collision, inertia of particles, and insufficient orifice length to accelerate. After coming out of the orifice, the air momentum is transferred to the particles and surrounding air, and so its velocity rapidly decreases. Meanwhile, particles are accelerated by receiving momentum until they reach the end of a particle developing region, where particle velocity is at maximum (Park and Chen, 1989). After the particle developing region, air keeps the steep reduction of the velocity due to the momentum transfer to the surrounding air, while particles show a gradual reduction of the velocity because of their inertia. Therefore, the decay rates of the velocities of air and particles are different right after the particle developing region. As shown in Fig. 6, it has been observed that turbulent intensities rapidly increase from the point where velocities decrease for both air and particles. Especially, in the case of particles, the turbulent intensity starts to increase after the particle developing region. It seems that velocity decreases and turbulent intensity increases after the particle developing region because the entrainment of surrounding air totally permeates the jet center after that region.
(a)
(b)
(a)
wall, inter-particle collision, inertia of particles, and insufficient orifice length to accelerate. After coming out of the orifice, the air momentum is transferred to the particles and surrounding air, and so its velocity rapidly decreases. Meanwhile, particles are accelerated by receiving momentum until they reach the end of a particle developing region, where particle velocity is at maximum (Park and Chen, 1989). After the particle developing region, air keeps the steep reduction of the velocity due to the momentum transfer to the surrounding air, while particles show a gradual reduction of the velocity because of their inertia. Therefore, the decay rates of the velocities of air and particles are different right after the particle developing region. As shown in Fig. 6, it has been observed that turbulent intensities rapidly increase from the point where velocities decrease for both air and particles. Especially, in the case of particles, the turbulent intensity starts to increase after the particle developing region. It seems that velocity decreases and turbulent intensity increases after the particle developing region because the entrainment of surrounding air totally permeates the jet center after that region.
(a)
(b) (b)
(c)
Fig. 7. Axial velocity profiles of particle and air along the radial direction. (a) Air. (b) Particles Uo = 114.6 m/s. (c) Particles Uo = 188.7 m/s.
Figure 7 shows normal velocity profiles of particle and air along the radial direction for different orifice exit velocities and loading ratios. Normal velocities of radial direction are normalized by the centerline axial velocity, and radial distance from the jet center is normalized by r1/2 , which is full width at half maximum of the velocity profile. In Fig. 7a, the velocity profiles of the air display self-similarity, regardless of the orifice exit velocity in the fully developed region where x/D is higher than 10. The velocity profiles of particles, as shown in Figs. 7b and c, are not self-similar with different loading ratios. In both graphs, the condition of higher loading ratio shows a steeper velocity profile than the other. A steeper velocity profile shows that the momentum exchange between the jet and the surrounding air is slow compared to the less steep one. If the jet contains more particles, large eddies, which are produced by entrained air, easily break up into small eddies (Gillandt et al., 2001). This phenomenon causes that the momentum exchange to become small, and therefore the velocity profile of the particles becomes steep.
(a)
(c)
Fig. 7. Axial velocity profiles of particle and air along the radial direc-tion. (a) Air. (b) Particles Uo = 114.6 m/s. (c) Particles Uo = 188.7 m/s.
(c)
Fig. 7. Axial velocity profiles of particle and air along the radial direction. (a) Air. (b) Particles Uo = 114.6 m/s. (c) Particles Uo = 188.7 m/s.
Figure 7 shows normal velocity profiles of particle and air along the radial direction for different orifice exit velocities and loading ratios. Normal velocities of radial direction are normalized by the centerline axial velocity, and radial distance from the jet center is normalized by r1/2 , which is full width at half maximum of the velocity profile. In Fig. 7a, the velocity profiles of the air display self-similarity, regardless of the orifice exit velocity in the fully developed region where x/D is higher than 10. The velocity profiles of particles, as shown in Figs. 7b and c, are not self-similar with different loading ratios. In both graphs, the condition of higher loading ratio shows a steeper velocity profile than the other. A steeper velocity profile shows that the momentum exchange between the jet and the surrounding air is slow compared to the less steep one. If the jet contains more particles, large eddies, which are produced by entrained air, easily break up into small eddies (Gillandt et al., 2001). This phenomenon causes that the momentum exchange to become small, and therefore the velocity profile of the particles becomes steep.
(a) (a)
(b)
Fig. 8. The effect of the loading ratio on the two phase jet. (a) Axial profiles of velocity and turbulent intensity. (b) Radial profiles of the particle number density.
Figure 8a shows the changes in the profiles of velocity and turbulent intensity with different loading ratios in the same orifice exit velocity. According to Biing-Hwang Jou et al. (1993), the particle’s axial mean velocity is almost independent of the particle loading ratio. However, in this experiment, it has been found that the decay rate of the axial velocity becomes slow as the loading ratio increases. This is also related to the eddy break up. Due to the increase of the particle loading ratio, large eddies are readily split into small eddies, thus the turbulent intensity which is strongly related to the eddy size, is damped, as shown in Fig. 8a. Damping of the turbulent intensity makes it difficult to exchange the momentum between particles and surrounding air, therefore the slowing down of the velocity decay rate can be explained. Radial profiles of the particle number density with different loading ratios are shown in Fig. 8b. Comparing profiles of x/D = 30, the condition of higher loading ratio has a slightly steeper distribution. From this result, it can be concluded that the increase of the loading ratio makes the distribution of particles narrow, owing to the decrease of the momentum exchange.
(a)
(b)
Fig. 8. The effect of the loading ratio on the two phase jet. (a) Axial profiles of velocity and turbulent intensity. (b) Radial profiles of the particle number density.

DOI:10.5139/IJASS.2011.12.3.296 302
Int’l J. of Aeronautical & Space Sci. 12(3), 296–304 (2011)
also related to the eddy break up. Due to the increase of the
particle loading ratio, large eddies are readily split into small
eddies, thus the turbulent intensity which is strongly related
to the eddy size, is damped, as shown in Fig. 8a. Damping
of the turbulent intensity makes it difficult to exchange the
momentum between particles and surrounding air, therefore
the slowing down of the velocity decay rate can be explained.
Radial profiles of the particle number density with different
loading ratios are shown in Fig. 8b. Comparing profiles of
x/D = 30, the condition of higher loading ratio has a slightly
steeper distribution. From this result, it can be concluded
that the increase of the loading ratio makes the distribution
of particles narrow, owing to the decrease of the momentum
exchange.
Turbulent intensity is proportional to jet velocity at
the orifice exit, because if the velocity gap between the jet
and the surrounding air becomes larger as the orifice exit
velocity increases, bigger eddies are generated in the jet.
Figure 9a shows the effect of the jet velocity at the orifice exit
on particles. In this figure, although the turbulent intensity
increases, the velocity profile of the centerline declines
slowly, contrary to the effect of the loading ratio. This is
because the jet for which exit velocity is 167.6 m/s has much
more momentum than the other jet. It seems that the effect
of the velocity is greater than that of the turbulent intensity
on the velocity profiles. The effect of the turbulent intensity is
(b)
Fig. 8. The effect of the loading ratio on the two phase jet. (a) Axial profiles of velocity and turbulent intensity. (b) Radial profiles of the particle number density.
Figure 8a shows the changes in the profiles of velocity and turbulent intensity with different loading ratios in the same orifice exit velocity. According to Biing-Hwang Jou et al. (1993), the particle’s axial mean velocity is almost independent of the particle loading ratio. However, in this experiment, it has been found that the decay rate of the axial velocity becomes slow as the loading ratio increases. This is also related to the eddy break up. Due to the increase of the particle loading ratio, large eddies are readily split into small eddies, thus the turbulent intensity which is strongly related to the eddy size, is damped, as shown in Fig. 8a. Damping of the turbulent intensity makes it difficult to exchange the momentum between particles and surrounding air, therefore the slowing down of the velocity decay rate can be explained. Radial profiles of the particle number density with different loading ratios are shown in Fig. 8b. Comparing profiles of x/D = 30, the condition of higher loading ratio has a slightly steeper distribution. From this result, it can be concluded that the increase of the loading ratio makes the distribution of particles narrow, owing to the decrease of the momentum exchange.
(a) (a)
(b)
Fig. 9. The effect of orifice exit velocity on the two phase jet in Φ = 0.227. (a) Axial profiles of velocity and turbulent intensity. (b) Radial profiles of the particle number density.
Turbulent intensity is proportional to jet velocity at the orifice exit, because if the velocity gap between the jet and the surrounding air becomes larger as the orifice exit velocity increases, bigger eddies are generated in the jet. Figure 9a shows the effect of the jet velocity at the orifice exit on particles. In this figure, although the turbulent intensity increases, the velocity profile of the centerline declines slowly, contrary to the effect of the loading ratio. This is because the jet for which exit velocity is 167.6 m/s has much more momentum than the other jet. It seems that the effect of the velocity is greater than that of the turbulent intensity on the velocity profiles. The effect of the turbulent intensity is revealed better in the profiles of the particle number density. In Fig. 9b, the spray condition of exit velocity 167.6 m/s shows a much wider particle distribution than the spray condition of exit velocity 114.6 m/s at x/D = 30. The increase of the orifice exit velocity produces bigger eddies, and so particles are widely distributed due to the increase of the momentum transferring.
(a)
(b)
Fig. 9. The effect of orifice exit velocity on the two phase jet in Φ = 0.227. (a) Axial profiles of velocity and turbulent intensity. (b) Radial profiles of the particle number density.
(b)
Fig. 9. The effect of orifice exit velocity on the two phase jet in Φ = 0.227. (a) Axial profiles of velocity and turbulent intensity. (b) Radial profiles of the particle number density.
Turbulent intensity is proportional to jet velocity at the orifice exit, because if the velocity gap between the jet and the surrounding air becomes larger as the orifice exit velocity increases, bigger eddies are generated in the jet. Figure 9a shows the effect of the jet velocity at the orifice exit on particles. In this figure, although the turbulent intensity increases, the velocity profile of the centerline declines slowly, contrary to the effect of the loading ratio. This is because the jet for which exit velocity is 167.6 m/s has much more momentum than the other jet. It seems that the effect of the velocity is greater than that of the turbulent intensity on the velocity profiles. The effect of the turbulent intensity is revealed better in the profiles of the particle number density. In Fig. 9b, the spray condition of exit velocity 167.6 m/s shows a much wider particle distribution than the spray condition of exit velocity 114.6 m/s at x/D = 30. The increase of the orifice exit velocity produces bigger eddies, and so particles are widely distributed due to the increase of the momentum transferring.
(a) (a)
(b)
Fig. 10. Spreading angles. (a) A comparison of different exit velocity conditions. (b) Considering all conditions.
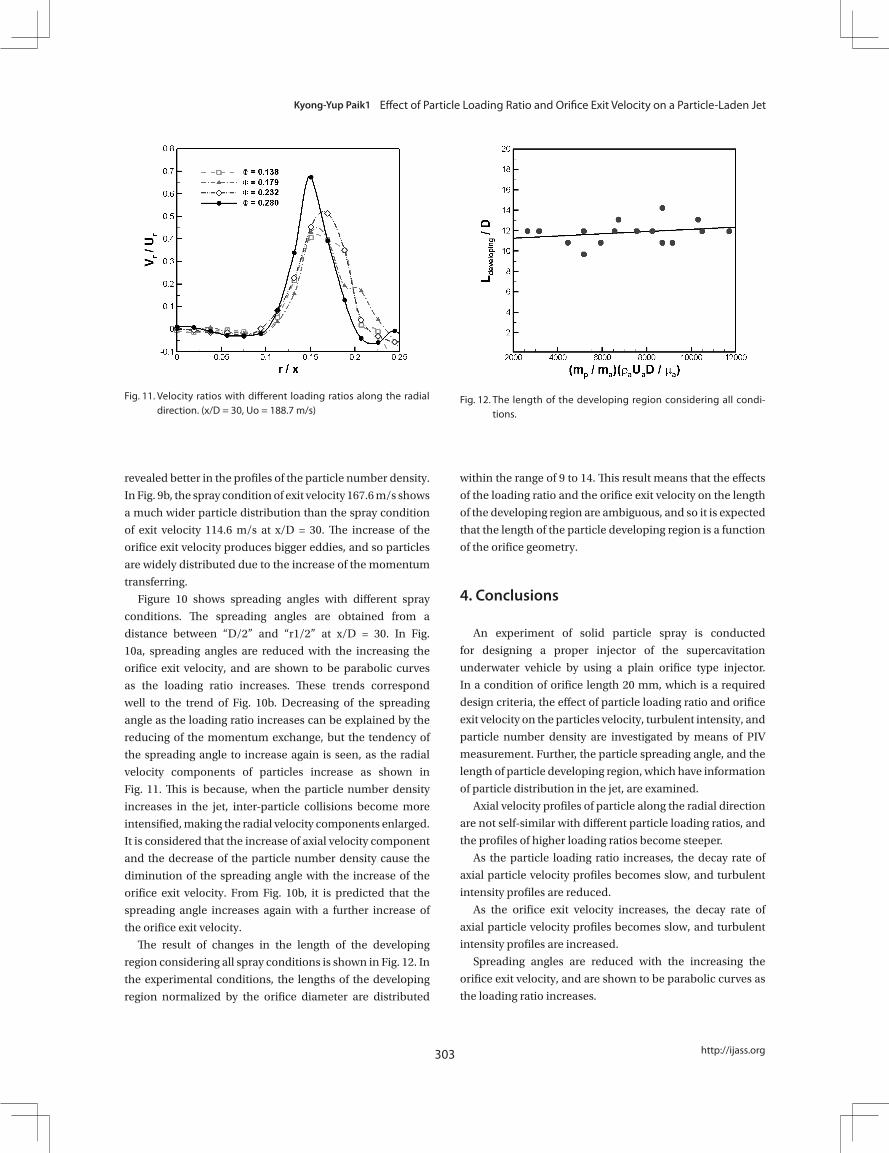
Fig. 11. Velocity ratios with different loading ratios along the radial direction. (x/D = 30, Uo = 188.7 m/s)
Figure 10 shows spreading angles with different spray conditions. The spreading angles are obtained from a distance between “D/2” and “r1/2” at x/D = 30. In Fig. 10a, spreading angles are reduced with the increasing the orifice exit velocity, and are shown to be parabolic curves as the loading ratio increases. These trends correspond well to the trend of Fig. 10b. Decreasing of the spreading angle as the loading ratio increases can be explained by the reducing of the momentum exchange, but the tendency of the spreading angle to increase again is seen, as the radial velocity components of particles increase as shown in Fig. 11. This is because, when the particle number density increases in the jet, inter-particle collisions become more intensified, making the radial velocity components enlarged. It is considered that the increase of axial velocity component and the decrease of the particle number density cause the diminution of the spreading angle with the increase of the orifice exit velocity. From Fig. 10b, it is predicted that the spreading angle increases again with a further increase of the orifice exit velocity.
(b)
Fig. 10. Spreading angles. (a) A comparison of different exit velocity conditions. (b) Considering all conditions.
303
Kyong-Yup Paik1 Effect of Particle Loading Ratio and Orifice Exit Velocity on a Particle-Laden Jet
http://ijass.org
revealed better in the profiles of the particle number density.
In Fig. 9b, the spray condition of exit velocity 167.6 m/s shows
a much wider particle distribution than the spray condition
of exit velocity 114.6 m/s at x/D = 30. The increase of the
orifice exit velocity produces bigger eddies, and so particles
are widely distributed due to the increase of the momentum
transferring.
Figure 10 shows spreading angles with different spray
conditions. The spreading angles are obtained from a
distance between “D/2” and “r1/2” at x/D = 30. In Fig.
10a, spreading angles are reduced with the increasing the
orifice exit velocity, and are shown to be parabolic curves
as the loading ratio increases. These trends correspond
well to the trend of Fig. 10b. Decreasing of the spreading
angle as the loading ratio increases can be explained by the
reducing of the momentum exchange, but the tendency of
the spreading angle to increase again is seen, as the radial
velocity components of particles increase as shown in
Fig. 11. This is because, when the particle number density
increases in the jet, inter-particle collisions become more
intensified, making the radial velocity components enlarged.
It is considered that the increase of axial velocity component
and the decrease of the particle number density cause the
diminution of the spreading angle with the increase of the
orifice exit velocity. From Fig. 10b, it is predicted that the
spreading angle increases again with a further increase of
the orifice exit velocity.
The result of changes in the length of the developing
region considering all spray conditions is shown in Fig. 12. In
the experimental conditions, the lengths of the developing
region normalized by the orifice diameter are distributed
within the range of 9 to 14. This result means that the effects
of the loading ratio and the orifice exit velocity on the length
of the developing region are ambiguous, and so it is expected
that the length of the particle developing region is a function
of the orifice geometry.
4. Conclusions
An experiment of solid particle spray is conducted
for designing a proper injector of the supercavitation
underwater vehicle by using a plain orifice type injector.
In a condition of orifice length 20 mm, which is a required
design criteria, the effect of particle loading ratio and orifice
exit velocity on the particles velocity, turbulent intensity, and
particle number density are investigated by means of PIV
measurement. Further, the particle spreading angle, and the
length of particle developing region, which have information
of particle distribution in the jet, are examined.
Axial velocity profiles of particle along the radial direction
are not self-similar with different particle loading ratios, and
the profiles of higher loading ratios become steeper.
As the particle loading ratio increases, the decay rate of
axial particle velocity profiles becomes slow, and turbulent
intensity profiles are reduced.
As the orifice exit velocity increases, the decay rate of
axial particle velocity profiles becomes slow, and turbulent
intensity profiles are increased.
Spreading angles are reduced with the increasing the
orifice exit velocity, and are shown to be parabolic curves as
the loading ratio increases.
(b)
Fig. 10. Spreading angles. (a) A comparison of different exit velocity conditions. (b) Considering all conditions.
Fig. 11. Velocity ratios with different loading ratios along the radial direction. (x/D = 30, Uo = 188.7 m/s)
Figure 10 shows spreading angles with different spray conditions. The spreading angles are obtained from a distance between “D/2” and “r1/2” at x/D = 30. In Fig. 10a, spreading angles are reduced with the increasing the orifice exit velocity, and are shown to be parabolic curves as the loading ratio increases. These trends correspond well to the trend of Fig. 10b. Decreasing of the spreading angle as the loading ratio increases can be explained by the reducing of the momentum exchange, but the tendency of the spreading angle to increase again is seen, as the radial velocity components of particles increase as shown in Fig. 11. This is because, when the particle number density increases in the jet, inter-particle collisions become more intensified, making the radial velocity components enlarged. It is considered that the increase of axial velocity component and the decrease of the particle number density cause the diminution of the spreading angle with the increase of the orifice exit velocity. From Fig. 10b, it is predicted that the spreading angle increases again with a further increase of the orifice exit velocity.
Fig. 11. Velocity ratios with different loading ratios along the radial direction. (x/D = 30, Uo = 188.7 m/s)
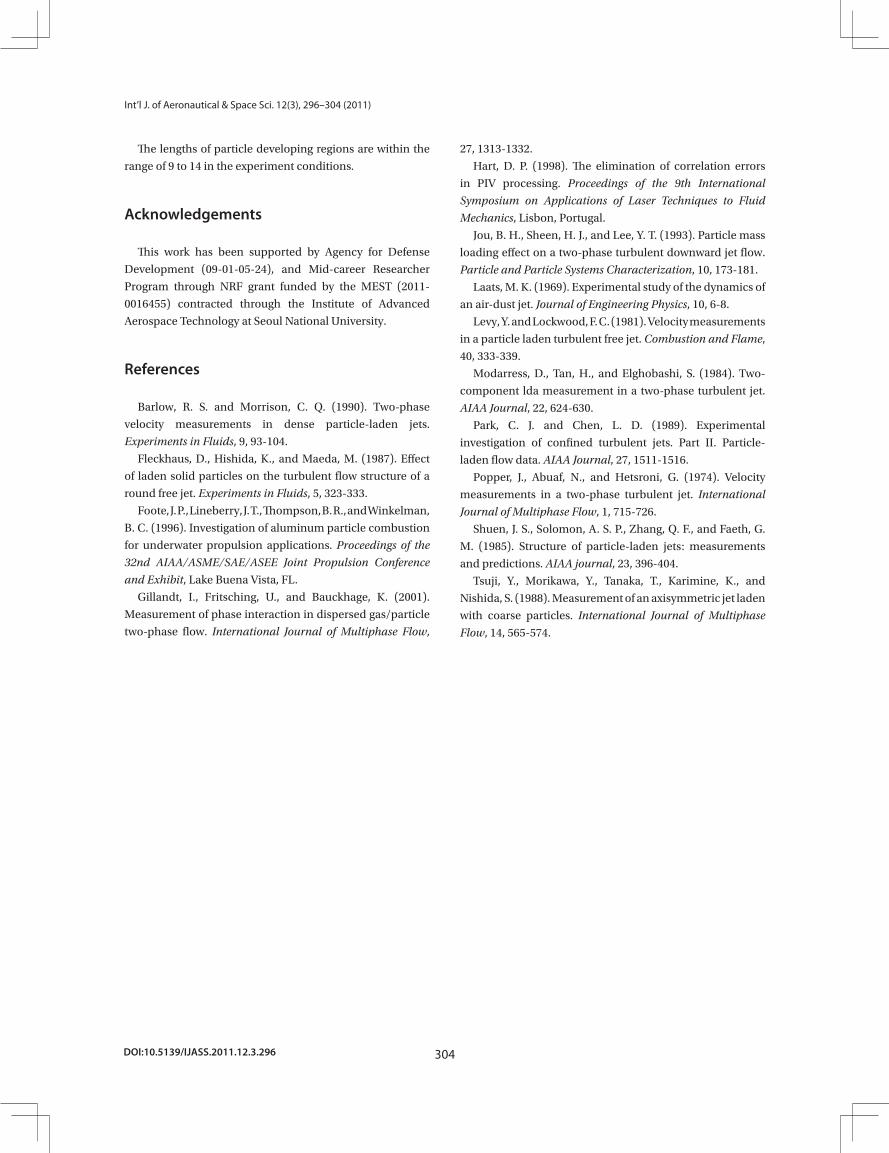
Fig. 12. The length of the developing region considering all conditions.
The result of changes in the length of the developing region considering all spray conditions is shown in Fig. 12. In the experimental conditions, the lengths of the developing region normalized by the orifice diameter are distributed within the range of 9 to 14. This result means that the effects of the loading ratio and the orifice exit velocity on the length of the developing region are ambiguous, and so it is expected that the length of the particle developing region is a function of the orifice geometry.
4. Conclusions
An experiment of solid particle spray is conducted for designing a proper injector of the supercavitation underwater vehicle by using a plain orifice type injector. In a condition of orifice length 20 mm, which is a required design criteria, the effect of particle loading ratio and orifice exit velocity on the particles velocity, turbulent intensity, and particle number density are investigated by means of PIV measurement. Further, the particle spreading angle, and the length of particle developing region, which have information of particle distribution in the jet, are examined.
1. Axial velocity profiles of particle along the radial direction are not self-similar with different particle loading ratios, and the profiles of higher loading ratios become steeper.
2. As the particle loading ratio increases, the decay rate of axial particle velocity profiles becomes slow, and turbulent intensity profiles are reduced.
3. As the orifice exit velocity increases, the decay rate of axial particle velocity profiles becomes slow, and turbulent intensity profiles are increased.
4. Spreading angles are reduced with the increasing the orifice exit velocity, and are shown to be parabolic curves as the loading ratio increases.
5. The lengths of particle developing regions are within the range of 9 to 14 in the experiment conditions.
Fig. 12. The length of the developing region considering all condi-tions.
DOI:10.5139/IJASS.2011.12.3.296 304
Int’l J. of Aeronautical & Space Sci. 12(3), 296–304 (2011)
The lengths of particle developing regions are within the
range of 9 to 14 in the experiment conditions.
Acknowledgements
This work has been supported by Agency for Defense
Development (09-01-05-24), and Mid-career Researcher
Program through NRF grant funded by the MEST (2011-
0016455) contracted through the Institute of Advanced
Aerospace Technology at Seoul National University.
References
Barlow, R. S. and Morrison, C. Q. (1990). Two-phase
velocity measurements in dense particle-laden jets.
Experiments in Fluids, 9, 93-104.
Fleckhaus, D., Hishida, K., and Maeda, M. (1987). Effect
of laden solid particles on the turbulent flow structure of a
round free jet. Experiments in Fluids, 5, 323-333.
Foote, J. P., Lineberry, J. T., Thompson, B. R., and Winkelman,
B. C. (1996). Investigation of aluminum particle combustion
for underwater propulsion applications. Proceedings of the
32nd AIAA/ASME/SAE/ASEE Joint Propulsion Conference
and Exhibit, Lake Buena Vista, FL.
Gillandt, I., Fritsching, U., and Bauckhage, K. (2001).
Measurement of phase interaction in dispersed gas/particle
two-phase flow. International Journal of Multiphase Flow,
27, 1313-1332.
Hart, D. P. (1998). The elimination of correlation errors
in PIV processing. Proceedings of the 9th International
Symposium on Applications of Laser Techniques to Fluid
Mechanics, Lisbon, Portugal.
Jou, B. H., Sheen, H. J., and Lee, Y. T. (1993). Particle mass
loading effect on a two-phase turbulent downward jet flow.
Particle and Particle Systems Characterization, 10, 173-181.
Laats, M. K. (1969). Experimental study of the dynamics of
an air-dust jet. Journal of Engineering Physics, 10, 6-8.
Levy, Y. and Lockwood, F. C. (1981). Velocity measurements
in a particle laden turbulent free jet. Combustion and Flame,
40, 333-339.
Modarress, D., Tan, H., and Elghobashi, S. (1984). Two-
component lda measurement in a two-phase turbulent jet.
AIAA Journal, 22, 624-630.
Park, C. J. and Chen, L. D. (1989). Experimental
investigation of confined turbulent jets. Part II. Particle-
laden flow data. AIAA Journal, 27, 1511-1516.
Popper, J., Abuaf, N., and Hetsroni, G. (1974). Velocity
measurements in a two-phase turbulent jet. International
Journal of Multiphase Flow, 1, 715-726.
Shuen, J. S., Solomon, A. S. P., Zhang, Q. F., and Faeth, G.
M. (1985). Structure of particle-laden jets: measurements
and predictions. AIAA journal, 23, 396-404.
Tsuji, Y., Morikawa, Y., Tanaka, T., Karimine, K., and
Nishida, S. (1988). Measurement of an axisymmetric jet laden
with coarse particles. International Journal of Multiphase
Flow, 14, 565-574.