Effect of milling speed on the quality and storage ...
7
2008 A P P L I E D A N D N A T U R A L S C I E N C E F O U N D A T I O N ANSF JANS Journal of Applied and Natural Science 8 (2): 1015 - 1021 (2016) INTRODUCTION Maize, the American Indian word for corn, means lit- erally "that which sustains life". Corn has been re- ferred to as "the cereal of the future" due to its high nutritional value and the wide utilization of its prod- ucts and by-products. India is the fifth largest producer of maize in the world contributing 3% of the global production. In India, maize has become the third im- portant food grain after wheat and rice with total pro- duction of 21759.37 tons with an average yield of 2476 kg/ha. In Punjab total production of maize was 502 tons with an average yield of 3984 kg/ha (Anonymous, 2012). After wheat and rice, maize is the most impor- tant cereal grain in the world, providing nutrients for humans and animals and can be processed into differ- ent breakfast items, food and feed ingredients and bev- erages for its consumption throughout the world (Chakraverty, 1988; Rajoo, 1998). Many people throughout the world, particularly living in Asia or people of Asiatic origin, make their own dough-based products on a daily basis. Chapatti is most often in the form of round substantially flat pieces of dough, which are appropriately cooked/ baked. Corn flour is used to make chapattis, which are eaten commonly in most part of India. By and large, corn breads are more com- monly consumed by the less affluent people (Mehta ISSN : 0974-9411 (Print), 2231-5209 (Online) All Rights Reserved © Applied and Natural Science Foundation www.ansfoundation.org and Dais, 1999). There are five general classes of corn e.g. flint corn, popcorn, flour corn, dent corn, and sweet corn (Watson, 1987). The maize nutritional value varies according to the variety, location and the practices used for production. For the variety PMH-1, the protein content varies from 6-11 gm, carbohydrate 70- 80 gm and crude fat 2- 5 gm per 100gm (Anonymous, 2014). Maize processing basically separates the fractions of the grain into germ, hull and endosperm to produce a wide range of products for various food and non-food uses. Extensive reviews of food uses of whole corn and specialized products made by fractionating corn by dry or wet milling are in the literature. The wet-milling process is designed to extract the highest use and value from each component of the maize kernel. The dry milling process is a less versatile, less capital intensive process that focuses primarily on the production of grain ethanol. The milling speed range between 350 rpm and 900 rpm. The very high speeds (up to 3000 rpm for a small electric mill) or very low ones (100 rpm) do occur but they are rare. The speeds given in the documentation are average speeds. As the speeds influence the quality of the grinding, we can reduce them slightly to improve the quality of the flour, by decreasing the throughput, or else, the flour is less ho- mogeneous and warmer. Effect of milling speed on the quality and storage stability of maize flour Gagandeep Kaur Sidhu*, A.K. Singh and Manpreet Singh Department of Processing and Food Engineering, Punjab Agricultural University, Ludhiana-141004 (Punjab), INDIA *Corresponding Author. E-mail: [email protected] Received: September 22, 2015; Revised received: March 1, 2016; Accepted: June 5, 2016 Abstract: This work was undertaken to evaluate the effect of milling speed on the quality and shelf life of maize flour. Maize flour was prepared using low speed mini flour mill at 75 and 115 rpm and the results were compared with the flour prepared by commercial flour mill on the basis of recovery of flour, rise in temperature of flour, time taken, particle size distribution and changes in different quality parameters during storage. It was observed from the analysis that the recovery of flour was highest (95.26%) at 75 rpm speed although the time taken was more i.e. 27.27 minutes, but the rise in temperature during milling was very less (12.24 0 C) as compared to commercial mill the temperature rose up to 31.12 0 C. It was noted that the maize flour prepared at low speed was light yellow in color as compared to higher rpm which was dark yellow. The maize flour prepared at 75 rpm can be stored in low density polyethylene LDPE packaging material of (200 gauge) for two months without change in quality parameters. It was observed that the moisture content, protein content, fat content, alcoholic acidity and carbohydrates was significantly affected by storage time, packaging material and milling speed at P<0.05. Therefore, at low speed the storage stability as well as nutritional properties of the flour can be enhanced. The improved shelf life of flour can result in better marketability. Key-words: Maize Flour, Mini Flour Mill, Storage, Packaging material, Physico-chemical properties
Transcript of Effect of milling speed on the quality and storage ...

2008
APPLIE
D
AN
DNATURAL SCIENCE
FOU
ND
ATIONANSF
JANS Journal of Applied and Natural Science 8 (2): 1015 - 1021 (2016)
INTRODUCTION
Maize, the American Indian word for corn, means lit-erally "that which sustains life". Corn has been re-ferred to as "the cereal of the future" due to its high nutritional value and the wide utilization of its prod-ucts and by-products. India is the fifth largest producer of maize in the world contributing 3% of the global production. In India, maize has become the third im-portant food grain after wheat and rice with total pro-duction of 21759.37 tons with an average yield of 2476 kg/ha. In Punjab total production of maize was 502 tons with an average yield of 3984 kg/ha (Anonymous, 2012). After wheat and rice, maize is the most impor-tant cereal grain in the world, providing nutrients for humans and animals and can be processed into differ-ent breakfast items, food and feed ingredients and bev-erages for its consumption throughout the world (Chakraverty, 1988; Rajoo, 1998). Many people throughout the world, particularly living in Asia or people of Asiatic origin, make their own dough-based products on a daily basis. Chapatti is most often in the form of round substantially flat pieces of dough, which are appropriately cooked/ baked. Corn flour is used to make chapattis, which are eaten commonly in most part of India. By and large, corn breads are more com-monly consumed by the less affluent people (Mehta
ISSN : 0974-9411 (Print), 2231-5209 (Online) All Rights Reserved © Applied and Natural Science Foundation www.ansfoundation.org
and Dais, 1999). There are five general classes of corn e.g. flint corn, popcorn, flour corn, dent corn, and sweet corn (Watson, 1987). The maize nutritional value varies according to the variety, location and the practices used for production. For the variety PMH-1, the protein content varies from 6-11 gm, carbohydrate 70- 80 gm and crude fat 2- 5 gm per 100gm (Anonymous, 2014). Maize processing basically separates the fractions of the grain into germ, hull and endosperm to produce a wide range of products for various food and non-food uses. Extensive reviews of food uses of whole corn and specialized products made by fractionating corn by dry or wet milling are in the literature. The wet-milling process is designed to extract the highest use and value from each component of the maize kernel. The dry milling process is a less versatile, less capital intensive process that focuses primarily on the production of grain ethanol. The milling speed range between 350 rpm and 900 rpm. The very high speeds (up to 3000 rpm for a small electric mill) or very low ones (100 rpm) do occur but they are rare. The speeds given in the documentation are average speeds. As the speeds influence the quality of the grinding, we can reduce them slightly to improve the quality of the flour, by decreasing the throughput, or else, the flour is less ho-mogeneous and warmer.
Effect of milling speed on the quality and storage stability of maize flour
Gagandeep Kaur Sidhu*, A.K. Singh and Manpreet Singh
Department of Processing and Food Engineering, Punjab Agricultural University, Ludhiana-141004 (Punjab), INDIA *Corresponding Author. E-mail: [email protected]
Received: September 22, 2015; Revised received: March 1, 2016; Accepted: June 5, 2016
Abstract: This work was undertaken to evaluate the effect of milling speed on the quality and shelf life of maize flour. Maize flour was prepared using low speed mini flour mill at 75 and 115 rpm and the results were compared with the flour prepared by commercial flour mill on the basis of recovery of flour, rise in temperature of flour, time taken, particle size distribution and changes in different quality parameters during storage. It was observed from the analysis that the recovery of flour was highest (95.26%) at 75 rpm speed although the time taken was more i.e. 27.27 minutes, but the rise in temperature during milling was very less (12.240C) as compared to commercial mill the temperature rose up to 31.120C. It was noted that the maize flour prepared at low speed was light yellow in color as compared to higher rpm which was dark yellow. The maize flour prepared at 75 rpm can be stored in low density polyethylene LDPE packaging material of (200 gauge) for two months without change in quality parameters. It was observed that the moisture content, protein content, fat content, alcoholic acidity and carbohydrates was significantly affected by storage time, packaging material and milling speed at P<0.05. Therefore, at low speed the storage stability as well as nutritional properties of the flour can be enhanced. The improved shelf life of flour can result in better marketability.
Key-words: Maize Flour, Mini Flour Mill, Storage, Packaging material, Physico-chemical properties
1016
Keeping in view the above facts, the present study was carried out to study the performance of the low speed mini flour mill for preparation of maize flour. At low speed the lesser rise in flour temperature may en-hanced the storability of flour, through reduction in fat acidity and FFA content of flour.
MATERIALS AND METHODS
Selection of crop: The whole maize kernel of PMH-1 variety was procured from Maize section, Punjab Agri-cultural University, Ludhiana. The maize kernel were cleaned by using grain cleaner to remove foreign mat-ter such as dust, dirt, chaff, immature and broken grains. The clean healthy grains were selected for the
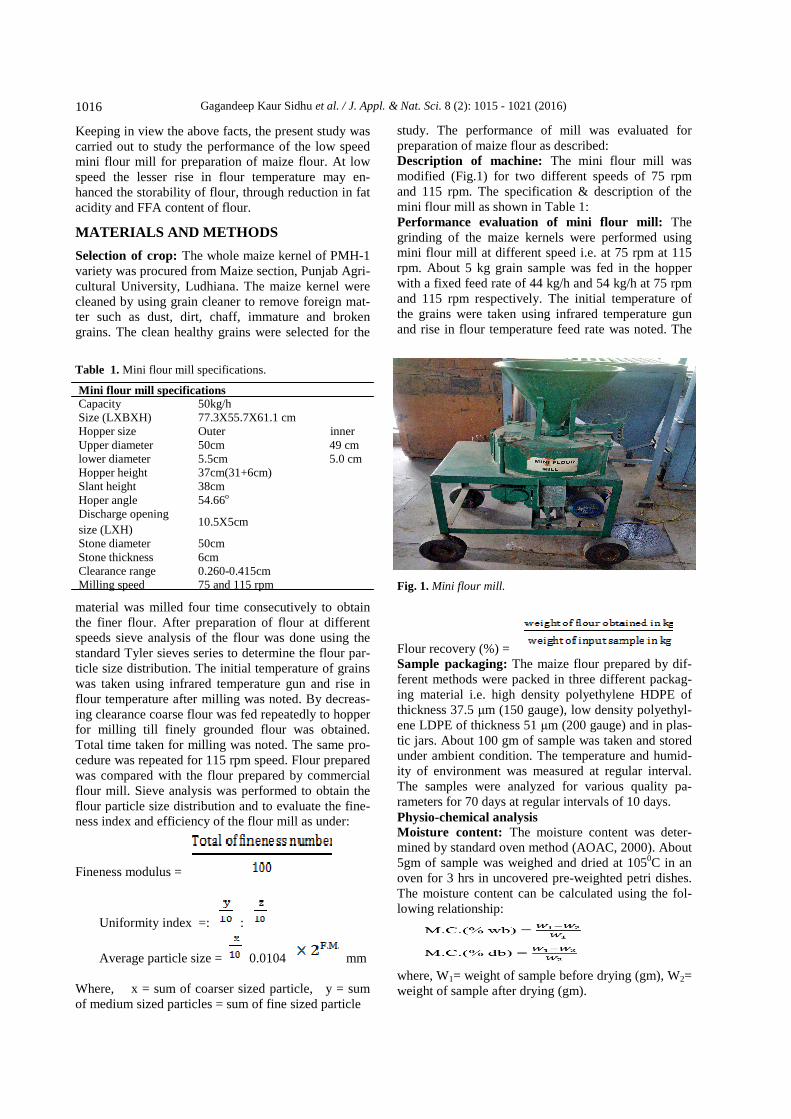
study. The performance of mill was evaluated for preparation of maize flour as described: Description of machine: The mini flour mill was modified (Fig.1) for two different speeds of 75 rpm and 115 rpm. The specification & description of the mini flour mill as shown in Table 1: Performance evaluation of mini flour mill: The grinding of the maize kernels were performed using mini flour mill at different speed i.e. at 75 rpm at 115 rpm. About 5 kg grain sample was fed in the hopper with a fixed feed rate of 44 kg/h and 54 kg/h at 75 rpm and 115 rpm respectively. The initial temperature of the grains were taken using infrared temperature gun and rise in flour temperature feed rate was noted. The
Gagandeep Kaur Sidhu et al. / J. Appl. & Nat. Sci. 8 (2): 1015 - 1021 (2016)
material was milled four time consecutively to obtain the finer flour. After preparation of flour at different speeds sieve analysis of the flour was done using the standard Tyler sieves series to determine the flour par-ticle size distribution. The initial temperature of grains was taken using infrared temperature gun and rise in flour temperature after milling was noted. By decreas-ing clearance coarse flour was fed repeatedly to hopper for milling till finely grounded flour was obtained. Total time taken for milling was noted. The same pro-cedure was repeated for 115 rpm speed. Flour prepared was compared with the flour prepared by commercial flour mill. Sieve analysis was performed to obtain the flour particle size distribution and to evaluate the fine-ness index and efficiency of the flour mill as under:
Fineness modulus =
Uniformity index =: :
Average particle size = 0.0104 mm Where, x = sum of coarser sized particle, y = sum of medium sized particles = sum of fine sized particle
Flour recovery (%) = Sample packaging: The maize flour prepared by dif-ferent methods were packed in three different packag-ing material i.e. high density polyethylene HDPE of thickness 37.5 µm (150 gauge), low density polyethyl-ene LDPE of thickness 51 µm (200 gauge) and in plas-tic jars. About 100 gm of sample was taken and stored under ambient condition. The temperature and humid-ity of environment was measured at regular interval. The samples were analyzed for various quality pa-rameters for 70 days at regular intervals of 10 days. Physio-chemical analysis Moisture content: The moisture content was deter-mined by standard oven method (AOAC, 2000). About 5gm of sample was weighed and dried at 1050C in an oven for 3 hrs in uncovered pre-weighted petri dishes. The moisture content can be calculated using the fol-lowing relationship:
where, W1= weight of sample before drying (gm), W2= weight of sample after drying (gm).
Mini flour mill specifications Capacity 50kg/h Size (LXBXH) 77.3X55.7X61.1 cm Hopper size Outer inner Upper diameter 50cm 49 cm lower diameter 5.5cm 5.0 cm Hopper height 37cm(31+6cm) Slant height 38cm Hoper angle 54.66o Discharge opening size (LXH)
10.5X5cm
Stone diameter 50cm Stone thickness 6cm Clearance range 0.260-0.415cm Milling speed 75 and 115 rpm
Table 1. Mini flour mill specifications.
Fig. 1. Mini flour mill.

1017
Gagandeep Kaur Sidhu et al. / J. Appl. & Nat. Sci. 8 (2): 1015 - 1021 (2016)
Protein content: Protein content was determined by available nitrogen in the sample by Micro Kjeldhal method (AOAC, 2000). One gram sample was di-gested in 20 ml of sulphuric acid (H2SO4) at 4200C using copper sulphate and potassium sulphate in 1:9 ratio as catalyst mixture. Digested sample was cooled and 250 ml distilled water was added about 50 ml of this mixture was distilled using 40% NaOH in KjelTech (Pelican equipment Limited, Chennai, India). Ammonia was absorbed in excess of 4% boric acid mix with 5 to 7 drops of indicator solution and then titrated with standard acid (0.1N HCl) to estimate the protein content. The protein content was estimated using following equation:
and Protein (%)= 6.25×Nitrogen (N2)content (%). Crude fat: Moisture free 5 g sample was taken in readymade thimble and oil was extracted in a pre-weighed beaker using petroleum ether in Soxhlet appa-ratus for - 2.5 to 3 hours. The beaker was then heated to evaporate petroleum ether. Final weight of the beaker was taken and used for the estimation of crude fat content of sample (AOAC, 2000). The following equation was used for estimation of crude fat content (%) in the sample:
Ash content: About 5 g sample were taken in cruci-bles. These were burnt on hot plate and then placed in an electric muffle furnace at 6000C for 6 hours. After cooling the crucibles to room temperature, the residue left (ash) in the crucible was weighed (AOAC, 2000). The following formula was used to calculate the ash (%):
Crude fibre: Two grams of moisture and fat free sam-ple was first digested with 200 ml boiling 0.255N H2SO4 for 30 min. After acid digestion the mixture was filtered and washing of residue with hot water was carried out to remove traces of acid. Then alkali diges-tion was performed with 200 ml of 0.313 N NaOH for 30 min. Again the mixture was filtered and washed
with hot water followed by alcohol and ether to re-move traces of alkali. The residue was dried and weight was noted down (M1). It was ignited in muffle furnace at 600°C for 3 hours and cooled and weighed (M2). The following equation was used for estimation of crude fibre content (%) in the sample (AOAC, 1980):
Where, M is mass in g of the dry fat free sample taken for the test. Carbohydrates: Carbohydrates were calculated by subtraction method in which the protein, crude fat, fibre, moisture content and ash content are subtracted from 100 to get the percentage of carbohydrates pre-sent in maize flour. Alcoholic acidity: The alcoholic acidity was deter-mined by using the procedure, given by Thapar et al., 1988. About 5 g of sample with 50 ml alcohol was mixed and kept for 24 hrs with occasional swirling. The mixture was filtered and 10 ml of extract was titrated with 0.05N NaOH solution using phenolphthalein as indicator. The alcoholic acidity was calculated as follows:
Color measurement: Color properties of maize flour was measured using Lab colorimeter, model no. 45/0-L. color was measure in terms of ‘L’, ‘a’and ‘b’. Befo-re measuring color, colorimeter was calibrated using white/ black plates provided for determination of color. Statistical analysis: The data for each parameter was collected in triplicate. The data were analyzed using the technique of analysis of variance. The different effects were tested at P< 0.05 using SPSS 22.0 soft-ware using Tukey test.
RESULTS AND DISCUSSION
Effect of milling speed on flour recovery and efficiency: The mini flour mill was evaluated for preparation of maize flour at different speed of 75 rpm and 115 rpm. It was observed from analysis that the recovery of flour was maximum i.e. 95.26% in 75 rpm speed and minimum in commercial milling i.e. 87.95%. The lower flour recovery in commercial flour mill was due
S.N. Parameter Mini flour mill Commercial flour mill Speed 75 rpm 115 rpm 400 rpm 1 Flour temperature rise (o C) 12.24 ±2.12 20.32 ± 3.10 31.12 ± 2.04 2 Time taken for milling(min) 27.27± 0.05 22.22± 0.11 12.12±0.04 3 Feed rate (kg/h) 44 ± 1.21 54 ± 1.34 100 ± 1.04 4 Milling efficiency (%) 96.13±0.11 95.14±0.05 94.68±0.13 5 Recovery of flour (%) 95.26 ± 0.14 89.81 ± 0.20 87.95 ± 0.10 6 Fineness modulus 2.05 1.94 2.0 7 Average particle size(cm) 0.043 0.040 0.041 8 Uniformity index (coarser : medium : fine ) 0.02:7.43:2.55 0.01:7.96:2.03 0.00:7.88:2.12
Table 2. Performance of mini flour mill.
1018
Gagandeep Kaur Sidhu et al. / J. Appl. & Nat. Sci. 8 (2): 1015 - 1021 (2016)
F-value
Moisture content
Protein content
Fat content
Carbohydrates content
Alcoholic acidity
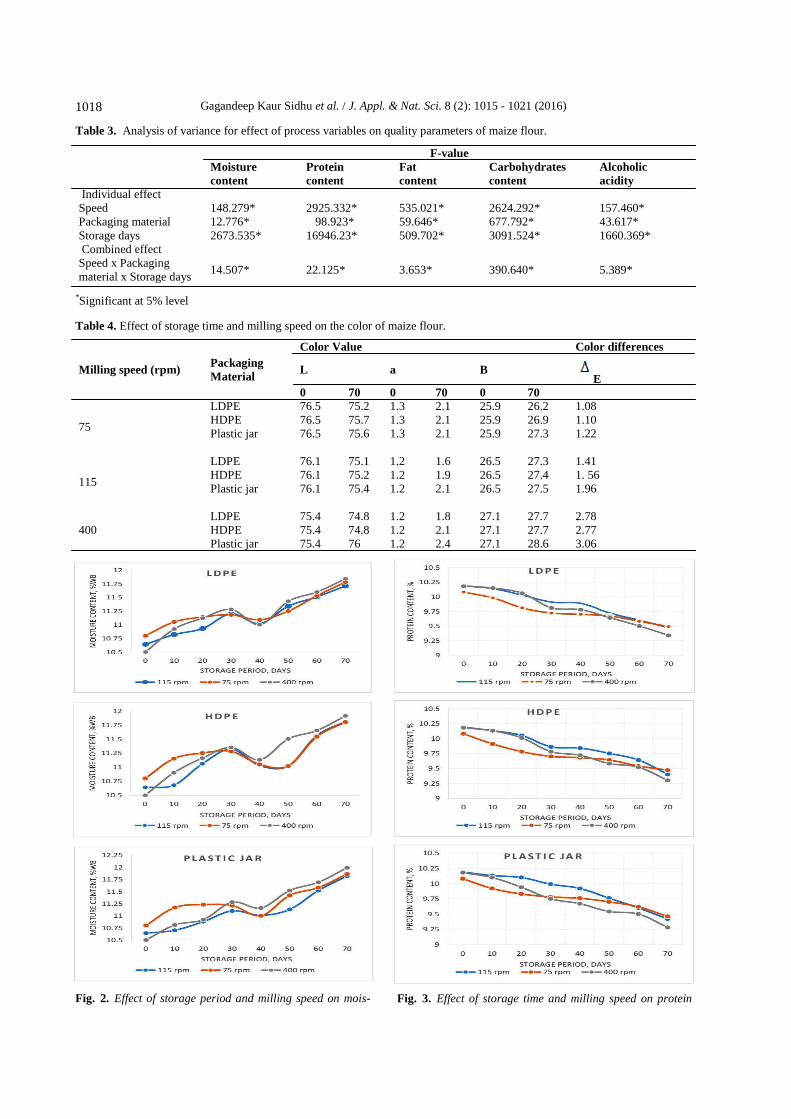
Individual effect Speed 148.279* 2925.332* 535.021* 2624.292* 157.460* Packaging material 12.776* 98.923* 59.646* 677.792* 43.617* Storage days 2673.535* 16946.23* 509.702* 3091.524* 1660.369* Combined effect Speed x Packaging material x Storage days
14.507* 22.125* 3.653* 390.640* 5.389*
Table 3. Analysis of variance for effect of process variables on quality parameters of maize flour.
Milling speed (rpm) Packaging Material
Color Value Color differences
L a B E
0 70 0 70 0 70
75
LDPE 76.5 75.2 1.3 2.1 25.9 26.2 1.08 HDPE 76.5 75.7 1.3 2.1 25.9 26.9 1.10 Plastic jar 76.5 75.6 1.3 2.1 25.9 27.3 1.22
115
LDPE 76.1 75.1 1.2 1.6 26.5 27.3 1.41 HDPE 76.1 75.2 1.2 1.9 26.5 27.4 1. 56 Plastic jar 76.1 75.4 1.2 2.1 26.5 27.5 1.96
400 LDPE 75.4 74.8 1.2 1.8 27.1 27.7 2.78 HDPE 75.4 74.8 1.2 2.1 27.1 27.7 2.77 Plastic jar 75.4 76 1.2 2.4 27.1 28.6 3.06
Table 4. Effect of storage time and milling speed on the color of maize flour.
*Significant at 5% level
Fig. 2. Effect of storage period and milling speed on mois- Fig. 3. Effect of storage time and milling speed on protein
1019
to the lesser milling efficiency of 94.68%. The overall flour recovery for sieve size 1.4 mm was found to be higher at 75 rpm milling followed by 115 rpm milling and commercial milling at 400 rpm. The fineness modulus was higher for 75 rpm milling 2.05 followed by 400 rpm commercial milling 2.00 then 115 rpm milling 1.99 whereas average particle size of flour was bigger at 75 rpm milling 0.043 cm followed by 400 rpm commercial milling 0.041 cm then by 115 rpm milling 0.040 cm respectively. The rise in temperature was lesser in 75 rpm speed i.e.12.24 oC, whereas it was highest in commercial mill (31.12 oC). The perform-ance of the mini flour mill was compared with the commercial flour mill as shown in Table 2: Effect of milling speed on the quality characteristics of whole maize flour stored in different packaging material Moisture content: Moisture content of flour is very important for its shelf life, lower the moisture content better its storage life (Butt et al., 2004; Barnwal et al., 2013; Kadam et al., 2012). From Fig.2, it can be ob-served that moisture content of flour increased with the increase in the storage period in all packaging material. The initial moisture content of flour of commercial
Gagandeep Kaur Sidhu et al. / J. Appl. & Nat. Sci. 8 (2): 1015 - 1021 (2016)
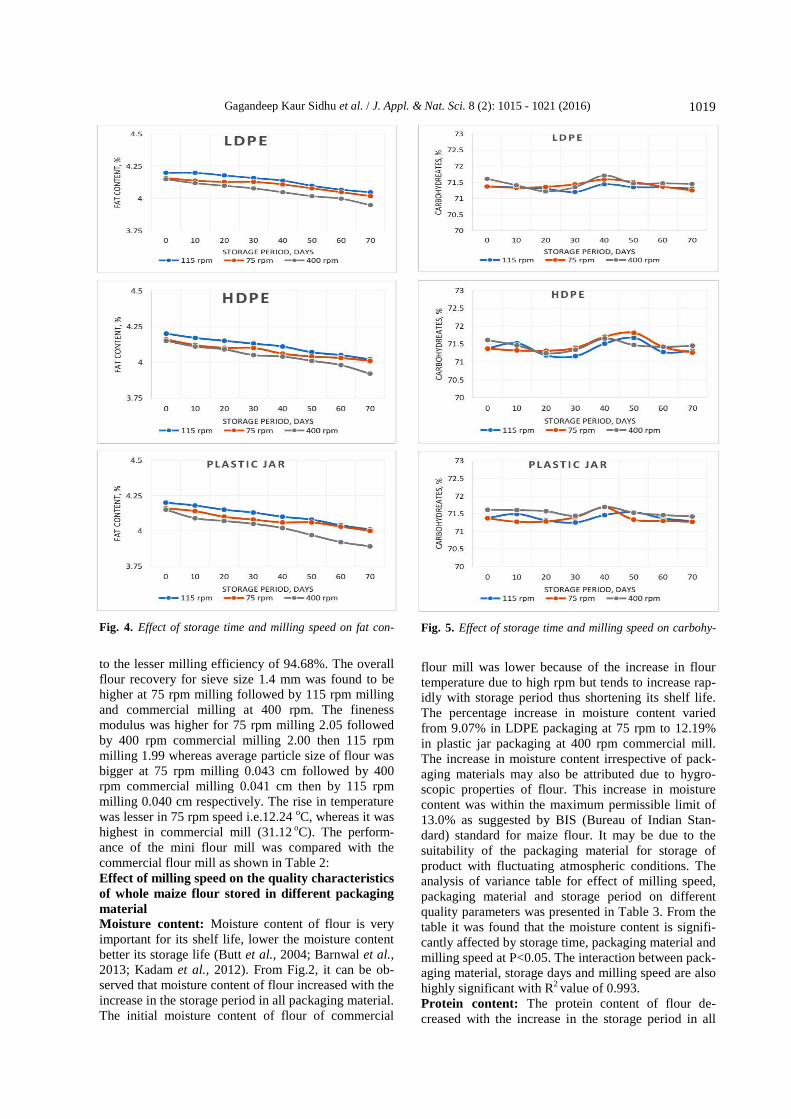
Fig. 4. Effect of storage time and milling speed on fat con- Fig. 5. Effect of storage time and milling speed on carbohy-
flour mill was lower because of the increase in flour temperature due to high rpm but tends to increase rap-idly with storage period thus shortening its shelf life. The percentage increase in moisture content varied from 9.07% in LDPE packaging at 75 rpm to 12.19% in plastic jar packaging at 400 rpm commercial mill. The increase in moisture content irrespective of pack-aging materials may also be attributed due to hygro-scopic properties of flour. This increase in moisture content was within the maximum permissible limit of 13.0% as suggested by BIS (Bureau of Indian Stan-dard) standard for maize flour. It may be due to the suitability of the packaging material for storage of product with fluctuating atmospheric conditions. The analysis of variance table for effect of milling speed, packaging material and storage period on different quality parameters was presented in Table 3. From the table it was found that the moisture content is signifi-cantly affected by storage time, packaging material and milling speed at P<0.05. The interaction between pack-aging material, storage days and milling speed are also highly significant with R2 value of 0.993. Protein content: The protein content of flour de-creased with the increase in the storage period in all
1020
Gagandeep Kaur Sidhu et al. / J. Appl. & Nat. Sci. 8 (2): 1015 - 1021 (2016)
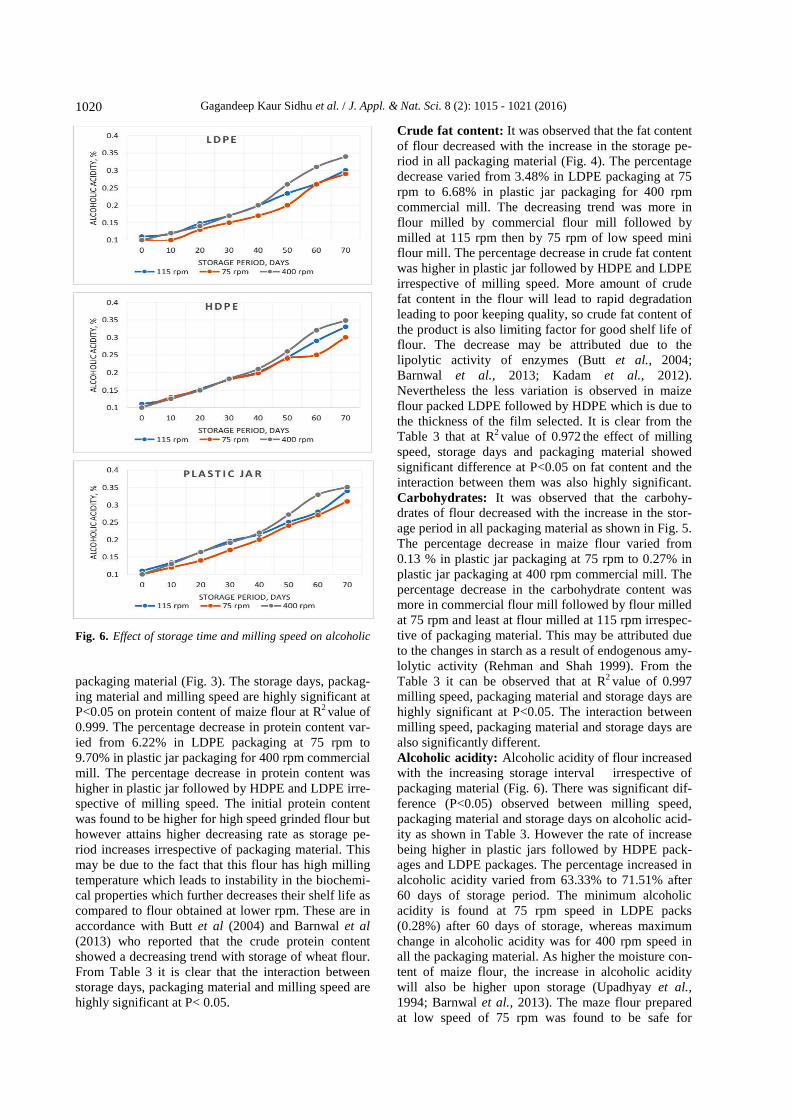
Fig. 6. Effect of storage time and milling speed on alcoholic
packaging material (Fig. 3). The storage days, packag-ing material and milling speed are highly significant at P<0.05 on protein content of maize flour at R2 value of 0.999. The percentage decrease in protein content var-ied from 6.22% in LDPE packaging at 75 rpm to 9.70% in plastic jar packaging for 400 rpm commercial mill. The percentage decrease in protein content was higher in plastic jar followed by HDPE and LDPE irre-spective of milling speed. The initial protein content was found to be higher for high speed grinded flour but however attains higher decreasing rate as storage pe-riod increases irrespective of packaging material. This may be due to the fact that this flour has high milling temperature which leads to instability in the biochemi-cal properties which further decreases their shelf life as compared to flour obtained at lower rpm. These are in accordance with Butt et al (2004) and Barnwal et al (2013) who reported that the crude protein content showed a decreasing trend with storage of wheat flour. From Table 3 it is clear that the interaction between storage days, packaging material and milling speed are highly significant at P< 0.05.
Crude fat content: It was observed that the fat content of flour decreased with the increase in the storage pe-riod in all packaging material (Fig. 4). The percentage decrease varied from 3.48% in LDPE packaging at 75 rpm to 6.68% in plastic jar packaging for 400 rpm commercial mill. The decreasing trend was more in flour milled by commercial flour mill followed by milled at 115 rpm then by 75 rpm of low speed mini flour mill. The percentage decrease in crude fat content was higher in plastic jar followed by HDPE and LDPE irrespective of milling speed. More amount of crude fat content in the flour will lead to rapid degradation leading to poor keeping quality, so crude fat content of the product is also limiting factor for good shelf life of flour. The decrease may be attributed due to the lipolytic activity of enzymes (Butt et al., 2004; Barnwal et al., 2013; Kadam et al., 2012). Nevertheless the less variation is observed in maize flour packed LDPE followed by HDPE which is due to the thickness of the film selected. It is clear from the Table 3 that at R2 value of 0.972 the effect of milling speed, storage days and packaging material showed significant difference at P<0.05 on fat content and the interaction between them was also highly significant. Carbohydrates: It was observed that the carbohy-drates of flour decreased with the increase in the stor-age period in all packaging material as shown in Fig. 5. The percentage decrease in maize flour varied from 0.13 % in plastic jar packaging at 75 rpm to 0.27% in plastic jar packaging at 400 rpm commercial mill. The percentage decrease in the carbohydrate content was more in commercial flour mill followed by flour milled at 75 rpm and least at flour milled at 115 rpm irrespec-tive of packaging material. This may be attributed due to the changes in starch as a result of endogenous amy-lolytic activity (Rehman and Shah 1999). From the Table 3 it can be observed that at R2 value of 0.997 milling speed, packaging material and storage days are highly significant at P<0.05. The interaction between milling speed, packaging material and storage days are also significantly different. Alcoholic acidity: Alcoholic acidity of flour increased with the increasing storage interval irrespective of packaging material (Fig. 6). There was significant dif-ference (P<0.05) observed between milling speed, packaging material and storage days on alcoholic acid-ity as shown in Table 3. However the rate of increase being higher in plastic jars followed by HDPE pack-ages and LDPE packages. The percentage increased in alcoholic acidity varied from 63.33% to 71.51% after 60 days of storage period. The minimum alcoholic acidity is found at 75 rpm speed in LDPE packs (0.28%) after 60 days of storage, whereas maximum change in alcoholic acidity was for 400 rpm speed in all the packaging material. As higher the moisture con-tent of maize flour, the increase in alcoholic acidity will also be higher upon storage (Upadhyay et al., 1994; Barnwal et al., 2013). The maze flour prepared at low speed of 75 rpm was found to be safe for

1021
Gagandeep Kaur Sidhu et al. / J. Appl. & Nat. Sci. 8 (2): 1015 - 1021 (2016)
consumption even after 60 days of storage in all the three packaging materials; however, for commercial mill maize flour was fit for consumption upto 50 days, depending upon the maximum permissible limit of alcoholic acidity (0.3% BIS specification). At R2 value of 0.989, the interaction between milling speed, packaging material and storage days are highly significant at P<0.05. (Table 3). Crude fibre: The crude fibre content of maize flours varied from 1.72% to 1.81% during the storage period. Crude fibre content is not affected by packaging mate-rial and storage time. The crude fibre content is not significantly affected by packaging material, storage period and milling speed. Similar results are reported by Kadam et al., 2012 for degermed maize flour. Ash content: The ash content of maize flour varied from 1.71% to 1.79%. The ash content of maize flour decreased with the increase in storage period in all the packaging material, but the decrease was very less. The ash content is not significantly affected by packag-ing material and storage period. Similar findings are reported Shahzadi et al., 2005; Kadam et al., 2012 for wheat and maize flour. Color: The effect of storage time and milling speed on the color in different packaging material was presented in Table 4. The ‘L’ value of maize flour milled at dif-ferent speed ranged from 75.4 to 76.5, the highest ‘L’ value of flour milled at 75 rpm speed indicated its lighter color. It was observed that the color ‘b’value of flour increased with the increase in the storage period in all packaging material. It was noted that the color of flour milled at 75 rpm was light yellow in color as compared with commercial mill which is more yellow i.e. the ‘b’value of color was more in flour milled at 400 rpm. It was observed from analysis that the overall variation of color during storage period was very small in LDPE packs at 75 rpm speed.
Conclusion
The performance of the flour mill was evaluated on the basis of recovery of flour, rise in temperature of flour after milling, time taken for milling. The recovery of flour was maximum in 75 rpm i.e. 95.26% and mini-mum in commercial milling i.e. 87.95%. The rise in temperature was lesser in 75 rpm speed i.e.12.24 oC, whereas it was highest in commercial mill (31.12 oC). The maize flour prepared by mini flour mill at both 75 and 115 rpm is consumable till 60 days of storage pe-riod as after that the alcoholic acidity tends to increase
beyond 0.3% which is maximum permissible limit whereas in the commercial flour mill the alcoholic acidity increases after 50 days of storage period in all packaging material.
REFRENCES
AOAC. (1980). Official Methods of Analysis, 11th edn. Washington, DC, Association of official analytical chemists.
AOAC. (2000). Official Methods of Analysis, 17th edn. Washington, DC, Association of official analytical chemists.
Anonymous (2012). Ministry of Agriculture, Govt. of India. (ON321), State-wise production data, Ministry of Agri-culture, Govt. of India. (14105) and (14268), State-wise yield data.
Anonymous (2014). Source: USDA, U.S Department of Agriculture.
Barnwal, P., Kore, P. and Sharma, A. (2013). Assessment of storage stability of whole and degermed maize flours. Internet J of Fd Safety, 15: 83-87
Butt, M.S., Nasir, M., Akhtar, S., Sharif, K. (2004). Effect of moisture and packaging on the shelf life of wheat flour. Internet J of Food Safety, 5: 1–6.
Chakraverty, A. (1988). Post harvest technology of cereals, pulses and oilseeds. India: Oxford & IBH publication, pp 177-182.
Kadam, Dattatreya, M., Barnwal, P., Sonia, Chadha, Singh, K.K. (2012) Biochemical Properties of Whole and De-germed Maize Flours during Storage. American Journal of Biochemistry, 2 (4): 41-46. DOI: 10.5923/j.ajb. 2012 0204.01
Mehta, D.C., Dais, F.F. (1999). Maize: perspectives and applications in India. Starch/Starke, 51: 52–57.
Rajoo, R.K. (1998). Maize: The Golden Grain of Himachal Pradesh. Kalyani Publishers, Ludhiana, India.
Rehman, Z.U., Shah, W.H. (1999). Biochemical changes in wheat during storage at three temperatures. Plant Food for Human Nutri., 54 (2): 109-17.
Shahzadi, N., Butt, M.S., Rehman, S.R., Sharif, K. (2005). Chemical characteristics of various composite flours. International J of Agric& Biology, 7 (1): 105-08.
Thapar, V.K., Sehgal, V.K., Paul, S. (1988). Post harvest quality analysis of food grains –research bulletin. De-partment of Processing and Agricultural Structures, Punjab Agricultural University, Ludhiana, 13–32.
Upadhyay, R.K., Thangaraj, M., Jaiswal, P.K. (1994). Stor-age studies of suji in different packages. Journal of Food Sci. & Tech., 31 (6): 494-96.
Watson, A.S. (1987). Structure and composition. In: Watson S A, Ramstad P E (eds), Corn chemistry and technology. St. Paul, MN: American Association of Cereal Chemists, 53–82.