Effect of microemulsion variables on copper oxide ... · operating and microemulsion variables on...
9
Journal of Colloid and Interface Science 316 (2007) 442–450 www.elsevier.com/locate/jcis Effect of microemulsion variables on copper oxide nanoparticle uptake by AOT microemulsions Nashaat N. Nassar, Maen M. Husein ∗ Department of Chemical and Petroleum Engineering, University of Calgary, Calgary, AB, T2N 1N4, Canada Received 20 April 2007; accepted 21 August 2007 Available online 28 August 2007 Abstract Ultradispersed metal oxide nanoparticles have applications as heterogeneous catalysts for organic reactions. Their catalytic activity depends primarily on their surface area, which in turn, is dictated by their size, colloidal concentration and stability. This work presents a microemulsion approach for in situ preparation of ultradispersed copper oxide nanoparticles and discusses the effect of different microemulsion variables on their stability and highest possible time-invariant colloidal concentration (nanoparticle uptake). In addition, a model which describes the effect of the relevant variables on the nanoparticle uptake is evaluated. The preparation technique involved solubilizing CuCl 2 in single microemulsions followed by direct addition of NaOH. Upon addition of NaOH, copper hydroxide nanoparticles stabilized in the water pools formed in addition to a bulk copper hydroxide precipitate at the bottom. The copper hydroxide nanoparticles transformed with time into copper oxide. After reaching a time-independent concentration, mixing had limited effect on the nanoparticle uptake and particle size. Particle size increased with increasing the surfactant concentration, concentration of the precursor salt, and water to surfactant mol ratio; while the nanoparticle uptake increased linearly with the surfactant concentration, displayed an optimum with R and a power function with the concentration of the precursor salt. Surface areas per gram of nanoparticles were much higher than literature values. Even though lower area per gram of nanoparticles was obtained at higher uptake, higher surface area per unit volume of the reverse micellar system was attained. A model based on water uptake by Wisor type II microemulsions, and previously used to describe iron oxide nanoparticle uptake by the same microemulsions, agreed well with the experimental results. © 2007 Published by Elsevier Inc. Keywords: Nanoparticle; Copper oxide; Microemulsion; Surfactant; Catalyst; Surface area; Uptake; Model 1. Introduction Formation of well-dispersed colloidal nanoparticle catalysts is crucial for heterogeneous catalysis in organic media [1–12]. However, maintaining stable dispersion of the particles is a challenging issue, since these particles tend to agglomerate with time in order to reduce the high surface energy [13]. One ap- proach of minimizing particle agglomeration is to prepare the catalyst in situ. For example, very high reaction rates were attained when in situ prepared ultradispersed catalysts were employed for hydrocracking [1,2], coprocessing [4], and coal liquefaction [12]. In these investigations organometallic pre- cursors were dissolved in the organic media to ensure intimate dispersion, then the catalyst was prepared in situ by thermal de- * Corresponding author. E-mail address: [email protected] (M.M. Husein). composition of the corresponding precursor. Water-in-oil (w/o) microemulsions, or reverse micelles, serve as an alternative in situ preparation technique for ultradispersed nanoparticle cata- lysts starting from their water soluble precursors [1–4]. It offers an easy control over particle size, produces highly dispersed nanoparticles in organic phases, and protect these particles from agglomeration by virtue of the surfactant protective layer. In fact, it was found that (w/o) microemulsion-prepared nanoparti- cle catalysts exhibited smaller particle sizes and showed higher catalytic activity compared with the ones prepared by con- ventional techniques [8,9,14]. In general, high catalyst activity hinges on maintaining high accessible catalyst surface area. For ultradispersed catalysts, high accessible area can be attained by minimizing particle size and maximizing particle colloidal concentration. The condition of high colloidal concentration, in particular, poses a challenge for microemulsion systems, since 0021-9797/$ – see front matter © 2007 Published by Elsevier Inc. doi:10.1016/j.jcis.2007.08.044
Transcript of Effect of microemulsion variables on copper oxide ... · operating and microemulsion variables on...

Journal of Colloid and Interface Science 316 (2007) 442–450www.elsevier.com/locate/jcis
Effect of microemulsion variables on copper oxide nanoparticle uptakeby AOT microemulsions
Nashaat N. Nassar, Maen M. Husein ∗
Department of Chemical and Petroleum Engineering, University of Calgary, Calgary, AB, T2N 1N4, Canada
Received 20 April 2007; accepted 21 August 2007
Available online 28 August 2007
Abstract
Ultradispersed metal oxide nanoparticles have applications as heterogeneous catalysts for organic reactions. Their catalytic activity dependsprimarily on their surface area, which in turn, is dictated by their size, colloidal concentration and stability. This work presents a microemulsionapproach for in situ preparation of ultradispersed copper oxide nanoparticles and discusses the effect of different microemulsion variables ontheir stability and highest possible time-invariant colloidal concentration (nanoparticle uptake). In addition, a model which describes the effect ofthe relevant variables on the nanoparticle uptake is evaluated. The preparation technique involved solubilizing CuCl2 in single microemulsionsfollowed by direct addition of NaOH. Upon addition of NaOH, copper hydroxide nanoparticles stabilized in the water pools formed in addition toa bulk copper hydroxide precipitate at the bottom. The copper hydroxide nanoparticles transformed with time into copper oxide. After reachinga time-independent concentration, mixing had limited effect on the nanoparticle uptake and particle size. Particle size increased with increasingthe surfactant concentration, concentration of the precursor salt, and water to surfactant mol ratio; while the nanoparticle uptake increased linearlywith the surfactant concentration, displayed an optimum with R and a power function with the concentration of the precursor salt. Surface areas pergram of nanoparticles were much higher than literature values. Even though lower area per gram of nanoparticles was obtained at higher uptake,higher surface area per unit volume of the reverse micellar system was attained. A model based on water uptake by Wisor type II microemulsions,and previously used to describe iron oxide nanoparticle uptake by the same microemulsions, agreed well with the experimental results.© 2007 Published by Elsevier Inc.
Keywords: Nanoparticle; Copper oxide; Microemulsion; Surfactant; Catalyst; Surface area; Uptake; Model
1. Introduction
Formation of well-dispersed colloidal nanoparticle catalystsis crucial for heterogeneous catalysis in organic media [1–12].However, maintaining stable dispersion of the particles is achallenging issue, since these particles tend to agglomerate withtime in order to reduce the high surface energy [13]. One ap-proach of minimizing particle agglomeration is to prepare thecatalyst in situ. For example, very high reaction rates wereattained when in situ prepared ultradispersed catalysts wereemployed for hydrocracking [1,2], coprocessing [4], and coalliquefaction [12]. In these investigations organometallic pre-cursors were dissolved in the organic media to ensure intimatedispersion, then the catalyst was prepared in situ by thermal de-
* Corresponding author.E-mail address: [email protected] (M.M. Husein).
0021-9797/$ – see front matter © 2007 Published by Elsevier Inc.doi:10.1016/j.jcis.2007.08.044
composition of the corresponding precursor. Water-in-oil (w/o)microemulsions, or reverse micelles, serve as an alternative insitu preparation technique for ultradispersed nanoparticle cata-lysts starting from their water soluble precursors [1–4]. It offersan easy control over particle size, produces highly dispersednanoparticles in organic phases, and protect these particles fromagglomeration by virtue of the surfactant protective layer. Infact, it was found that (w/o) microemulsion-prepared nanoparti-cle catalysts exhibited smaller particle sizes and showed highercatalytic activity compared with the ones prepared by con-ventional techniques [8,9,14]. In general, high catalyst activityhinges on maintaining high accessible catalyst surface area. Forultradispersed catalysts, high accessible area can be attainedby minimizing particle size and maximizing particle colloidalconcentration. The condition of high colloidal concentration, inparticular, poses a challenge for microemulsion systems, since
N.N. Nassar, M.M. Husein / Journal of Colloid and Interface Science 316 (2007) 442–450 443
they inherently suffer from low solubilization/stabilization ca-pacities of the different species [15,16].
In a previous work, we studied the in situ formation of ironoxide nanoparticles in single AOT/water/isooctane microemul-sions at high loading of precursor materials [17]. The effect ofoperating and microemulsion variables on the maximum possi-ble time-independent nanoparticle concentration, nanoparticleuptake, was evaluated [17]. The current work explores the con-ditions at which the highest uptake of stable colloidal copperoxide nanoparticles can be attained. In addition, the work teststhe applicability of our previous model [17] to the uptake ofcopper oxide and provides more physical insight to the modelparameters. Copper oxide is employed as ultradispersed cat-alysts for heavy oil upgrading [1]. In addition, copper oxidenanoparticles have application in nanofluids, where high con-centration of dispersed nanoparticle is invincible for achievinghigh thermal conductivity of the base fluid [18–20].
2. Experimental
2.1. Chemicals
The following chemicals were used: AOT, dioctylsulfosucci-nate sodium salt (98%, Sigma–Aldrich Fine Chemical, ON) asthe surfactant; isooctane (HPLC grade, Fisher scientific, ON)as the oil phase; copper(II) chloride (99%, ACROS, NJ) as theprecursor salt; and sodium hydroxide (5.0 N, Alfa Aesar, ON)as the precipitating agent. All chemicals were used without fur-ther purification.
2.2. Nanoparticle synthesis
The colloidal copper oxide nanoparticles were preparedin situ by exposing AOT/water/isooctane microemulsions toCuCl2 precursor followed by addition of NaOH at a laterstage [17]. All the experiments, except the ones used to studythe effect of mixing time, were performed by mixing 20 ml vol-ume of AOT microemulsions with a specified amount of CuCl2until it completely dissolves, unless otherwise noted. A stoi-chiometric amount of NaOH was then added to the microemul-sions and the system was left to mix for 3 h at 300 rpm and25 ◦C. For the samples used to study the effect of mixing time,40 ml volume of the microemulsion was used instead, and thesamples were left to mix for 6 h.
Stock AOT microemulsions were prepared by adding AOTand distilled water to a volumetric flask and completing thevolume to the mark with isooctane. Aqueous NaOH solutionwas accounted for in the calculation of the mol ratio of wa-ter to surfactant, R. A change in R was obtained by addingdistilled water to the microemulsions before introducing any re-actant. All microemulsions were freshly prepared and opticallyclear before introducing CuCl2 powder. A complete transpar-ent greenish solution was obtained after dissolving the CuCl2.When NaOH was added to the system, the solution becamecloudy. A complete transparent bluish solution resulted aftershaking for 1 min. The system was left to mix for 3 h af-ter the addition of NaOH, unless otherwise noted, and excess
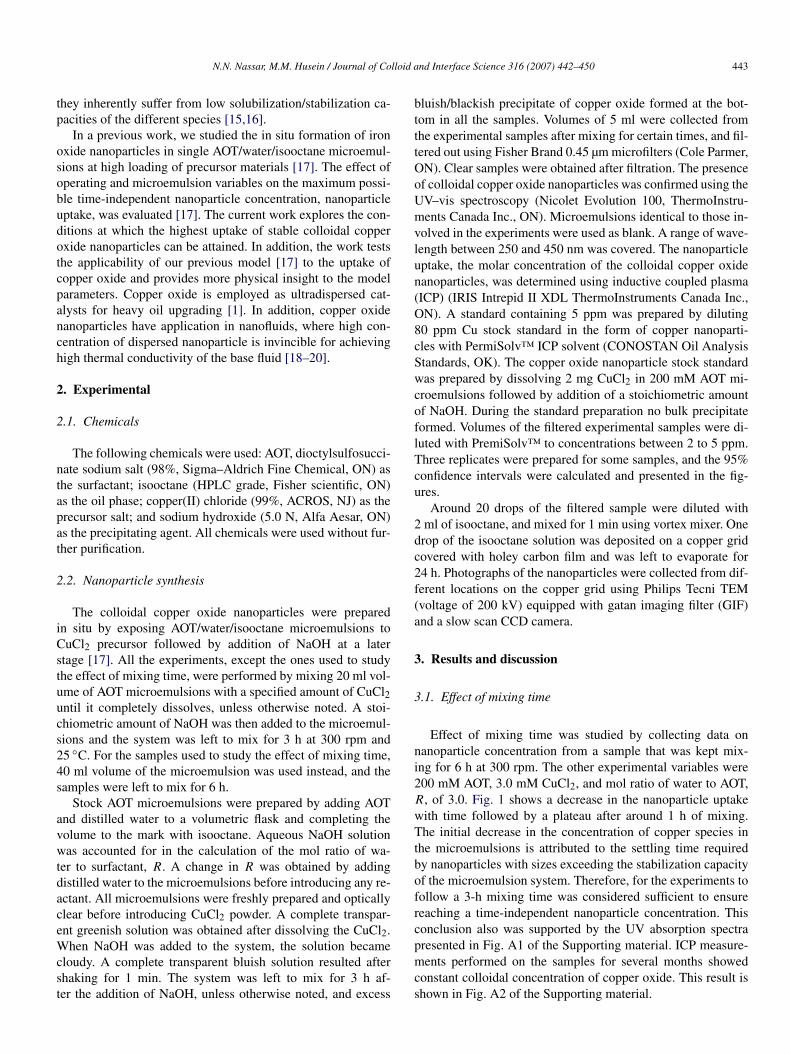
bluish/blackish precipitate of copper oxide formed at the bot-tom in all the samples. Volumes of 5 ml were collected fromthe experimental samples after mixing for certain times, and fil-tered out using Fisher Brand 0.45 µm microfilters (Cole Parmer,ON). Clear samples were obtained after filtration. The presenceof colloidal copper oxide nanoparticles was confirmed using theUV–vis spectroscopy (Nicolet Evolution 100, ThermoInstru-ments Canada Inc., ON). Microemulsions identical to those in-volved in the experiments were used as blank. A range of wave-length between 250 and 450 nm was covered. The nanoparticleuptake, the molar concentration of the colloidal copper oxidenanoparticles, was determined using inductive coupled plasma(ICP) (IRIS Intrepid II XDL ThermoInstruments Canada Inc.,ON). A standard containing 5 ppm was prepared by diluting80 ppm Cu stock standard in the form of copper nanoparti-cles with PermiSolv™ ICP solvent (CONOSTAN Oil AnalysisStandards, OK). The copper oxide nanoparticle stock standardwas prepared by dissolving 2 mg CuCl2 in 200 mM AOT mi-croemulsions followed by addition of a stoichiometric amountof NaOH. During the standard preparation no bulk precipitateformed. Volumes of the filtered experimental samples were di-luted with PremiSolv™ to concentrations between 2 to 5 ppm.Three replicates were prepared for some samples, and the 95%confidence intervals were calculated and presented in the fig-ures.
Around 20 drops of the filtered sample were diluted with2 ml of isooctane, and mixed for 1 min using vortex mixer. Onedrop of the isooctane solution was deposited on a copper gridcovered with holey carbon film and was left to evaporate for24 h. Photographs of the nanoparticles were collected from dif-ferent locations on the copper grid using Philips Tecni TEM(voltage of 200 kV) equipped with gatan imaging filter (GIF)and a slow scan CCD camera.
3. Results and discussion
3.1. Effect of mixing time
Effect of mixing time was studied by collecting data onnanoparticle concentration from a sample that was kept mix-ing for 6 h at 300 rpm. The other experimental variables were200 mM AOT, 3.0 mM CuCl2, and mol ratio of water to AOT,R, of 3.0. Fig. 1 shows a decrease in the nanoparticle uptakewith time followed by a plateau after around 1 h of mixing.The initial decrease in the concentration of copper species inthe microemulsions is attributed to the settling time requiredby nanoparticles with sizes exceeding the stabilization capacityof the microemulsion system. Therefore, for the experiments tofollow a 3-h mixing time was considered sufficient to ensurereaching a time-independent nanoparticle concentration. Thisconclusion also was supported by the UV absorption spectrapresented in Fig. A1 of the Supporting material. ICP measure-ments performed on the samples for several months showedconstant colloidal concentration of copper oxide. This result isshown in Fig. A2 of the Supporting material.

444 N.N. Nassar, M.M. Husein / Journal of Colloid and Interface Science 316 (2007) 442–450
Fig. 1. Nanoparticle uptake as a function of mixing time obtained when mix-ing a stoichiometric amount of CuCl2-containing microemulsions: {[AOT] =200 mM, R = 3.0, [CuCl2] = 3.0 mM} with NaOH at 300 rpm and 25 ◦C.
Fig. 2. Nanoparticle uptake as a function of AOT concentration obtainedwhen mixing a stoichiometric amount of CuCl2-containing microemulsions:{[CuCl2] = 3.0 mM, R = 3.0} with NaOH for 3 h at 300 rpm.
3.2. Effect of surfactant concentration
At fixed R value, increasing surfactant concentration in-creases the population of reverse micelles in the organicphase [21], and hence, is expected to increase the nanoparti-cle uptake. The effect of increasing AOT concentration wasinvestigated at R = 3.0. The concentration of CuCl2 in themicroemulsion was maintained constant at 3.0 mM and thestoichiometric amount of NaOH was used. Fig. 2 presents thecopper oxide nanoparticle uptake as a function of surfactantconcentration. The UV-absorption spectra of the colloidal cop-
Fig. 3. UV-absorption spectra of colloidal copper oxide nanoparticles obtainedwhen mixing a stoichiometric amount of CuCl2-containing microemulsions{[CuCl2] = 3.0 mM, R = 3.0, (a) [AOT] = 100 mM, (b) [AOT] = 200 mM,(c) [AOT] = 300 mM} with NaOH for 3 h at 300 rpm.
per oxide nanoparticles for 100, 200, and 300 mM AOT aredepicted in Fig. 3. The TEM photographs and the correspond-ing particle size distribution histograms for the same samplesare shown in Figs. 4a–4c.
Fig. 2 shows that, at constant R, the nanoparticle uptakeincreased linearly as the surfactant concentration increased.A similar trend was reported in the literature for nanoparti-cle uptake by single microemulsions [22,23]. Fig. 3 shows anincrease in the UV-absorption peaks as the surfactant concen-tration increased; consistent with the increase in the nanopar-ticle uptake as measured by the ICP. The TEM photographspresented in Figs. 4a–4c show an increase in the nanoparticlesize as the surfactant concentration increased. A similar trend innanoparticle size with increasing surfactant concentration wasreported in the literature [22–24]. Increasing the surfactant con-centration at fixed R increased the uptake due to the increase inthe population of the host reverse micelles in the organic phase.Higher nanoparticle uptake increased the rate of collisions andthe probability of aggregation between nanoparticle-populatedreverse micelles, which led to the formation of larger particles.
Table 1 provides information on the Cu2+ mean occupancynumber, before addition of aqueous NaOH, and the surfacearea provided by the stabilized nanoparticles. The mean ionoccupancy number in Table 1 shows the high CuCl2 load-ing involved in this work. The surface area per gram of thestabilized nanoparticles and the surface area per liter of themicroemulsions are very relevant to ultradispersed catalysis.The surface area per gram of colloidal nanoparticles listedin Table 1 is much higher than the literature values for sup-ported catalysts [14,25]. Even though larger surface area pergram of colloidal nanoparticles was obtained at lower surfac-tant concentration, larger surface area per unit volume of themicroemulsion was obtained at higher uptake. A 67% increase

N.N. Nassar, M.M. Husein / Journal of Colloid and Interface Science 316 (2007) 442–450 445
Fig. 4. TEM photographs and the corresponding particle size distribution histograms obtained when mixing a stoichiometric amount of CuCl2-containing mi-croemulsions {[CuCl2] =


N.N. Nassar, M.M. Husein / Journal of Colloid and Interface Science 316 (2007) 442–450 447
Fig. 7. TEM photographs and the corresponding particle size distribution histograms obtained when mixing a stoichiometric amount of CuCl2-containing mi-croemulsions {[CuCl2] = 3.0 mM, [AOT] = 200 mM, (a) R = 2.0; (b) R = 3.0; (c) R = 5.0} with NaOH for 3 h at 300 rpm.
ature trend [33,34]. In order to appreciate the high reactantloading involved in this study, one should compare occupancynumbers pertaining to R = 5.0 and the first entry of Table 1,where no bulk precipitation occurred. A comparison betweenthe nanoparticle uptake for R = 3.0 and R = 5.0, almost tripled,and the corresponding values of surface area per unit volume ofthe microemulsion, slightly increased, indicates that nanoparti-cle size and concentration both impact the ultradispersed cat-alyst surface area. At higher uptake, aggregation reduced thesurface area per gram of catalyst.
3.4. Effect of precursor salt concentration
An increase in the ionic strength of the water pool inducesdramatic changes in the microemulsion structure changing itfrom Winsor type IV over a Winsor type I to a Winsor type III toa Winsor type II [35,36]. In the current investigation we limitedthe effect of the ionic strength on nanoparticle size and uptaketo Winsor type IV reverse micellar structure. The concentra-tion of CuCl2 in the microemulsion was increased from 1.1 to6.0 mM, at constant mol ratio of NaOH to CuCl2 of 2.0, for asurfactant concentration of 200 mM and R of 3.0.
Fig. 8 shows an increase in the nanoparticle uptake and Fig. 9shows a corresponding increase in the size of the UV-absorptionpeaks as CuCl2 concentration increased. This increase in the
Fig. 8. Nanoparticle uptake as a function of CuCl2 concentration obtainedwhen mixing a stoichiometric amount of CuCl2-containing microemulsions{R = 3.0, [AOT] = 200 mM} with NaOH for 3 h at 300 rpm.
nanoparticle uptake is associated with an increase in the parti-cle size as evident from the TEM photographs of Figs. 10a–10c.The increase in the nanoparticle uptake as the concentration ofCuCl2 increased can be attributed to the increase of the cop-

448 N.N. Nassar, M.M. Husein / Journal of Colloid and Interface Science 316 (2007) 442–450
Fig. 9. UV-absorption spectra of colloidal copper oxide nanoparticles obtainedwhen mixing a stoichiometric amount of CuCl2-containing microemulsions{[AOT] = 200 mM, R = 3.0, (a) [CuCl2] = 1.1 mM; (b) [CuCl2] = 3.0 mM;(c) [CuCl2] = 4.0 mM} with NaOH for 3 h at 300 rpm.
per ion occupancy number and the subsequent improvement ofintramicellar nucleation and growth [21,37]. However, furtherincrease in the CuCl2 concentration resulted in the formation ofa turbid system indicating a shift in Winsor equilibrium towardsWinsor type II as a result of increase in ionic strength [38]. Asimilar trend was reported in our previous study [17], however,the system could stabilize higher amount of iron oxide nanopar-ticles. Again, this suggests higher interaction between the AOThead groups and the colloidal iron based nanoparticles.
Table 1 shows that a three-fold increase in CuCl2 loading re-sulted in approximately a two-fold increase in the nanoparticleuptake and a 50% increase in the surface area per unit volume ofthe microemulsions. A small reduction in the surface area pergram of the nanoparticles accompanied the increase in CuCl2loading, because particle aggregation was limited by the rigidsurfactant layer [22,23].
3.5. Modeling
In our previous study we have introduced a mathematicalmodel to describe the effect of microemulsion variables on ironoxide nanoparticle uptake by AOT/water/isooctane microemul-sions [17]. The model finds its roots in the empirical equa-tions describing the linear relationship between water uptakeby Winsor type II microemulsions and surfactant concentra-
Fig. 10. TEM photographs and the corresponding particle size distribution histograms obtained when mixing a stoichiometric amount of CuCl2-containing mi-croemulsions {[AOT] = 200 mM, R = 3.0, (a) [CuCl2] = 1.1 mM; (b) [CuCl2] = 3.0 mM; (c) [CuCl2] = 4.0 mM} with NaOH for 3 h at 300 rpm.

N.N. Nassar, M.M. Husein / Journal of Colloid and Interface Science 316 (2007) 442–450 449
Table 2Values of the fitted parameters for copper and iron oxide colloidal nanoparticles
Material β1 × 10³ β2a β3
Copper oxide 2.00 0.584 −0.104Iron oxidea 2.60 0.584 −0.073
a Ref. [17].
tion [39,40]. As evident from the experimental results, nanopar-ticle uptake by Winsor type IV microemulsions varied linearlywith the surfactant concentration as well. Following our previ-ous model, copper oxide nanoparticle uptake can be presentedas a function of the precursor salt concentration, surfactant con-centration, and R according to (E1) below. More details on themodel derivation are presented in the Supporting material.
(E1)Nup = β1Cβ2
(β3R
2 + R)[AOT],
where β1, β2 and β3 are fitted parameters, C is the precursorsalt concentration in the microemulsion (mM), R is the waterto surfactant mol ratio, and [AOT] is the surfactant concentra-tion in the microemulsion (mM). The value of β2 in Eq. (E1)was obtained from our previous investigation involving iron ox-ide nanoparticle uptake by the same microemulsions, while β1and β3 were obtained from fitting Eq. (E1) to the experimen-tal results in Figs. 2, 5 and 8. The values of β’s of the currentand the previous study are compared in Table 2. The model fitis excellent and the difference between the model fit and theexperimental results falls within the experimental error indi-cated by the typical 95% confidence intervals in Fig. 1. Fromthe above analysis, it can be concluded that β2 is microemul-sion specific, while β1 and β3 reflect the effect of ionic strengthand amount of water on the degree of interaction between thesurfactant head groups and the stabilized nanoparticles. Copperoxide has lower value of β1 than iron oxide since the interactionbetween the copper oxide nanoparticles and the surfactant headgroups is lower. The lower value of β3 for copper oxide furthersupports the conclusion of higher interaction between iron ox-ide nanoparticles and the surfactant head groups. The value ofthe inverse of the slope of the straight line in Fig. 2 suggeststhat 130 mol of AOT is required to stabilized 1 mol of cop-per oxide nanoparticles, while in our previous study 85 mol ofAOT were required to stabilize 1 mol of iron oxide [17]. Themodel captures the optimum value of R which corresponded tothe highest copper oxide uptake. This value is smaller whencompared with iron oxide uptake. This, again, supports theconclusion of higher interaction between the surfactant headgroups and iron oxide nanoparticles inferred from the experi-ments.
4. Conclusions
This work demonstrated the use of single microemulsion ap-proach for in situ preparation of colloidal copper oxide nanopar-ticles. Microemulsions are excellent media for the prepara-tion of highly stable ultradispersed catalyst, however, they suf-fer from low stabilization capacity of colloidal nanoparticles,which leads to lower values of accessible catalyst surface area.
The current work tested the maximum possible time-invariantcolloidal concentration, nanoparticle uptake, of copper oxide,by overloading the microemulsion system with excess cop-per oxide product. The microemulsion and operation variableswhich favored high uptake were identified. In addition, thisstudy tested the applicability of a previous model developedto describe iron oxide nanoparticle uptake by the same mi-croemulsions and provided more insight on the physical in-terpretation of the model parameters. The nanoparticle uptakewas found to be dependent on the ionic strength of the wa-ter pools and the degree of interaction between the surfactanthead groups and the stabilized nanoparticles. The water contentof the microemulsions impacted the two parameters simultane-ously. A time-independent concentration, uptake, was achievedafter 1 h of mixing, and the colloidal nanoparticles were sta-ble for more than two months. At constant value of R, theincrease in the surfactant concentration increased the popula-tion of the reverse micelles and resulted in higher nanoparticleuptake and larger particle size. The increase of the particle sizewas attributed to aggregation as a result of higher probabilityof collision between nanoparticle-populated reverse micelles.An optimum R value corresponding to a maximum copperoxide nanoparticle uptake was obtained at R of 5.0. At rela-tively low R, increasing R increased the nanoparticle uptakedue to the increase of the size of reverse micelle and the sol-ubilization capacity of CuCl2. Further increase in R reducedthe nanoparticle uptake by decreasing the interaction betweenthe surfactant head groups, the ionic strength of the water poolsand the rigidity of the surfactant layer. Lower interaction withthe stabilized nanoparticles coupled with less rigid surfactantlayer promote particle aggregation and precipitation of par-ticles with sizes exceeding the stabilization capacity of themicroemulsion. The nanoparticle uptake and particle size in-creased as the concentration of CuCl2 in the microemulsionsincreased. This was attributed to the increase in precursor ionoccupancy number and the rigidity of surfactant layer. Higheroccupancy number coupled with rigid layer promotes intrami-cellar nucleation and growth and contributes to higher uptake.At the same experimental conditions, AOT microemulsions canstabilize less colloidal copper oxide nanoparticles when com-pared with colloidal iron oxide nanoparticles. This is believedto be due to a higher interaction between AOT head groupsand iron oxide nanoparticles. A mathematical model, which ac-curately described the nanoparticle uptake as a function of R,precursor concentration, and surfactant concentration was eval-uated. The model agreed well with the experimental results.Critical evaluation of the experimental results and the modelparameters further supported the higher interaction between thesurfactant head groups and the stabilized iron oxide nanoparti-cles.
Surface areas per gram of catalyst were higher than theliterature values. Higher nanoparticle uptake corresponded tohigher accessible area per unit volume of the microemulsion.Nonetheless, particle aggregation at high uptake and low sur-factant layer rigidity limited the surface area per unit volume ofthe microemulsion.

450 N.N. Nassar, M.M. Husein / Journal of Colloid and Interface Science 316 (2007) 442–450
Acknowledgments
The authors thank the following organizations for the finan-cial support: Natural Science and Engineering Research Coun-cil of Canada (NSERC), Alberta Ingenuity Centre for In SituEnergy (AICISE), Centre for Environmental Engineering Re-search and Education (CEERE), and Alberta Ingenuity Fund.N. Nassar gratefully acknowledges Ursula and Herbert Zand-mer, and J.B. Hyne for their awards.
Supporting material
Supplementary material for this article may be found, onScienceDirect, in the online version.
Please visit DOI: 10.1016/j.jcis.2007.08.044.
References
[1] A.D. Bianco, N. Panarit, S.D. Carlo, J. Elmouchnino, B. Fixari, P.L.Perchec, Appl. Catal. A 94 (1993) 1–16.
[2] A.D. Bianco, N. Panariti, S.D. Carlo, P.L. Beltrame, P. Carnit, Energy Fu-els 8 (1994) 593–597.
[3] R.R. Anderson, B.C. Bockrath, Fuel 63 (1984) 329–333.[4] D.E. Herrick, J.W. Tieney, I. Wender, G.P. Huffman, F.E. Huggins, Energy
Fuels 4 (1990) 231–236.[5] A. Martino, J.P. Wilcoxon, J.S. Kawola, Energy Fuels 8 (1994) 1289–
1295.[6] M. Boutonnet, J. Kizling, V. Mintsa-Eya, A. Choplin, R. Touroude,
G. Maire, P.J. Stenius, J. Catal. 103 (1987) 95–104.[7] M. Boutonnet, J. Kizling, R. Touroude, G. Maire, P. Stenius, Appl.
Catal. 20 (1986) 163–177.[8] J. Rymes, G. Ehret, L. Hilaire, M. Boutonnet, K. Jiratova, Catal. Today 75
(2002) 297–303.[9] S. Nassos, E.E. Svensson, M. Nilsson, M. Boutonnet, S. Jaras, Appl. Catal.
B 64 (2006) 96–102.[10] J. Agrell, K. Hasselbo, K. Jansson, S.G. Jaras, M. Boutonnet, Appl. Catal.
A 211 (2001) 239.[11] M. Kishida, K. Umakoshi, J. Ishiyama, H. Nagata, K. Wakabayashi, Catal.
Today 29 (1996) 355.[12] C.W. Curtis, J.L. Pellegrino, Energy Fuels 3 (1989) 160–168.[13] L. Shen, P.E. Laibinis, T.A. Hatton, Langmuir 15 (1999) 447–453.[14] T. Masui, K. Fujiwara, K. Machida, G. Adachi, Chem. Mater. 9 (1997)
2197–2204.[15] M.M. Husein, M.E. Weber, J.H. Vera, Langmuir 16 (2000) 9159–9167.
[16] K. Holmberg, Adv. Colloid Interface Sci. 51 (1994) 137–174.[17] N. Nassar, M. Husein, Langmuir (2007), in press.[18] Y. Hwang, J.K. Lee, C.H. Lee, Y.M. Jung, S.I. Cheong, C.G. Lee, B.C. Ku,
S.P. Jang, Thermochim. Acta 455 (2007) 70–74.[19] P. Keblinski, J.A. Eastman, D.G. Cahill, Mater. Today 8 (2005) 36–44.[20] J.A. Eastman, S.U.S. Choi, S. Li, W. Yu, L.J. Thompson, Appl. Phys. Lett.
78 (2001) 718.[21] M.P. Pileni, J. Phys. Chem. 97 (1993) 6961–6973.[22] M. Husein, E. Rodil, J.H. Vera, Langmuir 22 (2006) 2264–2272.[23] M. Husein, E. Rodil, J.H. Vera, J. Colloid Interface Sci. 288 (2005) 457–
467.[24] N. Nassar, M. Husein, Phys. Status Solidi A 203 (2006) 1324–1328.[25] S. Hingorani, V. Pillai, P. Kumar, M.S. Multani, D.O. Shah, Mat. Res.
Bull. 28 (1993) 1303–1308.[26] M. Zulauf, H.-F. Eicke, J. Phys. Chem. 83 (1979) 480–486.[27] M.P. Pileni, T. Zemb, C. Petit, Chem. Phys. Lett. 118 (1985) 414–420.[28] J. Eastoe, B.H. Robinson, A.J.W.G. Visser, D.C. Steytler, J. Chem. Soc.
Faraday Trans. 87 (1991) 1899–1903.[29] F. Debuigne, L. Jeunieau, M. Wiame, J.B. Nagy, Langmuir 16 (2000)
7605–7611.[30] B.J. Palla, D.O. Shah, P. Garcia-Casillas, J. Matutes-Aquino, J. Nanopart.
Res. 1 (1999) 215–221.[31] V. Pillai, P. Kumar, M. Hou, P. Ayyub, D. Shah, Adv. Colloid Interface
Sci. 55 (1995) 241–269.[32] M.A. Lopez-Quintela, J. Rivas, J. Colloid Interface Sci. 158 (1993) 446–
451.[33] R.P. Bagwe, K.C. Khilar, Langmuir 13 (1997) 6432–6438.[34] R.P. Bagwe, K.C. Khilar, Langmuir 16 (2000) 905–910.[35] P. Guering, B. Lindman, Langmuir 1 (1985) 464–468.[36] J. Sjoblom, R. Skurtveit, J.O. Saeten, B. Gestblom, J. Colloid Interface
Sci. 141 (1991) 329–337.[37] A. Taleb, C. Petit, M.P. Pileni, Chem. Mater. 9 (1997) 950–959.[38] H.R. Rabie, D. Helou, M.E. Webber, J.H. Vera, J. Colloid Interface Sci.
189 (1997) 208–215.[39] H.R. Rabie, M.E. Weber, J.H. Vera, J. Colloid Interface Sci. 174 (1995)
1–9.[40] H.R. Rabie, J.H. Vera, Fluid Phase Equilib. 122 (1996) 169–186.
Further reading
[41] M.M. Husein, E. Rodil, J.H. Vera, J. Nanopart. Res. 9 (2006) 787–796.[42] Y. Zhao, J.-J. Zhu, J.-M. Hong, N. Bian, H.-Y. Chen, Eur. J. Inorg. Chem.
(2004) 4072–4080.[43] R.M. Cornell, U. Schwertmann, The Iron Oxides: Structure, Properties,
Occurrences, and Uses, second ed., Wiley–VCH, New York, 2003.[44] S. Mann, J.P. Hannington, J. Colloid Interface Sci. 122 (1988) 326–335.