EFFECT OF MEMANTINE ON RESTING STATE DEFAULT … · EFFECT OF MEMANTINE ON RESTING STATE DEFAULT...
32
EFFECT OF MEMANTINE ON RESTING STATE DEFAULT MODE NETWORK ACTIVITY IN ALZHEIMER’S DISEASE Lorenzi Marco 1,2 , Beltramello Alberto 3 , Mercuri Nicola Biagio 4 , Canu Elisa 1 , Zoccatelli Giada 3 , Pizzini Francesca Benedetta 3 , Alessandrini Franco 3 , Cotelli Maria 5 , Rosini Sandra 5 , Costardi Daniela 1 , Caltagirone Carlo 4 , Frisoni Giovanni Battista 1 . 1 Laboratory of Epidemiology, Neuroimaging and Telemedicine -LENITEM-, Istituto di Ricerca e Cura a Carattere Scientifico San Giovanni di Dio Fatebenefratelli, Brescia, Italy; 2 Project Asclepios, Institut national de recherche en informatique et automatique (INRIA), Sophia Antipolis, France; 3 Service of Neuroradiology, Ospedale Maggiore, Borgo Trento, Verona, Italy; 4 Fondazione Istituto di Ricerca e Cura a Carattere Scientifico, Santa Lucia, Università Tor Vergata, Rome, Italy; 5 Cognitive Neuroscience Section, Istituto di Ricerca e Cura a Carattere Scientifico San Giovanni di Dio Fatebenefratelli, Brescia, Italy; Warning This version of the manuscript is previous to the review procedure. The work has been accepted and will be soon published by the journal Drugs and Aging. 1
Transcript of EFFECT OF MEMANTINE ON RESTING STATE DEFAULT … · EFFECT OF MEMANTINE ON RESTING STATE DEFAULT...

EFFECT OF MEMANTINE ON RESTING STATE DEFAULT MODE NETWORK
ACTIVITY IN ALZHEIMER’S DISEASE
Lorenzi Marco1,2, Beltramello Alberto3, Mercuri Nicola Biagio4, Canu Elisa1, Zoccatelli Giada3,
Pizzini Francesca Benedetta3, Alessandrini Franco3, Cotelli Maria5, Rosini Sandra5, Costardi
Daniela1, Caltagirone Carlo4, Frisoni Giovanni Battista1.
1Laboratory of Epidemiology, Neuroimaging and Telemedicine -LENITEM-, Istituto di Ricerca e
Cura a Carattere Scientifico San Giovanni di Dio Fatebenefratelli, Brescia, Italy; 2Project
Asclepios, Institut national de recherche en informatique et automatique (INRIA), Sophia Antipolis,
France; 3Service of Neuroradiology, Ospedale Maggiore, Borgo Trento, Verona, Italy; 4Fondazione
Istituto di Ricerca e Cura a Carattere Scientifico, Santa Lucia, Università Tor Vergata, Rome,
Italy; 5Cognitive Neuroscience Section, Istituto di Ricerca e Cura a Carattere Scientifico San
Giovanni di Dio Fatebenefratelli, Brescia, Italy;
Warning
This version of the manuscript is previous to the review procedure. The work has been accepted and will be soon published by the journal Drugs and Aging.
1

Abstract
Background. Memantine is an approved symptomatic treatment for moderate to severe Alzheimer’s
Disease(AD) active on the excitotoxic effects of hyperactive glutamatergic transmission. The
mechanism of the effect of memantine in AD patients is poorly known. The default mode network
(DMN) is hypoactive in AD and is under glutamatergic control.
Objective. To assess the effect of memantine on the activity of the DMN in moderate to severe AD.
Methods. fMRI data of 15 moderate to severe AD patients, 7 (age 77±7, MMSE 16±4) treated with
memantine and 8 with placebo (age 75±6, MMSE 13±4), were acquired at baseline (T0) and after 6
months of treatment (T6). Resting state components were extracted after spatial normalization on
individual patients with independent component analysis. The consistency of the components was
assessed using ICASSO and the DMN was recognized through spatial correlation with a pre-
defined template. Voxel-based statistical analyses were performed to study the change of DMN
activity from T0 to T6 in the two groups.
Results. At T0, the two groups showed similar DMN activity except in the precuneus, where the
treated showed slightly greater activity (p<0.05 corrected for family wise error). The prospective
comparison between T0 and T6 in the treated showed increased DMN activation mapping to the
precuneus (p<0.05 corrected), while the prospective comparison in the untreated did not show
significant changes. The treatment x time interaction term was significant at p<0.05 corrected.
Conclusions. The results suggest a positive effect of Memantine treatment in moderate to severe
AD patients resulting in an increased resting activity in the precuneus region over 6 months. Future
confirmatory analysis with adequately powered studies will be required to support the present
findings.
2

Disclosure/Conflict of Interest
This work has been co-funded by research grant N. 125/2004 of the Italian Ministry of Health,
Ricerca Finalizzata “Malattie neurodegenerative legate all’invecchiamento: dalla patogenesi alle
prospettive terapeutiche per un progetto traslazionale” and by an unrestricted grant by Lundbeck
Italia SpA Pharmaceutical.
Marco Lorenzi, Alberto Beltramello, Mercuri N Biagio, Elisa Canu, Giada Zoccatelli, Benedetta F
Pizzini, Franco Alessandrini, Maria Cotelli, Sandra Rosini, Daniela Costardi, and Carlo Caltagirone
have no conflicts of interest to declare.
Giovanni B Frisoni has received fees for scientific consultations from Lundbeck international.
Acknowledgements
The authors are very grateful to Dr. Melissa Romano1 for her precious organizational contribution
on the realization and progression of the study, and to Dr. Chiara Barattieri1 for her contribution in
the proof reading of the manuscript. We wish to thank the patients and their families for their
persisting and admirable collaboration.
1Laboratory of Epidemiology, Neuroimaging and Telemedicine -LENITEM-, Istituto di Ricerca e
Cura a Carattere Scientifico San Giovanni di Dio Fatebenefratelli, Brescia, Italy;
3
List of abbreviations used:
fMRI: functional Magnetic Resonance Imaging
BOLD: blood oxygenation level-dependent fMRI signal
CONSORT: Consolidated Standards Of Reporting Trials
DMN: Default Mode Network
FWE: Family Wise Error correction for multiple comparisons
GIFT: Group ICA for fMRI Toolbox
ICA: Independent Component Analysis
ICASSO: software for investigating the reliability of ICA estimates by clustering and visualization
MMSE: Mini Mental State Examination
NMDA: N-methyl D-aspartate
SPM5: Statistical Parametric Mapping software (version 5)
TIA: Transient Ischemic Attack
4
Introduction
Clinical studies have shown that memantine, a non-competitive NMDA receptor antagonist,
improves cognitive function in Alzheimer’s Disease (AD) [1] and, if taken in conjunction with
other treatments, can produce at least temporary slowing of the progression of moderate to severe
Alzheimer’s patients .[2] Measurable benefits were observed in several clinical trials on cognitive
performance, behaviour, and daily function.[3-5]
The effect of memantine in the brain has been investigated recently in a multimodal study [6] where
glucose metabolism was studied with 18F–FDG positron emission tomography (PET), and total
brain and hippocampal volumes were assessed with high resolution magnetic resonance (MR)
imaging. After 52 weeks follow-up, the patients on memantine showed a lower rate of hippocampal
atrophy (-41%) compared to placebo, together with lower rates of metabolic deterioration.
It is generally believed that normal glutamate receptor activity has a crucial role in the function of
the nervous system and is the major mediator of physiological excitatory synaptic transmission in
the brain. In particular, in some areas of the brain, normal NMDA receptor activity is important for
learning, memory as well as for wakefulness and attention. Therefore, if NMDA receptor activity is
impaired, inattention, drowsiness and even coma can result.
The mechanism of action of memantine involves the blockade of the toxic effect of excess
glutamate on NMDA receptors, by restoring the physiological balance (homeostasis) of the
glutamatergic system. The result is an enhancement of the physiological excitatory synaptic signal
over a pathological background “noise”. Treatment with memantine has been found to normalize
neuronal plasticity and improve performance on behavioural tests, memory and learning in animal
and human studies ([7] for a detailed review).
Recently, alternative accounts for the therapeutic effect of memantine have been proposed,
according to which dopamine receptors [8] and neurons [9] might be involved. The dopamine
system plays a key role in attentive circuits, it is implicated in attention-deficit/hyperactivity
disorder (ADHD), [10,11] and might be involved in the development of adverse effects such as
hallucinations during treatment with memantine in AD patients.[12]
In healthy persons, attention is closely related to the activity of the so called default mode resting
state network (DMN), whose presence and function has been elucidated thanks to functional MRI at
rest.[13] The DMN is the most stable among the networks of brain regions active when the brain is
5

not engaged in specific tasks, i.e. in resting wakeful state, and it is characterized by coherent low
frequency oscillations of the BOLD signal at 0.01-0.1 Hz mapping to the posterior cingulate,
precuneus, parietal, medial prefrontal cortex, and hippocampal formation.
The DMN is thought to serve as a binding mechanism between internal and external attention [14]
and represents the self-referential and introspective mental activity.[15] The DMN also plays a
fundamental role in the transition from rest to task, acting in interplay with task-specific temporally
anti-correlated networks, and underlies the ability to achieve and maintain the attentional focus.[16]
Attention has been given to the studies on DMN in the progression of Alzheimer’s pathology:
several studies have shown alterations in posterior cingulate and medial temporal lobe [17] and,
more generally, a peculiar functional disruption believed to reflect the underlying neuropathological
changes.[18,19]
Recently, the hypothesis of the involvement of the DMN in AD has been reversed. A causal role of
the DMN in the pathophysiology of AD has been hypothesized, based on the observations that in
AD the structural and metabolic damage largely maps to the DMN region. In an interesting work
[20] it was introduced the cascade hypothesis: the functional resting activity changes and the
associated levels of metabolism could antedate and cause the amyloid deposition, to finally lead to
structural and functional damage.
The above evidence leads to hypothesize that the beneficial effect of memantine on the cognitive
performance of AD patients might be mediated by an effect on the activity of the DMN. Aim of this
study is to investigate the effect of memantine on DMN activity in AD patients by means of novel
imaging tools, independent component analysis and voxel brain morphometry.
6
Materials and Methods
Subjects. The study population consisted of 15 patients with moderate to severe probable AD, seen
at the IRCCS Centro S. Giovanni di Dio Fatebenefratelli, in Brescia, Italy. The trial (N. 2005-
005859-18, protcol-code: SC05-03) has been designed following the set of the Consolidated
Standards of Reporting Trials Statement (CONSORTs) recommendations, by investigating whether
the treatment with memantine offers benefits compared to non-treatment in moderate-to-severe AD.
[22,23] After baseline MR scan and clinical assessment, eight patients were randomized to
treatment, and 7 to placebo. Treated patients received as inclusion criteria Donepezil at a dose of 5
mg once a day and then raised by 5 mg per day up to 20 mg for six months, to reach a final dose of
20mg per day. Other inclusion criteria included: diagnosis of probable AD according to NINCDS-
ADRDA criteria,[24] clinical dementia rating of 2 or greater,[25] and treatment with
acetylcholinesterase inhibitors (AcheI) for at least 6 months. Finally, the only drugs permitted at
stable doses for at least 2 weeks before the recruitment were antidepressive, anti-inflammatory,
antiipertensive, vitamine E (1200 mg/day), anticoagulants, diuretics, ipnotics. Exclusion criteria
included: history of transient ischemic attack (TIA) or stroke, head trauma, alcohol or substance
abuse, corticosteroid therapy, recent weight loss, or a modified Hachinski ischemic scale score
greater than 4.[26]
Standardized history taking, behavioural and functional assessment, physical and neurological
examination were carried out for all participants. The original case report form of the clinical
assessment may be accessed at http://www.centroalzheimer.it/Public/ProtocolloMEM_T0.doc (in
Italian). Moreover, a comprehensive neuropsychological battery adequate to patients’ cognitive
impairment severity was administered at T0 and T6 and cognitive tests for: non verbal reasoning
(Raven Colored Progressive Matrices) , language comprehension (Token Test), verbal fluency
(Phonemic and Semantic fluency), short and long term memory (Digit and Spatial span; Story
Recall; Rey-Osterrieth complex figure recall), constructional abilities Rey-Osterrieth complex
figure copy), attention and executive functions (Trail Making Test).[27] Global cognitive function
was assessed with the Mini Mental State Examination (MMSE).[28] The results of cognitive
assessment are reported in Table 1.
The participant or his/her primary caregiver provided written informed consent, after discussion of
the participation risks and benefits. No compensation was provided. The study was approved by the
local ethics committee.
7

fMRI scan simulation. Before the randomization procedure took place, during the screening visit at
the IRCCS Centro S. Giovanni di Dio Fatebenefratelli, all the patients underwent an fMRI scan
simulation. This was necessary to test the patient abilities to rest, without moving, in an “unusual”
environment for the entire scan acquisition duration time (8’47”), therefore ensuring subject
comfort and data quality. In fact, although the Neuropsychiatric Inventory [29] was administered to
all caregivers, the simulation was useful to evidence behavioural complaints, such as agitation and
anxiety, not mentioned during the NPI assessment but triggered during this “unusual” situation.
Moreover, the noise produced by the scanner during the fMRI acquisition may potentially be not
tolerated by patients at such advanced stage of the disease. Last, a potential unpleasant sense of
claustrophobia experienced inside the scanner, causing prematurely terminated MRI acquisition
also in cognitively healthy people,[30] could be accentuated in people with moderate to severe AD.
The patients were asked to lie down on a bed. A semi-cylinder panel, simulating the limited space
inside the scanner, was placed in order to cover their entire body from the head to the knees. A loud
white noise, miming the scanner noise, was sent binaurally to the patients through headphones for
the entire duration of the simulation (9 minutes totally). Twelve out of twenty-eight patients that
underwent the simulation were not enrolled in the study due to evident behavioral problems during
the simulation time. The simulation failed only in one patient out of the sixteen successfully
screened. This patient complained dizziness after the first real scan and has been excluded from the
study.
MR acquisition. Resting state functional MRI were acquired at baseline (T0), and six months later
(T6), on a 3.0 T Siemens Allegra scanner at the Neuroradiology Unit of the Ospedale Maggiore
Borgo Trento, Verona, Italy, with a standard head coil. Scans were acquired with the following
acquisition protocol: TR= 2610 ms, TE= 30 ms, flip angle= 90°, gap= 10%, voxel=3x3x3 mm,
acquisition matrix=64x64, total number of slices=36, acquisition time 8’47” and anteroposterior
phase-encoding direction. Resting state sequence was acquired after the localizer and during the
acquisition the patients were lying down in the scanner with closed eyes. No cognitive or motor
tasks were performed during the session.
Image Processing. Data were preprocessed with SPM5 (Statistical Parametric Mapping, version 5;
http://www.fil.ion.ucl.ac.uk/spm/software/spm5). After motion correction performed with a 6
parameter spatial transformation and using the first image of each subject’s series as the reference
for the subsequent scan realignment, each subject’s fMRI was spatially normalized to the SPM
8

echo-planar template through a non linear transformation and smoothed with a 5x5x5-mm full
width at half-maximum Gaussian Kernel.
Functional MRI images were then divided in the four groups, placebo and memantine at T0 and T6,
in order to apply separately independent component analysis (ICA) using GIFT.[31] The ICA result
consists of a set of components extracted from the fMRI dataset representing the different
temporally coherent, maximally independent hemodynamic sources related to the BOLD signal.
Briefly, the GIFT approach is based on a preliminary Principal component analysis (PCA) data
reduction step performed on the whole dataset in order to reduce the computational load. The
complexity of each subject functional MR series is reduced through a PCA and a subsequent
reduction step is operated on the temporal concatenation of the reduced series. The result consists of
about 40 components. ICA is then performed with the Infomax algorithm on the final set and the
resulting estimated mixing matrix is used to back-reconstruct spatial maps and time courses from
the global results for each individual subject and for each component. Component intensities are
scaled to Z-scores so as to enhance the reliability of the following voxel by voxel comparisons.
Since the Infomax algorithm is an iterative process, the ICASSO tool provided by GIFT was used to
assess the consistency of the components resulting from the analysis. The process consists of 20
distinct computational runs of the ICA on the same dataset where the components are recomputed
each time and the results are compared across runs. For each component the “centroid” (i.e. the
most stable result) is determined and his consistency is expressed through a stability index ranging
from 0 to 1.[32] This operation ensures the robustness of the findings across the groups, in order to
improve the reliability of the further direct statistical comparisons.
Finally, the DMNs computed in the four groups were recognized through both visual inspection and
spatial correlation with an a priori template created using Wfu-Pickatlas,[33] a tool available as an
SPM toolbox and including posterior cingulate cortex, precuneus, medial prefrontal cortex and the
medial, lateral and inferior parietal cortex.
Statistical Analysis. Statistical analyses were carried out using the SPM5 General linear model
(GLM) on the 4 DMN sets. The significance was declared using the restrictive threshold for the p-
value of 0.05 corrected for the family wise error (FWE). Initially, for both groups placebo and
memantine, the global DMNs spatial extension at T0 was assessed through the one sample t-test
computed on the two distinct sets of DMNs obtained with ICA (Figure 1) and the two resulting
maps were used as spatial mask for the successive comparisons.
9

The comparisons at T0 and T6 between placebo and memantine groups was performed with a two
sample t-test, restricting the analysis to the mask provided by the conjunction of the DMN
activation areas previously computed. Both contrasts were used to compute the voxels of greater
activation in placebo compared to memantine and vice versa. Paired t-test was used to study within
group activation differences for the T6 images compared to the baseline and finally the overall
effect was assessed through the SPM flexible factorial model, with treatment (placebo, memantine)
and time (T0, T6) factors of interest and introducing the time x treatment interaction term.
1

Results.
The two groups were similar at baseline for all the considered sociodemographic and cognitive
features. The clinical changes measured at T6 on the same neuropsychological battery were
not significantly different from baseline (Table 1).
The ICA algorithm found 42 and 41 components respectively for Placebo and Memantine Groups at
T0, and 51 and 45 at T6. The 4 components identified as DMN via spatial correlation with the pre-
defined DMN template showed good consistency under ICASSO multiple runs test. The results
gave compact and isolated clusters for the components centroids (i.e. stable results across runs) with
stability indexes greater than 0.95.
At baseline, the Memantine group showed clusters of greater activation compared to the Placebo in
the precuneus and cuneus, assessed after correction for multiple comparison, while the opposite
comparison did not show significant results after the correction (Figure 2).
On longitudinal analysis, the paired t-test on the Memantine group showed greater activation at T6
as compared to the baseline in the right precuneus (23 voxels, p<0.05 FWE corrected –
Supplementary Figure 1). On the other hand, the Placebo group did not show any statistically
significant difference in the longitudinal comparison. The treatment effect was confirmed by the
significant time x treatment interaction, mapping to the precuneus and calcarine cortex (Figure 3).
The increased activation of the Memantine group in the follow-up assessment was finally
appreciated in the direct between-group comparison at T6 (Figure 4). Again, the Memantine
subjects showed increased activation as compared to the Placebo mapping to a significant cluster in
right precuneus ( 25 voxels, p<0.05 FWE corrected).
1

1

Discussion
In this study we tested the effect of memantine on DMN activity in patients with moderate to severe
AD. The analysis was performed in two separated steps: 1) independent component analysis, to
extract the networks of interest from the functional dataset, and 2) voxel based morphometry, to
assess the areas of significant changes of activations in the longitudinal setting.
The main result was an enhancement of the resting activity after six months of treatment, mapping
primarily to the precuneus and posterior cingulate cortex. This is, to our knowledge, the first study
assessing the effectiveness of a drug developed for AD on resting state network. These results
should be interpreted in view of the neurochemical systems believed to underlie the DMN, and the
known neurochemical effects of memantine in the brain.
The energetic balance (antiglutamatergic) hypothesis.
AD is characterized by an energetic imbalance due to a gap between decreased energy availability
and raised energy demand. Increased energy requirements, associated with energy failure, cause
abnormal accumulations of glutamate,[35,36] either by impairment of uptake (into neurons and
especially astrocytes) mediated via glutamate transporters or by reversal of the direction of transport
.[37] The consequent augmentation of extracellular glutamate overstimulates NMDA receptors to
finally lead to an extended excitotoxicity.[38]
Since memantine could normalize NMDA receptor activity by blocking excessively-opened NMDA
channels,[39] it may appear counterintuitive that it causes partial restoration of the normal energetic
balance and improves the symptomatology of Alzheimer’s disease (AD).
The outlined scenario is plausible in view of human studies indicating that the glutamate-glutamine
cycle accounts for the largest part (60 to 80%) of metabolic consumption in resting human cerebral
cortex.[40, 42] Moreover, a linear 1:1 relationship between glutamate-glutamine cycle and neuronal
glucose oxidation was shown in animal studies.[43] These result suggest that the majority of
cortical energy production supports synaptic glutamatergic neuronal activity.
If, as it is believed, BOLD signal in fMRI reflects the neuronal metabolic activity, it is reasonable to
assume that the glutamate-glutamine cycle accounts for a large proportion of the BOLD fMRI
signal.[44, 46] Any interference with the glutamate cycle might thus affect both glucose oxidation
and metabolic activity. This was suggested by a study on a group of AD patients where a measure
of neuronal integrity (N-acetyl aspartate) was significantly correlated with the markers of glutamate
1

neurotransmission and glucose oxidation.[47] The authors hypothesized that the reduced glutamate
neurotransmission may affect the overall rate of glucose oxidation via impaired glia-neurons
energetic interaction, thus contributing to cognitive impairment in AD. Further studies have shown
a link between metabolic deficits and altered glutamatergic concentration in AD. Both phenomena
seem to be caused by the the beta amyloid deposition, and in vitro experiments in astrocytes have
shown an amyloid-mediated dependency.[48]
The above findings indicate that DMN activity might be an indirect measure of glutamate-mediated
metabolic activity. The effect of memantine on the regulation of the glutamatergic levels has an
impact on the brain metabolic activity, causing increased oxygen consumption and the subsequent
change detected through the BOLD signal. This hypothesis is in agreement with previous works [6],
which indicate a widespread increased glucose metabolism on the patients treated with memantine
for 52 weeks.
The above scenario helps to interpret the topographic location of the effect we found in the present
study (cuneus and posterior cingulate cortex), where early metabolic impairment in AD is earliest.
[49] A recent study investigated in these areas the longitudinal changes of the DMN in mild to
moderate AD [50], and showed significantly decreased activation over 4 years. Although these
regions are not the only areas in DMN to be rich of NMDA receptors, it appears indeed reasonable
that an effective benefits of memantine treatment could be detected mainly in those regions known
to be more affected by metabolic and functional impairment and where an improvement of the
energetic balance can be more clearly appreciated.
The dopaminergic hypothesis.
An alternative explanation comes from results of clinical studies, which suggest that the
dopaminergic effect of memantine might be responsible for the increased DMN activity. It has been
already reported that memantine enhances dopaminergic transmission via sigma receptors activation
[51] or by blocking potassium channels in dopamine (DA) neurons.[9] A protective effect of
memantine on DA function has been also suggested by a recent study on simian immunodeficiency
virus infected macaques [52] where the prevention of the DA deficit onset following from
memantine treatment was reported. This result supported the hypothesis that DA loss in SIV-
infected macaques may be due to NMDA receptor activation. Furthermore, an agonistic effect of
memantine on DA D2High receptors has been reported.[8] The importance of DA in regulating
DMN activity and, generally, resting network integrity has been suggested in.[53] These authors
1
found an impairment of the network efficiency after pharmacological blockade of DA D2 receptors,
which might be due to the role of this neurotransmitter in modulating the frequency, phase, and
spatial coherence of endogenous oscillations in the basal ganglia and cortex.
Alternative hypotheses.
It is not certainly necessary that memantine should contemporary act on both the glutamatergic and
dopaminergic systems to affect DMN activity. In theory, the exclusive change of dopaminergic
function might affect, in turn, the glutamatergic system. For instance, using transgenic mice, it has
been demonstrated that alterations in DRD4 expression can alter the Glutamatergic
neurotransmission.[54] Moreover, an alteration of the balance between the D1 and D2 receptors
could underlie the behavioural effects induced by the stimulation of the glutamatergic system.[55,
56]
Alternatively, since a role of GABA on the DMN BOLD activity has been described,[57] an effect
of memantine on GABAA receptors [58] could account for changes in DMN activity. We believe
that an effect of memantine on Abeta metabolism is unlikely in a 6-months trial.[59]
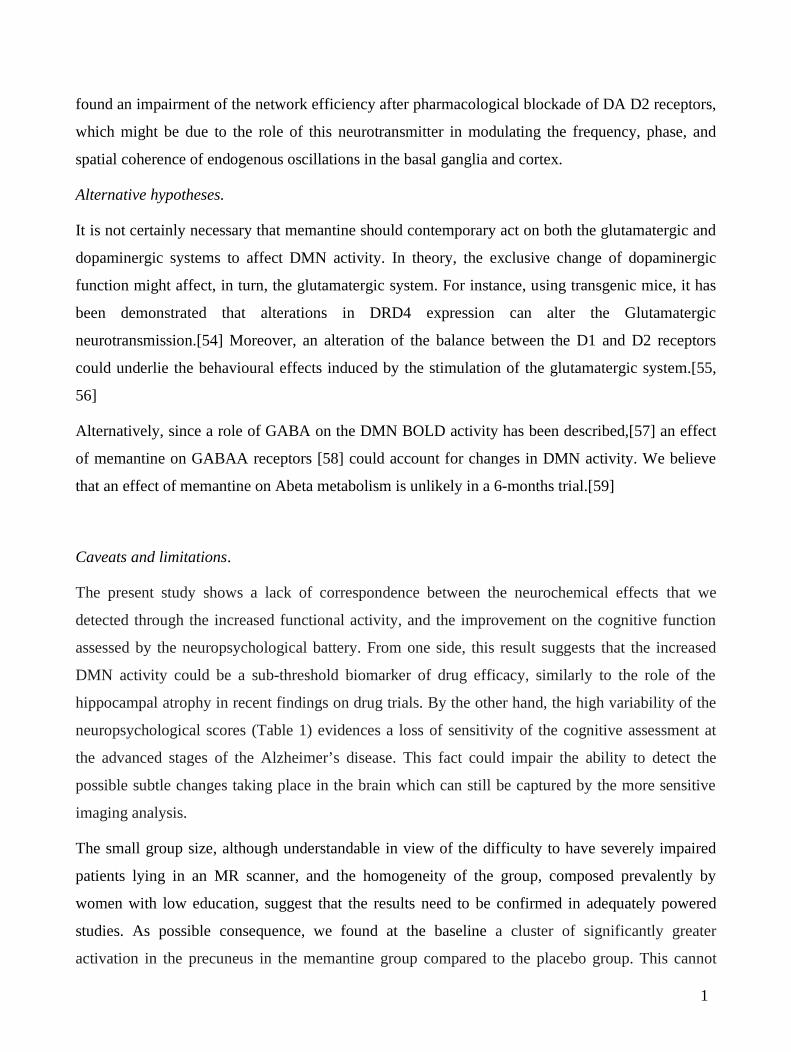
Caveats and limitations.
The present study shows a lack of correspondence between the neurochemical effects that we
detected through the increased functional activity, and the improvement on the cognitive function
assessed by the neuropsychological battery. From one side, this result suggests that the increased
DMN activity could be a sub-threshold biomarker of drug efficacy, similarly to the role of the
hippocampal atrophy in recent findings on drug trials. By the other hand, the high variability of the
neuropsychological scores (Table 1) evidences a loss of sensitivity of the cognitive assessment at
the advanced stages of the Alzheimer’s disease. This fact could impair the ability to detect the
possible subtle changes taking place in the brain which can still be captured by the more sensitive
imaging analysis.
The small group size, although understandable in view of the difficulty to have severely impaired
patients lying in an MR scanner, and the homogeneity of the group, composed prevalently by
women with low education, suggest that the results need to be confirmed in adequately powered
studies. As possible consequence, we found at the baseline a cluster of significantly greater
activation in the precuneus in the memantine group compared to the placebo group. This cannot
1

exclude that the precuneus in the subjects treated with memantine was relatively less compromised
prior to any experimental manipulation.
Although the ICA followed by the ICASSO procedure aims to provide results as much robust as
possible, a certain variability due to the algorithmic approximations could affect the related
statistical analysis. In order to confirm the above findings, a separated and additional analysis was
replied on the whole dataset using the constrained ICA algorithm.[34] This ICA approach, available
on GIFT software, uses apriori information provided by a spatial mask, in order to drive the ICA
result and computes, among the observed mixture, the closest component to the reference provided.
In our analysis the spatial information was provided by the DMN template and the resulting
components computed for the four groups were used to replicate the statistical analysis. The
components obtained with the constrained ICA approach were similar to those obtained with the
classical “blind” method and the subsequent statistical analysis showed the same patterns of
increased and decreased activation (data not shown).
Finally, both ICA and voxel based morphometry are highly exploratory analysis. As a consequence,
the results provided in the present work should be interpreted as new hypothesis to be tested in
future and more focused studies.
To conclude, although the present analysis should be seen as a preliminary and exploratory study
for the assessment of the benefits of the drug directly on functional activity, we believe that the
emerging evidences could add new insights and hypothesis for the understanding of the memantine
action in the brain as well as the patho-physiological mechanisms of AD. New analysis of the effect
of memantine on the others resting state networks and, more generally, on the global connectivity,
are currently under study.
1

References
1- Areosa SA, Sherriff F. Memantine for dementia. Cochrane Database Syst Rev. 2005; (3)
CD003154.
2- Lopez OL, Becker JT, Wahed AS, Saxton J, Sweet RA, Wolk DA, et al. Long-term effects of the
concomitant use of memantine with cholinesterase inhibition in Alzheimer disease 2009. J Neurol
Neurosurg Psychiatry. 80(6): 600-7
3- Peskind ER, Potkin SG, Pomara N, Ott BR, Graham SM, Olin JT, et al, 2006. Memantine
treatment in mild to moderate Alzheimer disease: a 24-week randomized, controlled trial. Am J
Geriatr Psychiatry; 14(8):704-5
4- Tariot PN, Farlow MR, Grossberg GT, 2004. Memantine treatment in patients with moderate to
severe Alzheimer disease already receiving donepezil: a randomized controlled trial. JAMA.
291(3):317-24
5- Bakchine S, Loft H. Memantine treatment in patients with mild to moderate Alzheimer's disease:
results of a randomised, double-blind, placebo-controlled 6-month study, 2008. J Alzheimers Dis.
13(1):97-107
6- Schmidt R, Ropele S, Pendl B, Ofner P, Enzinger C, Schmidt H, et al 2008. Longitudinal
multimodal imaging in mild to moderate Alzheimer disease: a pilot study with memantine. J Neurol
Neurosurg Psychiatry. 79(12):1312-17
7- Parsons CG, Stöffler A, Danysz W, 2007. Memantine: a NMDA receptor antagonist that
improves memory by restoration of homeostasis in the glutamatergic system--too little activation is
bad, too much is even worse. Neuropharmacology. 53(6):699-723.
1

8- Seeman P, Caruso C, Lasaga M, 2008. Memantine agonist action at dopamine D2High receptors.
Synapse. 62(2): 149-53
9- Giustizieri M, Cucchiaroni ML, Guatteo E, Bernardi G, Mercuri NB, Berretta N, 2007.
Memantine inhibits ATP-dependent K+ conductances in dopamine neurons of the rat substantia
nigra pars compacta. J Pharmacol Exp Ther. 322(2):721-9.
10- Hesse S, Ballaschke O, Barthel H, Sabri O, 2009. Dopamine transporter imaging in adult
patients with attention-deficit/hyperactivity disorder. Psychiatry Res. 171(2):120-8.
11- Gilden DL, Marusich LR, 2009. Contraction of time in attention-deficit hyperactivity disorder.
Neuropsychology. 23(2):265-9.
12- Monastero R, Camarda C, Pipia C, Camarda R, 2007. Visual hallucinations and agitation in
Alzheimer's disease due to memantine: report of three cases. J Neurol Neurosurg Psychiatry.
78:546
13- Fox MD, Raichle ME, 2007. Spontaneous fluctuations in brain activity observed with
functional magnetic resonance imaging. Nat Rev Neurosci. 8(9):700-11
14- Fransson P, 2006. How default is the default mode of brain function? Further evidence from
intrinsic BOLD signal fluctuations. Neuropsychologia. 44(14):2836-45.
15- Gusnard DA, Akbudak E, Shulman GL, Raichle ME, 2001. Medial prefrontal cortex and self-
referential mental activity: Relation to a default mode of brain function. Proc Natl Acad Sci USA.
98:4259–64
1
16- Broyd SJ, Demanuele C, Debener S, Helps SK, James CJ, Sonuga-Barke EJ, 2009. Default-
mode brain dysfunction in mental disorders: A systematic review. Neurosci Biobehav Rev.
33(3):279-96
17- Rombouts S, Barkhof F, Goekoop R, Stam CJ, Scheltens P, 2005 . Altered Resting State
Networks in Mild Cognitive Impairment and Mild Alzheimer’s. Human Brain Mapping. 26:231–9
18- Liu Y, Wang K, Yu C, He Y, Zhou Y, Liang M, et al, 2008. Regional homogeneity, functional
connectivity and imaging markers of Alzheimer's disease: a review of resting-state fMRI studies.
Neuropsychologia. 46(6):1648-56
19- Greicius MD, Srivastava G, Reiss AL, Menon V, 2004. Default-mode network activity
distinguishes Alzheimer's disease from healthy aging: Evidence from functional MRI. Proc Natl
Acad Sci USA. 101: 4637– 42.
20- Buckner RL, Snyder AZ, Shannon BJ, LaRossa G, Sachs R, Fotenos AF, et al, 2005. Molecular,
structural, and functional characterization of Alzheimer's disease: Evidence for a relationship
between default activity, amyloid, and memory. The Journal of Neuroscience. 25: 7709–17.
21- Filippini N, MacIntosh BJ, Hough MG, Goodwin GM, Frisoni GB, Smith SM, et al, 2009 .
Distinct patterns of brain activity in young carriers of the APOE-epsilon4 allele. Proc Natl Acad Sci
U S A. 106(17):7209-14
22- Moher D, Schulz KF, Altman DG, 2001 . The CONSORT statement: revised recommendations
for improving the quality of reports of parallel-group randomised trials. Lancet. 357(9263):1191-94.
1
23- Altman DG, Schulz KF, Moher D, Egger M. Davidoff F, Elbourne D, Gøtzsche PC, Lang T,
2001. The revised CONSORT statement for reporting randomized trials: explanation and
elaboration. Ann Intern Med. 134(8):663-94.
24- McKhann G, Drachman D, Folstein M, Katzman R, Price D, Stadlan EM, 1984. Clinical
diagnosis of Alzheimer's disease: report of the NINCDS-ADRDA Work Group under the auspices
of Department of Health and Human Services Task Force on Alzheimer's Disease. Neurology.
34(7):939-44.
25- Morris JC. The Clinical Dementia Rating (CDR): current version and scoring rules, 1993.
Neurology.43:2412-14.
26- Rosen WG, Terry RD, Fuld PA, Katzman R, Peck A, 1980. Pathological verification of
ischemic score in differentiation of dementias. Ann Neurol. 7(5):486-88.
27- Lezak MD, Howieson DB, Loring DW, Hannay HJ, Fischer JS, 2004 . Neuropsychological
assessment (4th ed.). New York, NY, US: Oxford University Press
28- Folstein MF, Folstein SE, McHugh PR, 1975. "Mini-mental state". A practical method for
grading the cognitive state of patients for the clinician. J Psychiatr Res. 12(3):189-98
29- Cummings JL, Mega M, Gray K, Rosenberg-Thompson S, Carusi DA, Gornbein J, 1994. The
Neuropsychiatric Inventory: comprehensive assessment of psychopathology in dementia.
Neurology. 44(12):2308-14.
30- Eshed I, Althoff CE, Hamm B, Hermann KG, 2007. Claustrophobia and premature termination
of magnetic resonance imaging examinations. J Magn Reson Imaging. 26(2):401-4.
2

31- Calhoun VD, Adali T, Pearlson GD, Pekar JJ, 2001 . A method for making group inferences
from functional MRI data using independent component analysis. Hum Brain Mapp. 14(3):140-51.
32- Correa N, Adali T, Calhoun VD, 2007. Performance of blind source separation algorithms for
fMRI analysis using a group ICA method. Magn Reson Imaging. 25(5):684-94.
33- Maldjian JA, Laurienti PJ, Kraft RA, Burdette JH, 2003. An automated method for
neuroanatomic and cytoarchitectonic atlas-based interrogation of fMRI data sets. Neuroimage.
19(3):1233-39.
34- Lin Q, Zheng Y, Yin F, Liang H, Calhoun VD, 2007. A Fast Algorithm for One-unit ICA-R.
Information Sciences. 177:1265-75
35- Noda M, Nakanishi H, Akaike N, 1999. Glutamate release from microglia via glutamate
transporter is enhanced by amyloid-beta peptide. Neuroscience. 92(4):1465-74.
36- Harris NG, Plant HD, Inglis BA, Briggs RW, Jones HC , 1997. Neurochemical changes in the
cerebral cortex of treated and untreated hydrocephalic rat pups quantified with in vitro 1H-NMR
spectroscopy. J Neurochem. 68(1):305-12.
37- Magistretti PJ, Pellerin L, 1999. Astrocytes Couple Synaptic Activity to Glucose Utilization in
the Brain. News Physiol Sci. Oct;14:177-82
38- Wu J, Anwyl R, Rowan MJ, 1995. beta-Amyloid selectively augments NMDA receptor-
mediated synaptic transmission in rat hippocampus. Neuroreport. 6(17):2409-13.
2

39- Johnson JW, Kotermanski SE. Mechanism of action of memantine 2006. Curr Opin Pharmacol.
6(1):61-7.
40- Gruetter R, Seaquist ER, Kim S, Ugurbil K, 1998. Localized in vivo 13C-NMR of glutamate
metabolism in the human brain: initial results at 4 tesla. Dev Neurosci. 20(4-5):380-8.
41- Gruetter R, Seaquist ER, Ugurbil K, 2001. A mathematical model of compartmentalized
neurotransmitter metabolism in the human brain. Am J Physiol Endocrinol Metab. 2001;
281(1):100-12.
42- Shen J, Petersen KF, Behar KL, Brown P, Nixon TW, Mason GF, et al, 1999. Determination of
the rate of the glutamate/glutamine cycle in the human brain by in vivo 13C NMR. Proc Natl Acad
Sci U S A. 96(14):8235-40.
43- Sibson NR, Dhankhar A, Mason GF, Rothman DL, Behar KL, Shulman RG. Stoichiometric
coupling of brain glucose metabolism and glutamatergic neuronal activity. Proc Natl Acad Sci
USA. 95(1):316-21
44- Aubert A, Pellerin L, Magistretti PJ, Costalat R, 2007. A coherent neurobiological framework
for functional neuroimaging provided by a model integrating compartmentalized energy
metabolism. Proc Natl Acad Sci USA. 104(10):4188-93.
45- Pellerin L, Bouzier-Sore AK, Aubert A, Serres S, Merle M, Costalat R, et al, 2007. Activity-
dependent regulation of energy metabolism by astrocytes: An update. Glia. 55(12):1251-62.
46- Magistretti PJ, Pellerin L, 1999. Cellular mechanisms of brain energy metabolism and their
relevance to functional brain imaging. Philos Trans R Soc Lond B Biol Sci. 354(1387):1155-63.
2

47- Lin AP, Shic F, Enriquez C, Ross BD. Reduced glutamate neurotransmission in patients with
Alzheimer's disease -- an in vivo (13)C magnetic resonance spectroscopy study, 2003. MAGMA.
16(1):29-42
48- ParpuraGill A, Beitz D, Uemura E, 1997. The inhibitory effects of beta amyloid on glutamate
and glucose uptakes by cultured astrocytes. Brain Res . 754:65e71
49- Minoshima S, Giordani B, Berent S, Frey KA, Foster NL, Kuhl DE, 1997. Metabolic reduction
in the posterior cingulate cortex in very early Alzheimer's disease. Ann. Neurol. 42:85-94
50- Damoiseaux JS, Keller KE, Menon V, Greicius MD, 2009. Default Mode Network Connectivity
Tracks Clinical Progression in Alzheimer's Disease. Organization for the Human Brain Mapping.
San Francisco.
51- Peters M, Romieu P, Maurice T, Su TP, Maloteaux JM, Hermans E, 2004. Involvement of the
sigma 1 receptor in the modulation of dopaminergic transmission by amantadine. Eur J Neurosci.
19(8):2212-20.
52- Meisner F, Scheller C, Kneitz S, Sopper S, Neuen-Jacob E, Riederer P, et al 2008. Memantine
upregulates BDNF and prevents dopamine deficits in SIV-infected macaques: a novel
pharmacological action of memantine. Neuropsychopharmacology. 33(9):2228-36.
53- Achard S, Bullmore E, 2007. Efficiency and cost of economical brain functional networks.
PLoS Comput Biol. 3(2): e17.
54- Thomas TC, Grandy DK, Gerhardt GA, Glaser PE, 2009. Decreased dopamine D4 receptor
expression increases extracellular glutamate and alters its regulation in mouse striatum.
Neuropsychopharmacology. 34(2):436-45.
2

55- Konradi C, Leveque JC, Hyman SE, 1996. Amphetamine and dopamine-induced immediate
early gene expression in striatal neurons depends on postsynaptic NMDA receptors and calcium. J
Neurosci. 16(13):4231-9
56- Keefe KA, Ganguly A, 1998. Effects of NMDA receptor antagonists on D1 dopamine receptor-
mediated changes in striatal immediate early gene expression: evidence for involvement of
pharmacologically distinct NMDA receptors? Dev Neurosci. 20(2-3):216-8
57- Northoff G, Walter M, Schulte RF, Beck J, Dydak U, Henning A, et al, 2007. GABA
concentrations in the human anterior cingulate cortex predict negative BOLD responses in fMRI.
Nat Neurosci. 10(12):1515-7
58- Molinaro G, Battaglia G, Riozzi B, Di Menna L, Rampello L, Bruno V, et al, 2009. Memantine
treatment reduces the expression of the K(+)/CL(-)cotransporter KCC2 in the hippocampus and
cerebral cortex, and attenuates behavioural responses mediated by GABA(A) receptor activation in
mice. Brain Res. 1265:75-9.
59- Song MS, Rauw G, Baker GB, Kar S, 2008. Memantine protects rat cortical cultured neurons
against beta-amyloid-induced toxicity by attenuating tau phosphorylation. Eur J Neurosci.
28(10):1989-2002
2
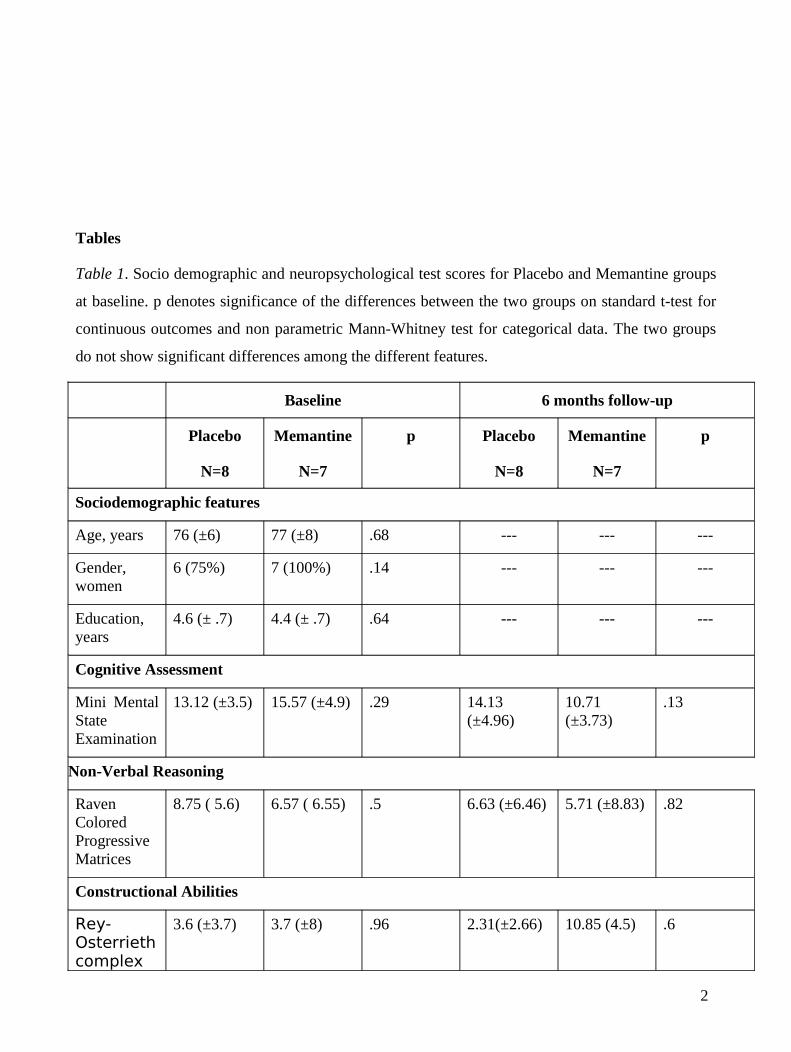
Tables
Table 1. Socio demographic and neuropsychological test scores for Placebo and Memantine groups
at baseline. p denotes significance of the differences between the two groups on standard t-test for
continuous outcomes and non parametric Mann-Whitney test for categorical data. The two groups
do not show significant differences among the different features.
Baseline 6 months follow-up
Placebo
N=8
Memantine
N=7
p Placebo
N=8
Memantine
N=7
p
Sociodemographic features
Age, years 76 (±6) 77 (±8) .68 --- --- ---
Gender, women
6 (75%) 7 (100%) .14 --- --- ---
Education, years
4.6 (± .7) 4.4 (± .7) .64 --- --- ---
Cognitive Assessment
Mini Mental State Examination
13.12 (±3.5) 15.57 (±4.9) .29 14.13 (±4.96)
10.71 (±3.73)
.13
Non-Verbal Reasoning
Raven Colored Progressive Matrices
8.75 ( 5.6) 6.57 ( 6.55) .5 6.63 (±6.46) 5.71 (±8.83) .82
Constructional Abilities
Rey-Osterrieth complex
3.6 (±3.7) 3.7 (±8) .96 2.31(±2.66) 10.85 (4.5) .6
2
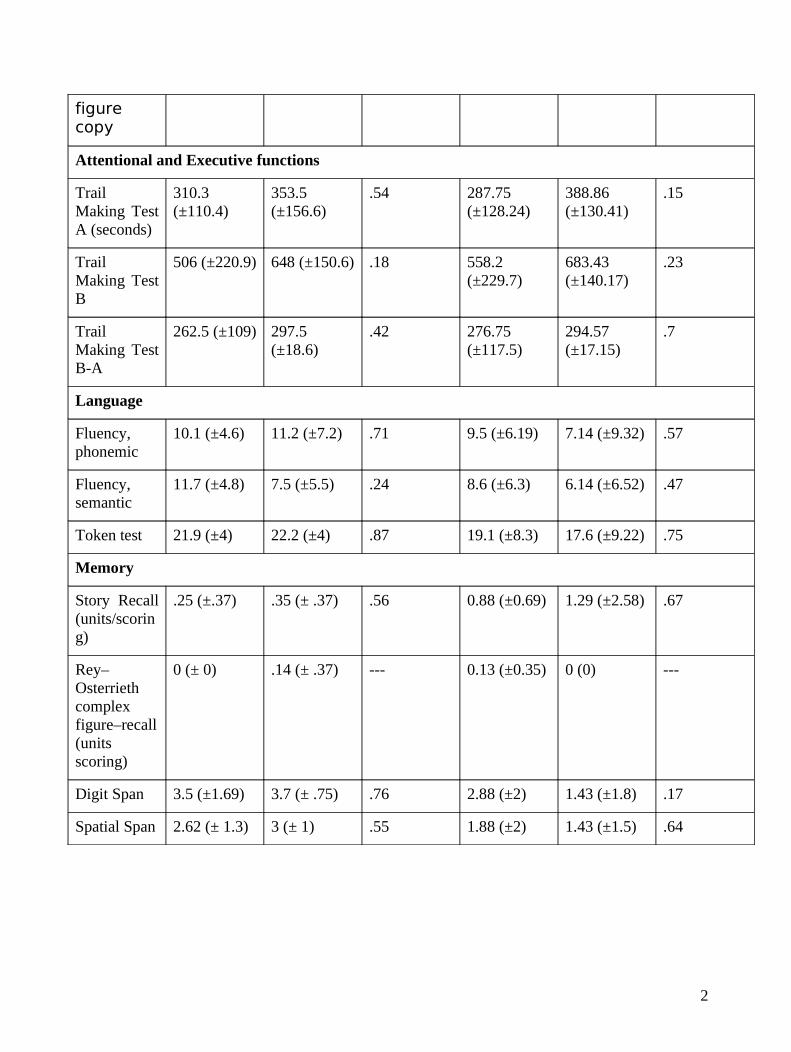
figure copy
Attentional and Executive functions
Trail Making Test A (seconds)
310.3 (±110.4)
353.5 (±156.6)
.54 287.75 (±128.24)
388.86 (±130.41)
.15
Trail Making Test B
506 (±220.9) 648 (±150.6) .18 558.2 (±229.7)
683.43 (±140.17)
.23
Trail Making Test B-A
262.5 (±109) 297.5 (±18.6)
.42 276.75 (±117.5)
294.57 (±17.15)
.7
Language
Fluency, phonemic
10.1 (±4.6) 11.2 (±7.2) .71 9.5 (±6.19) 7.14 (±9.32) .57
Fluency, semantic
11.7 (±4.8) 7.5 (±5.5) .24 8.6 (±6.3) 6.14 (±6.52) .47
Token test 21.9 (±4) 22.2 (±4) .87 19.1 (±8.3) 17.6 (±9.22) .75
Memory
Story Recall (units/scoring)
.25 (±.37) .35 (± .37) .56 0.88 (±0.69) 1.29 (±2.58) .67
Rey–Osterrieth complex figure–recall (units scoring)
0 (± 0) .14 (± .37) --- 0.13 (±0.35) 0 (0) ---
Digit Span 3.5 (±1.69) 3.7 (± .75) .76 2.88 (±2) 1.43 (±1.8) .17
Spatial Span 2.62 (± 1.3) 3 (± 1) .55 1.88 (±2) 1.43 (±1.5) .64
2

Titles and legends to Figures
Figure 1. Average DMNs in the group of Memantine treated (left column) and Placebo (right
column) at the different time points. First row: Average DMN at baseline. Middle row: Average
DMN at the follow-up. Last row: DMN masks used for the statistical analysis computed from the
baseline activations. Activations are overlaid on the stereotaxic MNI space (indices of the slices:
coronal 161, sagittal 112, axial 204).
Figure 2. Differences in DMN activation between Placebo and Memantine groups at baseline. Blue
colour denotes those areas where the activation is greater in the Memantine group compared to the
Placebo, while red areas denote the opposite comparison. Analysis was conducted using SPM two
sample t-test restricted in DMN ROI resulting from the union of the two groups DMN maps.
Results are displayed with statistical threshold of 0.05 uncorrected for multiple comparison for
illustrative purpose. The tables show location of maximally significant results at T0 for (a) Placebo
Group greater DMN activation than Memantine and (b) Memantine Group greater DMN activation
than Placebo, p-values denoted with * are significant after 0.05 FDR correction. Image and voxels
locations given in the stereotaxic MNI space (indices of the axial slices :188,196,204,212).
Figure 3. Longitudinal DMN activation differences in the time x treatment model.
Table shows location of maximally significant results for the time x treatment interaction term,
representing increased DMN activation in the memantine group compared to the placebo during the
6 months of the trial. The opposite comparison gave no significant results. p-values denoted with *
are significant after 0.05 FDR correction. Color bars denote T-values. Image and voxels locations
given in the stereotaxic MNI space (indices of the axial slices: 174,180,188,195,201,209).
Figure 4. Differences in DMN activation between Placebo and Memantine groups at six months.
Red colour denotes those areas where the activation is greater in the Memantine group compared to
the Placebo one, while the opposite comparison didn’t show significant results. Results are
displayed with statistical threshold of 0.05 uncorrected for multiple comparison for illustrative
purpose. The tables show location of maximally significant results at T6 for Memantine Group
2

greater DMN activation than Placebo, p-values denoted with * are significant after 0.05 FDR
correction. Image and voxels locations given in the stereotaxic MNI space (indices of the axial
slices :184,193,201,208,220,226).
Supplementary Figure 1. Longitudinal DMN activation differences in
1) Memantine Group between T0 and T6. Red areas denote topography of increased activation at
T6. Results are obtained using SPM paired t-test restricted on Memantine Group DMN map at T0
and displayed with statistical threshold of 0.05 uncorrected for multiple comparison for illustrative
purpose.
Table shows location of maximally significant results for Memantine representing increased DMN
activation at T6 than T0. The opposite comparison gave no significant results, p-values denoted
with * are significant after 0.05 FDR correction. Color bars denote T-values. Image and voxels
locations given in the stereotaxic MNI space (indices of the axial slices: 100,104,108,112)
2) Placebo Group between T0 and T6. Red areas denote topography of increased activation at T0
while blue areas denote increased DMN activation at T6. Results are obtained using SPM paired t-
test restricted on Placebo Group DMN map at T0. Statistical threshold has been set at 0.05
uncorrected for illustrative purpose. The tables show location of maximally significant results for
Placebo representing (a) increased DMN activation at T0 compared to T6 and (b) increased
activation at T6 compared to T0. p-values denoted with * are significant after 0.05 FDR correction.
Color bars denote T-values. Image and voxels locations given in the stereotaxic MNI space (indices
of the axial slices: 92,96,100,104)
2

Fig. 1
BaselineDMN
Memantine Placebo
BaselineDMN
6 monthsDMN
6 monthsDMN
DMN mask DMN mask
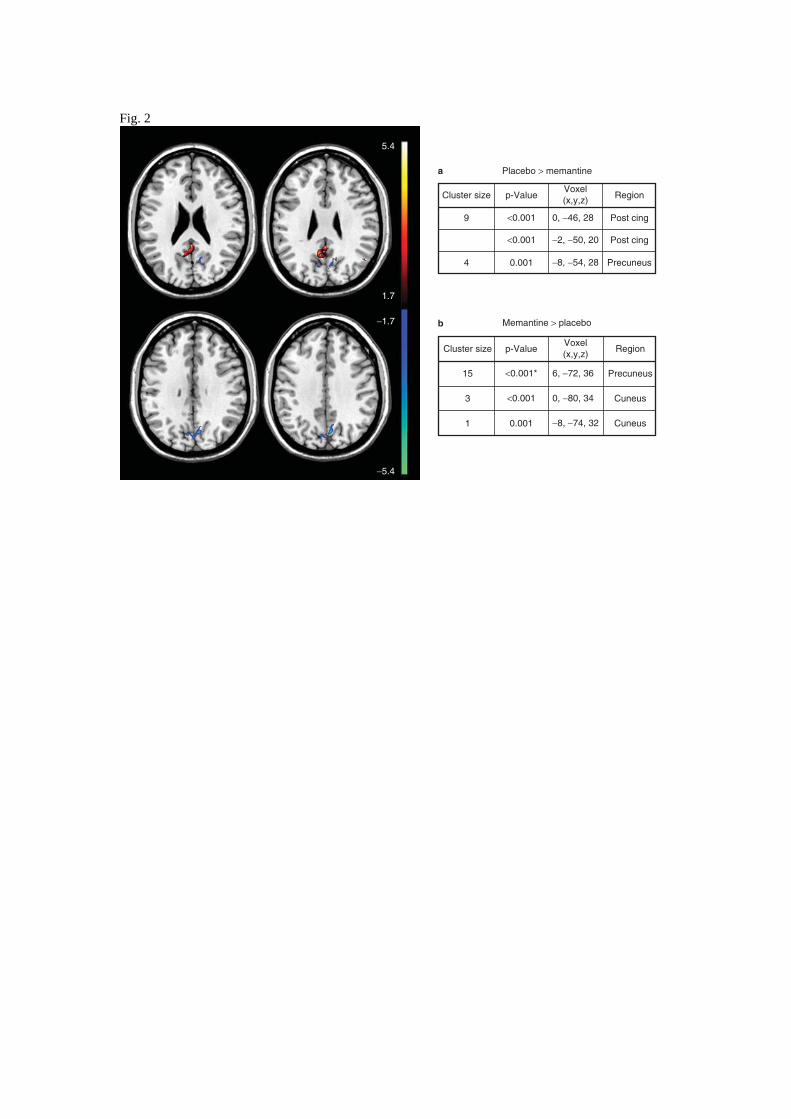
Fig. 2
5.4
Cluster size
Cluster size
9 <0.001 0, −46, 28
6, −72, 36
0, −80, 34
−8, −74, 32
Post cing
Post cing
Cuneus
Cuneus
Precuneus
Precuneus
−2, −50, 20
−8, −54, 28
<0.001
0.0014
15
3
1 0.001
<0.001
<0.001*
p-Value
p-Value
Placebo > memantinea
b Memantine > placebo
Voxel(x,y,z)
Voxel(x,y,z)
Region
Region
1.7
−1.7
−5.4

Fig. 3
1.8 5.1
Time x treatment interaction
14
5
p-Value
<0.001*
<0.001*
Voxel(x,y,z)
0, −56, 24
4, −62, 20 Calcarine
Precuneus
RegionCluster
size
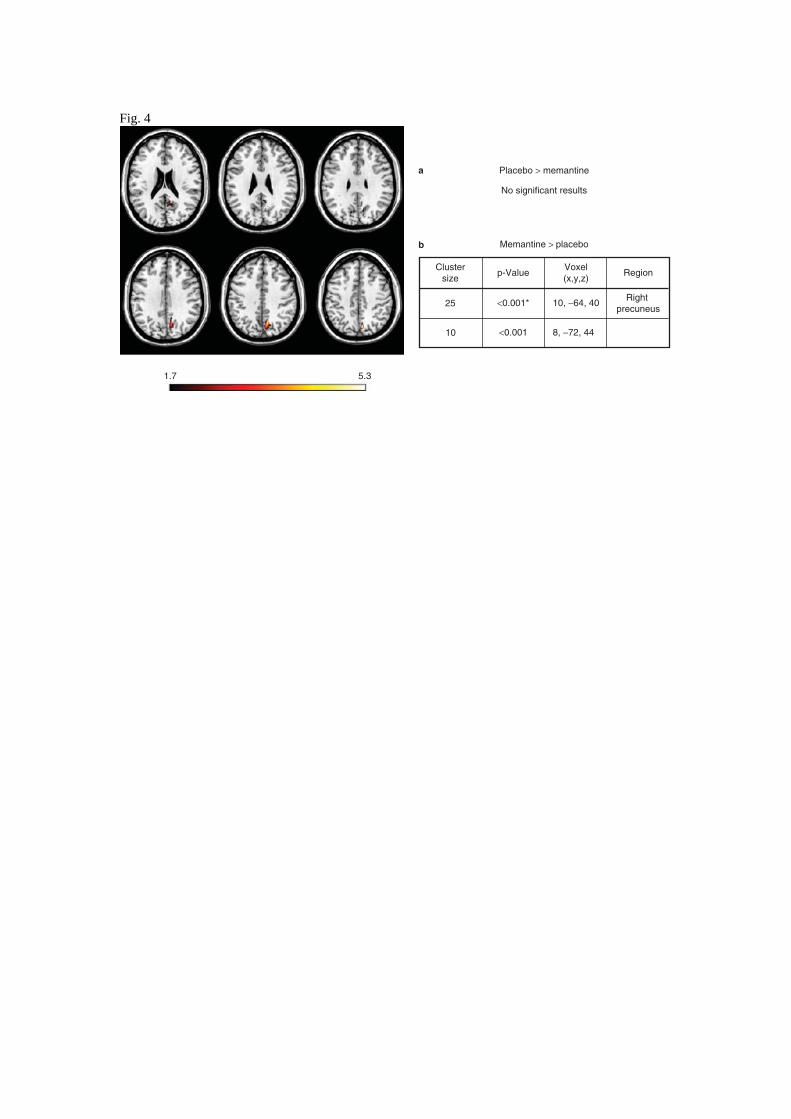
Fig. 4
1.7 5.3
Clustersize
p-Value RegionVoxel(x,y,z)
10, −64, 40
8, −72, 44
Right precuneus
<0.001*
Placebo > memantinea
b Memantine > placebo
No significant results
<0.001
25
10