Effect of Information Technology Capital: Technology ...
13
University of Nebraska - Lincoln University of Nebraska - Lincoln DigitalCommons@University of Nebraska - Lincoln DigitalCommons@University of Nebraska - Lincoln Library Philosophy and Practice (e-journal) Libraries at University of Nebraska-Lincoln Winter 1-14-2021 Effect of Information Technology Capital: Technology Effect of Information Technology Capital: Technology Infrastructure, Database, Software, and Brainware Toward Infrastructure, Database, Software, and Brainware Toward Optimize the Use of Information Technology (Case Study : UIN Optimize the Use of Information Technology (Case Study : UIN Sunan Ampel Of Surabaya) Sunan Ampel Of Surabaya) Rismawati Br Sitepu Airlangga University of Surabaya, East Java East Java, Indonesia, [email protected] Ilham m.said UIN Sunan Ampel Of Surabaya, East Java, Indonesia, [email protected] Tanti Handriana Airlangga University of Surabaya, East Java East Java, Indonesia Praptini Yulianti Airlangga University of Surabaya, East Java East Java, Indonesia Follow this and additional works at: https://digitalcommons.unl.edu/libphilprac Part of the Business Administration, Management, and Operations Commons, Business Analytics Commons, Business and Corporate Communications Commons, Corporate Finance Commons, Data Storage Systems Commons, Library and Information Science Commons, Management Information Systems Commons, and the Technology and Innovation Commons Sitepu, Rismawati Br; m.said, Ilham; Handriana, Tanti; and Yulianti, Praptini, "Effect of Information Technology Capital: Technology Infrastructure, Database, Software, and Brainware Toward Optimize the Use of Information Technology (Case Study : UIN Sunan Ampel Of Surabaya)" (2021). Library Philosophy and Practice (e-journal). 4949. https://digitalcommons.unl.edu/libphilprac/4949
Transcript of Effect of Information Technology Capital: Technology ...

University of Nebraska - Lincoln University of Nebraska - Lincoln
DigitalCommons@University of Nebraska - Lincoln DigitalCommons@University of Nebraska - Lincoln
Library Philosophy and Practice (e-journal) Libraries at University of Nebraska-Lincoln
Winter 1-14-2021
Effect of Information Technology Capital: Technology Effect of Information Technology Capital: Technology
Infrastructure, Database, Software, and Brainware Toward Infrastructure, Database, Software, and Brainware Toward
Optimize the Use of Information Technology (Case Study : UIN Optimize the Use of Information Technology (Case Study : UIN
Sunan Ampel Of Surabaya) Sunan Ampel Of Surabaya)
Rismawati Br Sitepu Airlangga University of Surabaya, East Java East Java, Indonesia, [email protected]
Ilham m.said UIN Sunan Ampel Of Surabaya, East Java, Indonesia, [email protected]
Tanti Handriana Airlangga University of Surabaya, East Java East Java, Indonesia
Praptini Yulianti Airlangga University of Surabaya, East Java East Java, Indonesia
Follow this and additional works at: https://digitalcommons.unl.edu/libphilprac
Part of the Business Administration, Management, and Operations Commons, Business Analytics
Commons, Business and Corporate Communications Commons, Corporate Finance Commons, Data
Storage Systems Commons, Library and Information Science Commons, Management Information
Systems Commons, and the Technology and Innovation Commons
Sitepu, Rismawati Br; m.said, Ilham; Handriana, Tanti; and Yulianti, Praptini, "Effect of Information Technology Capital: Technology Infrastructure, Database, Software, and Brainware Toward Optimize the Use of Information Technology (Case Study : UIN Sunan Ampel Of Surabaya)" (2021). Library Philosophy and Practice (e-journal). 4949. https://digitalcommons.unl.edu/libphilprac/4949

Effect of Information Technology Capital: Technology Infrastructure,
Database, Software, and Brainware Toward Optimize the Use of Information
Technology (Case Study : UIN Sunan Ampel Of Surabaya)
Ilham1, Tanti Handriana2, Praptini Yulianti3, Rina Dewi4, Rismawati Br Sitepu5
1Information Systems Study Program, Department of Technology, Faculty of Science and
Technology, Sunan Ampel Islamic University Of Surabaya, East Java, Indonesia
Ahmad Yani Number 117 Street, Surabaya, East Java, Indonesia [email protected]
1,2,3,4,5Department of Management, Faculty of Economics and Business, Airlangga University
Airlangga Number 4-6 Street, Surabaya, East Java East Java, Indonesia
ABSTRACT
This research was conducted to determine the extent of the influence of technology infrastructure
costs, software costs, database costs and brainware costs to increase the information technology
budget of the Sunan Ampel State Islamic University in Surabaya and efficient use of the budget.
The purpose of this study is to prove that there is a positive and significant influence of technology
infrastructure costs, software costs, database costs and brainware costs to increase information
technology budgets by using validity and reliability tests and classic tests such as the Normality
test, Multicollinearity test, autocorrelation test, Heteroskedasticity test , and Linearity test. This
study will provide the results of the analysis of each test using Skewness and Kurtosis,
Multicollinearity test with variance inflation factor (VIF), autocorrelation test with Durbin-Watson
test, Heteroskedasticity test with the Glejser test, Linearity test with Durbin-Watson, The
conclusion of the study is that the cost of technology infrastructure has a significant effect, the cost
of software has a significant effect on increasing the information technology budget, database costs
have a significant effect on increasing the information technology budget and the cost of brainware
has a significant effect on increasing the information technology budget.
Keyword : Information Tehnology, Infrastructure, Software, Database, Brainware, Capital, Optimize, and
University
INTRODUCTION
Information technology has changed the map of world power which covers the fields of
geography, economy, politics, social, culture, to the level of defense and security. Along with the
demands of rapid technological development, the government of the Republic of Indonesia has
responded by issuing Presidential Instruction No. 3 of 2003 concerning National Policies and
Strategies for E-Government Development. On the other hand there are strong community
demands for efforts to improve public services and good governance so that the term good
governance appears. Good governance is an aggregate of individual behavior that obeys and
complies with the provisions (regulatory) that have been set, so that good governance is a reflection
of government actors in accordance with predetermined rules [4]. Higher Education has allocated
large amounts of funds for investment in information technology. To support the accountability of
tertiary institutions in the implementation of information technology, a model in the form of
guidelines for monitoring the implementation of information technology is needed. The

development of technology is very fast, especially in developing countries along with the
development of information technology and technology (Khadaroo, 2005).
The first choice for users to use the internet to obtain information is time and makes it easy to
get the desired documents. The main media used by investors and financial analysts is the internet
to obtain financial and non-financial information. This study discusses the classic problems in
managing the budget, which occur in various fields one of them in the world of education.
Although the government has provided various systems for budget management, internal budget
management is still needed. Starting from the submission of the budget plan of each unit, then
merging the data in one satker, submitting revisions and submitting the realization and reporting
as well as statistical monitoring by the leaders of the Higher Education. So in this study created a
system for managing internal budgets for information technology procurement. The results of this
study create an evaluation and recommendation results that can help budget management of
information technology procurement at the Sunan Ampel State Islamic University in Surabaya,
this will be very helpful especially for state universities.
METHOD
The research model in this study is as follows. Increased Technology Budget = α0 + α1
Infrastructure + α2 Software + α3 Databases + α4Brainware + ε. The population in this study was
the Sunan Ampel State Islamic University of Surabaya in 1980-2019. The sample selection method
uses random sampling with the following criteria. a. University Units, Faculties, Departments and
Study Programs that have used information technology and had technological infrastructure in
1980 such as computers. This is because this research began in June 1980. b. Supporting units of
Education activities such as libraries, business units, LPPM, LPM and others who have used
information technology. The completeness of the data is needed so that the results of the study can
represent the condition of the UIN Sunan Ampel Surabaya university.
Independen Variable Dependen Variable
Figure 1. Construction Of Research Model
Database
Increased Information
Technology Use
Infrastructur
Brainware
Software
Classic assumption test
The first time, the data was processed and analyzed through the classic assumption test
including normality test, multicollerierity test, autocorrelation test, heteroscedasticity test and
linearity test. Autocorrelation test is performed considering the data used there are time series data
in an annual period. Testing classic assumptions must be done to test the assumptions that exist in
modeling multiple linear regression. The purpose of testing this classic assumption is to provide
certainty that the regression equations obtained have accuracy in estimation, are unbiased and
consistent. (Ghozali, 2013).
Assumption of Normality
The normality test aims to test whether the regression model, confounding or residual variables
have a normal distribution. The t test and F test assume that the residual value follows the normal
distribution. If this assumption is violated, then the statistical test becomes invalid for a small
sample size. A good regression model is to have residual values that are normally distributed. To
detect whether residuals are normally distributed or not in SPSS can use the P Plot normal test
facility, histogram test, Chi Square test, Skewness and Kurtosis test or Kolmogorov Smirnov test.
The basis of the analysis is as follows.
Assumption of Multicollinearity
Multicollinearity test aims to test whether the regression model found a correlation between
independent variables. A good regression model should not occur correlation between independent
variables. If the independent variables are correlated with each other, then these variables are not
orthogonal. Orthogonal variable is an independent variable whose correlation value between
fellow independent variables is equal to zero. To detect the presence or absence of multicollinearity
in the regression model in the SPSS program can be seen from the variance inflation factor (VIF)
in the coefficients table with a tolerance limit of no more than or equal to 10. So the assessment
criteria can be arranged as follows. IF VIF value ≤ 10, then the independent variables do not have
multicollinearity. IF VIF value ≥ 10, then the independent variables are multicollinearity.
Autocorrelation Test
Autocorrelation is one of the classic assumptions tests in multiple linear regression analysis.
Autocorrelation test is to see whether there is a correlation between a period t with the previous
period (t -1). Regression analysis aims to see the effect of the independent variables on the
dependent variable, so there should not be a correlation between observations and previous
observational data. Criteria for whether or not autocorrelation can use the Durbin Watson number
(d) and the Durbin Watson table. If (4-dL) <d <dL, then Ho is rejected, which means there is
autocorrelation. If dU <d <(4-dU), then Ho is accepted, which means there is no
autocorrelation.However, if dL <d <dU or (4-dU) <d <(4-dL), then it does not produce definitive
conclusions.
Assumption of Heteroscedasticity
Heteroscedasticity test aims to test whether in the regression model there is an inequality of
variance from the residuals of one observation to another. If the variance from one observation
residual to another observation is fixed, then it is called homoscedasticity and if different is called
heteroscedasticity. A good regression model is homoscedasticity or heteroscedasticity does not
occur. To determine the presence or absence of heteroscedasticity, it can be detected by looking at
the presence or absence of certain patterns on a scatterplot chart, the Glejser test, the Park test or

the White test. The basis of the analysis is as follows. If there are certain patterns, such as the dots
that form a regular pattern (wavy, widened and then narrowed), then it indicates that
heteroscedasticity has occurred. If there is no clear pattern, and the points spread above and below
the number 0 on the Y axis, then there is no heteroscedasticity.
Assumption Of Linearity
Linearity test is used to see whether the model built has a linear relationship or not. This test
is rarely used in various studies, because usually the model is formed based on a theoretical study
that the relationship between the independent variable and the dependent variable is linear.
Relationships between variables which in theory are not linear relationships actually can not be
analyzed by linear regression, for example the problem of elasticity. If there is a relationship
between two variables that are not yet known whether linear or not, the linearity test cannot be
used to provide an adjustment that the relationship is linear or not. The linearity test is used to
confirm whether the linear nature between the two variables identified in theory is compatible with
the results of existing observations. The linearity test can use the Means test, the Durbin-Watson
test, the Ramsey Test or the Lagrange Multiplier test.
Statistical Test F
Statistical tests to determine whether all the independent variables entered into the model have
a joint relationship with the dependent variable. The null hypothesis (Ho) that requests evaluation
is that all parameters in the model are zero, or: Ho: b1 = b2 = ...... = bk = 0, That is, all independent
variables are not a significant explanation of the dependent variable. The alternative hypothesis
(Ha) is fully approved, not all simultaneous parameters are zero, or: Ha: b1 ≠ b2 ≠ .......... ≠ bk ≠
0, Which means, all the independent variables which are significant explanations of the dependent
variable. In SPSS, the F test can be seen in the ANOVA table (Analysis of Variance) and is taken
based on the probability value (significant) compared to alpha (α) 5%. The following are the agreed
criteria. Probability If the probability (sig.)> Α (5%), then there is no significant difference
simultaneously variables X1, X2, X3, X4 and so on the variable Y, with a 95% confidence level.
If the probability (sig.) <Α (5%), then there is at least 1 variable X that is significantly significant
to the variable Y, with a confidence level of 95%.
Statistical Test t
T test shows how far the influence of one independent variable individually in explaining the
variation of the dependent variable. The null hypothesis (Ho) to be tested is whether a parameter
(bi) is equal to zero, or: Ho = bi = 0, That is, whether an independent variable is not a significant
explanation of the dependent variable. The alternative hypothesis (Ha) to be tested is that the
parameters of a variable are not equal to zero, or: Ha: bi ≠ 0, That is, the variable is a significant
explanation of the dependent variable. In SPSS, the t test can be seen in the coefficients table and
the assessment is taken based on the probability value (significance) compared to alpha (α) 5%.
The following evaluation criteria: If the probability (sig.)> Α (5%), then there is no significant
effect between the variables on the Y variable, with a confidence level of 95%. If the probability
(sig.) <Α (5%), then there is a significant influence between the variable X on the Y variable, with
a confidence level of 95%.

Determination Coefficient Test (r2)
Next, to test the suitability of a model, the coefficient of determination (r2) is used. The
coefficient of determination is the proportion of variability in a data that is calculated based on a
statistical model. The coefficient of determination is the ratio of the variability of values created
by the model with the variability of the original data values. In regression, r2 is used as a
measurement of how well the regression line approaches the original data value made by the
model. R2 can be interpreted as the proportion of variation of responses explained by the regressor
(independent variable) in the model. If r2 = 1, then the number shows the regression line matches
the data perfectly. The model fits in explaining all the variability in the Y variable. If r2 = 0, it
means that there is no relationship between the X variable and the Y variable. If 0 <r2 <1, it means
that the percent variation of the variable Y (the dependent / response variable) is explained by the
variable X (the independent / explanatory variable), while the rest is influenced by unknown
variables. Augustine and Kristaung (2013).
RESULT AND DISCUSSION
The data used in this study are companies that are included in the pure financing category that
were recorded in the annual period 1980 to 2019. All data is available to be the research sample.
Assumption of Normality
Based on the Descriptive Statistics table, the skewness ratio = -0.58 / 0.374 = -1.55 can be
calculated; while the ratio of kurtosis = 0.754 / 0.733 = 1.02. Because the skewness ratio and
kurtosis ratio are between –2 to +2, it can be concluded that the data distribution is normal.
Following Table 1. Skewness dan Kurtosis.
Table 1. Skewness and Kurtosis Descriptive Statistics
N Minimum Maximum Mean Std. Deviation Skewness Kurtosis
Statistic Statistic Statistic Statistic Statistic Statistic Std. Error
Statisti
c Std. Error
Unstandar
dized
Residual
40 -1.19809E8 9.55949E7 .0000000 4.29773928E7 -.058 .374 .754 .733
Valid N
(listwise) 40
Assumptions Of Autocorrelation
The Durbin-Watson value is 2,040 and this value will be compared with the DW table value.
The next step is to set the dl and du values, by using α = 5%, the sample (n) we have as many as
40 observations, and the independent variables as much as 4, we get the value of dl = 1.2848 and
du = 1.7209. So the DW value is smaller than the dl value (2.040> 1.2848) so it can be concluded
that this model has no positive autocorrelation symptoms. Following Table 2. Durbin-Watson Test
Results.

Table 2. Durbin-Watson Test Results
Assumptions of Multicollinearity
Based on the results of the SPSS output shows that there is no independent variable that has a
Tolerance value of less than 0.10 which means there is no correlation between the independent
variables whose value is more than 95%. The results of the calculation of the value of Variance
Inflation Factor (VIF) also showed the same thing that there was no one independent variable that
had a VIF value greater than 10. So it can be concluded that there were no symptoms of
multicollinearity between the independent variables in the regression model. Looking at the results
of the magnitude of correlation between the independent variables it appears that the database cost
variable has a low correlation with the software cost variable of -0,321, as well as the infrastructure
cost variable with Brainware costs with a correlation of -0.071 where both of these correlation
values are less than 0.70. So it can be concluded that there are no symptoms of multicollinearity
between independent variables in the regression model. Following Table 3. Tolerance and VIF
Test Results
Table 3. Tolerance and VIF Test Results
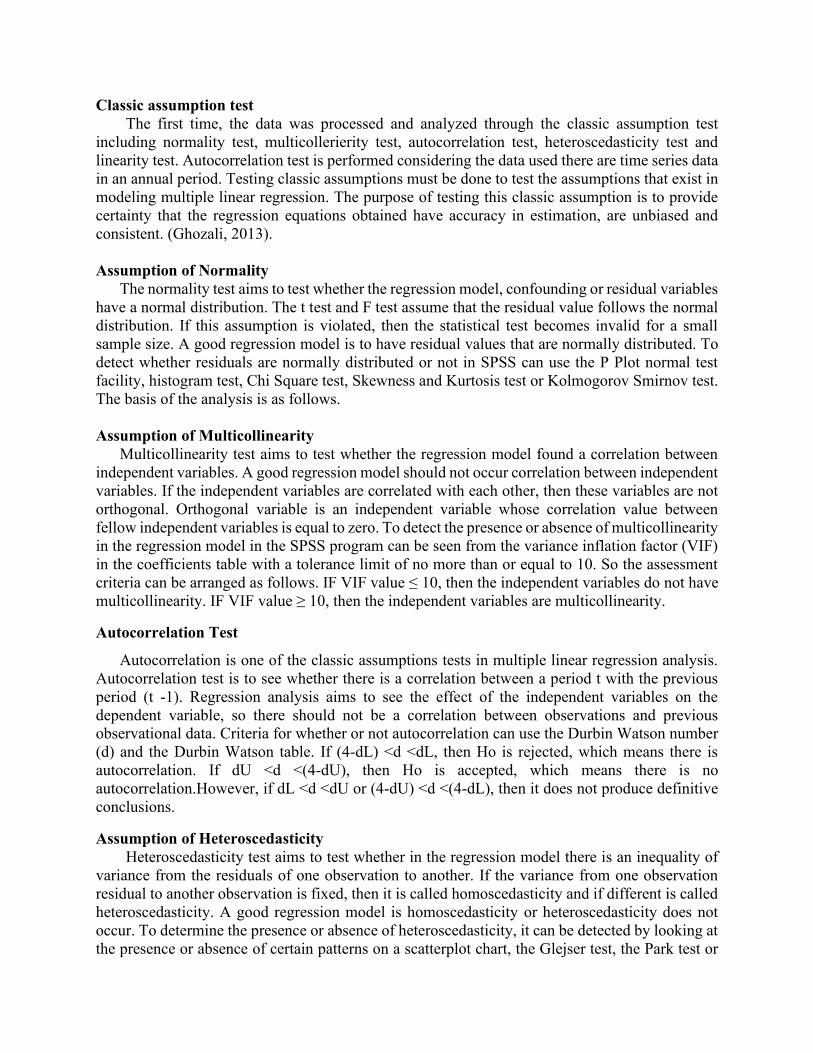
Assumption of Heteroscedasticity
The results of the SPSS output display clearly show that there are no independent variables
that are statistically significant influence the dependent variable residual absolute value (Abresid).
This can be seen from the significant probability of each independent variable, namely 0.437,
0.450, 0.491, and 0.530, all of which are greater than α = 0.05; so it can be concluded that this
regression model does not contain heteroscedasticity or homoscedasticity problems.Following
Table 4 Heteroscedasticity Abresid Test Results.
Table 4. Heteroscedasticity Abresid Test Results
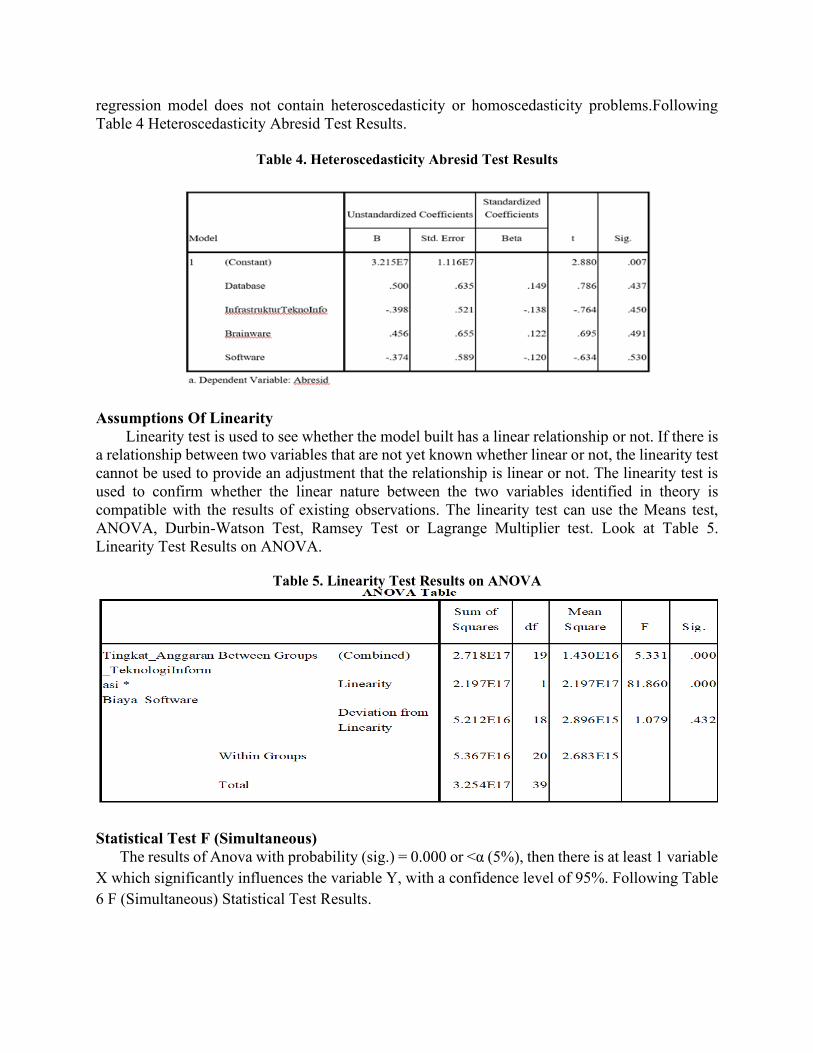
Assumptions Of Linearity
Linearity test is used to see whether the model built has a linear relationship or not. If there is
a relationship between two variables that are not yet known whether linear or not, the linearity test
cannot be used to provide an adjustment that the relationship is linear or not. The linearity test is
used to confirm whether the linear nature between the two variables identified in theory is
compatible with the results of existing observations. The linearity test can use the Means test,
ANOVA, Durbin-Watson Test, Ramsey Test or Lagrange Multiplier test. Look at Table 5.
Linearity Test Results on ANOVA.
Table 5. Linearity Test Results on ANOVA
Statistical Test F (Simultaneous)
The results of Anova with probability (sig.) = 0.000 or <α (5%), then there is at least 1 variable
X which significantly influences the variable Y, with a confidence level of 95%. Following Table
6 F (Simultaneous) Statistical Test Results.

Table 6. F (Simultaneous) Statistical Test Results
Statistical Test t (Partial)
The probability result (sig.)> Α (5%), then there is no significant effect between the variables
on the Y variable, with a confidence level of 95%. Namely variable Database costs are 0.320 and
brainware costs are 0.415. This value indicates that the two variables are not significant or more
than 0.05. If the probability (sig.) <Α (5%), then there is a significant influence between the
variable X on the Y variable, with a confidence level of 95%. Namely Infrastructure costs of 0,000
and Software costs of 0,000 this value shows that the two variables are significant or less than
0.05. Following Table 7 Statistical Test Results t (Partial).
Table 7. Statistical Test Results t (Partial)
Determination Coefficient Test (r2)
The coefficient of determination test results indicate that r2 is equal to 0.779. This figure
shows that 77.9% of the variation in the Information Technology Budget Level (TATI) (dependent
/ response variable) can be explained by software cost variables, and infrastructure costs
(independent / explanatory variables), while the remaining 22.1% is influenced by variables not
known. Look this Table 8 Determination Coefficient Test Results

Table 8. Determination Coefficient Test Results
Model Summaryb
Model R R Square
Adjusted R
Square
Std. Error of
the Estimate Durbin-Watson
1 .882a .779 .753 4.537E7 2.040
For each hypothesis the following results can be arranged with table 10.
Table 10. Resume of Hypothesis Test Results
Hypothesis Sig
Value
Supported / Not
Supported
H1: Database Cost (BD) has a negative effect on increasing the
Information technology budget (PATI)
0.320 Unsupported
H2: IT Infrastructure Costs (BITI) have a positive effect on
increasing the information technology budget
0.00 Supported
H3: The cost of Brainware (BB) has a negative effect on
increasing the information technology budget
0.415 Unsupported
H4: Software costs (BS) have a positive effect on increasing the
information technology budget
0.000 Supported
Source: researchers processed products
The regression equation is as follows:
PATI = 9,264 - 1,009BD + 3,278BITI - 0.852BB + 8.216BS + e
From the above hypothesis test it can be seen that the Cost of Database (BD) and Cost of
Brainware (BB) have a negative effect on increasing the information technology budget (PATI).
While IT Infrastructure Costs (BITI), and Software Costs (BS) simultaneously influence the
increase in the information technology budget. However, a partial test for infrastructure costs and
software costs turned out to provide significant results. That is, infrastructure costs and software
costs affect the increase in the information technology budget. This proves that the cost of
infrastructure and software costs will absorb more budget than other costs. In this research, it can
be seen that the infrastructure and software that spend the most budget increases the information
technology budget.
CONCLUSION This study aims to examine the effect of database costs, infrastructure costs, brainware costs and
software costs on the Increased Information Technology Budget. From the test results obtained that only
infrastructure and software costs have a significant effect on increasing the Information Technology
Budget. While database costs and brainware costs do not significantly influence the Information
Technology Budget Increase.
REFERENCES
Alali, Fatima., Romero, Silviana.. The use of the Internet for Corporate Reporting in The Mercosur
(Sourthern Commom Market: The Argentina Case. Advances in Accounting, Incorporating Advances
in International Accounting.pp 157-167. (2012)
Algifari. (2000). Regression Analysis. Theory, Cases & Solutions. BPFE UGM. Yogyakarta.
Anton, Howard. (2000). Elementary Linear Algebra. Fifth Edition. Drexel University. Almilia, Luciana Spica. Determining Factors of Internet Financial Reporting in Indonesia. Accounting &
Taxation. Vol. 1 (1). pp 87-99. (2009).
Aly, Doaa., Simon Jon., Hussihey Khaled. Determinants od Corporate Reporting: Evidence from Egypt.
Managerial Auditing Journal.pp 182-202. (2010)
Ambar, W.H. and Bambang, Sudibyo. "Effect of Publication of Cash Flow Reports on the Trading Volume
of Company Shares on the Jakarta Stock Exchange". Indonesian Accounting Research Journal. Vol.
1, No. 2. Pg. 239-254. 1998.
Anna, Yane Devi. Analysis of Factors Affecting Internet Corporate Reporting. 16th National Accounting
Symposium Manado. (2013).
Ashbaugh, Hollis., Johnstone, Karla M., Warfield. Terry D. (1999). Corporate Reporting on the Internet.
Horizon Accounting. Vol. 13 (3). pp 241.
Atiase, R.K. Predisclosure Information, Firm Capitalization, and Security Price Behavior Around Earnings
Announcements. Journal of Accounting Research. pp 21-36. (1985).
Augustine, Yvonne. and Kristaung, Robert. Business and Accounting Research Methodology. Dian Rakyat.
(2013).
Bandi and Hartono, Jogiyanto. Behavior of Price Reactions and Trading Volume of Stocks on Dividend
Announcements. Indonesian Accounting Research Journal. Vol.3, No. 2. Pages 203-213. (2000).
Bamber, L. Smith and Y.S. Cheon. Differential Price And Volume Reactions To Accounting Earnings
Announcement. The Accounting Review. Vol.70, No.3, pp. 417-441. (1995)
Basu Swastha. (2000). Modern Marketing Management. Eighth Edition. Liberty, Yogyakarta.
Basu Swastha and Irawan. (2000). Modern Marketing Management. Second Edition. Second
printing. Liberty Publisher, Yogyakarta. Bonson, E., T, Escobar.. A Survey on Voluntary Disclosure on the Internet. Empirical Evidence from 300
European Union Companies. The International Journal of Digital Accounting Research. Vol. 2 (1).
pp 27-51. (2002)
Bhushan, R. Collection of Information About Publicly Traded Firms: Theory and Evidence ". Journal of
Accounting and Economics 11. pp183-206. (1989)
Boyd, H. W., Walker, O. C., and Larreche, J. (2000). Marketing Management, aStrategic Approach
with a Global Orientation. Volume I. Second Edition. Publisher Erlangga, Jakarta.
Chaney, P.K. and Jeter, D.C. The Effect of Size on the Magnitude of Long-Window Earnings Response
Coefficient. Contemporary Accounting Research 8. pp.540-560. (1992)
Collins, D.W & Kothari, S.P. An Analysis of Intertemporal and Cross-Sectional Determinants of Earnings
Response Coefficients. Journal of Accounting and Economics 11. pp143-181. (1989)
Collins, D.W, Maydew, E., & Weiss, I. Changes in the Value Relevance of Earnings and Book Values
Over the Past Forty Years. Journal of Accounting and Economics. pp.39-67. (1997).
Debreceny, R., Gray, G.L., & Rahman, A. The Determinants of Internet Financial Reporting. Journal of
Accounting and Public Policy, 21, 371-394. (2002).
Desoky, Abdelmohsen M. Company characteristics as Determinants of Internet Financial Reporting in
Emerging Markets: the case of Egypt. Research in Accounting in Emerging Economies. Vol. 9. pp.
31–71. (2009).
Dhaliwal, D.S., Lee, K.J., and Fargher, N.L.. The Association Between Unexpected Earnings and Abnormal
Security Returns in the Presence of Financial Leverage. Contemporary Accounting Research, 8.
(1991)
Ettredge, M., Richardson, V.J., & Scholz, S.. Dissemination of Information for Investors at Corporate Web
Sites. Journal of Accounting and Public Policy, 21, 357-369. (2002)
Ezat, Amir., Ahmed, El-Masry. The Impact of Corporate Governance on the Timeliness of Corporate
Internet Reporting by Egyptian Listed Companies. Managerial Finance. Vol. 34 (12). pp 848-867.
(2008).
Fama, E.F. & French, K.R. The Cross-Section of Expected Stock Returns. Journal of Finance 47. pp427-
465. (1992).
Fauzan and Gunarsih. (2007). Influence of Product Attributes and Consumer Interests towards
Consumer Loyalty (Case Study on AJB Bumiputera Products 1912). Journal of Economic
Research, Business and Development, University Muhammadiyah Surakarta
Fransiska, Lusiana (2011). Differences in Stock Liquidity Before and After a Reverse Stock Split
(Empirical Study on the Indonesia Stock Exchange). Scientific Journal of Accounting and Business,
Volume 6 Number 2, July 2011.
Ghazali, Faith. (2005). Multivariate Analysis Applications with the SPPS Program, ed three,
Semarang: Diponegoro University.
Ghazali, Imam. (2006). Multivariate Analysis Using SPSS Program. Semarang: Diponegoro
University Publishing Agency.
Ghazali, Faith. (2009). Multivariate Analysis Application with SPSS Program. Mold IV. April
2009. Publishing Agency of Diponegoro University, Semarang. Ghozali, Imam. Multivariate Analysis Application with Programs. Seventh Edition. Semarang: Diponegoro
University Publisher Agency. (2013).
Harris, Milton & Raviv, Artur. Capital Sturcture and the Informational Role of Debt. The Journal of
Finance. Vol. XLV.No.2. (1990).
Healy, Paul M., & Palepu, Krishna G., Information Asymmetry, Corporate Disclosure, and the Capital
Markets: A Review of the Empirical Disclosure Literature. Journal of Accounting and Economics. 2.
pp373-381. (2001)
Imam, Shariaf. (2008). Consumer Assessment of Several Two Kinds of Attributes Sampoerna
cigarettes. http://eprints.upnjatim.ac.id/110/1/822008-97.pdf. Retrieved 12 September 2011.
Jogiyanto. (2007). Business Research Methodology. BPFE UGM. Yogyakarta.
Jogiyanto. (2007). Information Systems Research Methodology. CV. Andi Offset, Yogyakarta.
Kotler, Philip. (2000). Marketing Management, Planning Analysis, Control, Prentice Hall,
Indonesian Edition, Jakarta: Salemba 4.
Kotler, Philip. (2002), Marketing Management. Volume I. Millennium Edition. Volume I. PT.
Prenhallindo, Jakarta.
Maranatha Christian University Kotler, Philip. (2005). Marketing Management. Millennium
Edition. Volume I. PT. Prenhallindo, Jakarta.
Kotler, Philip. (2005). Marketing Management. Millennium Edition. Volume II. PT. Prenhallindo,
Jakarta.
Kotler, Philip and Gary Armstrong. (2004). Marketing Basics. Index, Jakarta.
Kotler, Philip and Keller, Kevin Lane. (2006). Marketing Management. Translation: Benyamin
Molan. Volume I. Twelfth Edition, Index publisher, Jakarta.
Kotler, Philip. Keller, Kevin Lane. (2007). Issue 12 volumes 2. Marketing Management. Jakarta:
PT INDEKS.
Kotler, Philip. Keller, Kevin Lane. (2008). Issue 12 volumes 1. Marketing Management. Jakarta:
PT INDEKS.

Kurniawan, Albert. (2009). Easy Learning SPSS For Beginners. Mediakom, Yogyakarta.
M. Iqbal Hasan. (2008). Analysis of Research Data with Statistics. PT. Earth Literacy, Jakarta.
Peter, Paul, Olson. (1996). Consumer Behavior. Consumer Behavior And Strategy Marketing.
Jakarta: Erlangga.
Peter, Paul, Olson. (1999). Consumer Behavior. Consumer Behavior And Strategy Marketing.
Jakarta: Erlangga.
Peter, J. Paul., C. Olson, Jerry. (2000). Consumer Behavior: Consumer Behavior and Marketing
strategy. Edition IV. Volume I. Erlangga, Jakarta.
Sugiyono. (2006). Business Research Methods, sixth edition, Bandung: Alfabeta.
Sugiyono. (2007). Business Research Methods, sixth edition, Bandung: Alfabeta.
Sugiyono. (2010). Quantitative Research Methods, Qualitative and R & D. Bandung: Alfabeta.
Suliyanto. (2006). Business Research Methods. ANDI. Yogyakarta.
Tjiptono, Fandy. (2008). Marketing strategy. Third Edition. Andi Publisher, Yogyakarta.
Maranatha Christian University
Setiawan, Rony et al. (2009). SPSS Training Module for Accounting Students 2009. Mananatha
Christian University. Bandung.