EFFECT OF IMIDAZOLE CONCENTRATION AND TYPE OF …umpir.ump.edu.my/id/eprint/8853/1/CD8547.pdf ·...
24
III EFFECT OF IMIDAZOLE CONCENTRATION AND TYPE OF METAL ION ON THE PURIFICATION OF RECOMBINANT GREEN FLUORESCENT PROTEIN USING AN AFFINITY CHROMATOGRAPHY INSYIRAH BINTI SAMSUDDIN Thesis submitted in partial fulfilment of the requirements For the award of the degree of Bachelor of Chemical Engineering (Biotechnology) Faculty of Chemical & Natural Resources Engineering UNIVERSITI MALAYSIA PAHANG JANUARY 2014 ©INSYIRAH BINTI SAMSUDDIN (2014)
Transcript of EFFECT OF IMIDAZOLE CONCENTRATION AND TYPE OF …umpir.ump.edu.my/id/eprint/8853/1/CD8547.pdf ·...
III
EFFECT OF IMIDAZOLE CONCENTRATION AND
TYPE OF METAL ION ON THE PURIFICATION
OF RECOMBINANT GREEN FLUORESCENT
PROTEIN USING AN AFFINITY
CHROMATOGRAPHY
INSYIRAH BINTI SAMSUDDIN
Thesis submitted in partial fulfilment of the requirements
For the award of the degree of
Bachelor of Chemical Engineering (Biotechnology)
Faculty of Chemical & Natural Resources Engineering
UNIVERSITI MALAYSIA PAHANG
JANUARY 2014
©INSYIRAH BINTI SAMSUDDIN (2014)
VII
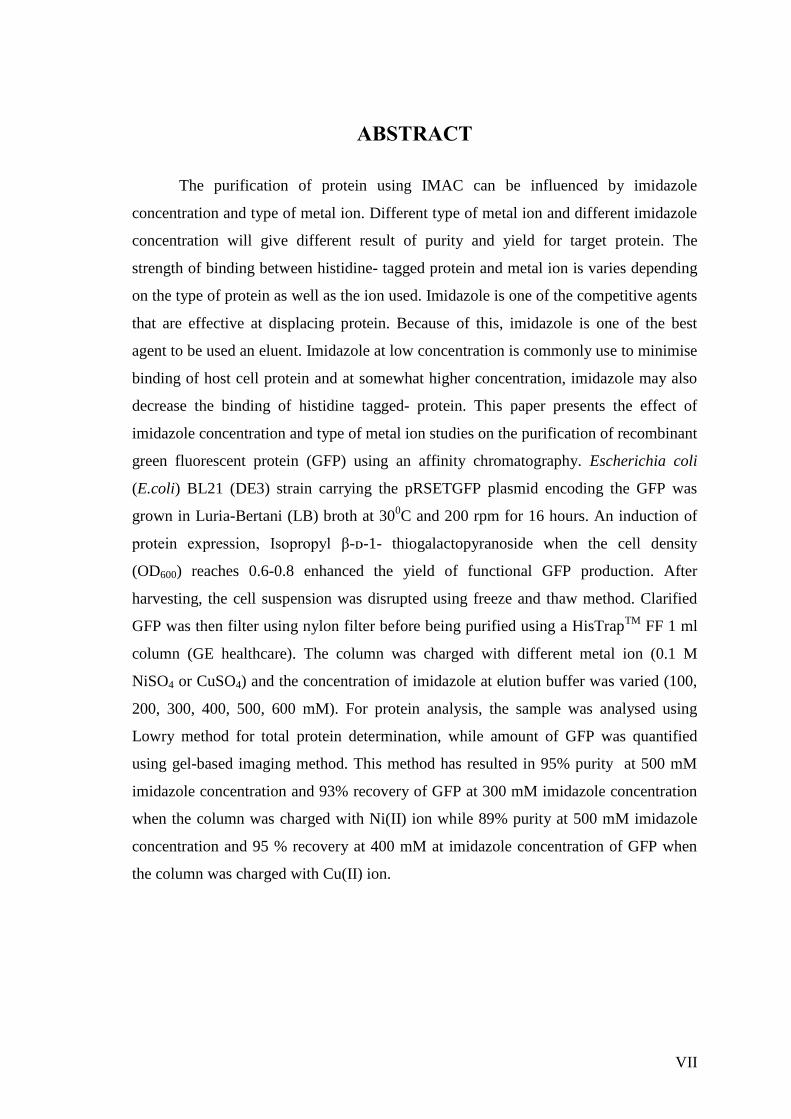
ABSTRACT
The purification of protein using IMAC can be influenced by imidazole
concentration and type of metal ion. Different type of metal ion and different imidazole
concentration will give different result of purity and yield for target protein. The
strength of binding between histidine- tagged protein and metal ion is varies depending
on the type of protein as well as the ion used. Imidazole is one of the competitive agents
that are effective at displacing protein. Because of this, imidazole is one of the best
agent to be used an eluent. Imidazole at low concentration is commonly use to minimise
binding of host cell protein and at somewhat higher concentration, imidazole may also
decrease the binding of histidine tagged- protein. This paper presents the effect of
imidazole concentration and type of metal ion studies on the purification of recombinant
green fluorescent protein (GFP) using an affinity chromatography. Escherichia coli
(E.coli) BL21 (DE3) strain carrying the pRSETGFP plasmid encoding the GFP was
grown in Luria-Bertani (LB) broth at 300C and 200 rpm for 16 hours. An induction of
protein expression, Isopropyl β-ᴅ-1- thiogalactopyranoside when the cell density
(OD600) reaches 0.6-0.8 enhanced the yield of functional GFP production. After
harvesting, the cell suspension was disrupted using freeze and thaw method. Clarified
GFP was then filter using nylon filter before being purified using a HisTrapTM
FF 1 ml
column (GE healthcare). The column was charged with different metal ion (0.1 M
NiSO4 or CuSO4) and the concentration of imidazole at elution buffer was varied (100,
200, 300, 400, 500, 600 mM). For protein analysis, the sample was analysed using
Lowry method for total protein determination, while amount of GFP was quantified
using gel-based imaging method. This method has resulted in 95% purity at 500 mM
imidazole concentration and 93% recovery of GFP at 300 mM imidazole concentration
when the column was charged with Ni(II) ion while 89% purity at 500 mM imidazole
concentration and 95 % recovery at 400 mM at imidazole concentration of GFP when
the column was charged with Cu(II) ion.
VIII
ABSTRAK
Penulinan protein mengunakan IMAC boleh dipengaruhi oleh kepekatan imidazole and
jenis ion logam yang digunakan. Ion logam yang berlainan dan kepekatan imidazole
yang bebeza- beza akan menghasilkan penulilan dan jumlah protein yang berbeze-beza.
protein. Kekuatan pengikat diantara histidine-tag protein dan ion logam adalah berbeza
bergantung kepada jenis protein dan ion logam yang digunakan. Imidazole merupakan
salah satu agent yang sangat kompetitif dalam menyinkirkan protein Oleh kerana
itu,imidazole dipilih sebagai agent yang paling sesuai untuk proses penyingkiran protein
. Pada kepekatan yang rendah, imidazole boleh mengurankan kekuatan pengikat bagi
protein yang tidak diperlukan semas proses penulin.Pada pekatan yang rendah juga,
imidazole boleh megurangkan kekuatan pengikat diantara histidine tag dengan
protein.Penulisan ini bertujuan untuk mengkaji kesan kepekatan imidazole and ion
logam yang berbeza dalam penulinan GFP dengan menggunakan affinity
chromatography. Escherichia coli (E.coli) BL21 (DE3) strain yang membawa
pRSETGFP plasmid dengan kod GFP telah dibesarkan di dalam Luria-Bertani (LB)
broth pada suhu 300C dan pada kelajuan 200 rpm. Penambahan Isopropyl β-ᴅ-1-
thiogalactopyranoside (IPTG) pada kepadatan sell (OD600) mencecah 0.6-0.8 telah
membantu dalam penghasilan GFP. Sampel GFP kemudianya ditapis dengan
menggunakan penapis nylon sebelum sample melalui proses penulinan dengan
menggunakan HisTrapTM
FF 1 ml column (GE healthcare). Column ini kemudiannya di
charge dengan ion logam yang berbeza-beza (0.1 M NiSO4 atau CuSO4) dan kepekatan
imidazole yang berlainan (100, 200, 300, 400, 500, 600 mM). Untuk tujuan protein
analisis, sampel telah dianalisis dengan menggunakan kaedah Lowry bagi penentukan
jumlah protein yang terhasil , manakala jumlah GFP telah diukur dengan menggunakan
kaedah gel pengimejan. Kaedah ini telah menghasilkn 95 % GFP pada 500 mM
kepekatan imdazole dan 93 % pehasilan GFP apabila ion logam Ni (II) digunakan
sebagai cas . Apabila column ini di cas semula mengunakan ion logam Cu (II), 89%
penulinan pada 500 mM kepekatan imidazole dan 95% pehasilan pada 400 mM
kepekatan imidazole berlaku pada GFP .
IX
TABLE OF CONTENTS
SUPERVISOR’S DECLARATION IV
STUDENT’S DECLARATION V
ACKNOWLEDGEMENT VI
ABSTRACT VII
ABSTRAK VIII
TABLE OF CONTENTS IX
LIST OF FIGURES XI
LIST OF TABLES XII
LIST OF ABBREVIATIONS XIII
CHAPTER 1: INTRODUCTION 1
1.1 Background of study 1
1.2 Problem statement and motivation 2
1.3 Objective 3
1.4 Scope 3
CHAPTER 2: LITERATURE REVIEW 4
2.1 GFP 4
2.2 Application of GFP 5
2.3 Fundamental principle of affinity chromatography 6
2.4 Component of affinity medium 7
2.5 IMAC 8
2.6 Principle of IMAC 9
2.7 Metal ion 9
2.8 Imidazole concentration 10
CHAPTER 3: MATERIALS AND METHODS 11
3.1 Overview 11
3.2 Material 12
3.3 Block flow diagram for overall process 13
3.4 Method 14
3.4.1 Preparation of culture 14
3.4.2 Cultivation of E. coli 14
3.4.3 Feedstock preparation 14
3.4.4 EGFP Purification 15
3.4.4.1 Effect of metal ion on the binding of EGFP protein 15
3.4.4.2 Effect of imidazole concentration 15
3.4.5 Analytical procedure 16
3.4.5.1 Quantitative of total protein concentration 16
3.4.5.2 Quantitation of GFP concentration. 17
3.4.6 Calculation 18
X
CHAPTER 4: RESULT AND DISCUSSION 19
4.1 Effect of imidazole concentration in elution buffer using nickel ion. 19
4.2 Effect of imidazole concentration in elution buffer using copper ion 20
4.3 Choice of metal ion for binding strength 21
CHAPTER 5: CONCLUSION AND RECOMMENDATION 23
5.1 Conclusion 23
5.2 Recommendation 23
REFRENCES 24
APPENDIX A 30
APPENDIX B 37
APPENDIX C 39
XI
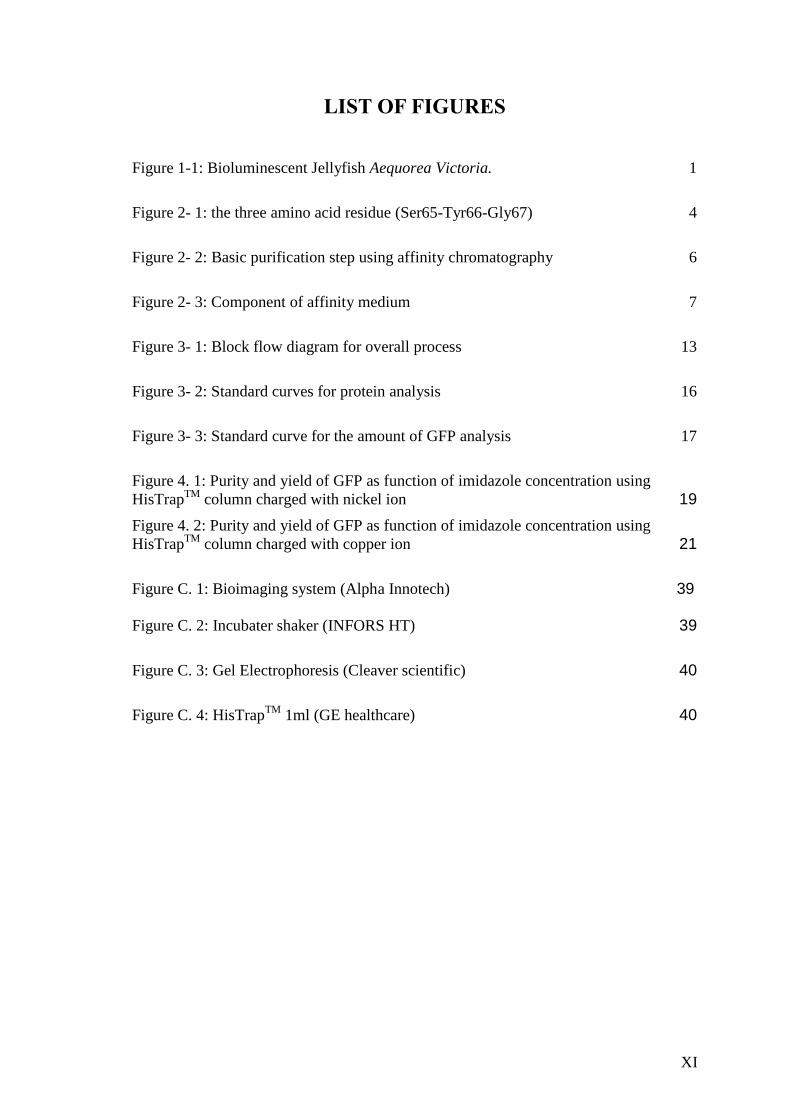
LIST OF FIGURES Figure 1-1: Bioluminescent Jellyfish Aequorea Victoria. 1
Figure 2- 1: the three amino acid residue (Ser65-Tyr66-Gly67) 4
Figure 2- 2: Basic purification step using affinity chromatography 6
Figure 2- 3: Component of affinity medium 7
Figure 3- 1: Block flow diagram for overall process 13
Figure 3- 2: Standard curves for protein analysis 16
Figure 3- 3: Standard curve for the amount of GFP analysis 17
Figure 4. 1: Purity and yield of GFP as function of imidazole concentration using
HisTrapTM
column charged with nickel ion 19
Figure 4. 2: Purity and yield of GFP as function of imidazole concentration using
HisTrapTM
column charged with copper ion 21
Figure C. 1: Bioimaging system (Alpha Innotech) 39
Figure C. 2: Incubater shaker (INFORS HT) 39
Figure C. 3: Gel Electrophoresis (Cleaver scientific) 40
Figure C. 4: HisTrap
TM 1ml (GE healthcare) 40
XII
LIST OF TABLES
Table 2- 1: Types of metal ions and its preferential activity 10
Table 3- 1: Chemicals for each process 12
Table 4. 1: The purification of GFP from recombinant E. coli 22
Table A. 1: Raw data for standard curve of protein 30
Table A. 2: Raw data for GFP standard curve 30
Table A. 3: Raw data for copper ion analysis (from n-PAGE) 31
Table A. 4: Raw data for copper ion analysis (from Lowry method) 32
Table A. 5: Raw data for purity, yield and purification factor of copper ion 33
Table A. 6: Raw data for nickel ion analysis (n-PAGE) 34
Table A. 7: Raw data for nickel ion analysis (Lowry method) 35
Table A. 8: Raw data for the purity, yield and purification factor of nickel ion 36

XIII
LIST OF ABBREVIATIONS CV Column volume
E.coli Escherichia coli
GFP Green Fluorescent Protein
IMAC Immobilized metal affinity chromatography
1
CHAPTER 1: INTRODUCTION
1.1 Background of study
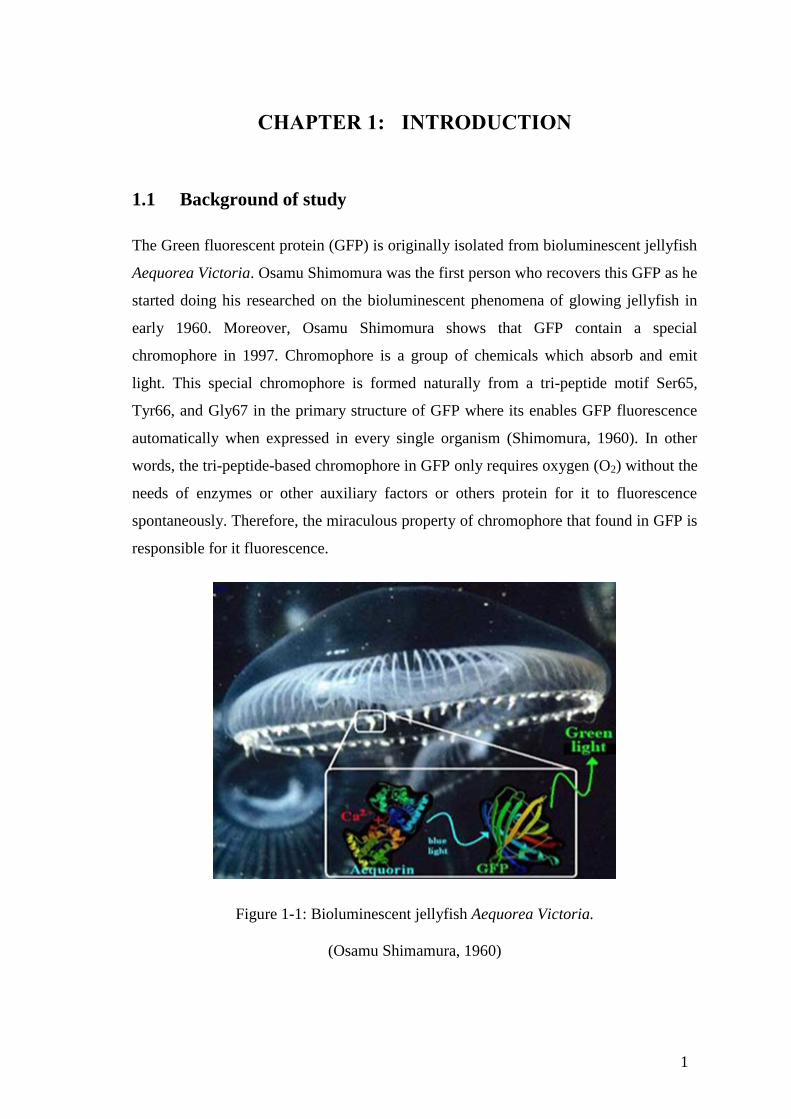
The Green fluorescent protein (GFP) is originally isolated from bioluminescent jellyfish
Aequorea Victoria. Osamu Shimomura was the first person who recovers this GFP as he
started doing his researched on the bioluminescent phenomena of glowing jellyfish in
early 1960. Moreover, Osamu Shimomura shows that GFP contain a special
chromophore in 1997. Chromophore is a group of chemicals which absorb and emit
light. This special chromophore is formed naturally from a tri-peptide motif Ser65,
Tyr66, and Gly67 in the primary structure of GFP where its enables GFP fluorescence
automatically when expressed in every single organism (Shimomura, 1960). In other
words, the tri-peptide-based chromophore in GFP only requires oxygen (O2) without the
needs of enzymes or other auxiliary factors or others protein for it to fluorescence
spontaneously. Therefore, the miraculous property of chromophore that found in GFP is
responsible for it fluorescence.
Figure 1-1: Bioluminescent jellyfish Aequorea Victoria.
(Osamu Shimamura, 1960)
2
This characteristic of GFP has been proved by Roger Tsien in his study on 1994.
The effectiveness of GFP was first acknowledged by Chalfie et al. (1994), who cloned
and expressed the GFP in Escherichia coli (E.coli) and Caenorhabditis elegans (C
elegans). According to Wiedenmann et al. (2006), GFP has become one of the most
broadly studied and exploited protein in biochemistry and cell biology. GFP has become
a favourite marker of gene expression and protein translocation in mammalian,
bacterial, and plant system because of its strong intrinsic visible fluorescence (Ha et al.,
1996).
With its continued use, several reports on GFP recovery and purification
methods have emerged, including organic extraction, size exclusion chromatography
and ion exchange HPLC (Yakhnin et al., 1998; Deschamps et al., 1995). Besides that,
the recovery and purification of GFP can also be done using immobilized metal affinity
chromatography (IMAC) method. Several advantages of IMAC in protein purification
including its stability, high protein loading, mild elution condition, simple regeneration
and low in cost (Arnold, 1991).
1.2 Problem statement and motivation
The purification of protein using IMAC is influenced by imidazole concentration
and type of metal ion. Different type of metal ion and different imidazole concentration
will give different result of purity and yield for target protein (Niebe et al., 1997; Chong
et al., 2009). The strength of binding between histidine-tagged protein and metal ion is
varies depending on the type of protein as well as the ion used. Thus, it is necessary for
different metal ion to be test for their ability to bind the tagged protein (Niebe et al.,
1997). Imidazole is one of the competitive agents that are effective at displacing protein.
Because of this, imidazole is one of the best agents to be used as an eluent. Imidazole at
low concentration is commonly used to minimize binding of host cell protein. However,
at somewhat higher concentration, imidazole may also decrease the binding of histidine
tagged-protein. Thus, imidazole concentration must be optimized to ensure the best
balance of high purity and high yield of the GFP (Clemmit and Chase, 2000).
3
1.3 Objective
The aim of this study is to investigate the effect of imidazole concentration and
types of metal ions on the purification GFP using IMAC.
1.4 Scope
The effect of imidazole concentration (100, 200, 300, 400, 500 and 600 mM)
and the types of metal ion (1.0 M NiSO4 and CuSO4) used on the performance of IMAC
purification method was studied. By varying the imidazole concentration and metal ion,
the purity and yield of GFP were compared in order to identify the best condition for the
purification of GFP. In order to calculate the purity and yield of GFP, two analytical
methods were used including gel imaging method for GFP quantitation and Lowry
method for total protein determination.
4
CHAPTER 2: LITERATURE REVIEW
2.1 GFP
GFP is a naturally fluorescent protein which can be found in a variety of
bioluminescent organism such as the Pacific jellyfish, Aequoria victoria (Morin and
Hasting, 1971). According to Prasher et al. (1992), GFP with 27 kDa is encompassed of
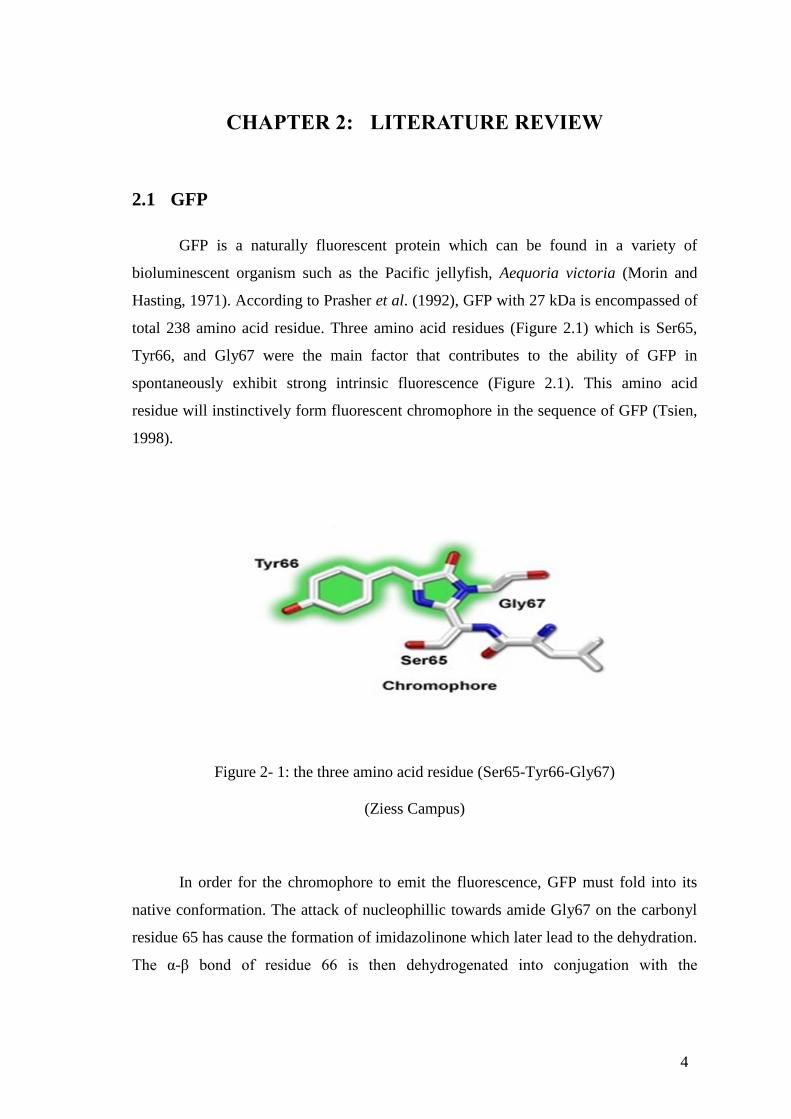
total 238 amino acid residue. Three amino acid residues (Figure 2.1) which is Ser65,
Tyr66, and Gly67 were the main factor that contributes to the ability of GFP in
spontaneously exhibit strong intrinsic fluorescence (Figure 2.1). This amino acid
residue will instinctively form fluorescent chromophore in the sequence of GFP (Tsien,
1998).
Figure 2- 1: the three amino acid residue (Ser65-Tyr66-Gly67)
(Ziess Campus)
In order for the chromophore to emit the fluorescence, GFP must fold into its
native conformation. The attack of nucleophillic towards amide Gly67 on the carbonyl
residue 65 has cause the formation of imidazolinone which later lead to the dehydration.
The α-β bond of residue 66 is then dehydrogenated into conjugation with the
5
imidazolinone at the presence of oxygen molecule. This finally resulted in the
fluorescence of GFP chromophore (Tsien, 1998).
E. coli and C. elegans is the two types of bacteria that have been used to
demonstrate the fluorescent form of GFP (Chalfie et al., 1994). However, as more
research and study has been done, it have been discovered that GFP can also be
expressed in the yeast Sacharomyces cerevisiae, mammalian cell and Drosophila
melanogaster (fruit fly) (Tsien, 1994; Epel et al., 1996; Wang and Hazelrigg, 1994).
According to Tsien (1998), in order to have high expression level and
detectability of GFP, there are many factors that need to be considered such as
promoter, codon usage, and splicing. The higher amount of protein per cell will be
produced if the large number of gene is copied and the stronger promoter is used for its
transcription. However, for plant and mammalian system, there is need for the codon to
be altered so that cryptic splice site can be removed in the plant and the expression level
in the mammalian system can be improved (Haseloff et al., 1997; Zolotukhin et al.,
1996; Yang et al., 1996).
2.2 Application of GFP
GFP was first used as a reporter gene in 1994. Since that time, GFP has always
been a favourite gene for the researcher. The most commonly used of GFP is for the
entire organism visualization. Once the gene of GFP is expressed in the interest
organism protein gene, the location, movement and others activities of the protein can
be followed using microscopic by monitoring the GFP fluorescent (Wang and
Hazelrigg, 1994). This fusion gene will not affect the activity of the interest protein as
well as fluorescence of GFP (Chalfie et al., 1994).
Based on the research done by Elliot et al. (1998), using the sugarcane
transformed with GFP-S65T, GFP have been used to replace antibiotic selection which
later become a great used when the organogenesis or conversion segments of
transformation procedures are inefficient under antibiotic or herbicide selection.
Moreover, the development of GFP biosensors has become a great advantage for the
small molecule detection in both environmental and bioprocess engineering (Kim et al.
6
2002; Stiner and Halverson, 2002; Eggeling et al., 2001). All this proved the GFP is
important toward biotechnology industry.
2.3 Fundamental principle of affinity chromatography
Affinity chromatography was first introduced by Cuatrecasas et al. (1998). Since
that day, affinity chromatography has been developed to become a powerful tool for the
purification of substance in a complex biological mixture. This tool helps to separates a
desired protein from the affinity ligand that coupled to chromatographic matrix. These
biochemical separations depend on the reversible interaction between the protein to be
purified and its cognate ligands. According to Dorsey and Cooper (1994), these reverse
interaction is an interaction of hydrophobic protein (mobile phase) with an immobilized
hydrophobic ligand (stationary phase) in a polar aqueous phase which is reversed from
normal phase chromatography where usually, a hydrophilic polar ligand will bind to
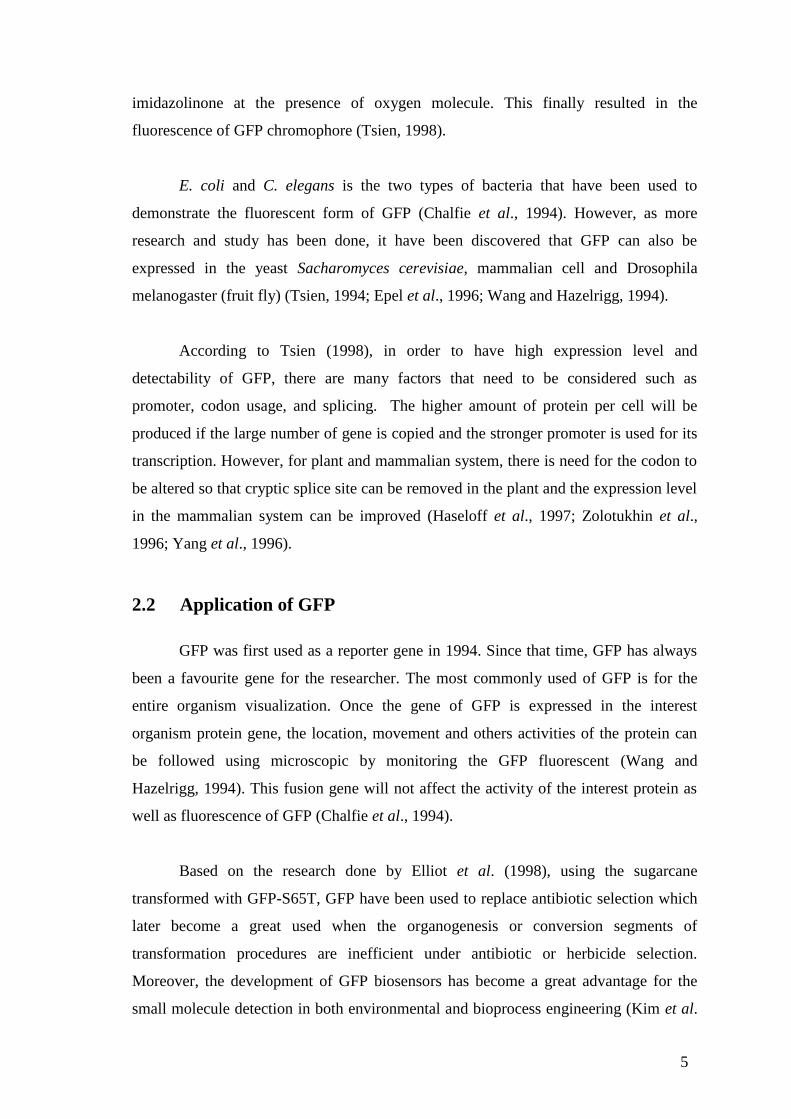
molecules in a hydrophobic nonpolar mobile phase. A basic purification step using
affinity chromatography is shown in Figure 2.2.
Figure 2- 2: Basic purification step using affinity chromatography
(Sameh and Annette, 2012)
7
The purification using affinity chromatography begins with the equilibration of
its column by binding buffer. The purpose for this equilibration step is to ensure that
the affinity interaction between the protein and immobilized molecules occurs in an
optimum condition. After the sample is loading into the column, a washing step is
applied to remove all unwanted substance and left out the desired protein who still
attached to the affinity support. Then, desired protein is obtained by eluted it using high
concentration of free ligand that will compete for the binding site of the protein (Luana
et al., 2012).
2.4 Component of affinity medium
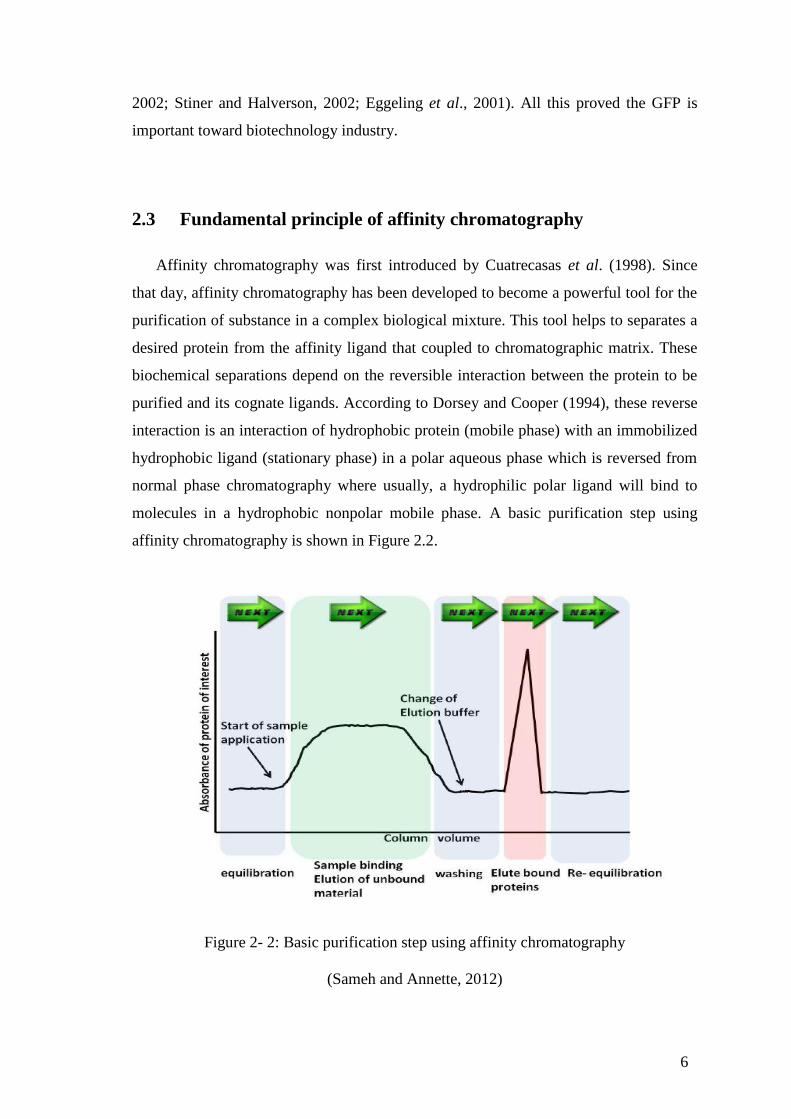
Common porous material such as agarose, polymethacrylate, polyacrylamide,
cellulose, and silica are those support materials that have been used in affinity
chromatography (Figure 2.3). Nevertheless, there are several factors that need to be
taken into account when choosing a support material. The factors are chemical
inertness, chemical stability, mechanical stability, pore size and particle size. Chemical
inertness for the material support is required in order to ensure that the affinity support
bind only to the interested molecule and no nonspecific binding (Sameh and Annette,
2012).
Figure 2- 3: Component of affinity medium
(GE healthcare, Affinity chromatography: Principle and method)
8
Next, the material support for affinity chromatography must be chemically stable so
that it can resist to the degradation cause by all enzyme and microbes, elution buffers,
regenerating solvent and cleaning agent that will be used in the affinity column. Besides
that, the material support must also able to sustain the backpressure that occurs during
the separation process without compressing. To ensure that a large amount of affinity
ligands is allowed to immobilize on the surface of the support, small particles size of
support materials is preferred compared to the large size (Sameh and Annette, 2012).
According to Renkin (1954), the diameter of the pore should at least 5 times larger
than the diameter of biomolecule that being purified. This is must to ensure that
biomolecules of the interest can be fully interacting with the affinity ligand. The spacer
arms must not be too short or too long as it will affect the binding of biomolecule of
interest which later result in the failure of its binding with the ligand. Last but not least,
the ligand used must be able form reversible complexes with the protein to isolate.
2.5 IMAC
IMAC was first introduced by Porath and his coworkers in 1975 under the name
of Metal chelate affinity chromatography. According to Chaga (2001), there is a lot of
papers emerged, defining the use of this principle not only for group separations, but
also can be used as a highly selective purification tool for target proteins from complex
biological. Since from its first introduce until now, IMAC have become a technology
with a very broad portfolio of applications. Some of the application of IMAC are
immobilized metal ions in agarose and capillary electrophoresis, (Goubran et al, 1992),
immobilized metal ions on soluble chelating polymers for selective precipitation and in
two-phase systems, based on the introduction of the immobilized metal ion in either the
PEG or dextran phase, (Van Dam et al., 1989), and the purification of DNA and
oligonucleotide derivatives tagged with histidine residues.
9
2.6 Principle of IMAC
IMAC is a separation principle that utilizes the differential affinity of proteins
for immobilized metal ions to affect their separation. This differential affinity develops
from the formation of coordination bonds between metal ions and certain amino acid
side chains on the surface of the protein molecules. In addition, as the interaction of
immobilized metal ion and amino acid side chain is already reversible. Thus, the
utilization for adsorption and then denaturing can be done (Chaga, 2009). Most
commonly used, transition-metal ions are Cu (II), Ni (II), Zn (II), Co (II), and Fe (III)
which are electron-pair acceptor and can be considered as Lewis acid. Usually
iminodiacetic acid (IDA) and nitrilotriacetic acid (NTA) are two chelating agent that is
commonly used in the IMAC application (Westra et al., 2001). However, IDA is a
commercially accessible from many producers since it forms a stronger protein binding
(Valdka et al., 2001).
2.7 Metal ion
According to Pearson (1973), in IMAC field, metal ion can be classified based
on the principle of hard and soft acid and base (HSAB). This principle state that, when
two atom form a bond, one of them will act as Lewis acid and the other one act as
Lewis base. Metal ion also can classify into three categories, hard, borderline or
intermediate and soft based on their preferential reactivity toward nucleophile. At first it
was reported that hard type of metal ion is used for the purification of protein. However,
later on it is reported that immobilized Ca (II) ions is use for the purification of Lectin
(Borrebaeck et al, 1981; Borrebaeck et al, 1984). Furthermore, the difference between
affinity intermediate metal ions and hard metal ions is studied and the natural extension
of this observation is used for the purification of calcium binding protein by using
IMAC (Mantovaara et al., 1991; Chaga et al., 1996).
10
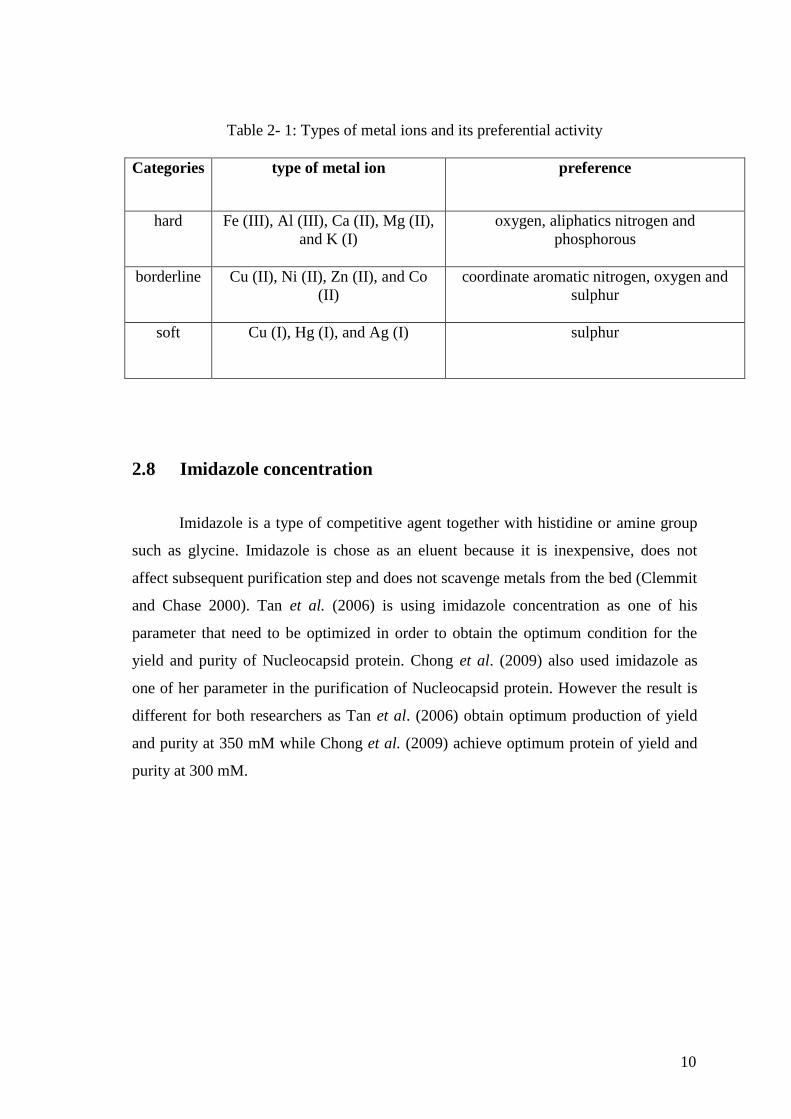
Table 2- 1: Types of metal ions and its preferential activity
Categories type of metal ion preference
hard Fe (III), Al (III), Ca (II), Mg (II),
and K (I)
oxygen, aliphatics nitrogen and
phosphorous
borderline Cu (II), Ni (II), Zn (II), and Co
(II)
coordinate aromatic nitrogen, oxygen and
sulphur
soft Cu (I), Hg (I), and Ag (I) sulphur
2.8 Imidazole concentration
Imidazole is a type of competitive agent together with histidine or amine group
such as glycine. Imidazole is chose as an eluent because it is inexpensive, does not
affect subsequent purification step and does not scavenge metals from the bed (Clemmit
and Chase 2000). Tan et al. (2006) is using imidazole concentration as one of his
parameter that need to be optimized in order to obtain the optimum condition for the
yield and purity of Nucleocapsid protein. Chong et al. (2009) also used imidazole as
one of her parameter in the purification of Nucleocapsid protein. However the result is
different for both researchers as Tan et al. (2006) obtain optimum production of yield
and purity at 350 mM while Chong et al. (2009) achieve optimum protein of yield and
purity at 300 mM.
11
CHAPTER 3: MATERIALS AND METHODS
3.1 Overview
In this section, the experiment procedure will be explained in details. All
chemicals used in this experiment were obtained from the faculty of engineering and
natural resources (FKKSA) laboratory. However some of them were purchased from
Sigma Aldrich (Malaysia). Experiment ware done in FKKSA laboratory for 14 weeks.
Moreover, all the apparatus used for this experiment were borrowed form FKKSA store
that were located inside the FKKSA laboratory. In order to ensure all the experiment
were doing in appropriate manner by using the equipment properly, the training were
taken under a guidance from lecture engineer (“ Jurutera Pengajar” JP). Therefore, the
experiment can be safely done.
12
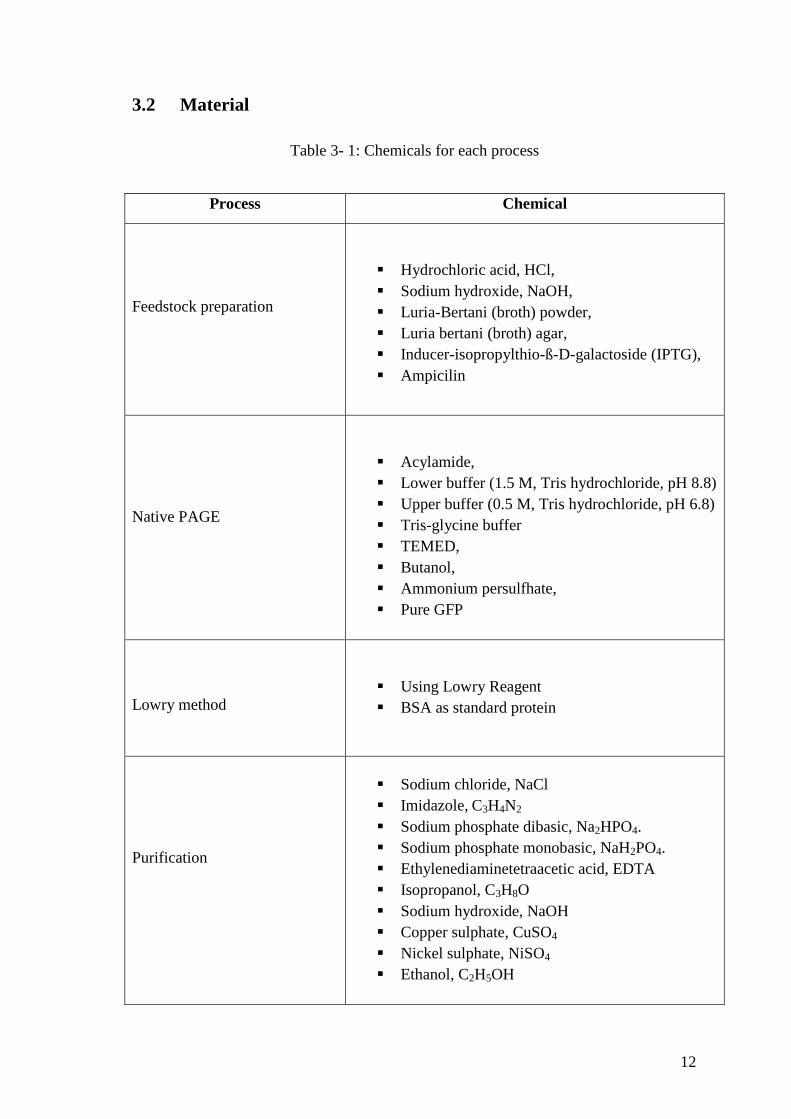
3.2 Material
Table 3- 1: Chemicals for each process
Process Chemical
Feedstock preparation
Hydrochloric acid, HCl,
Sodium hydroxide, NaOH,
Luria-Bertani (broth) powder,
Luria bertani (broth) agar,
Inducer-isopropylthio-ß-D-galactoside (IPTG),
Ampicilin
Native PAGE
Acylamide,
Lower buffer (1.5 M, Tris hydrochloride, pH 8.8)
Upper buffer (0.5 M, Tris hydrochloride, pH 6.8)
Tris-glycine buffer
TEMED,
Butanol,
Ammonium persulfhate,
Pure GFP
Lowry method
Using Lowry Reagent
BSA as standard protein
Purification
Sodium chloride, NaCl
Imidazole, C3H4N2
Sodium phosphate dibasic, Na2HPO4.
Sodium phosphate monobasic, NaH2PO4.
Ethylenediaminetetraacetic acid, EDTA
Isopropanol, C3H8O
Sodium hydroxide, NaOH
Copper sulphate, CuSO4
Nickel sulphate, NiSO4
Ethanol, C2H5OH
13
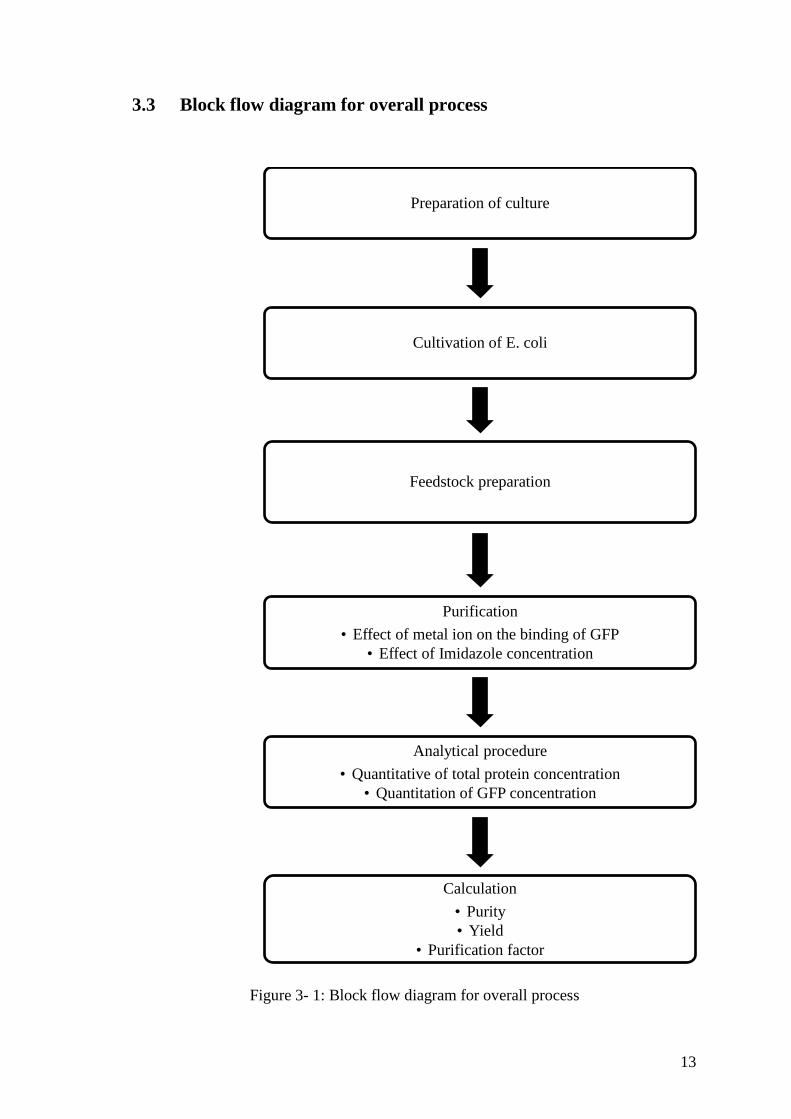
3.3 Block flow diagram for overall process
Figure 3- 1: Block flow diagram for overall process
Preparation of culture
Cultivation of E. coli
Feedstock preparation
Purification
• Effect of metal ion on the binding of GFP
• Effect of Imidazole concentration
Analytical procedure
• Quantitative of total protein concentration
• Quantitation of GFP concentration
Calculation
• Purity
• Yield
• Purification factor
14
3.4 Method
3.4.1 Preparation of culture
The nutrient agar was prepared by mixing 8 g of Luria-Bertani broth with 400
mL of distilled water. The powder was dissolved completely in water using magnetic
stirrer before sent for autoclaving at 121oC for 15 min. After heat sterilisation process,
the nutrient agar was allowed to cool for several minutes before pouring it into petri
dish. The medium agar was allowed to solidify at room temperature. E.coli strain BL21
(DE3) carrying the pRSETGFP plasmid encoding enhanced EGFP was transferred to
agar plate by streaking method, aseptically and seal with parafilm. Incubate at 370C for
24 h.
3.4.2 Cultivation of E. coli
Single colony of E. coli from agar plate was grown in 50 ml of Luria-Bertani
broth with 100 µg/ml of ampicillin. The broths were then put into the incubator shaker
(Ecotron, INFORS HT) at 300C and 200 rpm for 18 h. The pH of the culture medium
was adjusting using hydrochloric acid (HCl) before inoculation and it was not
controlled throughout the fermentation. The prepared inoculum was transfer to 1000 ml
of Erlenmeyer flask (ratio of media/flask volume = 0.2) and grown for 16 h by shaking
at 300C and 200 rpm. Protein expression was induced by adding Isopropyl ß-ᴅ-1-
thiologalactopyranoside (IPTG) after optical density (OD600 nm) reached 0.6-0.8. After
16 h cultivation the cells were then harvested by centrifugation at 5000 x g for 30 min at
40C (Lee and Tan, 2008).
3.4.3 Feedstock preparation
The cell pellets were washing with sample buffer (20 mM sodium phosphate
buffer at pH 7.4) and later were centrifuged at 5000 x g for 30 min at 40C. After that, the
cell pellets were suspended in sample buffer (20 mM sodium phosphate buffer at pH
7.4) at 10% (w/v) biomass concentration. Later, the cells were then disrupted using
15
freezing and thawing method. The sample were frozen in the chiller at -800C for 30 min
and then placed in the water bath for 30 min for thawing. The cycles were repeated for 3
times. The cell debris was then removed by centrifugation at 12,000 x g for 10 min at
40C. Finally the sample were filtered using 0.45 μl of nylon filter before proceed to the
purification process.
3.4.4 EGFP Purification
3.4.4.1 Effect of metal ion on the binding of EGFP protein
HisTrapTM
FF 1 ml column (GE healthcare) were first stripped with 10 column
volume (CV) stripping buffer (20 mM sodium phosphate, 0.5 M NaCl, 50 mM EDTA,
pH 7.4) and wash with10 CV binding buffer (20 mM sodium phosphate, 0.5 M NaCl,
20 mM imidazole, pH 7.4) followed by 10 CV of distilled water before the column was
recharged with different types of metal ion (0.1 M NiSO4 or CuSO4). The column was
then washed and equilibrated with 5 CV of distilled water and 5 CV binding buffer
before applying the sample. After the samples were loaded into the column, the samples
were then washed with 15 CV of binding buffer. Eluted protein fractions were collected
using 5 CV elution buffer (20 mM sodium phosphate, 0.5 M NaCl, 100-600 mM
imidazole, pH 7.4) and analysed for the amount of GFP and total protein. The purity
and yield of GFP obtained in the purified fraction were then calculated as described by
Chew et al. (2009).
3.4.4.2 Effect of imidazole concentration
Prior filling the feedstock into the HisTrapTM
FF 1 ml column, the affinity
supports were first equilibrating with binding buffer. GFP lysate (5 ml) was then loaded
into the column. The column was then washed 15 CV binding buffer to remove loosely
bound protein. After washing step, the GFP was eluted from the column using 5 CV
elution buffer with different concentration of imidazole (100, 200, 300, 400, 500, and
600 mM). Eluted protein fractions were collected and analysed for the amount of GFP
and total protein.
16
3.4.5 Analytical procedure
3.4.5.1 Quantitative of total protein concentration
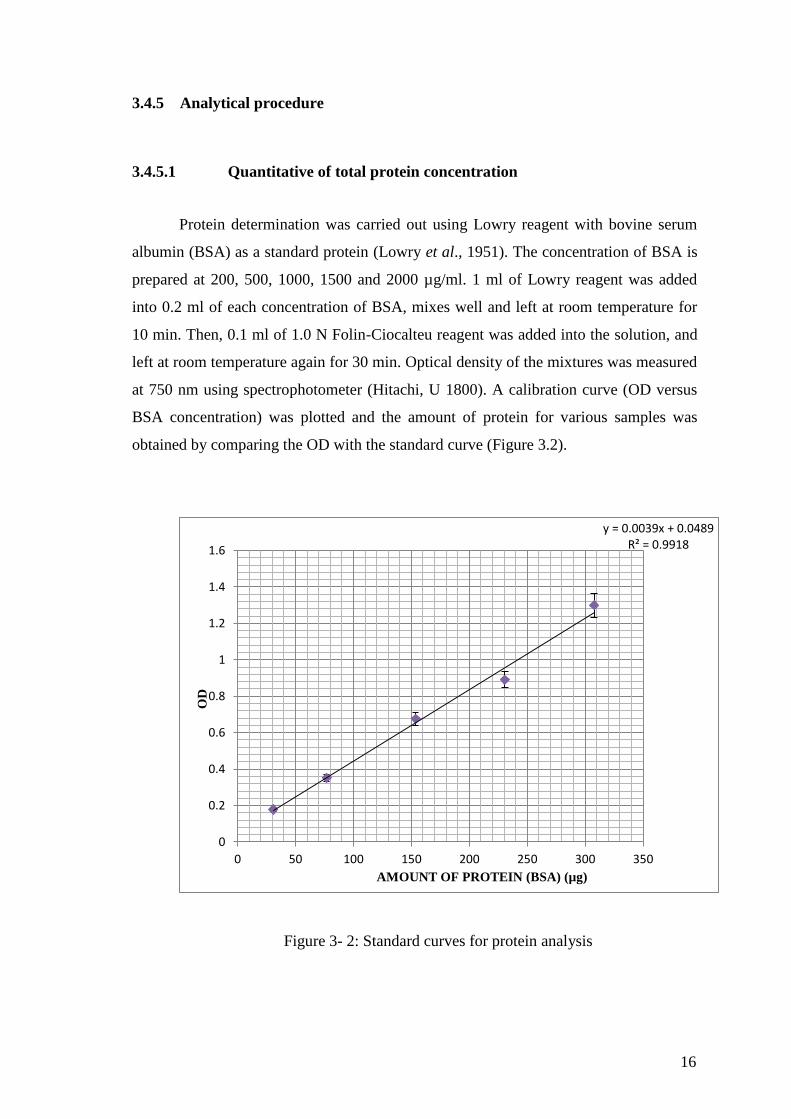
Protein determination was carried out using Lowry reagent with bovine serum
albumin (BSA) as a standard protein (Lowry et al., 1951). The concentration of BSA is
prepared at 200, 500, 1000, 1500 and 2000 µg/ml. 1 ml of Lowry reagent was added
into 0.2 ml of each concentration of BSA, mixes well and left at room temperature for
10 min. Then, 0.1 ml of 1.0 N Folin-Ciocalteu reagent was added into the solution, and
left at room temperature again for 30 min. Optical density of the mixtures was measured
at 750 nm using spectrophotometer (Hitachi, U 1800). A calibration curve (OD versus
BSA concentration) was plotted and the amount of protein for various samples was
obtained by comparing the OD with the standard curve (Figure 3.2).
Figure 3- 2: Standard curves for protein analysis
y = 0.0039x + 0.0489 R² = 0.9918
0
0.2
0.4
0.6
0.8
1
1.2
1.4
1.6
0 50 100 150 200 250 300 350
OD
AMOUNT OF PROTEIN (BSA) (µg)