Effect of growth temperature on the synthesis of …rupert.eng.uci.edu/Publications/PSSA_Effect of...
7
Effect of growth temperature on the synthesis of carbon nanotube arrays and amorphous carbon for thermal applications Quang N. Pham 1,2 , LeighAnn S. Larkin 1 , Carina C. Lisboa 1,3 , Christopher B. Saltonstall 1,4 , Lin Qiu * ,1,5 , Jennifer D. Schuler 2 , Timothy J. Rupert 2 , and Pamela M. Norris 1 1 Department of Mechanical and Aerospace Engineering, University of Virginia, Charlottesville, VA 22904-4746, USA 2 Department of Mechanical and Aerospace Engineering, University of California-Irvine, Irvine, CA 92697, USA 3 Centro Tecnol ogico da Marinha em S~ ao Paulo, Av. Prof. Lineu Prestes, 2468, Cidade Universit aria, S~ ao Paulo 05508-000, SP, Brazil 4 Sandia National Laboratories, P.O. Box 5800 Box 5800, Albuquerque, New Mexico 87185, USA 5 School of Energy and Environmental Engineering, University of Science and Technology Beijing, Beijing 100083, China Received 3 November 2016, revised 24 February 2017, accepted 15 March 2017 Published online 6 April 2017 Keywords amorphous carbon, carbon nanotubes, chemical vapor deposition, crystallinity, tube inhomogeneity * Corresponding author: e-mail [email protected], Phone/Fax: þ86 10 623 32743 Though carbon nanotube (CNT) arrays have tremendous potential due to their attractive mechanical, electrical, and thermal properties, the growth kinetics of CNTs are still not fully understood. Thus, we report on the effect of synthesis parameters, such as growth temperature, on the resulting arrays. In this work, CNT arrays were synthesized using catalytic chemical vapor deposition (CCVD) with furnace temperatures varying from 680 to 900 8C. Microscopy was used to investigate the effect of growth temperature on the structural properties, such as tube diameter, array length, and the amount of amorphous carbon produced at the top of the canopy as a growth by-product. Additionally, Raman spectroscopy was used to elucidate the effect growth temperature has on the resulting purity of the CNTs. It was then revealed that crystalline inhomogeneity exists along the length of the tubes with respect to crystallinity. Transmission electron microscopy (TEM) further determines the degree of tube crystallinity as well as the thickness of amorphous carbon coating around the nanotubes. Through both microscopy and spectroscopy, we found two distinct temperature regimes within the range of 680–900 8C. Below 800 8C, the growth of tube length and diameter remained relatively stagnant followed by a rapid growth rate above 800 8C with the highest tube crystallinity obtained within the regime of 800–840 8C. This indicates the presence of an important transitional temperature for CNT CCVD growth. Additionally, growth temperature was determined to play an important role in the amount of the resulting amorphous carbon by-product. ß 2017 WILEY-VCH Verlag GmbH & Co. KGaA, Weinheim 1 Introduction The promising thermal [1–3] and elastic [4, 5] properties of carbon nanotube (CNT) arrays allow them to withstand mismatched coefficients of thermal expansion at solid-solid interfaces during thermal cycling without mechanical degradation. Thus, numerous studies have proposed CNT arrays as ideal candidates for advanced thermal interface materials (TIMs) [6–8], media placed at the interface to enhance conduction, often between a heat source and a sink. For integration of CNTs as TIMs, the thermal conductivity of CNTS must be high. The thermal conductivity of a single CNT can be as high as 3000 Wm 1 K 1 , but the thermal conductivity of arrays has been measured and estimated to be two to three orders of magnitude lower. The reduction in thermal conductivity is due to inhomogeneities and amorphous carbon (a-C), both resulting from the growth process. Several investigations have attempted to rid arrays of a-C with various post- processing treatments, but these are often damaging to the arrays [9–12]. In addition to excess a-C, reduced crystallinity of the tubes and a large number of concentric walls can enhance phonon scattering thus reducing the thermal conduction. Therefore, it is of great interest to be Phys. Status Solidi A, 1600852 (2017) / DOI 10.1002/pssa.201600852 applications and materials science status solidi www.pss-a.com physica a ß 2017 WILEY-VCH Verlag GmbH & Co. KGaA, Weinheim
Transcript of Effect of growth temperature on the synthesis of …rupert.eng.uci.edu/Publications/PSSA_Effect of...
Effect of growth temperature on thesynthesis of carbon nanotube arraysand amorphous carbon for thermalapplications
Quang N. Pham1,2, LeighAnn S. Larkin1, Carina C. Lisboa1,3, Christopher B. Saltonstall1,4, Lin Qiu*,1,5,Jennifer D. Schuler2, Timothy J. Rupert2, and Pamela M. Norris1
1 Department of Mechanical and Aerospace Engineering, University of Virginia, Charlottesville, VA 22904-4746, USA2Department of Mechanical and Aerospace Engineering, University of California-Irvine, Irvine, CA 92697, USA3Centro Tecnol�ogico da Marinha em S~ao Paulo, Av. Prof. Lineu Prestes, 2468, Cidade Universit�aria, S~ao Paulo 05508-000, SP, Brazil4 Sandia National Laboratories, P.O. Box 5800 Box 5800, Albuquerque, New Mexico 87185, USA5 School of Energy and Environmental Engineering, University of Science and Technology Beijing, Beijing 100083, China
Received 3 November 2016, revised 24 February 2017, accepted 15 March 2017Published online 6 April 2017
Keywords amorphous carbon, carbon nanotubes, chemical vapor deposition, crystallinity, tube inhomogeneity
* Corresponding author: e-mail [email protected], Phone/Fax: þ86 10 623 32743
Though carbon nanotube (CNT) arrays have tremendouspotential due to their attractive mechanical, electrical, andthermal properties, the growth kinetics of CNTs are still notfully understood. Thus, we report on the effect of synthesisparameters, such as growth temperature, on the resultingarrays. In this work, CNT arrays were synthesized usingcatalytic chemical vapor deposition (CCVD) with furnacetemperatures varying from 680 to 900 8C. Microscopy wasused to investigate the effect of growth temperature on thestructural properties, such as tube diameter, array length, andthe amount of amorphous carbon produced at the top of thecanopy as a growth by-product. Additionally, Ramanspectroscopy was used to elucidate the effect growthtemperature has on the resulting purity of the CNTs. It was
then revealed that crystalline inhomogeneity exists along thelength of the tubes with respect to crystallinity. Transmissionelectron microscopy (TEM) further determines the degree oftube crystallinity as well as the thickness of amorphous carboncoating around the nanotubes. Through both microscopy andspectroscopy, we found two distinct temperature regimeswithin the range of 680–900 8C. Below 800 8C, the growth oftube length and diameter remained relatively stagnant followedby a rapid growth rate above 800 8C with the highest tubecrystallinity obtained within the regime of 800–840 8C. Thisindicates the presence of an important transitional temperaturefor CNTCCVD growth. Additionally, growth temperature wasdetermined to play an important role in the amount of theresulting amorphous carbon by-product.
� 2017 WILEY-VCH Verlag GmbH & Co. KGaA, Weinheim
1 Introduction The promising thermal [1–3] andelastic [4, 5] properties of carbon nanotube (CNT) arraysallow them to withstand mismatched coefficients of thermalexpansion at solid-solid interfaces during thermal cyclingwithout mechanical degradation. Thus, numerous studieshave proposed CNT arrays as ideal candidates for advancedthermal interface materials (TIMs) [6–8], media placedat the interface to enhance conduction, often between a heatsource and a sink. For integration of CNTs as TIMs,the thermal conductivity of CNTS must be high. Thethermal conductivity of a single CNT can be as high as
3000Wm�1K�1, but the thermal conductivity of arrays hasbeen measured and estimated to be two to three orders ofmagnitude lower. The reduction in thermal conductivity isdue to inhomogeneities and amorphous carbon (a-C), bothresulting from the growth process. Several investigationshave attempted to rid arrays of a-C with various post-processing treatments, but these are often damaging to thearrays [9–12]. In addition to excess a-C, reducedcrystallinity of the tubes and a large number of concentricwalls can enhance phonon scattering thus reducing thethermal conduction. Therefore, it is of great interest to be
Phys. Status Solidi A, 1600852 (2017) / DOI 10.1002/pssa.201600852
applications and materials science
statu
s
soli
di
www.pss-a.comph
ysi
ca a
� 2017 WILEY-VCH Verlag GmbH & Co. KGaA, Weinheim
able to synthesize repeatable, high-quality CNT arrays by asystematic study of growth parameters to modulate thestructural characteristics and eliminate the as-producedlayer of a-C and tube inhomogeneities, nondestructively.
In this study, we systematically modulate growthtemperature from 680 to 900 8C in increments of 20 8C ina catalytic chemical vapor deposition (CCVD) growthtechnique to determine the effect of growth temperature onthree key resulting characteristics (array height, tubediameter, and tube crystallinity) of CNT arrays. To thebest of our knowledge, this is the largest presentedtemperature range with such small increments, used tostudy the temperature effects on CNT growth usingchemical vapor deposition in detail. Special attention willbe focused on the resulting array structure and crystallinityat growth temperature ranges of �780–850 8C since theseare commonly reported temperatures for CCVD CNTsynthesis [14, 17]. Scanning electron microscopy (SEM)was used to examine array heights, tube diameters, and thea-C content on the canopy of the arrays. Ramanspectroscopy was used to measure structural defects andcrystallinity of the tubes. High resolution transmissionelectron microscopy (HRTEM) was used to determineinterlayer spacing, the number of concentric walls, ironnanoparticle size, crystallinity, inner and outer CNTdiameter, and amorphous coating thickness surroundingthe nanotubes. Through this level of characterization, we areable to report on the effect of growth temperature on CCVDgrown CNTs.
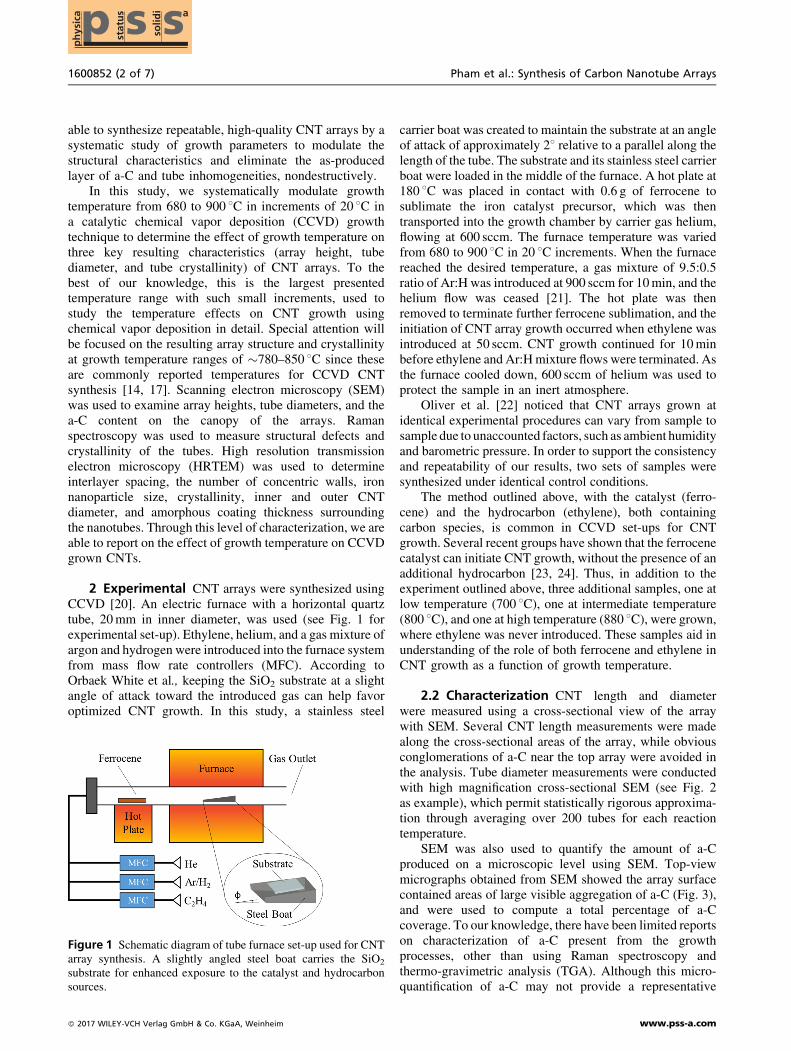
2 Experimental CNT arrays were synthesized usingCCVD [20]. An electric furnace with a horizontal quartztube, 20mm in inner diameter, was used (see Fig. 1 forexperimental set-up). Ethylene, helium, and a gas mixture ofargon and hydrogen were introduced into the furnace systemfrom mass flow rate controllers (MFC). According toOrbaek White et al., keeping the SiO2 substrate at a slightangle of attack toward the introduced gas can help favoroptimized CNT growth. In this study, a stainless steel
carrier boat was created to maintain the substrate at an angleof attack of approximately 28 relative to a parallel along thelength of the tube. The substrate and its stainless steel carrierboat were loaded in the middle of the furnace. A hot plate at180 8C was placed in contact with 0.6 g of ferrocene tosublimate the iron catalyst precursor, which was thentransported into the growth chamber by carrier gas helium,flowing at 600 sccm. The furnace temperature was variedfrom 680 to 900 8C in 20 8C increments. When the furnacereached the desired temperature, a gas mixture of 9.5:0.5ratio of Ar:H was introduced at 900 sccm for 10min, and thehelium flow was ceased [21]. The hot plate was thenremoved to terminate further ferrocene sublimation, and theinitiation of CNT array growth occurred when ethylene wasintroduced at 50 sccm. CNT growth continued for 10minbefore ethylene and Ar:Hmixture flows were terminated. Asthe furnace cooled down, 600 sccm of helium was used toprotect the sample in an inert atmosphere.
Oliver et al. [22] noticed that CNT arrays grown atidentical experimental procedures can vary from sample tosample due to unaccounted factors, such as ambient humidityand barometric pressure. In order to support the consistencyand repeatability of our results, two sets of samples weresynthesized under identical control conditions.
The method outlined above, with the catalyst (ferro-cene) and the hydrocarbon (ethylene), both containingcarbon species, is common in CCVD set-ups for CNTgrowth. Several recent groups have shown that the ferrocenecatalyst can initiate CNT growth, without the presence of anadditional hydrocarbon [23, 24]. Thus, in addition to theexperiment outlined above, three additional samples, one atlow temperature (700 8C), one at intermediate temperature(800 8C), and one at high temperature (880 8C), were grown,where ethylene was never introduced. These samples aid inunderstanding of the role of both ferrocene and ethylene inCNT growth as a function of growth temperature.
2.2 Characterization CNT length and diameterwere measured using a cross-sectional view of the arraywith SEM. Several CNT length measurements were madealong the cross-sectional areas of the array, while obviousconglomerations of a-C near the top array were avoided inthe analysis. Tube diameter measurements were conductedwith high magnification cross-sectional SEM (see Fig. 2as example), which permit statistically rigorous approxima-tion through averaging over 200 tubes for each reactiontemperature.
SEM was also used to quantify the amount of a-Cproduced on a microscopic level using SEM. Top-viewmicrographs obtained from SEM showed the array surfacecontained areas of large visible aggregation of a-C (Fig. 3),and were used to compute a total percentage of a-Ccoverage. To our knowledge, there have been limited reportson characterization of a-C present from the growthprocesses, other than using Raman spectroscopy andthermo-gravimetric analysis (TGA). Although this micro-quantification of a-C may not provide a representative
Figure 1 Schematic diagram of tube furnace set-up used for CNTarray synthesis. A slightly angled steel boat carries the SiO2
substrate for enhanced exposure to the catalyst and hydrocarbonsources.
1600852 (2 of 7) Pham et al.: Synthesis of Carbon Nanotube Arrays
� 2017 WILEY-VCH Verlag GmbH & Co. KGaA, Weinheim www.pss-a.com
ph
ysic
a ssp stat
us
solid
i a
analysis of overall CNT structural purity, it can providevisible evidence of an increase in a-C particulate formationat varying temperatures.
Raman spectroscopy was used to characterize themicrostructure of the CNT arrays. Key characteristics ofthe Raman spectra of graphitic-like carbon allotropes aretwo sharp peaks, a so called “D peak” at around 1300 cm�1
and a G peak around 1600 cm�1 [25]. The G peak arisesfrom zone centered sp2 vibrations present in graphite,hence G or graphite peak. The lower frequency D peakoriginates from the K-point phonons, a prohibited Ramanactive mode in perfectly ordered graphite, but disorderrelaxes this constraint to produce a D, or disorder, peak.The relative and integrated intensities of the D and Gpeaks, that is AD/AG, is a method for characterization of thedisorder present in the system at the length scalespenetrable by the 785 nm laser, that is a few nanometers.In the present study, Raman spectroscopy was collected at
the top of the canopy and along the length of the tubes. Threecross-sectional Raman spectra measurements were made atrandomly chosen locations on the sample in order to removethe effects of any local noncrystalline carbonaceous speciesthat may be present at some positions in the sample. Theratio of the integrated intensity of the D to G peaks at the topand center points corresponds to the average between thethree separate measurements at the same height, either atthe top of the tubes (omitting any clear a-C layer), or at thecenter point, halfway along the length, of the tubes,respectively. The average point represents the average of allcross-sectional measurements made for that sample. TheAD/AG ratios at the top and bottom of the tubes, as well asthe average AD/AG value, computed along the length of thetubes, can be seen in Fig. 4.
HRTEM provides opportunities to observe the tubularstructure of CNTs as well as quantify the degree of theircrystallinity through analyzing selected area electrondiffraction (SAED) patterns. In this work, images arecollected from an FEI Titan operating at 300 kV. Estimatesof tube diameter distribution provided by SEM arecorroborated through TEM inspection of the tuber innerand outer diameters. TEM is also used to quantify the sizeand crystallinity of the encapsulated iron nanoparticles,number of concentric tube walls, interlayer spacing, andamorphous coating thickness around the outer layer ofthe tubes.
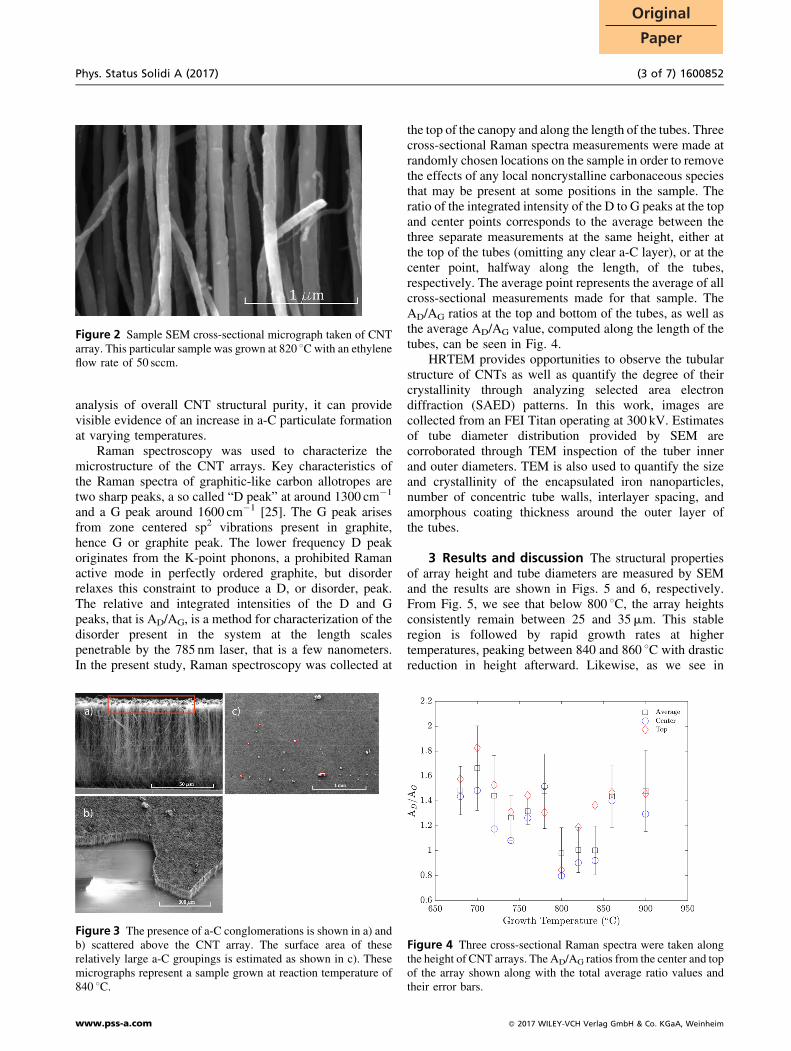
3 Results and discussion The structural propertiesof array height and tube diameters are measured by SEMand the results are shown in Figs. 5 and 6, respectively.From Fig. 5, we see that below 800 8C, the array heightsconsistently remain between 25 and 35mm. This stableregion is followed by rapid growth rates at highertemperatures, peaking between 840 and 860 8C with drasticreduction in height afterward. Likewise, as we see in
Figure 2 Sample SEM cross-sectional micrograph taken of CNTarray. This particular sample was grown at 820 8Cwith an ethyleneflow rate of 50 sccm.
Figure 3 The presence of a-C conglomerations is shown in a) andb) scattered above the CNT array. The surface area of theserelatively large a-C groupings is estimated as shown in c). Thesemicrographs represent a sample grown at reaction temperature of840 8C.
Figure 4 Three cross-sectional Raman spectra were taken alongthe height of CNT arrays. The AD/AG ratios from the center and topof the array shown along with the total average ratio values andtheir error bars.
Phys. Status Solidi A (2017) (3 of 7) 1600852
www.pss-a.com � 2017 WILEY-VCH Verlag GmbH & Co. KGaA, Weinheim
Original
Paper
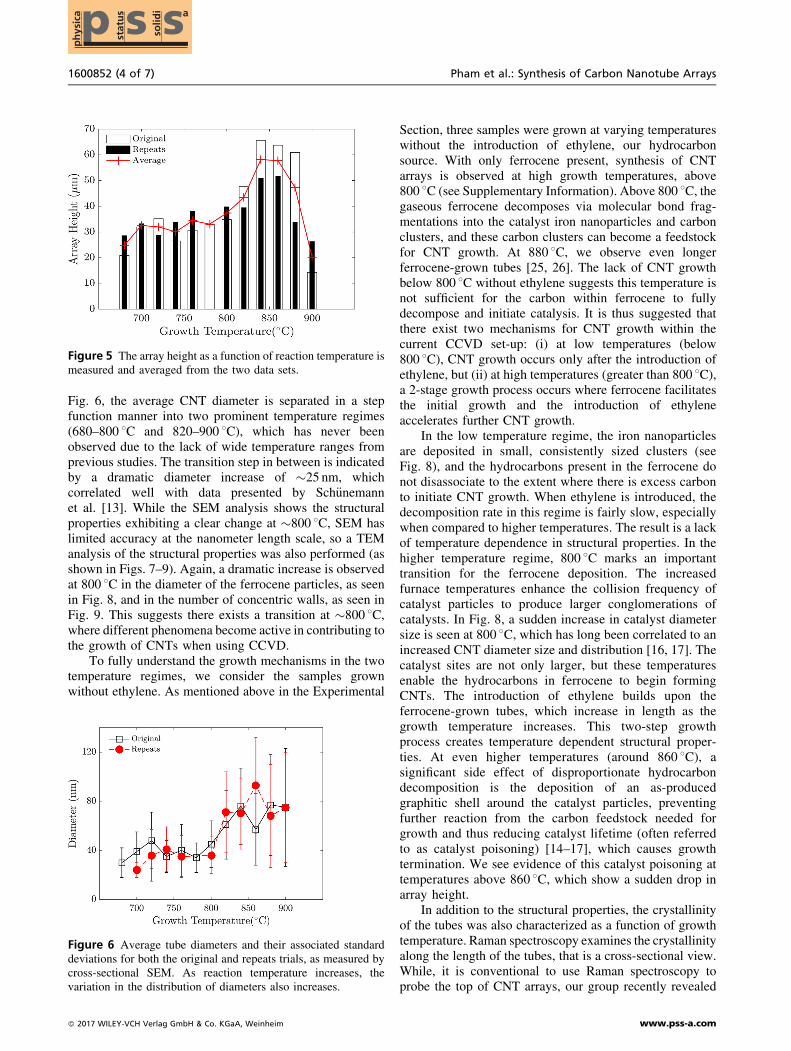
Fig. 6, the average CNT diameter is separated in a stepfunction manner into two prominent temperature regimes(680–800 8C and 820–900 8C), which has never beenobserved due to the lack of wide temperature ranges fromprevious studies. The transition step in between is indicatedby a dramatic diameter increase of �25 nm, whichcorrelated well with data presented by Sch€unemannet al. [13]. While the SEM analysis shows the structuralproperties exhibiting a clear change at �800 8C, SEM haslimited accuracy at the nanometer length scale, so a TEManalysis of the structural properties was also performed (asshown in Figs. 7–9). Again, a dramatic increase is observedat 800 8C in the diameter of the ferrocene particles, as seenin Fig. 8, and in the number of concentric walls, as seen inFig. 9. This suggests there exists a transition at �800 8C,where different phenomena become active in contributing tothe growth of CNTs when using CCVD.
To fully understand the growth mechanisms in the twotemperature regimes, we consider the samples grownwithout ethylene. As mentioned above in the Experimental
Section, three samples were grown at varying temperatureswithout the introduction of ethylene, our hydrocarbonsource. With only ferrocene present, synthesis of CNTarrays is observed at high growth temperatures, above800 8C (see Supplementary Information). Above 800 8C, thegaseous ferrocene decomposes via molecular bond frag-mentations into the catalyst iron nanoparticles and carbonclusters, and these carbon clusters can become a feedstockfor CNT growth. At 880 8C, we observe even longerferrocene-grown tubes [25, 26]. The lack of CNT growthbelow 800 8C without ethylene suggests this temperature isnot sufficient for the carbon within ferrocene to fullydecompose and initiate catalysis. It is thus suggested thatthere exist two mechanisms for CNT growth within thecurrent CCVD set-up: (i) at low temperatures (below800 8C), CNT growth occurs only after the introduction ofethylene, but (ii) at high temperatures (greater than 800 8C),a 2-stage growth process occurs where ferrocene facilitatesthe initial growth and the introduction of ethyleneaccelerates further CNT growth.
In the low temperature regime, the iron nanoparticlesare deposited in small, consistently sized clusters (seeFig. 8), and the hydrocarbons present in the ferrocene donot disassociate to the extent where there is excess carbonto initiate CNT growth. When ethylene is introduced, thedecomposition rate in this regime is fairly slow, especiallywhen compared to higher temperatures. The result is a lackof temperature dependence in structural properties. In thehigher temperature regime, 800 8C marks an importanttransition for the ferrocene deposition. The increasedfurnace temperatures enhance the collision frequency ofcatalyst particles to produce larger conglomerations ofcatalysts. In Fig. 8, a sudden increase in catalyst diametersize is seen at 800 8C, which has long been correlated to anincreased CNT diameter size and distribution [16, 17]. Thecatalyst sites are not only larger, but these temperaturesenable the hydrocarbons in ferrocene to begin formingCNTs. The introduction of ethylene builds upon theferrocene-grown tubes, which increase in length as thegrowth temperature increases. This two-step growthprocess creates temperature dependent structural proper-ties. At even higher temperatures (around 860 8C), asignificant side effect of disproportionate hydrocarbondecomposition is the deposition of an as-producedgraphitic shell around the catalyst particles, preventingfurther reaction from the carbon feedstock needed forgrowth and thus reducing catalyst lifetime (often referredto as catalyst poisoning) [14–17], which causes growthtermination. We see evidence of this catalyst poisoning attemperatures above 860 8C, which show a sudden drop inarray height.
In addition to the structural properties, the crystallinityof the tubes was also characterized as a function of growthtemperature. Raman spectroscopy examines the crystallinityalong the length of the tubes, that is a cross-sectional view.While, it is conventional to use Raman spectroscopy toprobe the top of CNT arrays, our group recently revealed
Figure 5 The array height as a function of reaction temperature ismeasured and averaged from the two data sets.
Figure 6 Average tube diameters and their associated standarddeviations for both the original and repeats trials, as measured bycross-sectional SEM. As reaction temperature increases, thevariation in the distribution of diameters also increases.
1600852 (4 of 7) Pham et al.: Synthesis of Carbon Nanotube Arrays
� 2017 WILEY-VCH Verlag GmbH & Co. KGaA, Weinheim www.pss-a.com
ph
ysic
a ssp stat
us
solid
i a

Figure 7 a) A representative TEM image at low magnification to view tubular structure as well as estimate tube diameter and catalystnanoparticle size. b–f) High magnification TEM images of CNTs synthesized at 700, 800, 820, 840, and 900 8C, respectively, are used todetermine tube inner diameters, number of concentric walls, and interlayer spacing. b) At 700 8C, amorphous carbon coating around theouter nanotube is more common and thicker in comparison to higher temperatures of c–f). The insets provide detailed view of thenanotube crystalline packing of graphite walls with the measured interlayering spacing displayed.
Figure 8 Encapsulated iron catalyst particle diameters measuredfrom HRTEM images are presented in the inset. While the innerdiameter (triangles) of the CNTs has minor changes withincreasing temperature, the catalyst particle size seems to stronglydetermine the outer diameter (circles) of the nanotubes.
Figure 9 Using HRTEM, the a-C layer thicknesses (circles) andnumber of concentric tube walls (squares) are determined.Prominent amorphous coating is present at 700 8C but significantlydecrease at higher temperatures due to efficient decomposition ofhydrocarbons for higher level of crystalline tube formations. Thisincreased in growth reaction can be observed by the increasingnumber of concentric graphite walls that encase the catalyticnanoparticles.
Phys. Status Solidi A (2017) (5 of 7) 1600852
www.pss-a.com � 2017 WILEY-VCH Verlag GmbH & Co. KGaA, Weinheim
Original
Paper
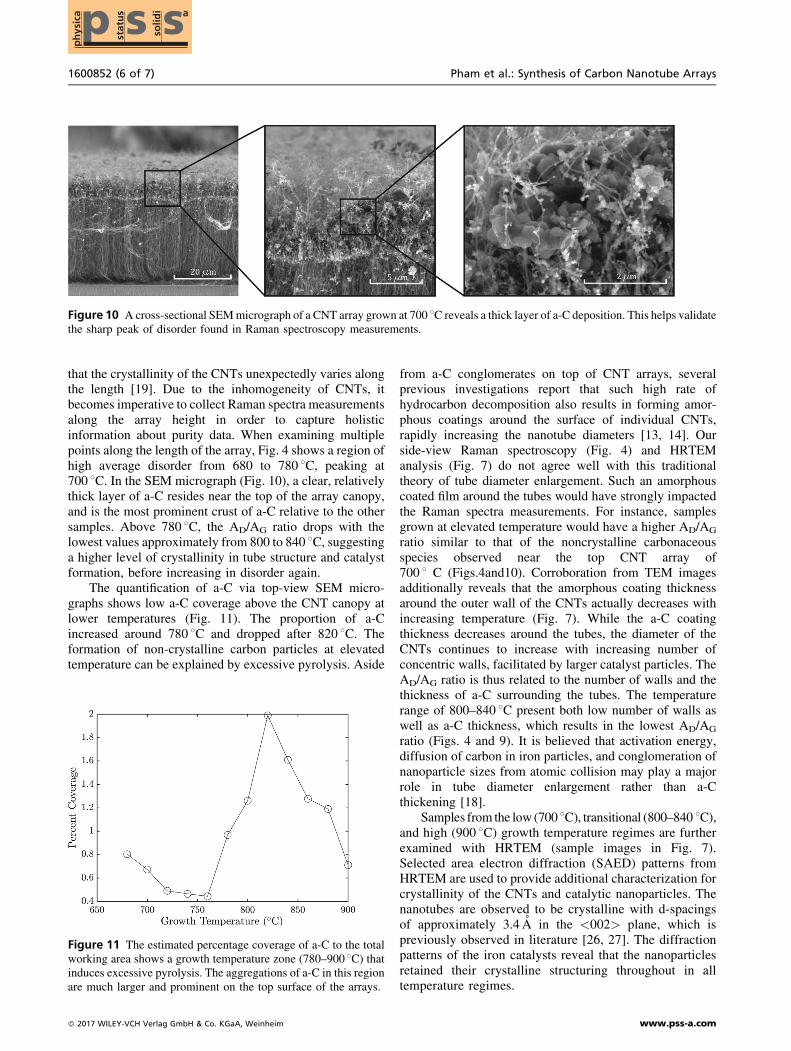
that the crystallinity of the CNTs unexpectedly varies alongthe length [19]. Due to the inhomogeneity of CNTs, itbecomes imperative to collect Raman spectra measurementsalong the array height in order to capture holisticinformation about purity data. When examining multiplepoints along the length of the array, Fig. 4 shows a region ofhigh average disorder from 680 to 780 8C, peaking at700 8C. In the SEM micrograph (Fig. 10), a clear, relativelythick layer of a-C resides near the top of the array canopy,and is the most prominent crust of a-C relative to the othersamples. Above 780 8C, the AD/AG ratio drops with thelowest values approximately from 800 to 840 8C, suggestinga higher level of crystallinity in tube structure and catalystformation, before increasing in disorder again.
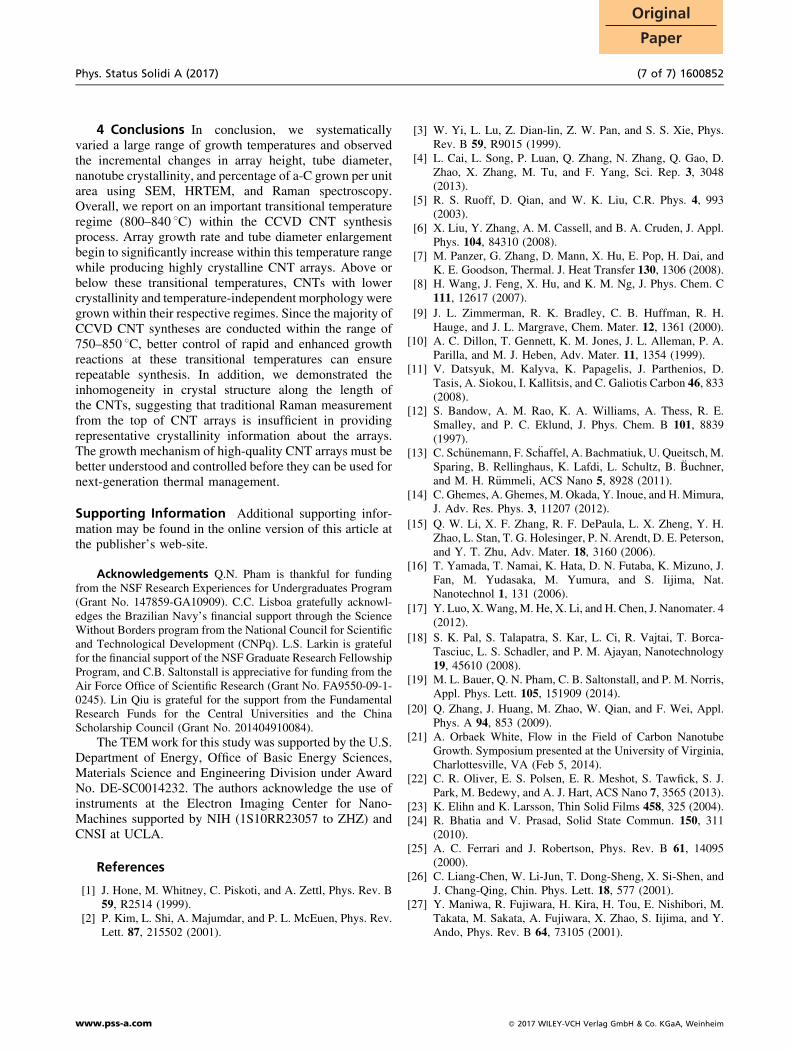
The quantification of a-C via top-view SEM micro-graphs shows low a-C coverage above the CNT canopy atlower temperatures (Fig. 11). The proportion of a-Cincreased around 780 8C and dropped after 820 8C. Theformation of non-crystalline carbon particles at elevatedtemperature can be explained by excessive pyrolysis. Aside
from a-C conglomerates on top of CNT arrays, severalprevious investigations report that such high rate ofhydrocarbon decomposition also results in forming amor-phous coatings around the surface of individual CNTs,rapidly increasing the nanotube diameters [13, 14]. Ourside-view Raman spectroscopy (Fig. 4) and HRTEManalysis (Fig. 7) do not agree well with this traditionaltheory of tube diameter enlargement. Such an amorphouscoated film around the tubes would have strongly impactedthe Raman spectra measurements. For instance, samplesgrown at elevated temperature would have a higher AD/AG
ratio similar to that of the noncrystalline carbonaceousspecies observed near the top CNT array of700 8 C (Figs.4and10). Corroboration from TEM imagesadditionally reveals that the amorphous coating thicknessaround the outer wall of the CNTs actually decreases withincreasing temperature (Fig. 7). While the a-C coatingthickness decreases around the tubes, the diameter of theCNTs continues to increase with increasing number ofconcentric walls, facilitated by larger catalyst particles. TheAD/AG ratio is thus related to the number of walls and thethickness of a-C surrounding the tubes. The temperaturerange of 800–840 8C present both low number of walls aswell as a-C thickness, which results in the lowest AD/AG
ratio (Figs. 4 and 9). It is believed that activation energy,diffusion of carbon in iron particles, and conglomeration ofnanoparticle sizes from atomic collision may play a majorrole in tube diameter enlargement rather than a-Cthickening [18].
Samples from the low (700 8C), transitional (800–840 8C),and high (900 8C) growth temperature regimes are furtherexamined with HRTEM (sample images in Fig. 7).Selected area electron diffraction (SAED) patterns fromHRTEM are used to provide additional characterization forcrystallinity of the CNTs and catalytic nanoparticles. Thenanotubes are observed to be crystalline with d-spacingsof approximately 3.4 A in the <002> plane, which ispreviously observed in literature [26, 27]. The diffractionpatterns of the iron catalysts reveal that the nanoparticlesretained their crystalline structuring throughout in alltemperature regimes.
Figure 10 A cross-sectional SEMmicrograph of a CNT array grown at 700 8C reveals a thick layer of a-C deposition. This helps validatethe sharp peak of disorder found in Raman spectroscopy measurements.
Figure 11 The estimated percentage coverage of a-C to the totalworking area shows a growth temperature zone (780–900 8C) thatinduces excessive pyrolysis. The aggregations of a-C in this regionare much larger and prominent on the top surface of the arrays.
1600852 (6 of 7) Pham et al.: Synthesis of Carbon Nanotube Arrays
� 2017 WILEY-VCH Verlag GmbH & Co. KGaA, Weinheim www.pss-a.com
ph
ysic
a ssp stat
us
solid
i a
4 Conclusions In conclusion, we systematicallyvaried a large range of growth temperatures and observedthe incremental changes in array height, tube diameter,nanotube crystallinity, and percentage of a-C grown per unitarea using SEM, HRTEM, and Raman spectroscopy.Overall, we report on an important transitional temperatureregime (800–840 8C) within the CCVD CNT synthesisprocess. Array growth rate and tube diameter enlargementbegin to significantly increase within this temperature rangewhile producing highly crystalline CNT arrays. Above orbelow these transitional temperatures, CNTs with lowercrystallinity and temperature-independent morphology weregrown within their respective regimes. Since the majority ofCCVD CNT syntheses are conducted within the range of750–850 8C, better control of rapid and enhanced growthreactions at these transitional temperatures can ensurerepeatable synthesis. In addition, we demonstrated theinhomogeneity in crystal structure along the length ofthe CNTs, suggesting that traditional Raman measurementfrom the top of CNT arrays is insufficient in providingrepresentative crystallinity information about the arrays.The growth mechanism of high-quality CNT arrays must bebetter understood and controlled before they can be used fornext-generation thermal management.
Supporting Information Additional supporting infor-mation may be found in the online version of this article atthe publisher’s web-site.
Acknowledgements Q.N. Pham is thankful for fundingfrom the NSF Research Experiences for Undergraduates Program(Grant No. 147859-GA10909). C.C. Lisboa gratefully acknowl-edges the Brazilian Navy’s financial support through the ScienceWithout Borders program from the National Council for Scientificand Technological Development (CNPq). L.S. Larkin is gratefulfor the financial support of the NSF Graduate Research FellowshipProgram, and C.B. Saltonstall is appreciative for funding from theAir Force Office of Scientific Research (Grant No. FA9550-09-1-0245). Lin Qiu is grateful for the support from the FundamentalResearch Funds for the Central Universities and the ChinaScholarship Council (Grant No. 201404910084).
The TEM work for this study was supported by the U.S.Department of Energy, Office of Basic Energy Sciences,Materials Science and Engineering Division under AwardNo. DE-SC0014232. The authors acknowledge the use ofinstruments at the Electron Imaging Center for Nano-Machines supported by NIH (1S10RR23057 to ZHZ) andCNSI at UCLA.
References
[1] J. Hone, M. Whitney, C. Piskoti, and A. Zettl, Phys. Rev. B59, R2514 (1999).
[2] P. Kim, L. Shi, A. Majumdar, and P. L. McEuen, Phys. Rev.Lett. 87, 215502 (2001).
[3] W. Yi, L. Lu, Z. Dian-lin, Z. W. Pan, and S. S. Xie, Phys.Rev. B 59, R9015 (1999).
[4] L. Cai, L. Song, P. Luan, Q. Zhang, N. Zhang, Q. Gao, D.Zhao, X. Zhang, M. Tu, and F. Yang, Sci. Rep. 3, 3048(2013).
[5] R. S. Ruoff, D. Qian, and W. K. Liu, C.R. Phys. 4, 993(2003).
[6] X. Liu, Y. Zhang, A. M. Cassell, and B. A. Cruden, J. Appl.Phys. 104, 84310 (2008).
[7] M. Panzer, G. Zhang, D. Mann, X. Hu, E. Pop, H. Dai, andK. E. Goodson, Thermal. J. Heat Transfer 130, 1306 (2008).
[8] H. Wang, J. Feng, X. Hu, and K. M. Ng, J. Phys. Chem. C111, 12617 (2007).
[9] J. L. Zimmerman, R. K. Bradley, C. B. Huffman, R. H.Hauge, and J. L. Margrave, Chem. Mater. 12, 1361 (2000).
[10] A. C. Dillon, T. Gennett, K. M. Jones, J. L. Alleman, P. A.Parilla, and M. J. Heben, Adv. Mater. 11, 1354 (1999).
[11] V. Datsyuk, M. Kalyva, K. Papagelis, J. Parthenios, D.Tasis, A. Siokou, I. Kallitsis, and C. Galiotis Carbon 46, 833(2008).
[12] S. Bandow, A. M. Rao, K. A. Williams, A. Thess, R. E.Smalley, and P. C. Eklund, J. Phys. Chem. B 101, 8839(1997).
[13] C. Sch€unemann, F. Schaffel, A. Bachmatiuk, U. Queitsch, M.Sparing, B. Rellinghaus, K. Lafdi, L. Schultz, B. Buchner,and M. H. R€ummeli, ACS Nano 5, 8928 (2011).
[14] C. Ghemes, A. Ghemes, M. Okada, Y. Inoue, and H.Mimura,J. Adv. Res. Phys. 3, 11207 (2012).
[15] Q. W. Li, X. F. Zhang, R. F. DePaula, L. X. Zheng, Y. H.Zhao, L. Stan, T. G. Holesinger, P. N. Arendt, D. E. Peterson,and Y. T. Zhu, Adv. Mater. 18, 3160 (2006).
[16] T. Yamada, T. Namai, K. Hata, D. N. Futaba, K. Mizuno, J.Fan, M. Yudasaka, M. Yumura, and S. Iijima, Nat.Nanotechnol 1, 131 (2006).
[17] Y. Luo, X.Wang, M. He, X. Li, and H. Chen, J. Nanomater. 4(2012).
[18] S. K. Pal, S. Talapatra, S. Kar, L. Ci, R. Vajtai, T. Borca-Tasciuc, L. S. Schadler, and P. M. Ajayan, Nanotechnology19, 45610 (2008).
[19] M. L. Bauer, Q. N. Pham, C. B. Saltonstall, and P. M. Norris,Appl. Phys. Lett. 105, 151909 (2014).
[20] Q. Zhang, J. Huang, M. Zhao, W. Qian, and F. Wei, Appl.Phys. A 94, 853 (2009).
[21] A. Orbaek White, Flow in the Field of Carbon NanotubeGrowth. Symposium presented at the University of Virginia,Charlottesville, VA (Feb 5, 2014).
[22] C. R. Oliver, E. S. Polsen, E. R. Meshot, S. Tawfick, S. J.Park, M. Bedewy, and A. J. Hart, ACS Nano 7, 3565 (2013).
[23] K. Elihn and K. Larsson, Thin Solid Films 458, 325 (2004).[24] R. Bhatia and V. Prasad, Solid State Commun. 150, 311
(2010).[25] A. C. Ferrari and J. Robertson, Phys. Rev. B 61, 14095
(2000).[26] C. Liang-Chen, W. Li-Jun, T. Dong-Sheng, X. Si-Shen, and
J. Chang-Qing, Chin. Phys. Lett. 18, 577 (2001).[27] Y. Maniwa, R. Fujiwara, H. Kira, H. Tou, E. Nishibori, M.
Takata, M. Sakata, A. Fujiwara, X. Zhao, S. Iijima, and Y.Ando, Phys. Rev. B 64, 73105 (2001).
Phys. Status Solidi A (2017) (7 of 7) 1600852
www.pss-a.com � 2017 WILEY-VCH Verlag GmbH & Co. KGaA, Weinheim
Original
Paper