Effect of Gold Nanorod Surface Chemistry on Cellular ... Effect of Gold Nanorod Surface Chemistry on...
29
AFRL-RH-WP-TR-2010-0140 Effect of Gold Nanorod Surface Chemistry on Cellular Interactions In Vitro Christin Grabinski Nicole Schaeublin Saber Hussain 711 HPW/RHPB 2729 R Street Wright-Patterson AFB OH 45433-5707 September 2010 Interim report for Sep 09 to Sep 10 Air Force Research Laboratory 711th Human Performance Wing Human Effectiveness Directorate Biosciences and Performance Division Applied Biotechnology Branch Wright-Patterson AFB OH 45433-5707 Approved for public release; Distribution unlimited
Transcript of Effect of Gold Nanorod Surface Chemistry on Cellular ... Effect of Gold Nanorod Surface Chemistry on...
AFRL-RH-WP-TR-2010-0140
Effect of Gold Nanorod Surface
Chemistry on Cellular Interactions
In Vitro
Christin Grabinski
Nicole Schaeublin
Saber Hussain
711 HPW/RHPB
2729 R Street
Wright-Patterson AFB OH 45433-5707
September 2010
Interim report for Sep 09 to Sep 10
Air Force Research Laboratory
711th Human Performance Wing
Human Effectiveness Directorate
Biosciences and Performance Division
Applied Biotechnology Branch
Wright-Patterson AFB OH 45433-5707
Approved for public release; Distribution unlimited
NOTICE
Using Government drawings, specifications, or other data included in this document for any purpose other than Government procurement does not in any way obligate the U.S. Government. The fact that the Government formulated or supplied the drawings, specifications, or other data does not license the holder or any other person or corporation; or convey any rights or permission to manufacture, use, or sell any patented invention that may relate to them.
This report was cleared for public release by the 88th Air Base Wing Public Affairs Office and is available to the general public, including foreign nationals. Copies may be obtained from the Defense Technical Information Center (DTIC) (http://www.dtic.mil).
AFRL-RH-WP-TR-2010-0140
THIS REPORT HAS BEEN REVIEWED AND IS APPROVED FOR PUBLICATION IN ACCORDANCE WITH ASSIGNED DISTRIBUTION STATEMENT.
//SIGNED// //SIGNED//___________
SABER HUSSAIN, Work Unit Manager MARK M. HOFFMAN, Deputy Chief Applied Biotechnology Branch Biosciences and Protection Division Human Effectiveness Directorate 711th Human Performance Wing Air Force Research Laboratory
This report is published in the interest of scientific and technical information exchange, and its publication does not constitute the Government’s approval or disapproval of its ideas or findings.
REPORT DOCUMENTATION PAGE Form Approved
OMB No. 0704-0188 Public reporting burden for this collection of information is estimated to average 1 hour per response, including the time for reviewing instructions, searching data sources, gathering and maintaining the data needed, and completing and reviewing the collection of information. Send comments regarding this burden estimate or any other aspect of this collection of information, including suggestions for reducing this burden to Washington Headquarters Service, Directorate for Information Operations and Reports, 1215 Jefferson Davis Highway, Suite 1204, Arlington, VA 22202-4302, and to the Office of Management and Budget, Paperwork Reduction Project (0704-0188) Washington, DC 20503. PLEASE DO NOT RETURN YOUR FORM TO THE ABOVE ADDRESS. 1. REPORT DATE (DD-MM-YYYY) 9-27-10
2. REPORT TYPE Interim
3. DATES COVERED (From - To) Sep 09 – Sep 10
4. TITLE AND SUBTITLE Effect of Gold Nanorod Surface Chemistry on Cellular Interactions In Vitro
5a. CONTRACT NUMBER
5b. GRANT NUMBER NA
5c. PROGRAM ELEMENT NUMBER
62202F 6. AUTHOR(S) Christin Grabinski, Nicole Schaeublin, Saber Hussain
5d. PROJECT NUMBER OAF
5e. TASK NUMBER WP
5f. WORK UNIT NUMBER OAFWP004
7. PERFORMING ORGANIZATION NAME(S) AND ADDRESS(ES) 711 HPW/RHPB, 2729 R Street, Wright-Patterson AFB OH 45433-5707
8. PERFORMING ORGANIZATION REPORT NUMBER
9. SPONSORING/MONITORING AGENCY NAME(S) AND ADDRESS(ES) Air Force Materiel Command Air Force Research Laboratory 711th Human Performance Wing Human Effectiveness Directorate Biosciences and Performance Division Applied Biotechnology Branch Wright Patterson AFB OH 45433-5707
10. SPONSOR/MONITOR'S ACRONYM(S) 711 HPW/RHPB
11. SPONSORING/MONITORING AGENCY REPORT NUMBER AFRL-WP-RH-2010-0140
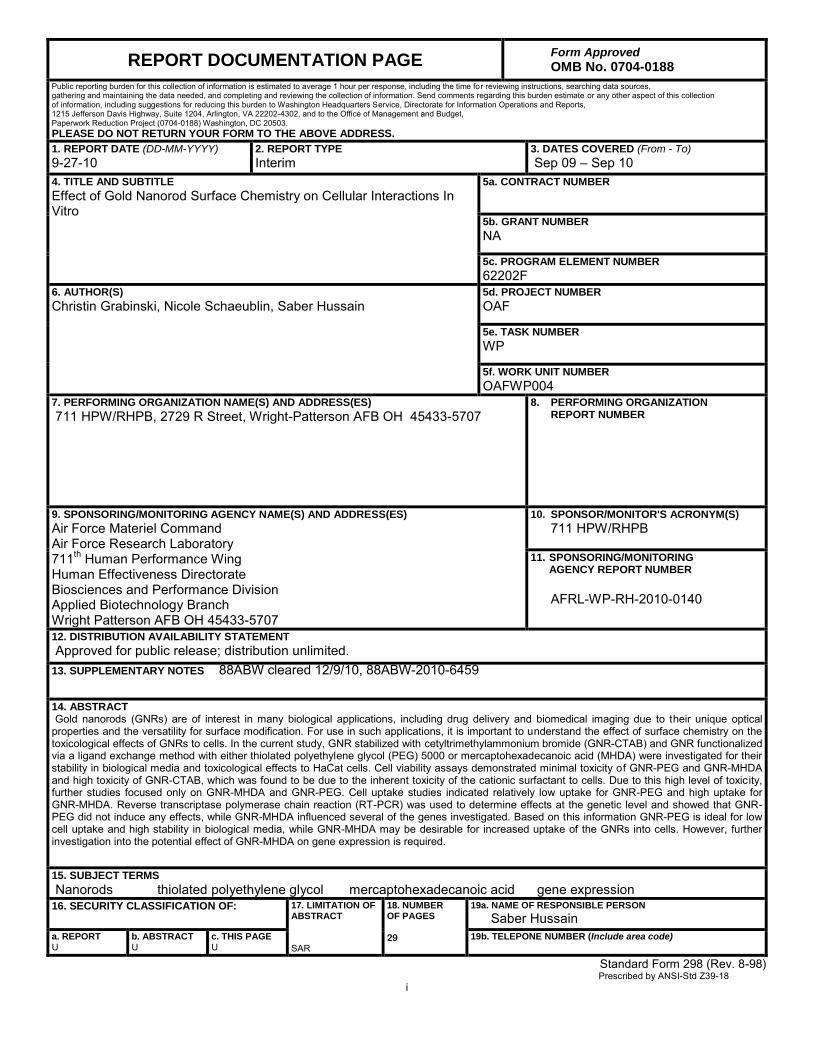
12. DISTRIBUTION AVAILABILITY STATEMENT Approved for public release; distribution unlimited. 13. SUPPLEMENTARY NOTES 88ABW cleared 12/9/10, 88ABW-2010-6459 14. ABSTRACT Gold nanorods (GNRs) are of interest in many biological applications, including drug delivery and biomedical imaging due to their unique optical properties and the versatility for surface modification. For use in such applications, it is important to understand the effect of surface chemistry on the toxicological effects of GNRs to cells. In the current study, GNR stabilized with cetyltrimethylammonium bromide (GNR-CTAB) and GNR functionalized via a ligand exchange method with either thiolated polyethylene glycol (PEG) 5000 or mercaptohexadecanoic acid (MHDA) were investigated for their stability in biological media and toxicological effects to HaCat cells. Cell viability assays demonstrated minimal toxicity of GNR-PEG and GNR-MHDA and high toxicity of GNR-CTAB, which was found to be due to the inherent toxicity of the cationic surfactant to cells. Due to this high level of toxicity, further studies focused only on GNR-MHDA and GNR-PEG. Cell uptake studies indicated relatively low uptake for GNR-PEG and high uptake for GNR-MHDA. Reverse transcriptase polymerase chain reaction (RT-PCR) was used to determine effects at the genetic level and showed that GNR-PEG did not induce any effects, while GNR-MHDA influenced several of the genes investigated. Based on this information GNR-PEG is ideal for low cell uptake and high stability in biological media, while GNR-MHDA may be desirable for increased uptake of the GNRs into cells. However, further investigation into the potential effect of GNR-MHDA on gene expression is required.
15. SUBJECT TERMS Nanorods thiolated polyethylene glycol mercaptohexadecanoic acid gene expression 16. SECURITY CLASSIFICATION OF:
17. LIMITATION OF ABSTRACT SAR
18. NUMBER OF PAGES
29
19a. NAME OF RESPONSIBLE PERSON
Saber Hussain a. REPORT U
b. ABSTRACT U
c. THIS PAGE U
19b. TELEPONE NUMBER (Include area code)
Standard Form 298 (Rev. 8-98) Prescribed by ANSI-Std Z39-18
i

THIS PAGE INTENTIONALLY LEFT BLANK.
ii
iii
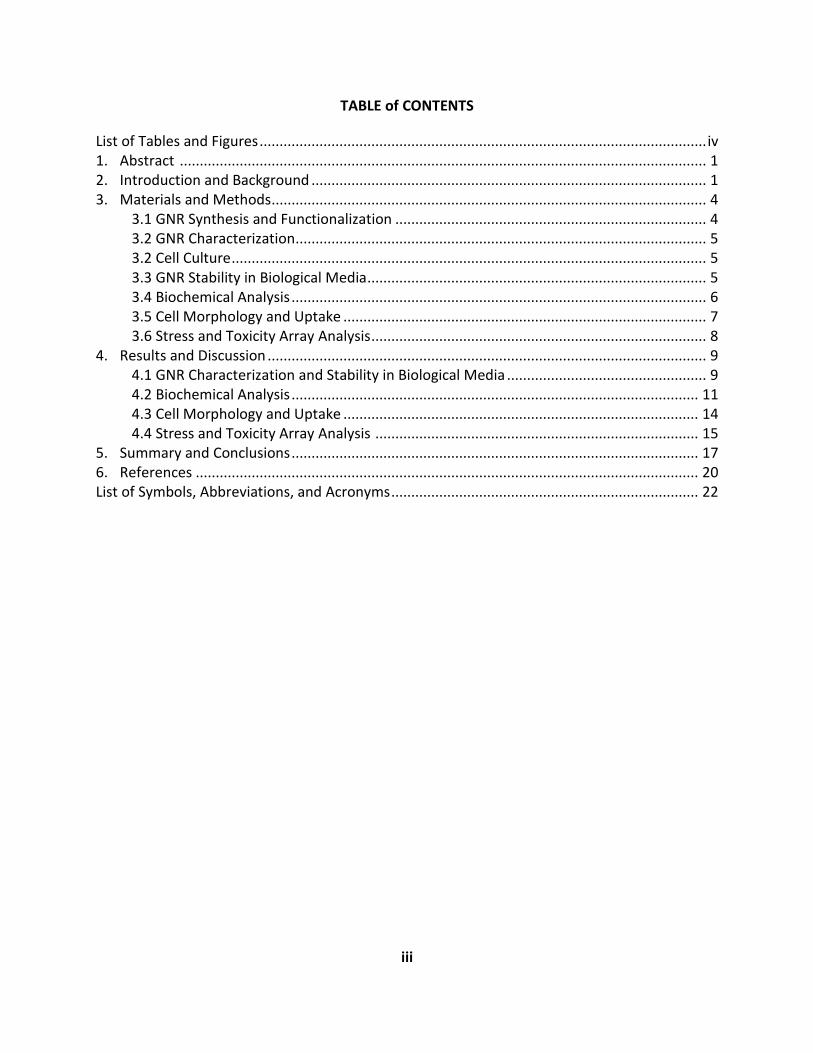
TABLE of CONTENTS
List of Tables and Figures ................................................................................................................ iv 1. Abstract .................................................................................................................................... 1 2. Introduction and Background ................................................................................................... 1 3. Materials and Methods ............................................................................................................. 4
3.1 GNR Synthesis and Functionalization .............................................................................. 4 3.2 GNR Characterization ....................................................................................................... 5 3.2 Cell Culture ....................................................................................................................... 5 3.3 GNR Stability in Biological Media ..................................................................................... 5 3.4 Biochemical Analysis ........................................................................................................ 6 3.5 Cell Morphology and Uptake ........................................................................................... 7 3.6 Stress and Toxicity Array Analysis .................................................................................... 8
4. Results and Discussion .............................................................................................................. 9 4.1 GNR Characterization and Stability in Biological Media .................................................. 9 4.2 Biochemical Analysis ...................................................................................................... 11 4.3 Cell Morphology and Uptake ......................................................................................... 14 4.4 Stress and Toxicity Array Analysis ................................................................................. 15
5. Summary and Conclusions ...................................................................................................... 17 6. References .............................................................................................................................. 20 List of Symbols, Abbreviations, and Acronyms ............................................................................. 22
iv
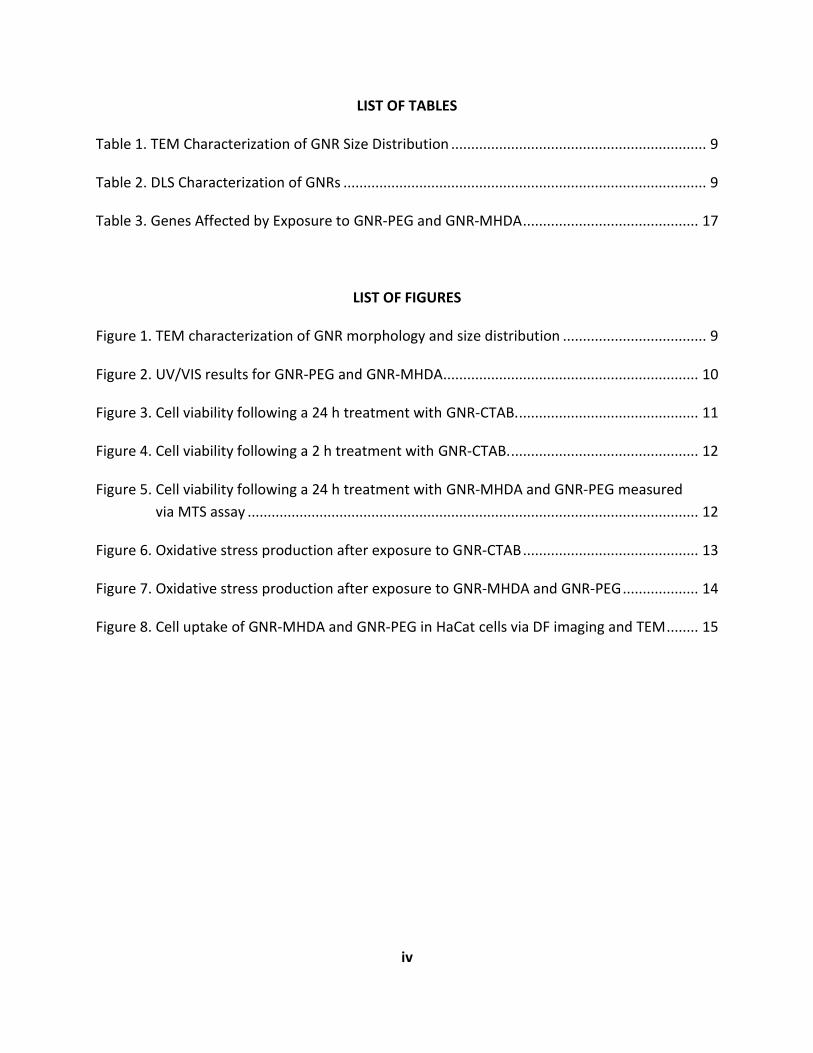
LIST OF TABLES
Table 1. TEM Characterization of GNR Size Distribution ................................................................ 9
Table 2. DLS Characterization of GNRs ........................................................................................... 9
Table 3. Genes Affected by Exposure to GNR-PEG and GNR-MHDA ............................................ 17
LIST OF FIGURES
Figure 1. TEM characterization of GNR morphology and size distribution .................................... 9
Figure 2. UV/VIS results for GNR-PEG and GNR-MHDA ................................................................ 10
Figure 3. Cell viability following a 24 h treatment with GNR-CTAB. ............................................. 11 5
Figure 4. Cell viability following a 2 h treatment with GNR-CTAB. ............................................... 12
Figure 5. Cell viability following a 24 h treatment with GNR-MHDA and GNR-PEG measured
via MTS assay ................................................................................................................. 12
Figure 6. Oxidative stress production after exposure to GNR-CTAB ............................................ 13
Figure 7. Oxidative stress production after exposure to GNR-MHDA and GNR-PEG ................... 14
Figure 8. Cell uptake of GNR-MHDA and GNR-PEG in HaCat cells via DF imaging and TEM ........ 15
1 Distribution A: Approved for public release
1. ABSTRACT
Gold nanorods (GNRs) are of interest in many biological applications, including drug delivery
and biomedical imaging due to their unique optical properties and the versatility for surface
modification. For use in such applications, it is important to understand the effect of surface
chemistry on the toxicological effects of GNRs to cells. In the current study, GNR stabilized with
cetyltrimethylammonium bromide (CTAB) and GNR functionalized via a ligand exchange
method with either thiolated polyethylene glycol (PEG) 5000 or mercaptohexadecanoic acid
(MHDA) were investigated for their stability in biological media and toxicological effects to
HaCat cells. GNR-PEG and GNR-MHDA exhibited minimal effects on cell viability, whereas GNR-
CTAB reduced cell viability significantly due to the inherent toxicity of the cationic surfactant to
cells. As a result of this high level of toxicity, further studies focused only on GNR-MHDA and
GNR-PEG. Cell uptake studies indicated relatively low uptake for GNR-PEG and high uptake for
GNR-MHDA. Reverse transcriptase polymerase chain reaction (RT-PCR) revealed that GNR-PEG
did not induce any significant changes in the transcription levels of 84 genes related to stress
and toxicity, while GNR-MHDA influenced the transcription levels of several of the genes
investigated. Based on this information, GNR-PEG is ideal for low cell uptake and high stability
in biological media, while GNR-MHDA may be desirable for increased uptake of the GNRs into
cells. However, further investigation into the potential effect of GNR-MHDA on gene expression
is required.
2. INTRODUCTION AND BACKGROUND
Gold nanorods (GNRs) are of interest in many biological applications, including photothermal
therapy for gene/drug delivery (Huang et al., 2006; Wijaya et al., 2007), disease targeting (Chen
et al., 2006), and medical/biological imaging (Agarwal et al., 2007). By changing the aspect ratio
(AR) of GNRs, the plasmon peak absorption and scattering wavelength can be tuned to near
infrared (NIR: 700–900 nm). This allows for photothermal applications via laser irradiation at
the wavelength for longitudinal absorption and increased penetration depth into biological
2 Distribution A: Approved for public release
tissue for biological imaging and contrast enhancement. Additionally, the surface of GNRs can
be modified via thiol chemistry, which allows for specific biological targeting applications.
While GNRs have been demonstrated for use in many applications, it is important to
understand the structure/activity effects of different physical and chemical properties of GNRs
on cells. Previous studies on the cytotoxicity of various nanoparticles indicated that surface
chemistry has a strong influence on cell toxicity and uptake (Hussain et al., 2009; Carlson et al.,
2008; Niidome et al., 2006; Huff et al., 2007; Chithrani et al., 2006; Alkilany et al., 2009; Hauck
et al., 2008; Mahonar et al., 2010). The surfactant cetyltrimethylammonium bromide (CTAB) is
inherently present as a byproduct of GNR synthesis and has been shown to exhibit significant
cytotoxicity (Alkilany et al., 09, Manohar et al., 09; Parab et al., 09; Leonov et al., 08).
Several surface coatings and chemically bonded functional groups have been proposed in order
to reduce the apparent toxic effect of the surfactants such as CTAB. GNRs coated with
polyacrylic acid (PAA), polyelectrolyte poly(allylamine) hydrochloride (PAH), and poly(4-styrene
sulfonic acid) (PSS) and were found to be less toxic than GNR-CTAB (Alkilany et al., 2009;Hauck
et al. 2008; Wang et al., 2008). When PSS-coated GNRs were further coated by
poly(diallyldimethyl ammonium chloride) (PDADMAC), this particle was found to exhibit less
cytotoxicity than GNR-CTAB. However, it was found that when GNRs were exposed to serum
proteins before cells, GNR-CTAB become less toxic and those with a surface composition of
PDADMAC become more toxic. Thus, the initial surface composition of GNRs may determine
which proteins are adsorbed onto the surface, thereby effecting toxicity (Hauck et al. 2008).
This effect has also been demonstrated in the case of cell uptake (Alkilany et al., 2009). In a
study using HT-29 cells, it was found that after coating positively charged CTAB with negatively
charged polymer PAA, followed by a positively charged polymer PAH, cell uptake was
dramatically improved for PAH as the outermost coat versus PAA as determined by inductively
coupled plasma – mass spectrometry (ICP-MS). However, all GNR samples exhibited very
similar surface charge (zeta potential = -20 mV) when dispersed in cell culture media (before
cellular exposure), suggesting that proteins adsorbed onto GNR surface. This also indicates a
3 Distribution A: Approved for public release
complex relationship between surface charge of the GNR before and after protein adsorption
and how cell uptake is affected (Alkilany et al., 2009).
In a similar study, HeLa cells were exposed to GNRs coated with CTAB, CTAB-PSS, CTAB-PSS-
PDADMAC, CTAB-PSS-PDADMAC-PSS after exposure to serum proteins. CTAB-PSS (zeta
potential = -69.5 mV) exhibited the lowest cell uptake and CTAB-PSS-PDADMAC (zeta potential
= +37.1 mV) had highest cell uptake as determined by ICP- atomic emission spectroscopy (AES).
GNRs coated with CTAB-PSS-PDADMAC-PSS (zeta potential = -35.1 mV) had intermediate
cellular uptake. The results from this study demonstrate the crucial relationship between zeta
potential and cell uptake (Hauck et al., 2008).
Studies have found that GNRs functionalized with polyethylene glycol (PEG) are more inert than
other coatings (Niidome et al., 2006; Mahonar et al., 2010; Rayavarapu et al., 2010). In a study
using the SKBR 3 (mammary adenocarcinoma) cell-line, thiolated PEG functionalized GNRs were
found to be significantly less toxic (via MTS assay) than GNRs before and after filtering to
remove excess CTAB in solution (Manohar et al., 2010). This same effect was found in a
different study using HeLa cells and the MTT assay (Niidome et al., 2006).
Thiolated PEG functionalized GNRs were also found to be more biocompatible than PSS-coated
GNRs in SKBR3 (mammary adenocarcinoma), CHO (Chinese Hamster Ovary), C2C12 (mouse
myoblast), and HL60 (Human Leukemia) cell-lines using MTS assay (Rayavarapu et al., 2010).
These studies show complete cell death for GNR-CTAB before and after filtration for all cell-
lines. GNR-PSS also exhibited increased cytotoxicity compared to GNR-PEG, which was
suggested to be a result of remaining CTAB on the surface, since PSS does not actually replace
CTAB like PEG.
In addition to increased biocompatibility, PEGylated GNRs have shown significantly reduced cell
uptake as compared with GNRs modified with other surface chemistries (Huff et al., 2007;
Rayavarapu et al., 2010). A study using KB cells (tumor line derived from oral epithelium) found
that GNRs coated with CTAB had 20 times the amount of cell uptake than those coated with
PEG-DTC (dithiocarbamate) without incubation with serum proteins (Huff et al., 2006). A
4 Distribution A: Approved for public release
similar effect was found in a study using SKBR3 (mammary adenocarcinoma) cells, which
qualitatively found no cell uptake of GNR-PEG compared to GNRs coated with PSS (Rayavarapu
et al., 2010).
When investigated in vivo, it was found that following injection of GNR-PEG (zeta potential = -
0.5 ± 0.4 mV) and GNR-CTAB (zeta potential = +41 ± 1 mV) into mice, amounts of gold in blood,
liver, lung, spleen, and kidney were quantified at different time points using ICP-MS. PEG
functionalized GNRs took longer to leave the blood and accumulate in the kidney than those
stabilized in CTAB (72 h and 0.5 h, respectively) (Niidome et al., 2006). This indicates that GNR-
PEG not only exhibits reduced uptake into cells, but also takes longer for the body to recognize
as a foreign material.
For the current study, three GNR samples were prepared by Dr. Hamad-Schifferli and
colleagues at the Massachusetts Institute of Technology in order to further investigate the
effect of surface chemistry on GNR interaction with cells. One sample is stabilized with CTAB
and two are functionalized via a ligand exchange method with either thiolated PEG 5000 or
mercaptohexadecanoic acid (MHDA) as previously described (Wijaya and Hamad-Schifferli,
2008). The goal of this study is to evaluate the relative toxic effect of GNRs to HaCat cells in
vitro as a function of surface chemistry. HaCat cells were chosen as a representative model for
dermal toxicity. Endpoints include stability in biological media via dynamic light scattering (DLS),
UV/VIS, and darkfield (DF) microscopy. Cell viability and function were assayed via
mitochondrial activity (MTS), membrane leakage (LDH), and oxidative stress (ROS) assays. Cell
morphology and uptake were investigated using DF & fluorescence microscopy, as well as
transmission electron microscopy (TEM). Reverse transcriptase polymerase chain reaction (RT-
PCR) was used to investigate the effects of gene expression for GNR-MHDA and GNR-PEG.
3. MATERIALS AND METHODS
3.1 GNR Synthesis and Functionalization
5 Distribution A: Approved for public release
GNRs were synthesized by Kimberly Hamad-Schifferli’s group using the seed-mediated growth
method (Sau and Murphy, 2004). The CTAB surfactant on the GNR surface was replaced with
PEG or MHDA by round-trip phase transfer ligand exchange as described in detail in Wijaya et
al., 2008.
3.2 GNR Characterization
To visualize the structure and size of the GNRs, a drop of the stock for each sample was placed
on a TEM grid and viewed using a Hitachi H-7600 microscope at 100kV. The length and width
were averaged for 100 particles measured using ImageJ software (NIH).
The concentration of stock solutions was determined using UV/VIS. The molar concentration of
the GNR samples was calculated based on the Beer-Lambert Law using an extinction coefficient
of 4.6 X10⁹ M-1 cm-1 at 800 nm. This result was multiplied by the dilution factor to yield the final
molar concentration. To convert molar concentration to mass concentration, it was assumed
that the GNRs exhibit a cylindrical shape with dimensions of 11 nm in diameter and 44 nm in
length, and demonstrate a density of 19.30 g/cm3.
3.3 Cell Culture
The human keratinocyte cell line (HaCaT) was generously donated by the Army Research Lab.
The cells were cultured in a flask with RPMI-1640 media (ATCC) supplemented with 10% fetal
bovine serum (FBS, ATCC) and 1% penicillin/streptomycin (pen/strep, Sigma). For nanoparticle
exposure, media was supplemented with 1% penicillin/streptomycin but no serum and was
labeled as the exposure media (EM). Cells were incubated at 37˚C in a humidified incubator
with 5% CO2.
3.4 Stability of GNRs in Biological Media
The relative stability of each GNR sample was determined after dispersion in water or EM using
UV/VIS, DLS, and DF microscopy. For these studies, GNRs were suspended at a concentration of
100 µg/mL in water or EM and vortexed 30 seconds upon dilution and again immediately
6 Distribution A: Approved for public release
before analysis. Samples were analyzed within 1 h of dilution. UV/VIS measurements were
performed using a Varian Cary Bio 300 UV/VIS Spectrophotometer. A Malvern Zetasizer was
used for DLS measurements of hydrodynamic diameter and also for zeta potential analysis of
GNRs dispersed in water. For DF imaging, a small volume of this sample was spotted on a
microscope slide and allowed to dry in air. Imaging was performed using a DF condenser from
CytoViva attached to an Olympus BX41 microscope and DAGE camera/software.
3.5 Biochemical Analysis
For biochemical assays, cells were seeded in a 96 well plate at a concentration of 1.5 x 10⁵
cells/cm2 and allowed to proliferate and adhere for 24 h. Cells were dosed with varying
concentrations of GNRs (5, 50, and 100 µg/mL) in media without serum (EM). The addition of
EM to cells served as negative controls. Biochemical assays were initiated after a 24 h exposure
and included the MTS, LDH, and ROS assays.
The MTS assay was performed using the CellTiter 96 Aqueous One Solution Cell Proliferation
Assay (Promega). The solution reagent contains a tetrazolium compound [3-(4, 5-
dimethylthiazol-2-yl)-5-(3-carboxymethoxyphenyl)-2-(4-sulfophenyl)-2H-tetrazolium, inner salt;
MTS] and an electron coupling reagent (phenazine ethosulfate; PES). Metabolically active cells
reduce the MTS compound into a colored formazan product that is soluble in tissue culture
medium and can be measured using a standard microplate reader. After 24 h, the supernatant
containing GNRs was aspirated from the wells and the cells were washed 3X with 1X PBS to
remove residual GNRs. Mitochondrial function was then assessed according to the
manufacturer’s instructions.
Lactase dehydrogenase leakage (LDH) was evaluated to determine the integrity of the cell
membrane using the used the CytoTox 96 Non-Radioactive Cytotoxicity Assay (Promega,
Madison, WI). This is a colorimetric assay that quantitatively measures LDH, a stable cytosolic
enzyme that is released upon cell lysis. Released LDH in culture supernatants is measured with
a 30-min coupled enzymatic assay that results in the conversion of a tetrazolium salt into a red
formazan product. For both the MTS and LDH assay, the formazan product was measured by
7 Distribution A: Approved for public release
the amount of absorbance at 490 nm with a standard microplate reader (SpectraMAX
GeminiXS, Molecular Devices, Sunnyvale, CA). The absorbance is directly proportional to the
number of metabolically active cells and the number of lysed cells in the MTS and LDH assays,
respectively. The spectrophotometer was calibrated to zero absorbance using EM without cells
and a background reading was taken immediately after the addition of reagent to eliminate
interference due to slight absorbance of GNRs near 490 nm.
In order to further investigate oxidative stress as a mechanism of cytotoxicity, the reactive
oxygen species (ROS) assay was performed using the BD Pathway Confocal Microscope, which
collects images and corresponding fluorescence intensity data. The generation of ROS was
probed with the Image IT Live Green ROS detection kit (Molecular Probe, Invitrogen, Carlsbad,
CA). This assay is based on a fluorescent marker for ROS in live cells (5-carboxy-22,72-
dichlorodihydrofluoresceine diacetate; carboxy-H2DCFDA). The oxidation product of carboxy-
H2DCFDA has excitation/emission maxima of approximately 495/529 nm. As a positive control,
0.03 % of hydrogen peroxide was added for 1 h to induce cellular apoptosis. After incubation,
the cells were washed with warm PBS, then the monolayers were covered with the working
solutions (Carboxy DCFA for ROS staining: 25 M; Hoechst solution for nuclear staining: 1 M).
The cells were incubated at 37°C for 30 minutes, protected from light to avoid bleaching of the
fluorophores. After rinsing with PBS, the cells were observed with DAPI and Fluorescein/FITC
filters and fluorescence intensity for each was averaged for the pixels in each image. The results
were presented in the form of fold change in fluorescence intensity of FITC/DAPI from control.
For each biochemical assay, three trials were performed for each sample with a value of n=3
per trial for a total of 9 data points for each sample. Statistical significance from control was
determined for biochemical data using a two tailed t-test in Excel with p<0.05.
3.6 Cell Morphology and Uptake
The interaction of GNR-MHDA and GNR-PEG cells was determined using DF imaging and
transmission electron microscopy (TEM). For DF imaging, cells were plated in 2-chambered
slides (surface area = 4 cm2) at a concentration of 1.0 x 10⁵ cells/cm2 and allowed to proliferate
8 Distribution A: Approved for public release
and adhere for 24-48 h or until ~80% confluent. For DF imaging experiments with GNR-MHDA
and GNR-PEG, cells were dosed with GNRs diluted in EM at a concentration of 10 µg/mL and
exposed for 24 h. Following exposure, cells were washed with PBS and fixed in 4%
paraformaldehyde for 10 minutes. The cells were washed again with PBS, a coverslip was added
and sealed with clear nail polish, and the slide was imaged using the CytoViva Hyperspectral
Imaging System attached to an Olympus BX41 microscope (Aetos Technologies, Inc., Auburn,
AL). Data was collected using ENVI software.
For TEM imaging, cells were seeded at a concentration of 1.0 x 10⁵ cells/cm2 in 6-well plates
(surface area = 9.6 cm2) and allowed to adhere and proliferate for 48 h. Cells were dosed with
GNRs diluted in EM at a concentration of 50 µg/mL and exposed for 24 h. At the completion of
the exposure period, cells were washed with PBS, trypsinized from the plate, and centrifuged at
1000xg for 10 minutes. The pellet was fixed in 2% paraformaldehyde overnight at 4°C. The
following day, the cell pellets were washed with PBS, stained with 4% osmium tetroxide, and
dehydrated with ethanol in a standard dilution sequence. The final pellet was cured in a
vacuum oven using LR White resin (EMS) at 60°C. The cured sample was sectioned using a Leica
EM UC6 Ultramicrotome and imaged using a Hitachi H-7600 TEM by Karl Strieker at the
University of Dayton.
3.7 Gene Expression Analysis
Reverse Transcription Polymerase Chain Reaction (RT-PCR) was used to determine the effect of
GNR-MHDA and GNR-PEG exposure on HaCat cells at non-toxic doses (50 µg/mL). Cells were
seeded and exposed to GNRs as described for TEM imaging. After 24 h exposure, RNA was
isolated from the cells using a RNA Isolation Kit from Qiagen. The RNA yield was determined
using the NanoDrop Spectrophotometer (ThermoScientific). Once RNA was successfully isolated
from the cells, c-DNA was prepared using the RT2 First Strand kit (SABiosciences) according to
manufacturer’s instructions. The Stress and Toxicity Array (SABiosciences) was used to evaluate
the expression of 84 genes related to stress and toxicity production in human cells. Expression
of genes that are directly regulated by oxidative or metabolic stress and heat shock, as well as
9 Distribution A: Approved for public release
genes which are representative of pathways activated by prolonged stress, such as apoptosis
and senescence are among those evaluated in this array. Three trials were performed for each
sample (control, GNR-MHDA, and GNR-PEG).
4. RESULTS AND DISCUSSION
4.1 Characterization of GNRs and Stability in Biological Media
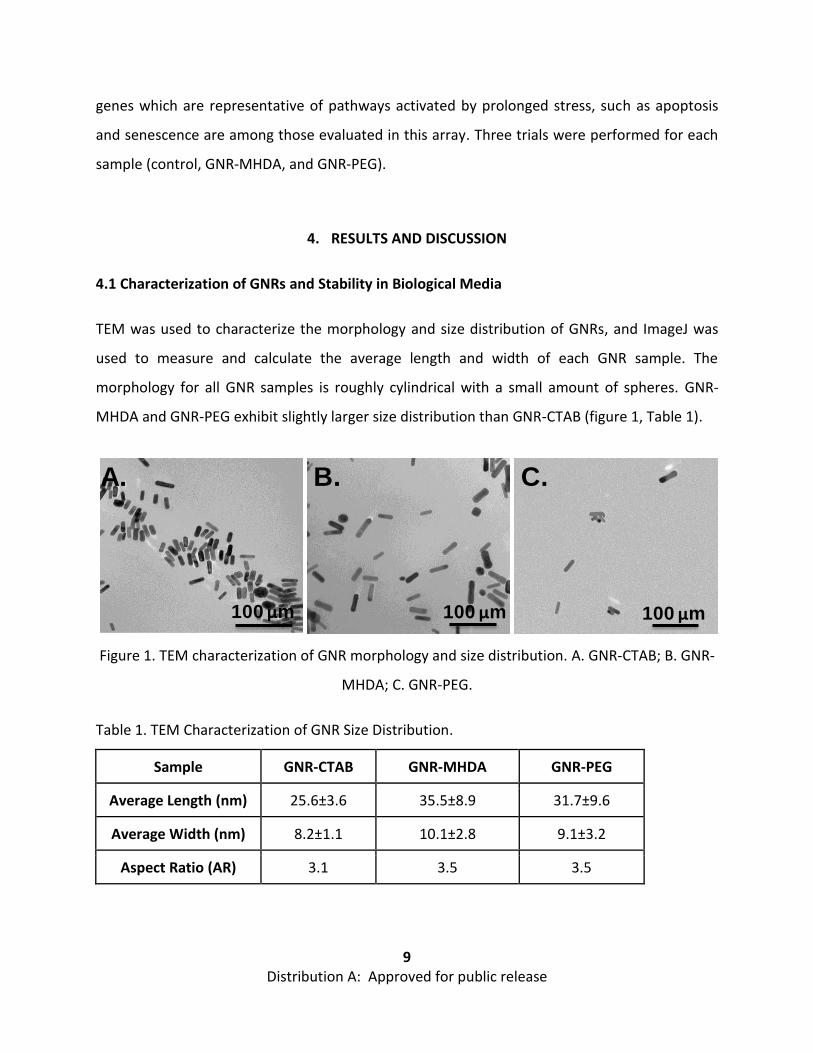
TEM was used to characterize the morphology and size distribution of GNRs, and ImageJ was
used to measure and calculate the average length and width of each GNR sample. The
morphology for all GNR samples is roughly cylindrical with a small amount of spheres. GNR-
MHDA and GNR-PEG exhibit slightly larger size distribution than GNR-CTAB (figure 1, Table 1).
Figure 1. TEM characterization of GNR morphology and size distribution. A. GNR-CTAB; B. GNR-
MHDA; C. GNR-PEG.
Table 1. TEM Characterization of GNR Size Distribution.
Sample GNR-CTAB GNR-MHDA GNR-PEG
Average Length (nm) 25.6±3.6 35.5±8.9 31.7±9.6
Average Width (nm) 8.2±1.1 10.1±2.8 9.1±3.2
Aspect Ratio (AR) 3.1 3.5 3.5
100 µm100 µm 100 µm
A. B. C.
10 Distribution A: Approved for public release
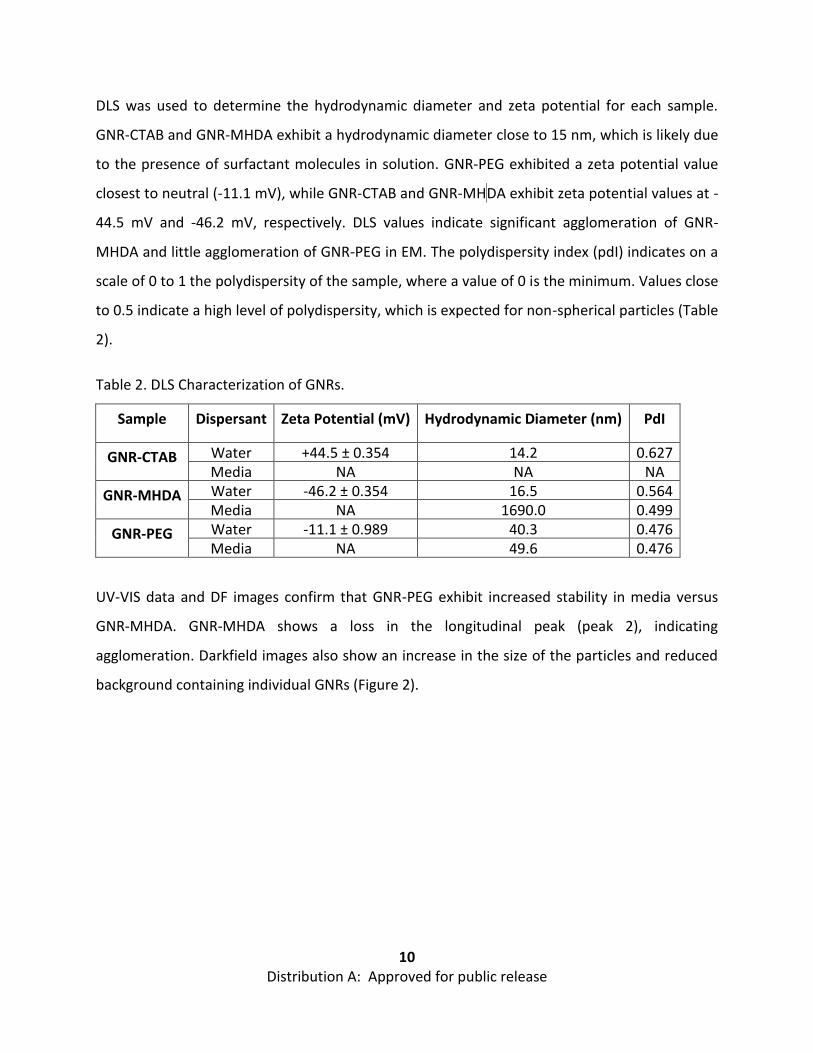
DLS was used to determine the hydrodynamic diameter and zeta potential for each sample.
GNR-CTAB and GNR-MHDA exhibit a hydrodynamic diameter close to 15 nm, which is likely due
to the presence of surfactant molecules in solution. GNR-PEG exhibited a zeta potential value
closest to neutral (-11.1 mV), while GNR-CTAB and GNR-MH DA exhibit zeta potential values at -
44.5 mV and -46.2 mV, respectively. DLS values indicate significant agglomeration of GNR-
MHDA and little agglomeration of GNR-PEG in EM. The polydispersity index (pdI) indicates on a
scale of 0 to 1 the polydispersity of the sample, where a value of 0 is the minimum. Values close
to 0.5 indicate a high level of polydispersity, which is expected for non-spherical particles (Table
2).
Table 2. DLS Characterization of GNRs.
Sample Dispersant Zeta Potential (mV) Hydrodynamic Diameter (nm) PdI
GNR-CTAB Water +44.5 ± 0.354 14.2 0.627 Media NA NA NA
GNR-MHDA Water -46.2 ± 0.354 16.5 0.564 Media NA 1690.0 0.499
GNR-PEG Water -11.1 ± 0.989 40.3 0.476 Media NA 49.6 0.476
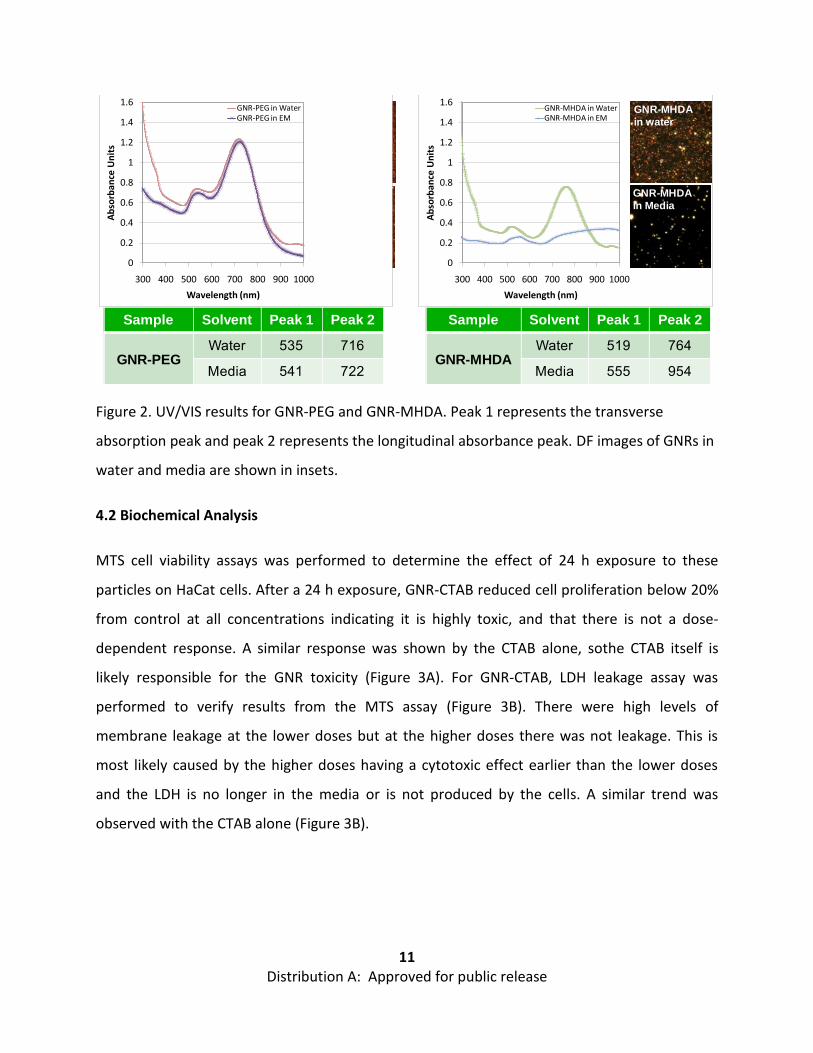
UV-VIS data and DF images confirm that GNR-PEG exhibit increased stability in media versus
GNR-MHDA. GNR-MHDA shows a loss in the longitudinal peak (peak 2), indicating
agglomeration. Darkfield images also show an increase in the size of the particles and reduced
background containing individual GNRs (Figure 2).
11 Distribution A: Approved for public release
Figure 2. UV/VIS results for GNR-PEG and GNR-MHDA. Peak 1 represents the transverse
absorption peak and peak 2 represents the longitudinal absorbance peak. DF images of GNRs in
water and media are shown in insets.
4.2 Biochemical Analysis
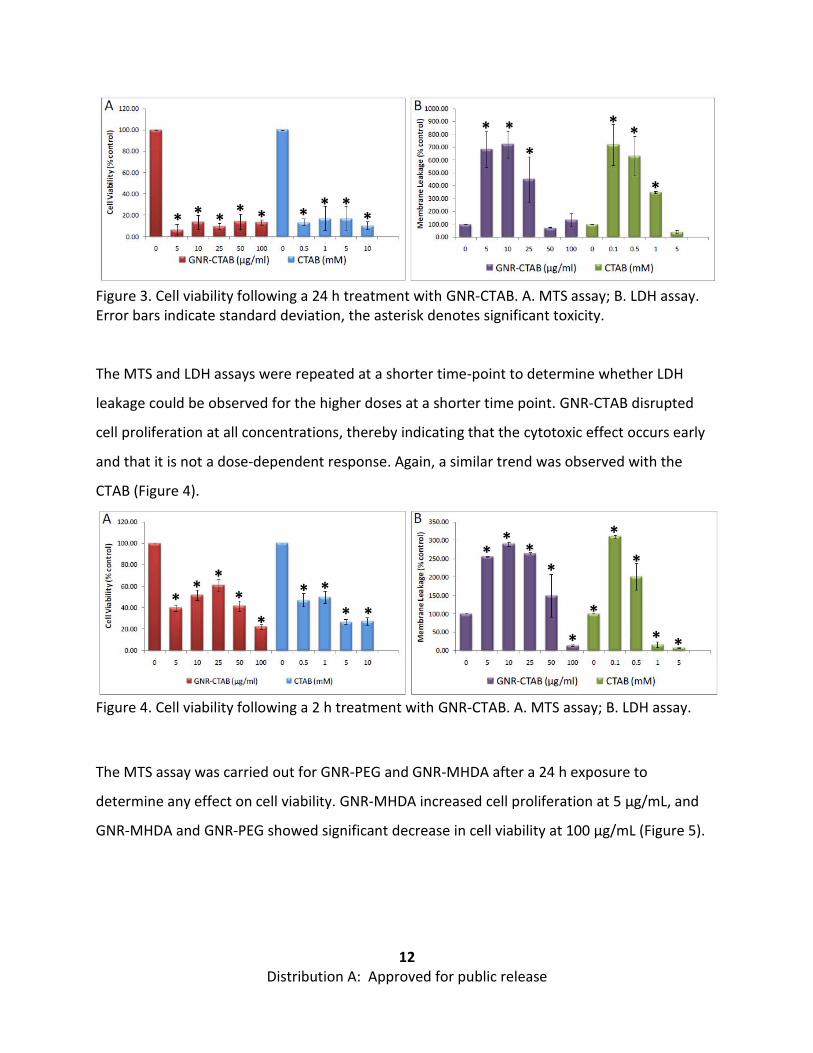
MTS cell viability assays was performed to determine the effect of 24 h exposure to these
particles on HaCat cells. After a 24 h exposure, GNR-CTAB reduced cell proliferation below 20%
from control at all concentrations indicating it is highly toxic, and that there is not a dose-
dependent response. A similar response was shown by the CTAB alone, sothe CTAB itself is
likely responsible for the GNR toxicity (Figure 3A). For GNR-CTAB, LDH leakage assay was
performed to verify results from the MTS assay (Figure 3B). There were high levels of
membrane leakage at the lower doses but at the higher doses there was not leakage. This is
most likely caused by the higher doses having a cytotoxic effect earlier than the lower doses
and the LDH is no longer in the media or is not produced by the cells. A similar trend was
observed with the CTAB alone (Figure 3B).
Sample Solvent Peak 1 Peak 2
GNR-MHDAWater 519 764
Media 555 954
Sample Solvent Peak 1 Peak 2
GNR-PEGWater 535 716
Media 541 722
0
0.2
0.4
0.6
0.8
1
1.2
1.4
1.6
300 400 500 600 700 800 900 1000
Ab
sorb
ance
Un
its
Wavelength (nm)
GNR-PEG in WaterGNR-PEG in EM
GNR-PEG
in water
0
0.2
0.4
0.6
0.8
1
1.2
1.4
1.6
300 400 500 600 700 800 900 1000
Ab
sorb
ance
Un
its
Wavelength (nm)
GNR-MHDA in WaterGNR-MHDA in EM
GNR-PEG
in Media
GNR-MHDA
in water
GNR-MHDA
in Media
12 Distribution A: Approved for public release
Figure 3. Cell viability following a 24 h treatment with GNR-CTAB. A. MTS assay; B. LDH assay. Error bars indicate standard deviation, the asterisk denotes significant toxicity.
The MTS and LDH assays were repeated at a shorter time-point to determine whether LDH
leakage could be observed for the higher doses at a shorter time point. GNR-CTAB disrupted
cell proliferation at all concentrations, thereby indicating that the cytotoxic effect occurs early
and that it is not a dose-dependent response. Again, a similar trend was observed with the
CTAB (Figure 4).
Figure 4. Cell viability following a 2 h treatment with GNR-CTAB. A. MTS assay; B. LDH assay.
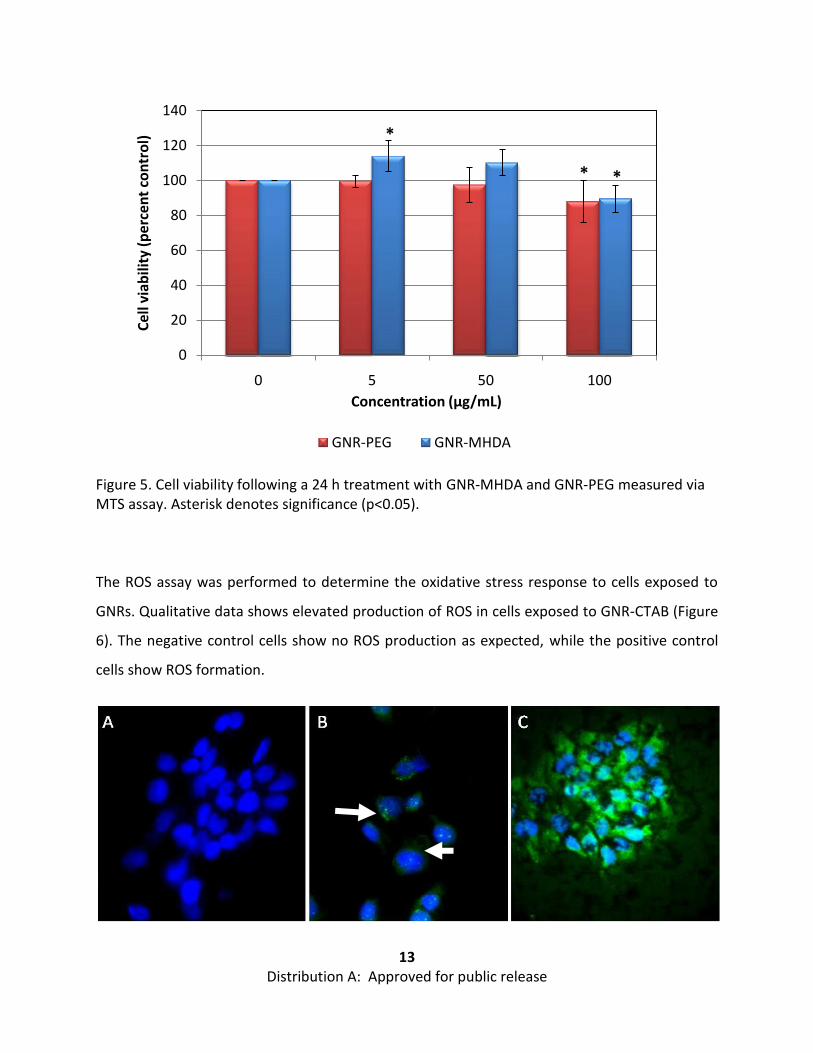
The MTS assay was carried out for GNR-PEG and GNR-MHDA after a 24 h exposure to
determine any effect on cell viability. GNR-MHDA increased cell proliferation at 5 µg/mL, and
GNR-MHDA and GNR-PEG showed significant decrease in cell viability at 100 µg/mL (Figure 5).
* * * * * * * *
*
* *
*
* *
*
*
* *
*
* *
* *
*
*
*
*
*
*
* *
*
*
*
13 Distribution A: Approved for public release
Figure 5. Cell viability following a 24 h treatment with GNR-MHDA and GNR-PEG measured via MTS assay. Asterisk denotes significance (p<0.05).
The ROS assay was performed to determine the oxidative stress response to cells exposed to
GNRs. Qualitative data shows elevated production of ROS in cells exposed to GNR-CTAB (Figure
6). The negative control cells show no ROS production as expected, while the positive control
cells show ROS formation.
0
20
40
60
80
100
120
140
0 5 50 100
Ce
ll vi
abili
ty (
pe
rce
nt
con
tro
l)
Concentration (µg/mL)
GNR-PEG GNR-MHDA
*
* *
14 Distribution A: Approved for public release
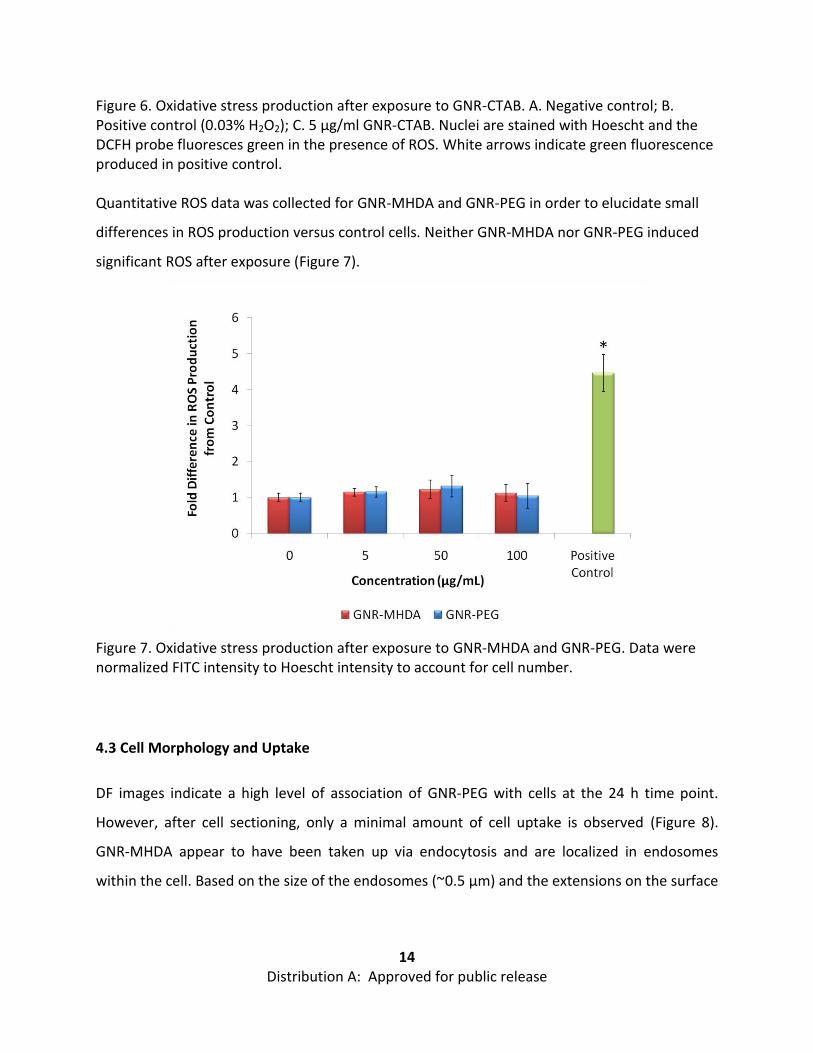
Figure 6. Oxidative stress production after exposure to GNR-CTAB. A. Negative control; B. Positive control (0.03% H2O2); C. 5 µg/ml GNR-CTAB. Nuclei are stained with Hoescht and the DCFH probe fluoresces green in the presence of ROS. White arrows indicate green fluorescence produced in positive control. Quantitative ROS data was collected for GNR-MHDA and GNR-PEG in order to elucidate small
differences in ROS production versus control cells. Neither GNR-MHDA nor GNR-PEG induced
significant ROS after exposure (Figure 7).
Figure 7. Oxidative stress production after exposure to GNR-MHDA and GNR-PEG. Data were normalized FITC intensity to Hoescht intensity to account for cell number.
4.3 Cell Morphology and Uptake
DF images indicate a high level of association of GNR-PEG with cells at the 24 h time point.
However, after cell sectioning, only a minimal amount of cell uptake is observed (Figure 8).
GNR-MHDA appear to have been taken up via endocytosis and are localized in endosomes
within the cell. Based on the size of the endosomes (~0.5 µm) and the extensions on the surface
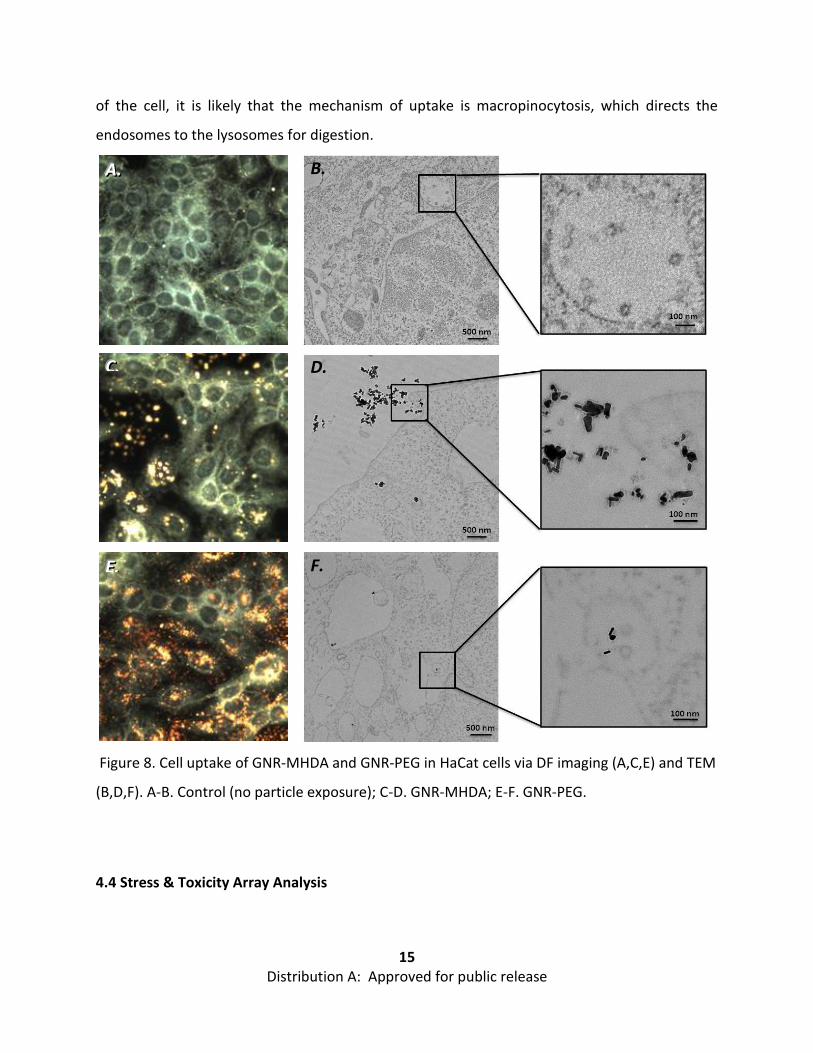
15 Distribution A: Approved for public release
of the cell, it is likely that the mechanism of uptake is macropinocytosis, which directs the
endosomes to the lysosomes for digestion.
Figure 8. Cell uptake of GNR-MHDA and GNR-PEG in HaCat cells via DF imaging (A,C,E) and TEM
(B,D,F). A-B. Control (no particle exposure); C-D. GNR-MHDA; E-F. GNR-PEG.
4.4 Stress & Toxicity Array Analysis
AAA... B.
CCC...
EEE...
D.
F.
16 Distribution A: Approved for public release
RT-PCR was used to determine the effect of GNRs on HaCat cells at non-toxic doses (50 µg/mL).
The Stress and Toxicity Array was used to evaluate the expression of genes directly regulated by
oxidative or metabolic stress and heat shock, as well as genes that are representative of
pathways activated by prolonged stress, such as apoptosis and senescence. The expression of
genes was determined according to their fold regulation. Values for fold regulation from control
that were greater than 3.00 were considered significant. A partial list of genes affected by GNRs
are shown in Table 3.
None of the genes under review were significantly affected in cells exposed to GNR-PEG. GNR-
MHDA induced up-regulation of genes associated with growth arrest, heat shock stress,
inflammation, and proliferation; however, apoptotic genes were down-regulation. Genes
associated with oxidative or metabolic stresses were both up and down-regulated by GNR-
MHDA. DNA damage and repair genes were not significantly up- or down-regulated by any
GNR exposure.
Up-regulation of genes related to inflammation, heat shock, and growth arrest indicates the
cells exhibited stress responses as a result of exposure to GNR-MHDA. The most significantly
affected gene was Serpine 1, which was up-regulated by a factor of nearly 9-fold more than
other genes. Serpine 1 is a serine protease inhibitor, which acts by inducing the synthesis of an
inhibitor protein, which inhibits the activity of tissue plasminogen activator. Plasminogen
activator plays a role in cell movement and inflammation. This suggests significant inhibition of
inflammation induced by exposure to GNR-MHDA after a 24 h exposure period, which may be
indicative of a pro-inflammatory response that may have occurred after a shorter exposure
period.
HSPH1 was the only heat shock protein-related gene of the nine that were tested in this array
to be affected in cells exposed to GNR-MHDA. HSPH1 encodes a heat shock protein that
prevents the aggregation of denatured proteins in cells under severe stress. Therefore, up-
regulation of HSPH1 indicates the cells are under significant stress. The up-regulation of growth
arrest gene GDF15 (growth differentiation factor 15), which encodes a protein that regulates
17 Distribution A: Approved for public release
differentiation, is also likely due to cell stress (Zimmer et al., 2004). E2F1 and PCNA, genes
related to proliferation and carcinogenesis, were also up-regulated by GNR-MHDA, which could
be related to the proliferative effect observed by MTS data for GNR-MHDA. The down-
regulation of the apoptosis related gene TNFSF10 is likely a result of an affect that occurred at a
shorter time point. FMO5 encodes flavin-containing monooxygenases, which are NADPH-
dependent flavoenzymes that catalyze the oxidation of heteroatom centers in drugs, pesticides,
and xenobiotics. Down-regulation may indicate stress resulting from the cells trying to process
GNR-MHDA that have been internalized.
The Stress and Toxicity array allows only a brief overview of gene regulation in HaCat cells
exposed to GNR-MHDA. However, results from this array could be used for more in-depth
analysis of the interactions of GNR-MHDA in the cells by measuring the proteins encoded by the
genes and evaluating these responses at different time points.
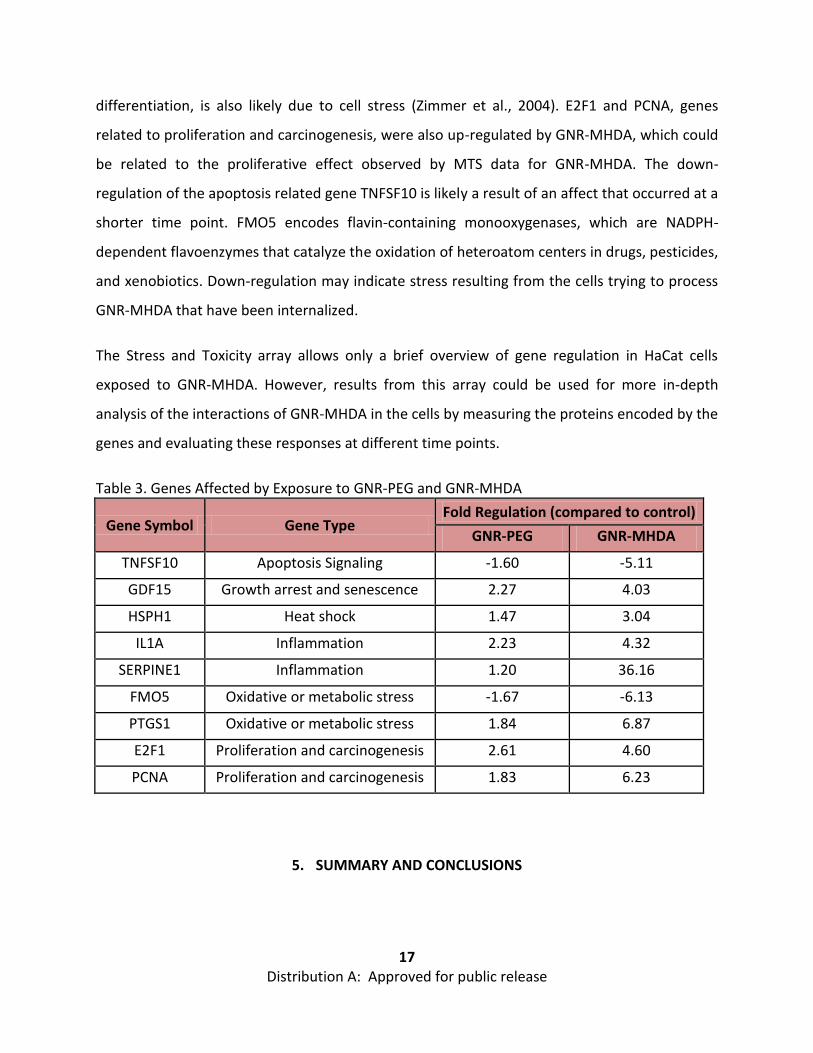
Table 3. Genes Affected by Exposure to GNR-PEG and GNR-MHDA
Gene Symbol Gene Type Fold Regulation (compared to control)
GNR-PEG GNR-MHDA
TNFSF10 Apoptosis Signaling -1.60 -5.11
GDF15 Growth arrest and senescence 2.27 4.03
HSPH1 Heat shock 1.47 3.04
IL1A Inflammation 2.23 4.32
SERPINE1 Inflammation 1.20 36.16
FMO5 Oxidative or metabolic stress -1.67 -6.13
PTGS1 Oxidative or metabolic stress 1.84 6.87
E2F1 Proliferation and carcinogenesis 2.61 4.60
PCNA Proliferation and carcinogenesis 1.83 6.23
5. SUMMARY AND CONCLUSIONS
18 Distribution A: Approved for public release
GNR-CTAB, GNR-MHDA, and GNR-PEG induced unique responses in HaCat cells, supporting the
strong influence of surface functionality on biological effects. The results of the cell viability
tests showed the GNR-CTAB to be extremely toxic to the human keratinocytes. Even at the
lowest dose of 5 µg/ml, only 5-10% of the cells were still viable. This observation was supported
by membrane leakage assays. Both MTS and LDH results within 2 h of exposure to the GNRs,
also show significant loss in cell viability and an increase in membrane leakage. However, these
results were also seen after cellular exposure to the CTAB alone. This leads us to conclude that
the toxicity may be due to the CTAB rather than the GNRs themselves. As CTAB is residual in
GNR synthesis, it is not possible to test the toxicity of GNRs without the addition of a different
stabilizing agent or functional group.
Biochemical analysis indicates that GNR-MHDA exhibited a proliferative effect on cell viability
after a 24 h exposure period at low concentration (5 µg/mL) and exhibits an inhibitive effect at
high concentrations (100 µg/mL). GNR-PEG only inhibited cell viability at the highest
concentration (100 µg/mL). Neither GNR sample induced oxidative stress in cells after a 24 h
exposure. Additional characterization was only pursued for GNR-MHDA and GNR-PEG due to
the high toxicity of GNR-CTAB.
Both GNR-MHDA and GNR-PEG appear to be internalized by cells, as determined by TEM.
However, the number of GNRs taken up is significantly greater for GNR-MHDA than GNR-PEG.
This result is expected due to the close to neutral zeta potential of PEGylated surfaces and lack
of interaction between PEGylated GNRs in biological media. Additionally, larger agglomerates of
GNR-MHDA were exposed to cells, which could also play a role in the increased level of uptake.
Genetic evaluation was performed to understand the molecular and cellular interactions that
may occur after exposure to GNRs. There were no effects observed after exposure to GNR-PEG.
However, GNR-MHDA induced minor modulation of gene activity as a result of cell stress, which
could indicate more severe toxicity for chronic exposures. Further study into the effect of GNR-
MHDA on inflammation in cells is recommended. However, the difference in response at the
19 Distribution A: Approved for public release
genetic level could likely be due to the difference in particle size of the GNR-MHDA versus GNR-
PEG under cell culture conditions.
GNR-PEG shows the most promise for applications due to its high level of stability in biological
media, low level of cytotoxicity, and ability to be taken up into cells. However, for applications
requiring more significant cell uptake, further studies into the effect of PEG molecular weight
and types of functional groups should be further investigated. For example, uptake-promoting
peptides could be added to obtain both stabilizing effects of PEG as well as increased cellular
uptake. Endo-lysosomal escape peptides could also be added to allow for intracellular delivery
applications. Quantitative studies, such as ICP-MS, should be performed to investigate the
effect of these properties on cell uptake. Further, due to the extensive agglomeration of GNR-
MHDA in exposure media, it is recommended that in future studies, protein serum be present
in the media used to expose GNRs to cells.
In addition to surface coating, aspect ratio (AR) must also be taken into account when studying
GNRs. One study investigating the effect of AR on cytotoxicity and cellular uptake was
performed by Rayavarapu et al. (2010), and it was found that PSS-coated GNRs of different ARs
(2.16 and 3.72) exhibited different effects on cytotoxicity, where the shorter GNR was more
cytotoxic. However, PEGylated GNRs with the same ARs did not show any toxicity effects. A
more complete investigation of the effect of AR on GNR cytotoxicity is planned in future
studies.
20 Distribution A: Approved for public release
6. REFERENCES
Agarwal A, Huang SW, O’Donnell M, Day KC, Day M, Kotov N, Ashkenazi SJ (2007). Targeted gold nanorod contrast agent for prostate cancer detection by photoacoustic imaging. Appl Phys 102, 064701.
Alkilany AM, Nagaria PK, Hexel CR, Shaw TJ, Murphy CJ, Wyatt MD (2009). Cellular uptake and cytotoxicity of gold nanorods: Molecular origin of cytotoxicity and surface effects. Small 5, 701-708. Carlson C, Hussain SM, Schrand AM, Braydich-Stolle LK, Hess KL, Jones RL, Schlager JJ (2008). Unique cellular interaction of silver nanoparticles: Size-dependent generation of reactive oxygen species. J Phys Chem B 112, 13608-13619.
Chen CC, Lin YP, Wang CW, Tzeng HC, Wu CH, Chen YC, Chen CP, Chen LC, Wu YC (2006). DNA-Gold nanorod conjugates for remote control of localized gene expression by near infrared irradiation. J Am Chem Soc 128, 3709–3715. Chithrani BD, Ghazani AA, Chan WCW (2006). Determining the size and shape dependence of gold nanoparticles uptake into mammalian cells. Nano Lett 6, 662-668.
Hauck TS, Ghazani AA, Chan WCW (2008). Assessing the effect of surface chemistry on gold nanorod uptake, toxicity, and gene expression in mammalian cells. Small 4, 153-159.
Huang X, El-Sayed IH, Qian W, El-Sayed MA (2006). Cancer cell imaging and photothermal therapy in the near-infrared region by using gold nanorods. J Am Chem Soc 128, 2115–2120. Huff TB, Hansen MN, Zhao Y, Cheng J, Wei A (2007). Controlling the cellular uptake of gold Nanorods. Langmuir 23, 1596-1599. Hussain S.M., Braydich-Stolle LK, Schrand AM, Murdock RC, Yu KO, Mattie DM, Schlager JJ, Terrones M (2009). Toxicity evaluation for safe use of nanomaterials: Recent achievements and technical challenges. Adv Mater 21, 1-11. Leonov AP, Zheng J, Clogston JD, Stern ST, Patri AK, Wei A (2009). Detoxification of gold nanorods by treatment with polystyrenesulfonate. ACS Nano 2(12), 2481-2488. Manohar S, Rayavarapu R, Petersen W, van Leeuwen TG (2009). Cell viability studies of PEG-thiol treated gold nanorods as optoacoustic contrast agents. SPIE, 7177. Niidome T, Yamagata M, Okamoto Y, Akiyama Y, Takahashi H, Kawano T, Katayama Y, Niidome Y (2006). PEG-modified gold nanorods with a stealth character for in vivo applications. J Contr Rel 114, 343-347.
21 Distribution A: Approved for public release
Parab HJ, Chen HM, Lai TC, Huang JH, Chen PH, Liu RS, Hsiao M, Chen CH, Tsai DP, Hwu YK (2009). Biosensing, cytotoxicity, and cellular uptake studies of surface-modified gold nanorods. J Phys Chem C 113, 7574–7578. Rayavarapu RG, Petersen W, Hartsuiker L, Chin P, Janssen H, van Leeuwen FWB, Otto C, Manohar S, van Leeuwen TG (2010). In vitro toxicity studies of polymer-coated gold nanorods. Nanotechnology, 21. Sau TK, Murphy C J (2004). Seeded high yield synthesis of short Au nanorods in aqueous solution. Langmuir 20 (15), 6414-6420. Wang S, Lu W, Tovmachenko O , Rai US, Yu H, Ray PC (2008). Challenge in understanding size and shape dependent toxicity of gold nanomaterials in human skin keratinocytes. Chem Phys Lett 463, 145–149.
Wijaya A, Hamad-Schifferli (2008). Ligand customization and DNA functionalization of gold nanorods via round-trip phase transfer ligand exchange. Langmuir 24 (18), 9966-9969.
Wijaya A, Schaffer SB, Pallares IG, Hamad-Schifferli K (2009). Selective release of multiple DNA oligonucleotides from gold nanorods. ACS Nano 3(1), 80-86. Zimmers TA, Hsiao EC, Pierce RH, Jin X, McGrath SA, Chavin K, Koniaris LG (2004). Growth differentiation Factor-15/Macrophage inhibitory cytokine-1 induction through P53- and Tnf-independent mechanisms in liver, kidney, and lung injury. J Surgical Res 121(2), 328-329.
22 Distribution A: Approved for public release
List of Symbols Abbreviations, and Acronyms
AR Aspect ratio
CTAB Cetyltrimethylammonium bromide
DF Darkfield
DLS Dymanic light scattering
EM Exposure media
FBS Fetal bovine serum
GNR Gold nanorod
HaCat Human keratinocyte cell-line
H2O2 Hydrogen peroxide
ICP-AES Inductively coupled plasma atomic emission spectroscopy
ICP-MS Inductively coupled plasma mass spectrometry
LDH Lactate dehydrogenase
MHDA Mercaptohexadecanoic acid
MS Mass spectroscopy
MTS 3-(4, 5-dimethylthiazol-2-yl)-5-(3-carboxymethoxyphenyl)-2-(4-
sulfophenyl)-2H-tetrazolium, inner salt
mV Millivolts
NIR Near infrared
ng Nanogram
nm Nanometer
PAA Polyacrylic acid
PAH Polyelectrolyte poly(allylamine) hydrochloride
PBS Phosphate buffered saline
PDADMAC Poly(diallyldimethyl ammonium chloride
PEG Polyethylene glycol
Pen/strep Penicillin/streptomycin
PSS Polys(4-styrene sulfonic acid)
ROS Reactive oxygen species
RT-PCR Reverse transcriptase polymerase chain reaction
TEM Transmission electron microscopy
UV/VIS Ultraviolet/Visible spectroscopy
µ Micro
µL Microliter
µm Micometer

23 Distribution A: Approved for public release