Friction Stir Welding Process Parameters for Joining Dissimilar Aluminum Alloys

ORIGINAL ARTICLE
Effect of friction welding parameters on the tensile strengthand microstructural properties of dissimilar AISI 1020-ASTMA536 joints
Radosław Winiczenko1
Received: 23 March 2015 /Accepted: 24 August 2015 /Published online: 5 September 2015# The Author(s) 2015. This article is published with open access at Springerlink.com
Abstract This paper presents an effect of friction weldingparameters on the tensile strength and microstructural proper-ties of dissimilar AISI 1020-ASTM A536 joints. A hybridresponse surface methodology (RSM) and genetic algorithm(GA)-based technique were successfully developed to model,simulate, and optimise the welding parameters. Direct andinteraction effects of process parameters on the ultimate ten-sile strength (UTS) were studied by plotting graphs. Frictionforce and friction time have a positive effect on tensilestrength. As friction force and friction time increase, the ten-sile strength also increases. The maximum tensile strength ofthe friction-welded low carbon steel-ductile iron joints was87 % of that of the base metal. The tensile properties, micro-structure, Vickers hardness distribution, and fracture morphol-ogy of the welded specimen have been studied and presentedin this study. Additionally, the distribution of carbon elementon both sides of the interface was estimated using energy-dispersive spectroscopy (EDS). The results of the metallo-graphic study show clearly that the friction welding processwas accompanied by a diffusion of carbon atoms from ductileiron to steel. This process causes the formation of a carbon-rich zone at the interface and decarburization zone in the duc-tile iron close to the bond interface.
Keywords Frictionwelding .Ductile iron .Lowcarbonsteel .
Genetic algorithm . Tensile strength .Microstructure .
Optimisation
1 Introduction
Ductile iron castings are used for many structural applications,particularly those requiring strength and toughness combinedwith good machinability and low cost. There are applicationssuch as crankshafts, steering knuckles, differential carriers,brake callipers, hubs, brackets, valves, water pipes and manyothers [1, 2]. Special materials and techniques are available forthe repair welding of ductile iron castings or for joining ductileiron to itself or to other ferrous materials, such as mild steel,austenitic steel, and grey, nodular or malleable iron [3]. Thesemethods include manual metal arc welding, flux cored arcwelding, metal inert gas welding, gas tungsten arc welding,gas welding, diffusion bonding, impact-electric current dis-charge joining, laser welding, oxyacetylene powder welding,rotary friction welding and friction stir welding [4].
Ductile irons contain higher amounts of carbon comparedto steels which diffuse into the austenite during welding,forming hard brittle phases at the weld interface, namely mar-tensite and carbides. These give rise to poor elongation prop-erties and high hardness values, as reported by Pascual et al.[5]. Therefore, like the welding of other cast irons, the weldingof ductile iron requires special precautions to obtain optimumproperties in the weld metal and adjacent heat-affected zone(HAZ) [6]. The main objective is to avoid the formation ofcementite in the matrix material, which makes the weldedregion brittle, but in ductile iron, an additional objective is ofalmost equal importance, concerning the retention of a nodu-lar form of graphite [7].
Friction welding (FW) is suitable in the case of materialsfor which conventional welding is either very difficult or evenimpossible [2]. Therefore, in recent years, ductile iron hasbeen successfully friction welded and also joined to othermaterials, such as steels with a high alloy content. Accordingto Crossland [8], the main reasons for dissimilar joining are
* Radosław [email protected]; [email protected]
1 Department of Production Engineering, Warsaw University of LifeSciences, Nowoursynowska 166, 02-787 Warsaw, Poland
Int J Adv Manuf Technol (2016) 84:941–955DOI 10.1007/s00170-015-7751-5

due to the combination of good mechanical properties of onematerial and the low specific weight, good corrosion resis-tance and good electrical properties of the other material.However, according to the American Welding Society(AWS) [9] and Lebedev and Charnenko [10], the frictionwelding of ductile iron is not possible because graphite actsas a lubricant and prevents the generation of heat sufficient forjoining. Hence, many researchers conducted a study on thecombination of low carbon steel (LCS) and ductile iron (DI).However, ductile iron-steel welded joints are particularly dif-ficult to produce since carburization takes place on the LCSside with carbide formation. This can result in the formation ofa brittle, hard zone that cannot be eliminated by annealing[11]. Richter and Palzkill [12] concluded that in frictionwelding of steel with graphite-containing cast iron, the influ-ence of graphite in ductile iron on the welding process mustalso be taken into account, because this graphite builds up alubrication layer which impedes the generation of an intensivefrictional force and, consequently, the development of heat.Dette and Hirsch [13] joined steel and ductile iron with fric-tion welding. The authors mentioned the main advantage toapplying of ductile iron was the weight saving of the partfollowing the 10 % lower gravity of ductile iron than standardsteel. The aim of next welding trials was to obtain a highmechanical tensile strength of joining during the exploitationof a given element. Michiura et al. [14] demonstrated theapplication of friction welding for ductile cast iron pipes.The authors concluded that the tensile strength decreased withincreasing layers of deformed spheroidal graphite. Shinodaet al. [15], fromNagoyaUniversity in Japan, stated that ductileiron can be joined by friction welding without any specialtreatment, such as preheating and/or post-heating treatment.Ochi et al. [16] tested the macrostructure and temperaturedistribution near the interface during the friction welding ofFC250 grade cast iron. Their highest reported tensile strengthin solid joints and pipe joints were, respectively, 317 and381 MPa. Song et al. [17] examined the strength distributionat the interface of rotary friction-welded aluminium to ductileiron. The results of the investigations concerning the micro-structure and mechanical properties of friction-welded ductileiron with stainless steel and Armco iron were provided in thepapers [18, 19].
A review of the literature shows that in order to produce agood quality joint for welding of ductile iron, many solutionsare used. These include the introduction of the low carbonsteel interlayers and changing the geometric shape of thejoined parts, which are also heat treated before and/or afterthe friction welding process. Regardless of the type of mate-rial, these technologies complicate the welding process, in-crease its duration and make the technology more expensive.According to the ASM [20], the friction welding process pa-rameters play a significant role in making good quality joints.Rotational or tangential speed, pressure at the weld interface
and heating time are the variables that must be considered indirect drive friction welding. Thus, identifying the suitablecombinations of the process input parameters to produce thedesired output requires many experiments, making this pro-cess time consuming and costly [21]. In order to overcomethis problem, various optimisation methods can be applied todefine the desired output variables through developing math-ematical models to specify the relationship between the inputparameters and output variables. In the last two decades, de-sign of experiment (DOE) techniques have been used to carryout such optimisation [22].
As it is mentioned above, the available knowledge on fric-tion welding of ductile iron is focused on the structural andmechanical properties, phase transformation and tensilestrength evolution. All these investigations were carried outthrough trial and error method to attain optimum weldingconditions. The combined effects of process parameters ontensile strength in DI with LCS friction-welded joints are hith-erto not reported. Only other materials such as stainless steel,aluminium alloys, magnesium or titanium alloys were consid-ered by many researchers. The main factor responsible for thissituation may be the fact that ductile iron is generally consid-ered to be the material difficult to weld.
Therefore, the first aim of this paper is to employ responsesurface methodology to develop empirical relationshipsconcerning frictionwelding input parameters: friction force, fric-tion time and upset force and output response: tensile strengthfor the LCS-DI joints. The second aim is to find the optimalparameter welding combination that would maximise the ulti-mate tensile strength of friction welding joints. Moreover, wewould like to take a closer look into metallurgical phenomena,accompanying the friction welding of ductile iron with steel.
2 Experimental details
2.1 Material selection
The friction welding was done on ductile iron (ASTM A 536)with low carbon steel (AISI 1020) rods sized 20 mm in diam-eters and 100 mm in length. The chemical composition of thebase materials is presented in Table 1. The mechanical prop-erties of the base materials are presented in Table 2. The mi-crostructure of the as-cast DI showed a bull’s eye structurewith ferrite surrounding the graphite nodules in a pearliticmatrix (Fig. 1a). The microstructure of LCS steel showed amatrix of ferrite grains and pearlite (Fig 1b).
2.2 Friction welding setup
The process of joining was carried out on the continuous drivefriction machine type of ZT-13. The surface for frictionwelding was prepared on the abrasive cutoff machine. The
942 Int J Adv Manuf Technol (2016) 84:941–955

geometry of specimens used for friction welding and the basicsteps in the friction welding process were presented in Fig. 2.As shown in Fig. 2, one workpiece is rotated and the other isheld stationary. When the appropriate rotational speed isreached, the workpieces are brought together under axialforce. Abrasion at the weld interface heats the workpiece lo-cally and upsetting (axial shortening) starts. Finally, the rota-tion of the workpiece ceases and upset (forge) force is appliedto consolidate the joint.
2.3 Design of experiment
The following independently controllable process parame-ters were identified to carry out the experiments: frictionforce (F), friction time (T) and upset force (U). Other fric-tion welding parameters like rotational speed and upsettime could be set at any desired level within the range ofthe machine setting. Constant rotational speed (1,450 rpm)and upset time (3 s) are used in this study. The workingranges of all of the selected parameters were fixed byconducting trial runs. This was carried out by one of theparameters varying whilst the rest of them was kept at con-stant values. The working range of each process weldingparameter was decided upon by inspecting the weld for asmooth appearance without any visible defects. The upperand lower limits with different levels of the identified pro-cess parameters are presented in Table 3. The selected de-sign matrix (see Table 4) is a central composite face-centredfactorial design consisting of 20 sets of coded conditions[22]. It comprises a full replication of 23 (8) factorial designplus six centre points and six star points. All frictionwelding variables at the intermediate level (0) constitutethe centre points and the combinations of each of thewelding variables at either their lowest (−1) level or highest(+1) level with the other two variables at the intermediatelevels constituting the star points. Thus, the 20 experimen-tal runs allowed for the estimation of the quadratic and two-way interactive effects of the friction welding parameters.
2.4 Methods
As prescribed by design matrix (Table 4), 20 joints were fab-ricated. The tensile specimens comprising the welded jointswere machined to the required dimensions according to theASTM E8M-04 standard [23]. Three tensile specimens wereprepared for different welding conditions to predict the trans-verse tensile strength. The tensile strength test was carried outon a 100-kN servo-controlled universal testing machine(Instron). From each joint, the average of three results waspresented in Table 4.
Vickers hardness testing machine was employed for mea-suring the hardness of the friction-welded specimens for theoptimised conditions. The hardness of the joints across theinterface was measured with 0.5 kg load at 15 s dwell time.
The microstructure analysis of the optimised joints wascarried out on the optical microscope (OM). The specimenswere mechanically polished by using emery special sheetswith the help of disc and bench polishing machine. The pre-pared specimens were etched by applying 2 % nital forinspecting the metallurgical behaviour of the welded joints.Moreover, the electron microscopy was performed on a JEOLJSM-5400 scanning electron microscope (SEM) equippedwith a LINK ISIS 200 energy-dispersive X-ray spectrometer.The surfaces of specimens were observed in BEI COMPOmicroscope mode using back-scattered electrons (BSE). Ad-ditionally, the studies were conducted on the interface usingenergy-dispersive spectroscopy (EDS) linear and the mapanalysis. The aim of the EDS linear analysis was to determinethe changes in the distribution of carbon across the interface.
3 Results and discussion
3.1 Developing empirical relationships
The relationship between ultimate tensile strength (UTS)of the friction-welded LCS-DI joint is a function of thefriction welding parameters such as a friction force (F),
Table 2 Mechanical properties of the base materials
Material Tensile strength (MPa) Yield strength (MPa) Elongation (%) Hardness (HV)
Ductile iron 552 379 6 250
Low carbon steel 395 295 36 115
Table 1 Chemical composition of the base materials (wt%)
Material C Si Mn P S Cr Ni Mg Fe
Ductile iron 3.55 2.40 0.30 0.06 0.007 0.003 0.05 0.03 Balance
Low carbon steel 0.18–0.23 <0.05 0.30–0.60 <0.04 <0.050 – – – Balance
Int J Adv Manuf Technol (2016) 84:941–955 943

friction time (T) and upset force (U), which can beexpressed as:
Y UTSð Þ ¼ f F; T ; Uð Þ ð1Þ
The mathematical model to establish the relationships be-tween input and output parameters was developed usingDesign-Expert Software (DES) [24] at a confidence level of95 %. The tensile strength was expressed as a non-linear func-tion of process parameters.
The second-order polynomial equation that represents theresponse surface Y is:
Y ¼ b0 þX
bixi þX
biix2i þ
Xbiixix j ð2Þ
When considering three parameters, the selected polyno-mial could be expressed as:
Y ¼ b0 þ b1 Fð Þ þ b2 Tð Þ þ b3 Uð Þ þ b12 FTð Þ þ b13 FUð Þ þ b23 TUð Þþ b11 F2
� � þ b22 T2� � þ b33 U 2
� �
ð3Þ
where b0 is the average of responses and bi and bij are theresponse coefficients that depend on a response coefficientthat depend on respective main and interaction effects of theparameters.
A central composite design which accurately fits the second-order response surface was used in this work. The value of thecoefficient was calculated by applying central composite design
using DES. The significance of each of the model terms waschecked using p values. Avalue of p less than 0.05 indicates thatthe model terms are significant. The values greater than 0.05indicate that the model terms are not significant. Values greaterthan 0.1 indicate themodel terms are not significant. Insignificantmodel terms that are not satisfying the above said criteria havebeen eliminated by the backward elimination regression method,without affecting much of the accuracy of the model [24]. Thefinal mathematical relationships between welding variables topredict tensile strength of friction welding joints, developed bythe statistical design of experiments procedure, are given below.
Final equation in terms of coded factors is as follows:
UTS ¼ 288:37 þ 14:30 Fð Þ þ 19:30 Tð Þ− 11:20 Uð Þ
þ 12:13 FTð Þ−7:12 FUð Þ − 51:12 TUð Þ þ 2:82 F2� �
þ 65:82 T 2� �þ 9:32 U2
� �ð4Þ
The final equation in terms of actual factors is as follows:
U T S ¼ 419:98 − 13:749 Fð Þ − 8:504 Tð Þ þ 9:908 Uð Þþ 0:242 FTð Þ− 0:204 TUð Þ þ 0:704 F2
� �þ 0:105 T 2� �þ 0:093 U2
� �
ð5Þ
The adequacy of the developed relationship was testedusing the analysis of variance technique (ANOVA). In thisresearch, the desired level of confidence was considered tobe 95 %. The basic adequate ANOVA test results for all re-sponses are presented in Table. 5. The model F value of 44.11
Pearlite
Ferrite
(b)
Ferrite
Pearlite
Pearlite
Ferrite
(a)
Graphite
Ferrite
FerritePearlite
50 µm 50 µm
Fig. 1 Optical microstructure ofparent metals. a Micrograph ofthe as-cast ductile iron showing abull’s eye structure with ferritesurrounding the graphite nodulesin a pearlitic matrix. bMicrograph of low carbon steelshowing a matrix of ferrite grainsand pearlite. Etched by 2 % nital
LCS
Workpiece
1
DI
WorkpieceLCS
LCS DI
DI
Flash Formation
Rotating Chuck Non Rotating Chuck
Fig. 2 Experimental setup forcontinuous drive friction weldingwith the basic steps in the weldingprocess
944 Int J Adv Manuf Technol (2016) 84:941–955

for tensile strength implies the model is significant. The coef-ficient of determination R2 is used to find how close the pre-dicted and experimental values lie. The value of R2 for tensilestrength indicates that a high correlation exists between theexperimental and predicted values exists. The ‘adequate pre-cision’ measures the signal-to-noise ratio. A ratio greater that4 is desirable. There is an adequate signal in all models. Eachpredicted value matches well its experimental value, as shownin the correlation graph in Fig. 3.
3.2 Optimisation of welding parameters
To predict the welding parameters accurately without consum-ing time, materials and labour effort, in recent years, variousmethods have been available with genetic algorithms (GAs)amongst others. GAs were applied into the wide range of
engineering problems including optimisation of process pa-rameters in welding processes.
Murti et al. [25] developed a statistical experimental designmodel in friction welding dissimilar materials (low alloy steelto austenitic stainless steel, medium carbon steel to high speedsteel and aluminium to stainless steel). Canyurt [26] devel-oped the genetic algorithm welding strength model to estimatethe mechanical properties of the welded joints for the brassmaterials. Paventhan et al. [27] used the RSM to optimise thefriction welding parameters for joining aluminium alloy andstainless steel. Sathiya et al. [28] have conducted the optimi-sation of friction welding parameters using simulated anneal-ing (SA), artificial neural networks (ANN) and evolutionaryalgorithms (EA). Kumaran et al. [29, 30] optimised a tube totube plate using an external tool by genetic algorithms andTaguchi method. Dey et al. [31] conducted the optimisationof bead geometry in electron beam welding using a GA. A
Table 3 Process variables and their bounds
Parameter Notation Unit Factor levels
−1 0 1
Friction force F kN 11 13 15
Friction time T s 40 65 90
Upset force U kN 27 37 47
Table 4 Design matrix and experimental design
Trial no. Coded value Actual value Responses
F T U F T U UTS
1 −1 −1 −1 11 40 27 304
2 1 −1 −1 15 40 27 315
3 −1 1 −1 11 90 27 414
4 1 1 −1 15 90 27 496
5 −1 −1 1 11 40 47 378
6 1 −1 1 15 40 47 383
7 −1 1 1 11 90 47 306
8 1 1 1 15 90 47 337
9 −1 0 0 11 65 37 283
10 1 0 0 15 65 37 297
11 0 −1 0 13 40 37 343
12 0 1 0 13 90 37 363
13 0 0 −1 13 65 27 290
14 0 0 1 13 65 47 303
15 0 0 0 13 65 37 289
16 0 0 0 13 65 37 290
17 0 0 0 13 65 37 291
18 0 0 0 13 65 37 287
19 0 0 0 13 65 37 286
20 0 0 0 13 65 37 292
Table 5 ANOVA results for ultimate tensile strength
F value Prob>F
Model 44.11 <0.0001
F 14.34 0.0036
T 26.13 0.0005
U 8.80 0.0141
F·T 8.25 0.0166
F·U 2.85 0.1223
T·U 146.67 <0.0001
F2 0.15 0.7037
T2 83.56 <0.0001
U2 1.67 0.2247
Model statistics Tensile strength
Coefficient R2 0.97
Adjusted R2 0.95
Predicted R2 0.74
Adequate precision 24.23
Fig. 3 Predicted value of tensile strength vs. observed value of tensilestrength
Int J Adv Manuf Technol (2016) 84:941–955 945

binary-coded genetic algorithm with a penalty term wasused to solve the said problem. Prediction of tensilestrength and optimisation of process parameters for fric-tion stir-welded dissimilar aluminium alloys [32, 33]and stainless steel [34] were also conducted in the pa-pers. Elangovan et al. [35] studied a parametric optimi-sation of ultrasonic metal welding using RSM and GAapproach. A hybrid intelligent method for evaluating thenear optimal settings of the friction welding processparameters of duc t i l e i ron was conducted byWiniczenko et al. [36]. The optimisation of weldingparameters was carried out in an automatic cycle withthe use of support vector regression (SVR), GA andimperialist competitive algorithm (ICA). Udayakumaret al. [37] carried out an experimental investigationand multi-objective genetic algorithm (MOGA) optimi-sation of friction welding parameters for super duplexstainless steel joints.
GAs are a search method based on natural selection andheredity mechanisms. It is very universal, with simple proce-dures regulating the search for the best solutions and using the
stochastic method. GAs use the evolutionary principle of sur-vival characteristic for the most adapted individuals [38, 39].The general optimisation procedure using a genetic algorithmis shown in Fig. 4.
These algorithms encode a potential solution to a specificproblem on a simple chromosome string and apply specifiedoperators to a chromosome so as to preserve critical informa-tion and to produce a new set of population with the purposeof generating strings which map to high function values [40].
The basic genetic algorithm (Fig. 4), also called the ele-mentary or simple genetic algorithm, contains the followingsteps:
Step 1 Generating randomly generate an initial chromosomepopulation
Step 2 Decoding the genes, namely F, T and U of allchromosomes
Step 3 Evaluating the predicted value of weld strength usingthe RSM model. Determine the maximum fitness ofall chromosomes in the population
Step 4 Checking the stopping criterion
Fig. 4 The general structure ofthe genetic algorithms
946 Int J Adv Manuf Technol (2016) 84:941–955

Step 5 Selection of chromosomesStep 6 Using genetic operatorsStep 7 Creating a new populationStep 8 Presentation of the ‘best’ chromosome
A Matlab function was written using the developed RSMmodel in terms of actual factors (see Eq. 5). This function wascalled the fitness function for the optimisation problem.Therefore, the fitness function was a function maximisingthe tensile strength of welding joints. Experimental rangeswere placed as bounds on the three input variables which areshown below:
& Constraints on friction force
11 ≤ F ≤ 15
& Constraints on friction time
40 ≤ T ≤ 90
& Constraints on upset force
27 ≤ U ≤ 47
The genetic algorithm options are shown in Table 6. Theoptimised achievement after 120 iterations is shown in Fig. 5.The weighted average change in the fitness function valueover of 150 generations was used as the criteria for stoppingthe GA algorithm.
The best input parameters obtained throughout GA wereused to process the friction joints experimentally.
3.3 Effect of welding process parameters on tensilestrength
The direct effect of the process parameters on the UTS re-sponses has been found from the developed mathematicalmodel. The variation of the responses with respect to each ofthe three process parameters, friction force, friction time and
upset force, were plotted by keeping two parametersconstant at their central level and varying the third with-in the upper and lower bounds. The individual varia-tions of the responses with actual welding parametersare presented in Fig. 6.
Figure 6a shows the effect of friction force on tensilestrength of the welds. From Fig. 6a, it can be observed thattensile strength increases with an increase in friction force.The same phenomenon has been reported during frictionwelding of mild steel. According to Ellis [41], as the frictionwelding pressure increases, within limits, the tensile strengthof the weld increases, approaching parent metal.
Upset force has a negative effect on tensile strength. Asupset force increases, the tensile strength decreases.Figure 6b shows the effect of upset force on the ultimatetensile joint. Similar results were also reported by Kurt et al.[42]. They believed that the tensile strength decreases slightlywith increasing the upset force. This effect is probably due tothe easy deformation of soft material at high forging pressure,as reported by Ates et al. [43].
According to the ASM [20], due to the high heatproduced under increased friction force, friction weldmay behave like hot worked material. The weld metalarea has been reduced when the hot forged conditionsare increased. It could enhance the more austenite phasein the weld zone. Therefore, the tensile strength foundto be decreasing as upset force steps up, reaches a min-imum and then increases. With high upset force(Fig. 6b), tensile strength started increasing mainly dueto the strain induced deformation as reported byUdayakumar et al. [37].
Friction force and friction time have a positive effect ontensile strength. As friction force and friction time increase,the tensile strength also increases. However, initially, the ten-sile strength decreases as friction time increases from 40 to60 s, reaches a minimum and then increases (see Fig. 6c). Thesame phenomenon has been reported during friction weldingof dissimilar materials by Sahin [44, 45].
The interaction effects of the process parameters on UTShave been found from a developed mathematical model,which are shown in Fig. 7.
Figure 7a shows the interaction effects of friction forceand friction time on tensile strength. It is evident that thedecreasing trend of tensile strength flattens as frictiontime changes from 40 to 50 s. As friction time proceeds,the tensile strength shows an increasing trend as frictionforce increases. It can be observed that there is a suddenincrease in tensile strength as friction time changes from60 to 90 s.
Figure 7b shows the interaction between the upset forceand friction force on tensile strength. It is clear that the curvesshow the same trend as the upset force increases. Tensilestrength slowly decreases as friction force decreases.
Table 6 The geneticalgorithm settings Population size 20
Selection function Roulette
Crossover friction 0.8
Crossover function Single point
Migration function Forward
Number generations 200
Stall generations 150
Int J Adv Manuf Technol (2016) 84:941–955 947

3.4 Validation of experiment
A predicted maximum tensile strength of the friction-weldedspecimen which is 482 MPa could be attained under thewelding conditions of friction force of 15 kN, upset force of27 kN and friction time of 90 s. The experimentally deter-mined tensile strength was found to be 480 MPa and couldbe attained under the welding conditions of friction force of15 kN, upset force of 27 kN and friction time of 90 s whichshow the consistency of the model.
Three further validation experiments were performed andthe response of both models was found in agreement with theexperimental results. The results of the confirmation experi-ments are shown in Table 7. To test the accuracy of a devel-oped model in practical applications, conformity test runswere conducted by assigning different values for the process
parameter within their working ranges but are different fromthat of the designmatrix. These tests were conducted using thesame experimental setup to demonstrate the reliability of thepredicted values. The conformity tests show the accuracy of adeveloped model which is above 95 %. A maximum errorobtained in the validation process was 2.35 %.
3.5 The Vickers hardness measurements
The variations of hardness the welded specimens for differentwelding parameters are shown in Fig. 8. The measurementswere carried out along the central axis for LCS-DI joints.
As could be expected, the hardness reaches its maximumclose to the interface and decreases very rapidly in the LCSregion (Fig. 8). Contrary to this, the hardness decrease in DI ismuch slower and exhibits some kind of plateau. As can be
(a) (b)
Fig. 5 The results of geneticalgorithm optimisation. aConverged values of weldingparameters. b Convergence offitness values
275
280
285
290
295
300
305
310
11 12 13 14 15
Ten
sile
Str
eng
th (
TS
), M
Pa
Friction Force (F), kN
TS, for
T=65 s,
U=37 kN
280
285
290
295
300
305
310
27 32 37 42 47
Ten
sile
Str
eng
th (
TS
), M
Pa
Upset Force (U), kN
TS, for
T=65 s,
F=13 kN
280
300
320
340
360
380
400
40 50 60 70 80 90
Ten
sile
Str
eng
th (
TS
), M
Pa
Friction Time (T), s
TS, for
F=13 kN,
U=37 kN
(a) (b)
(c)
Fig. 6 Effect of the processparameters on tensile strength. aFriction force on tensile strength.b Upset force on tensile strength.c Friction time on tensile strength
948 Int J Adv Manuf Technol (2016) 84:941–955

observed from the diagram, this plateau extends to 1.2 or8 mm from the interface, depending on the location of thehardness measurements and reaches the value that is typicalof the parent material. The hardness values generally in-creased with increasing friction pressure and upset pressures,but hardness values decreased with increasing upset time [42].
The maximum hardness value obtained in close proximityto the interface reached 552 HV for no optimised DI joint.Compared to the microstructure shown in Fig. 11, this in-crease can be explained by the formation of martensite at theweld joint. It was thought that this structure was generatedbecause the material was intensively heated and rapidlycooled during the friction welding process. The formation ofmartensite reduces the mechanical properties of friction weld-ment. However, the microstructure may be controlled by thewelding parameters [46]. In order to minimise martensite
formation, the peak temperature was decreased below the eu-tectoid temperature [47]. This decrease in temperatureprevented any transformation and decreased the cooling rateof the weldment. Therefore, it is possible to obtain a full re-crystallized ferritic structure if the welding conditions are con-trolled properly to avoid an austenite phase transformation[46]. In the long-timewelding, the heating timewas prolongedto increase the maximum temperature at the weld interface, toincrease the time for axial conduction of heat into the twowork pieces and to decrease the subsequent cooling rate [48].
After optimisation of welding parameters, the maximumhardness value for DI decreased to ∼350 HV for DI whenthe distance to the centre of the weld was 1.2 mm. Similarvalues of the hardness distribution between ductile iron andlow alloy steel joints have been noticed in the literature [11].
The result shows the hardness of the welded specimen de-creases more rapidly when the phase changes from fully de-formed zone to heat-affected zone for both welded joints.
The changes of the hardness in the welding interface aredirectly associated with the microstructure resulted from thedegree of the heat being introduced and plastic deformation[42, 49]. After optimisation, the hardness of the weld interfacehas increased only to 71 % for DI and 44 % for LCS of thebase metals, respectively. This is a very small variation com-paring with the other fusion welding process. The results ofmicrostructures of friction welds as a function from the inter-face are described below.
250
275
300
325
350
375
400
425
450
Ten
sile
Str
eng
th (
TS
), M
Pa
Friction Force (F), kN
T=65 s
T=70 s
T=75 s
T=80 s
T=90 s
T=40 s
T=50 s
T=60 s
270
280
290
300
310
320
330
340
11 12 13 14 15
27 32 37 42 47
Ten
sile
Str
eng
th (
TS
), M
Pa
Upset Force (U), kN
F=13 kN,
T=65 s
F=11
F=12
F=14
F=15
(a)
(b)
Fig. 7 Interaction effect of the process parameters on tensile strength. aFriction force and friction time on tensile strength. b Upset force andfriction force on tensile strength
Table 7 Validation test resultsTest run Process parameters Experimental value Predicted value % of error
No. F T U UTS (MPa) UTS (MPa) UTS
1 14 70 40 290 297 −2.352 15 85 25 465 457 1.75
3 12 80 30 337 345 −2.31
% of error=[(experimental value−predicted value)/predicted value]×100
0
50
100
150
200
250
300
350
400
450
500
550
600
-11-10 -9 -8 -7 -6 -5 -4 -3 -2 -1 0 1 2 3 4 5 6 7 8 9 10 11
Vic
ker
s H
ard
nes
s (H
V)
Distance from weld interface (mm)
F=15 kN, T=90s, U=27 kN, TS=482 MPa (after optimisation)
F=30 kN, T=25s, U=37 kN, TS=265 MPa (without optimisation)
Interface
DILCS
Fig. 8 The Vickers hardness distributions of low carbon steel-ductileiron friction-welded joint at various welding parameters
Int J Adv Manuf Technol (2016) 84:941–955 949
3.6 Microstructure investigation
The microstructural features of friction-welded LCS-DI dis-similar joint are shown in Fig. 9. The weld interface clearlyshows the line of the joint. The microstructure of LCS-DI jointat the weld interface shows range and variety. The rotatingLCS bar at the interface (Fig. 9b) exhibits a microstructureof a thin layer of highly deformed and refined grains. Thegrains are not uniform, and they have elongated due to theapplication of heat and pressure caused by thermomechanicalaction [11]. Because of the extensive mechanical deformationand heat produced during FW, good welding only resultedwhen proper process parameters were used.
The results of the optical microstructure observations of thejoints with selected welding parameters were given in Fig. 10.The microstructure observations were carried out in differentareas of the HAZ in axis samples.
It was found that the ferrite structures in the original ductileiron had transformed into fine pearlite (P) and martensite (M)(Figs. 10a and 11) structures through rapid cooling from ahigh temperature state. Cheng et al. [46] indicated that themicrostructure of high carbon steel by friction welding pro-cess mainly consisted of martensite when the peak tempera-ture exceeds the A1 (eutectoid temperature). On the otherhand, when the welding was performed below A1, no trans-formation occurred and no martensite formed [47].
Some ferrite grains also resulted from the friction weldingprocess. Since the original ferrite structures were transformedinto martensite, the FW processing temperature should behigher than the austenisation temperature of the material.Then, fine pearlite and martensite come into being duringthe cooling process. When the highest temperature in the duc-tile iron exceeds its eutectoid, the carbon in graphite willspread out to speed up the microstructure transformation intoaustenite by increasing the carbon concentration in the basemetal. Whilst rapidly cooling, the austenite structure maytransform into martensite [50].
In some areas of the micrograph, the carbide eutectic-ledeburite (L) in the pearlitic matrix were identified. The ap-pearance of ledeburite eutectic in DI can be explained only bythe fact that the liquid–solid phase transformation had to pro-ceed [43]. Considering the Fe-C binary phase diagram(Fig. 12) [51], and due to high carbon content of the substrateductile iron and high rate of solidification, it can be deducedthat white hypoeutectic iron should form at the interface be-tween the materials. Solidification in such irons begins byprecipitation of an initial austenite phase which growsdendritically. When temperature falls off, more austenite willform and the carbon content of the remaining liquid simulta-neously rises up to the eutectic composition. At the eutecticcomposition, the melt transforms into a mixture of austeniteand cementite, called ledeburite [52, 53]. The austenitic matrix
(a) (b)LCS DI DILCS
L
P
G
DG
InterfaceInterface
P
L
L
GDGPMZ
HAZ
UG
UG
50 µm 50 µm
M
G
FF
Fig. 10 Optical micrographshowing the microstructure ofLCS-DI friction-welded joints atvarious welding parameters. a F=30 kN, T=23 s and U=37 kN. bF=15 kN, T=90 s and U=27 kN.Etched by 2 % nital
(a) (b)
Interface
LCS LCS
DI
500 µm 500 µm
Fig. 9 Microstructure section ofthe low carbon steel-ductile ironjoint at the interface. aMicrostructure of LCS/DI joint atthe weld interface. bMicrostructure of rotating sample.Etched by 2 % nital
950 Int J Adv Manuf Technol (2016) 84:941–955

surrounding these carbides can also transform to martensite atlower temperatures [54].
The phase transformation sequences during the cooling ofthis partially melted zone (PMZ) can be summarised as:
Lþ γ þ G graphiteð Þ→eutectic ledeburite γ þ Fe3Cð Þ→ ledeburite
þmartensiteþ G
The microstructure in different areas of the HAZ (Fig. 10a)also included the irregular and deformed graphite (DG) pre-cipitates and microstructure of pearlite (P) and ferrite (F). Theferrite was mainly presented around the region of graphite
nodules. Ultrafine graphite (UG) particles in white matrixwere also detected. The graphite particles located adjacent tothe bondline were ellipsoidal and oriented along the interface(Fig. 10a).
The microstructures changed significantly with usingoptimised parameters (Fig. 10b). The microstructure showedthat the graphite nodules were only slightly deformed andretained globular morphology in comparison with that of theparent metal. At a friction welding time of 90 s, the formationof pearlite structures was observed near the joining interface(Fig. 13a). This optimal condition removes martensite at theinterface and improves the tensile properties of the weldments.In some areas of the micrograph, the carbide eutectic-ledeburite in the pearlitic matrix were also identified.
The most interesting transformation occurs in the decarbu-rization zone of the DI specimens. The diffusion of carboninto steel favours the partial dissolution of graphite nodulesduring friction welding. According to Mitelea et al. [11], ahigher friction time leads to higher temperature in DI, thuspart of the carbon will be dissolved. The break-up of thespheroids has been observed and thei r renewedspheroidization to obtain less energetic morphologies(Fig. 10b). The formation process of this structure is similarto that observed by the authors [48].
Themetallographic study showed that a diffusion of carbonoccurs from the DI to the LCS. This diffusion causes theformation of a carbon-rich zone at the bond interface and adecarburization zone in the DI close to the bond interface(Fig. 13a). The carbon-rich zone in the LCS-DI joint has atypical ferritic-pearlitic microstructure with carbon contentsthat change gradually along with distance from the interface.Similar phenomenon was also observed by Mitelea et al. [11].
PMZ
HAZ
BM
Fig. 12 Schematic Fe-C binaryphase diagram of cast iron weld
50 µm
Fig. 11 Formation of martensite structure in DI at the weld interface.Etched by 2 % nital
Int J Adv Manuf Technol (2016) 84:941–955 951

Carbon contents can be in excess of 0.8 % near the interface;therefore, proeutectic cementite is formed at the grain bound-aries in contact with the bond interface. The carbon content inthe steel close to the interface can be higher that the solubilitylimit for carbon in austenite at the welding temperature. There-fore, when this occurs, the graphite nodule precipitation isobserved (Fig. 13b) on the proeutectic cementite-austenite in-terfaces. The growth mechanisms of the graphite nodules arecomparable with these proposed by Calvo et al. [55].
3.7 Fractography
The fracture surfaces of the tensile tested specimens werecharacterised using SEM to understand the failure patterns.The scanning electron micrograph of the fracture surface ofthe tensile specimen fabricated using optimum parameters ispresented in Fig. 14. In the micrograph, the two different frac-ture morphologies have been distinguished in the LCS-DIsamples. Microvoid coalescence (MCV) seems to be the dom-inant form of fracture in Fig. 14a. This type of fracture surfacearises because microvoids are initiated at second phase parti-cles during deformation. The dimple pattern around the graph-ite nodules show the deformation of the surrounding ferriteduring the final period of straining up to fracture. Figure 14aalso shows the relatively large cavity size in comparison with
the graphite nodule size. Formation of cavity may be attribut-ed to decohesion at the graphite and surrounding matrix.
The fracture surface of specimen in Fig. 14b showed most-ly ductile dimples with a few cleavage facets. River markingson the facets result from the propagation of the crack on anumber of planes of different levels. Cleavage fracture is alow energy, brittle fracture which propagates along low indexcrystallographic planes [56]. In addition, a microcrack formedat the graphite-matrix interface surrounded the nodule andthen propagated to the matrix can be seen (arrows inFig. 14b). Therefore, the fracture modes revealed plastic de-formation around the graphite nodules and fracture mecha-nism are a mixture of cleavage and a dimple pattern reflectingthe ductile nature of the heat-affected structure because ofwelding. A similar observation was also reported by Askariet al. [57].
3.8 EDS-SEM investigation
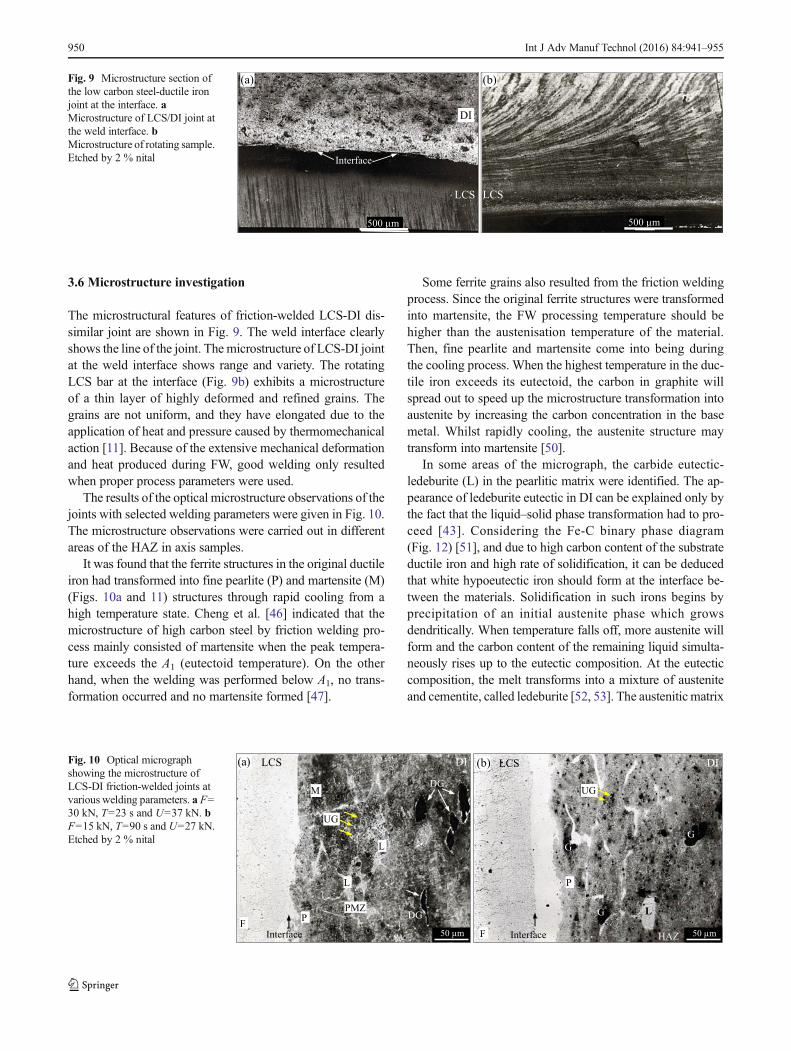
Energy-dispersive X‐ray analysis (EDS) was carried outacross the section of the friction-welded LCS-DI interfaceusing optimum parameters. Figure 15 shows the results ofthe EDS linear analysis of carbon distribution across the inter-face of DI with LCS in the axis of the joined samples.
Analysis of the records clearly indicates a diffusion of car-bon through the interface from DI to LCS. As a result of the
(a) (b)Fig. 14 SEM micrographs of thefracture surface for tensile testspecimen. a Dimple mode offracture; shallow dimples visiblein the central part of themicrograph. b A mixture ofcleavage and a dimple patternmode
(a)
5µm
P
(b)
5 µm
G P
Fig. 13 SEM micrographsshowing the microstructure ofLCS-DI joints closely to theinterface. a Pearlite in thecarburation zone. b Nodulesprecipitated in the rich carbonzone of the steel
952 Int J Adv Manuf Technol (2016) 84:941–955
diffusion, a gradual reduction of carbon concentration in DI isobserved whilst approaching the interface. The diffusionrange of carbon equals 100 μm in the axis of the steel samples.Details regarding the diffusion of carbon to various matrixesof DI have been described in a previous paper [19].
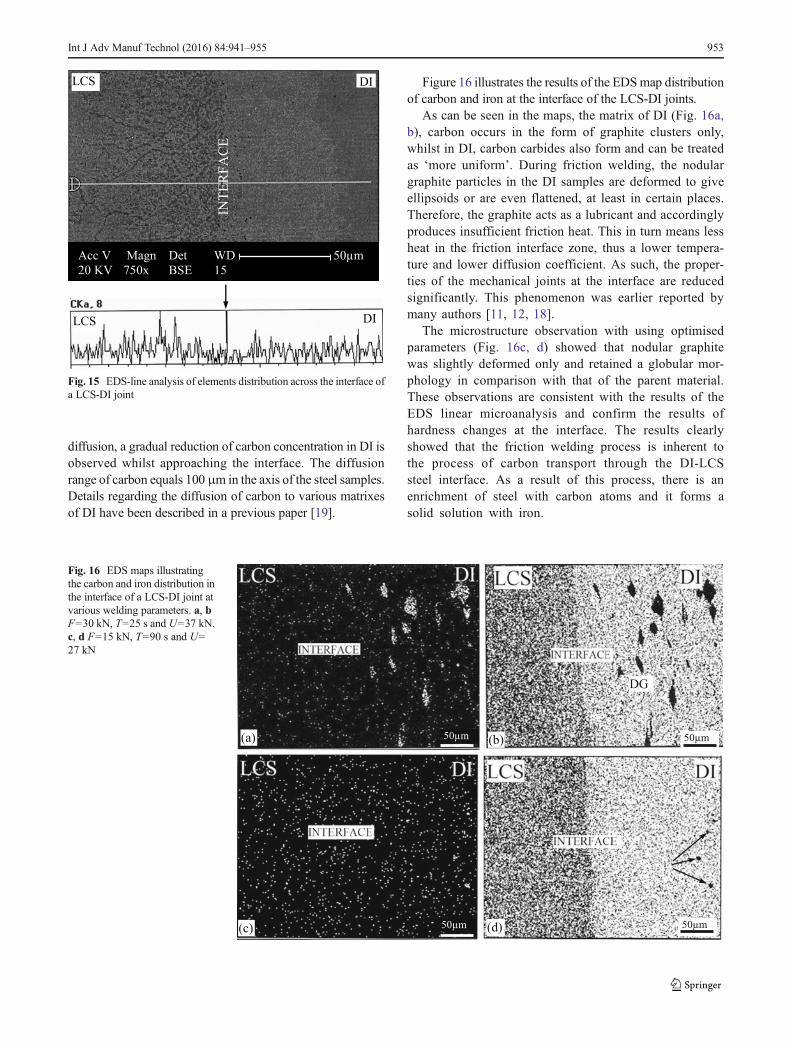
Figure 16 illustrates the results of the EDSmap distributionof carbon and iron at the interface of the LCS-DI joints.
As can be seen in the maps, the matrix of DI (Fig. 16a,b), carbon occurs in the form of graphite clusters only,whilst in DI, carbon carbides also form and can be treatedas ‘more uniform’. During friction welding, the nodulargraphite particles in the DI samples are deformed to giveellipsoids or are even flattened, at least in certain places.Therefore, the graphite acts as a lubricant and accordinglyproduces insufficient friction heat. This in turn means lessheat in the friction interface zone, thus a lower tempera-ture and lower diffusion coefficient. As such, the proper-ties of the mechanical joints at the interface are reducedsignificantly. This phenomenon was earlier reported bymany authors [11, 12, 18].
The microstructure observation with using optimisedparameters (Fig. 16c, d) showed that nodular graphitewas slightly deformed only and retained a globular mor-phology in comparison with that of the parent material.These observations are consistent with the results of theEDS linear microanalysis and confirm the results ofhardness changes at the interface. The results clearlyshowed that the friction welding process is inherent tothe process of carbon transport through the DI-LCSsteel interface. As a result of this process, there is anenrichment of steel with carbon atoms and it forms asolid solution with iron.
(b)
(c) (d)
DG
50µm
50µm
50µm
50µm(a)
Fig. 16 EDS maps illustratingthe carbon and iron distribution inthe interface of a LCS-DI joint atvarious welding parameters. a, bF=30 kN, T=25 s and U=37 kN.c, d F=15 kN, T=90 s and U=27 kN
Acc V Magn Det WD 50µm
20 KV 750x BSE 15
INT
ER
FA
CE
LCS DI
DILCS
Fig. 15 EDS-line analysis of elements distribution across the interface ofa LCS-DI joint
Int J Adv Manuf Technol (2016) 84:941–955 953

4 Conclusions
The following important conclusions are obtained from thisstudy:
1. An empirical relationship was developed to predict theultimate tensile strength of the friction-welded LCS-DIrods incorporating at 95 % confidence level. A maximumtensile strength of 482 MPa could be obtained under thewelding conditions of friction force of 15 kN, upset forceof 27 kN and friction time of 90 s.
2. The plots indicate that the friction time is a strong deter-minant in changing tensile strength followed by upsetforce and friction force. Tensile strength is found to de-crease with an increase in friction time, reaches a mini-mum and then increases rapidly. Upset force has a nega-tive effect on the tensile strength joints. As upset forceincreases, the tensile strength decreases.
3. The metallographic study showed that a diffusion of car-bon occurs from the ductile iron to the low carbon steel.This process causes the formation of a carbon-rich zone atthe interface and decarburization zone in the ductile ironclose to the bond interface. The diffusion of carbon intosteel favours the partial dissolution of graphite nodulesduring friction welding and their renewed spheroidizationto obtain less energetic morphologies.
4. The Vickers hardness of the weld zone increased to 71 %for DI and 44 % for LCS of the base metals, respectively. Thisis a very small variation comparing with the other fusionwelding process.5. The results of the EDS show obviously that the friction
welding process was accompanied by a diffusion of car-bon atoms from ductile iron to steel. This leads to anincrease of carbon concentration in steel.
Acknowledgments The author wishes to thank Professor MieczysławKaczorowski from the Institute of Mechanics and Design of WarsawUniversity of Technology and Stanisław Dymski from the Faculty ofMechanics of Bydgoszcz Technical University for their valuablecontributions.
Open Access This article is distributed under the terms of the CreativeCommons At t r ibut ion 4 .0 In te rna t ional License (h t tp : / /creativecommons.org/licenses/by/4.0/), which permits unrestricted use,distribution, and reproduction in any medium, provided you give appro-priate credit to the original author(s) and the source, provide a link to theCreative Commons license, and indicate if changes were made.
References
1. Davis JR (1996) ASM speciality handbook: cast irons. ASMInternational, Metals Park, OH, USA
2. Handbook W (1991) Welding process, vol 2, 8th-ed. AWS, Miami3. Handbook ASM (1992) Metallography and microstructures, vol 9.
ASM International, Metals Park, OH, USA
4. Handbook ASM (1995) Properties and selection iron and steel, vol1. ASM International, Materials Park, OH, USA
5. Pascual M, Cembrero J, Salas F (2008) Analysis of the weldabilityof ductile iron. Mater Lett 62:1359–1362
6. Klimpel A (1998) The problem of welding cast irons is examinedtaking the example of a spheroidal cast iron. Weld Int 12(1):20–24
7. El-Banna EM (1999) Effect of preheat on welding of ductile castiron. Mater Lett 41:20–26
8. Crossland B (1971) Friction welding. Contemp Phys 12(6):559–574
9. AmericanWelding Society (1989) Specifications and standards. In:Recommended practice for friction welding, AWS, Miami
10. Lebedev VK, Chernenko IA (1992) Welding and surface reviewsfriction welding. Harwood Academic Publishers, Amsterdam
11. Mitelea I, Craciunescu CM, Gugu R (2010) Interfacial behavior ofdissimilar friction welded nodular cast irons with low carbon steels.Mater Sci For 638–642:3757–3762
12. Richter H, Palzkill A (1985) Applicability of test result from min-iature friction welded specimens to full-size specimens as demon-strated by the combination of constructional steel and spheroidalgraphite cast iron. Weld Cutt 37:60–5
13. Dette M, Hirsch J (1990) Reibschweissen von Konstruieren ausKugelgraphitguss mit Stahlteilen. Schw und Schn 11(42):188–190
14. Michiura Y, Maekawa K, Takahara W, Kitagawa M, Horie H(1998) Friction welding of ductile cast iron pipes. Jpn J FoundryEng Soc 70:873–877
15. Shinoda T, Endo S, Kato Y (1999) Friction welding of cast iron andstainless steels. Weld Int 13(2):89–95
16. Ochi H, Kawai G, Morikawa K, Yamamoto Y, Suga Y (2007)Macrostructure and temperature distribution near the weld interfacein friction welding of cast iron. Strength Fract Compl 5:79–88
17. Song Y, Liu Y, Zhu X, Yu S, Zhang Y (2008) Strength distributionat interface of rotary-friction-welded aluminium to nodular castiron. Trans Nonf Met Soc China 18:14–18
18. Winiczenko R, Kaczorowski M (2012) Friction welding of ductilecast iron using interlayers. Mater Des 34:444–451
19. Winiczenko R, Kaczorowski M (2013) Friction welding of ductileiron with stainless steel. J Mater Process Technol 213:453–462
20. Handbook ASM (2010) Metals process simulation, vol 22b. ASMInternational, Materials Park, OH, USA
21. Deb K (1998) Optimization for engineering design. Prentice-Hall,New Delhi
22. Montgomery DC (2009) Design and analysis of experiments, 7-edth edn. Wiley, New York
23. ASTME8M-04 (2010) Standard test methods for tension testing ofmetallic materials. ASTM International
24. Design-Expert Software (2009) Version 8.0 user’s guide25. Murti KG, Sundaresan S (1983) Parameter optimization in friction
welding dissimilar materials. Met Construct 331–33526. Canyurt O (2005) Estimation of welded joint strength using genetic
algorithm approach. Int J of Mech Sci 47:1249–126127. Paventhan R, Lakshminarayanan PR, Balasubramanian V (2011)
Prediction and optimization of friction welding parameters for join-ing aluminium alloy and stainless steel. Trans Nonf Met Soc China21:1480–148
28. Sathiya P (2009) Optimization of friction welding parameters usingevolutionary computational techniques. J Mater Process Technol 5:2576–2584
29. Kumaran SS, Muthukumaran S, Vinodh S (2010) Optimization offriction welding of tube to tube plate using an external tool. StructMultidisc Optim 42(3):449–457
30. Kumaran SS, Muthukumaran S, Vinodh S (2011) Optimization offriction welding of tube-to-tube plate using an external tool byTaguchi method and genetic algorithm. Int J Adv ManufTechnolo 57:167–182
954 Int J Adv Manuf Technol (2016) 84:941–955

31. Dey V, Pratihar DK, Datta GL, JhaMN, Saha TK, Bapat AV (2009)Optimization of bead geometry in electron beam welding using agenetic algorithm. J Mater Process Technol 209:1151–7
32. Padmanaban G, Balasubramanian V (2010) Prediction of tensilestrength and optimization of process parameters for friction stirwelded AZ31B magnesium. Proceed Inst Mech Eng, Part B: J ofEng Manuf 10(224):1519–1528
33. Babu S, Elangovan K, Balasubramanian V, Balasubramanian M(2009) Optimizing friction stir welding parameters to maximizetensile strength of AA2219 aluminum alloy joints. Met Mater Int15:321–330
34. Bilgin MB, Meran C, Canyurt OE (2013) Optimization of strengthof friction welded joints for AISI 430 ferritic stainless steels bygenetic algorithm. Int J Adv Manuf Technolo 73:doi 10.1007/s00170-014-6590-0
35. Elangovan S, Anand K, Prakasan K (2012) Parametric optimizationof ultrasonic metal welding using response surface methodologyand genetic algorithm. Int J Adv Manuf Technolo 63:561–572
36. Winiczenko R, Sałat R, Awtoniuk M (2013) Estimation of tensilestrength of ductile iron friction welded joints using hybrid intelli-gent methods. Trans Nonf Met Soc China 23(2):385–391
37. Udayakumar T, Raja K, Afsal Husain TM, Sathiya P (2014)Prediction and optimization of friction welding parameters for su-per duplex stainless steel (UNS S32760) joints. Mater Des 53:226–235
38. Deb K (2001) Multi-objective optimization using evolutionary al-gorithms. John Wiley and Sons, Ltd., England
39. Gen M, Cheng R (2000) Genetic algorithm and engineering opti-mization. John Wiley & Sons, Inc.
40. Goldberg DE (1989) Genetic algorithm in search, optimization andmachine learning. Addison-Wesley, Reading
41. Ellis CRG (1972) Continuous direct drive friction welding of mildsteel. Weld Res Suppl 4:183–197
42. Kurt A, Uygur I, Paylasan U (2011) Effect of friction weldingparameters on mechanical and microstructural properties of dissim-ilar AISI 1010-ASTM B22 joints. Weld J 90:102–106
43. Winiczenko R, Kaczorowski M (2015) Friction welding of ductileirons. In: Colás R and Totten GE (ed) Encyclopedia of iron, steel,
and their alloys, 1st edn. Francis & Taylor Group, New York(accepted)
44. Sahin M (2009) Joining of stainless-steel and aluminium materialsby friction welding. Int J Adv Manuf Technolo 41:487–497
45. Sahin M (2010) Joining of aluminium and copper materials withfriction welding. Int J Adv Manuf Technol 49:527–534
46. Cheng CP, Lin HM, Lin JC (2010) Friction welding of ductile ironand low carbon steel. Sci Technol Weld Join 15(8):706–711
47. Fujii H, Cuia L, Tsuji N, Maeda M, Nakata K, Nogi K (2006)Friction stir welding of carbon steels. Mater Sci Eng A 429(1–2),15:50–57
48. Nguyen TC, Weckman DC (2006) A thermal and microstructureevolution model of direct-drive friction welding of plain carbonsteel. Metall and Mater Trans B 37(2):275–292
49. Sathiya P, Aravindan S, Noorul Haq A (2007) Effect of frictionwelding parameters on mechanical and metallurgical properties offerritic stainless steel. Int J Adv Manuf Technol 31:1076–1082
50. Chang HT, Wang CJ, Cheng CP (2014) Microstructure feature offriction stir butt-welded ferritic ductile iron. Mater Des 56:572–578
51. Baker H (1990) Alloy phase diagram, vol 3. ASM Handbook,Materials Park, Ohio
52. Shamanian M, Mousavi Abarghouie SMR, Mousavi Pour SR(2010) Effects of surface alloying on microstructure and wear be-havior of ductile iron. Mater Des 31:2760–2766
53. Benyounis KY, FakronOMA, Abboud JH, Olabi AG, HashmiMJS(2005) Surface melting of nodular cast iron by Nd-YAG laser andTIG. J Mater Process Technol 170:127–13220
54. Pouranvar M (2010) On the weldability of grey cast iron usingnickel based filler metal. Mater Des 31(7):3253–3258
55. Calvo FA, Urena A, Gomez de Salzar JM, Molleda F (1989)Diffusion bonding of grey cast iron to Armco iron and a carbonsteel. J Mater Sci 24(11):4152–4159
56. Dieter GE (1986) Mechanical metallurgy. McGraw-Hill Co., NewYork
57. Askari-Paykani M, Shayan M, ShamanianM (2014)Weldability offerritic ductile cast iron using full factorial design of experiment. JIron Steel Res Int 21(2):252–263
Int J Adv Manuf Technol (2016) 84:941–955 955