EFFECT OF FORM AND AMOUNT OF PHOSPHORUS AND … · These ladies have all helped guide me through a...
94
EFFECT OF FORM AND AMOUNT OF PHOSPHORUS AND PHYTASE SUPPLEMENTATION ON PHOSPHORUS UTILIZATION BY RUMINANTS by Rachel Kristina Shanklin Thesis submitted to the Faculty of the Virginia Polytechnic Institute and State University In partial fulfillment of the requirements for the degree of MASTER OF SCIENCE in Animal and Poultry Sciences APPROVED: ___________________________ J.P. Fontenot, Chair ___________________________ ____________________________ J.S. Radcliffe W.S. Swecker ___________________________ M.L. Wahlberg August, 2001 Blacksburg, Virginia
Transcript of EFFECT OF FORM AND AMOUNT OF PHOSPHORUS AND … · These ladies have all helped guide me through a...

EFFECT OF FORM AND AMOUNT OF PHOSPHORUS AND PHYTASESUPPLEMENTATION ON PHOSPHORUS UTILIZATION BY RUMINANTS
by
Rachel Kristina Shanklin
Thesis submitted to the Faculty of the
Virginia Polytechnic Institute and State University
In partial fulfillment of the requirements for the degree of
MASTER OF SCIENCE
in
Animal and Poultry Sciences
APPROVED:
___________________________J.P. Fontenot, Chair
___________________________ ____________________________J.S. Radcliffe W.S. Swecker
___________________________M.L. Wahlberg
August, 2001
Blacksburg, Virginia

ii
EFFECT OF AMOUNT AND FORM OF PHOSPHORUS AND PHYTASESUPPLEMENTATION ON PHOSPHORUS UTILIZATION BY RUMINANTS
by
Rachel Kristina Shanklin
Committee Chair, Joseph P. FontenotAnimal and Poultry Sciences
(ABSTRACT)
The use of animal manures to replace commercial fertilizer has increased the
economic and environmental sustainability of agriculture. However, this practice has
resulted in excess P being applied to the soil in some areas. Excess P may run-off into
surface water and leach in the ground, causing eutrophication. Decreasing the amount of
P fed and improving the utilization of P are two possible nutritional solutions to this
problem. Two experimetns were conducted to investigate the effects of levels of dietary
P, chemical form of P, and phytase supplementation in ruminants. For Exp. 1, 24 steers
(average BW = 229 kg) were allotted to two diets containing 0.12 and 0.19% dietary P
for a 112-d growth trial. The steers were individually full-fed, weighed every 14 d, and
blood samples were collected every 28 d. The steers fed the 0.12% P diet had increased
(P<0.02) ADG during the first 28 d, after which there were no differences. They also had
higher (P<0.05) feed intake. By d 56 serum P for the 0.12% P group was lower
(P<0.01), and this difference continued for the remainder of the trial. For Exp. 2, 18
wether lambs (average BW = 23 kg) were allotted to the following six diets for each of
two metabolism trials: 1) a negative control diet deficient in P, 2) control diet
supplemented with inorganic P, 3) control diet supplemented with phytic acid, 4) control

iii
diet supplemented with phytic acid and phytase, 5) control diet supplemented with
cottonseed meal, and 6) control diet supplemented with cottonseed meal and phytase.
Each metabolism trial was preceded by a 5 wk depletion phase in which the lambs were
fed a low-P diet. The metabolism trials consisted of a 10 d preliminary period followed
by a 10-d collection of feces and urine. On the final day ruminal fluid, blood, and saliva
were collected. At the end of the second metabolism trial 10th rib bones were collected
from each lamb. Absorption of P was lowest (P<0.0001) for the low-P treatment,
compared to the other treatments. There was no treatment effect on saliva P. Ruminal
fluid P was higher (P<0.05) for lambs receiving P supplementation. Within
supplementation treatments, ruminal fluid P was higher (P<0.05) for lambs fed organic P
than for those fed inorganic P. Feeding CSM resulted in higher (P<0.001) ruminal fluid
P than phytic acid. The addition of phytase to the diets with organic P resulted in more
(P<0.04) P in the ruminal fluid. There was a decrease (P<0.003) in serum P associated
with the low-P treatment. There was no difference in bone ash or breaking strength.
Key Words: Phosphorus, Ruminants, Phytase, Organic Phosphorus, Inorganic Phosphorus

iv
Acknowledgements
First and foremost I would like to thank God. Without Him none of the
accomplishments of the past four years would have been possible. I have been truly
blessed by God’s presence and guidance in my life.
To Dr. J. P. Fontenot, my committee chair, I would like to express my deepest
gratitude. He has encouraged me to learn on my own, yet he has always been available
with advice and direction. One of the greatest rewards of my graduate education has
been the opportunity to learn from and work with Dr. Fontenot.
Special gratitude is due to the other members of my committee: Dr. J.S. Radcliffe,
Dr. W.S. Swecker, and Dr. M.L. Wahlberg. Whether I needed advice, encouragement, or
suggestions they were all very helpful.
I would also like to acknowledge Nancy Frank, Gary Bradley, Gene Ball, and
Louisa Gay for their technical assistance. They are a wonderful group of people to work
with.
Sincere appreciation is extended to Dr. Jim Wilson for his instruction and
assistance with measurement of bone strength.
Special appreciation goes to Betty Gray, Mary Jane Thompson, and Ellie
Stephens. These ladies have all helped guide me through a maze of paperwork and
helped me get the right form to the right office on time.
Thanks to my fellow graduate students and friends: Jesse Austin, Rob Burk, Judd
Culver, Jennifer Guay, Shane Horsley, Vanessa Mulkey, Jessica Peura, Katie Poole, Dr.
Sujatha Premaratne, Amy Ordakowski, and Jen Rice. When I needed help with research,

v
studying for tests, or working odd hours in the laboratory I could not have asked for a
finer or more supportive group of friends.
Heartfelt appreciation goes out to my family: Mom, Grandaddy, Steel Gray, Jack,
Johnny, Carroll, and Courtney have all been supportive, encouraging, caring, and patient.
Even when they did not understand what I was doing, they always had confidence in me.
Finally, to my husband Jon, words fall short of expressing how grateful I have
been for his constant faith in me. Jon was the first person to encourage me to do this and
he has continued that support for four years. From the bottom of my heart, thank you and
I love you.

vi
Table of Contents
ABSTRACT……………………………………………………………………………… ii
ACKNOWLEDGEMENTS………………………………………………………………iv
TABLE OF CONTENTS…………………………………………………………………vi
LIST OF TABLES……………………………………………………………………….viii
INTRODUCTION………………………………………………………………………... 1
REVIEW OF LITERATURE……………………………………………………………...4Phosphorus and the Environment………………………………………………… 4Phosphorus Metabolism in Ruminants…………………………………………… 6Phosphorus Deficiency and Requirements in Ruminants………………….……...7Evaluating Phosphorus Status in Ruminants……………………………………..12Phosphorus Availability………………………………………………………….14Phytase Supplementation………………………………………………………...16Ruminal Phytase………………………………………………………………… 18
EXPERIMENT 1 – Growth Trial with Steers…………………………………………... 21OBJECTIVES……………………………………………………………………21EXPERIMENTAL PROCEDURES……………………………………………..21
Animals and Diets………………………………………………………...21Chemical Analysis………………………………………………………. 24Statistical Analysis……………………………………………………….24
RESULTS AND DISCUSSION…………………………………………………25Steer Performance………………………………………………………..25Serum Phosphorus………………………………………………………..31
EXPERIMENT 2 – Metabolism Trial with Lambs……………………………………... 34OBJECTIVES……………………………………………………………………34EXPERIMENTAL PROCEDURES……………………………………………..34
Animals and Diets………………………………………………………..34Metabolism Trials…………..…………………………………………….35Bone Strength…………………………………………………………….39Chemical Analysis………………………………………………………. 39Statistical Analysis……………………………………………………….41
RESULTS AND DISCUSSION…………………………………………………42Depletion Phase…………………………………………………………. 42Chemical Composition…………………………………………………...42Mineral Balance………………………………………………………….42Bone Breaking Strength and Ash Content……………………………….58

vii
Saliva and Ruminal Fluid Phosphorus…………………………………...60Blood Serum Minerals……………………………………………………62Apparent Digestibility……………………………………………………66Ruminal Fluid pH and Volatile Fatty Acids……………………………...68Ruminal Fluid Ammonia Nitrogen and Blood Urea Nitrogen…………...70Nitrogen Balance…………………………………………………………72
GENERAL DISCUSSION……………………………………………………… 75
IMPLICATIONS………………………………………………………………... 79
LITERATURE CITED…………………………………………………………...80
VITA……………………………………………………………………………...85
viii
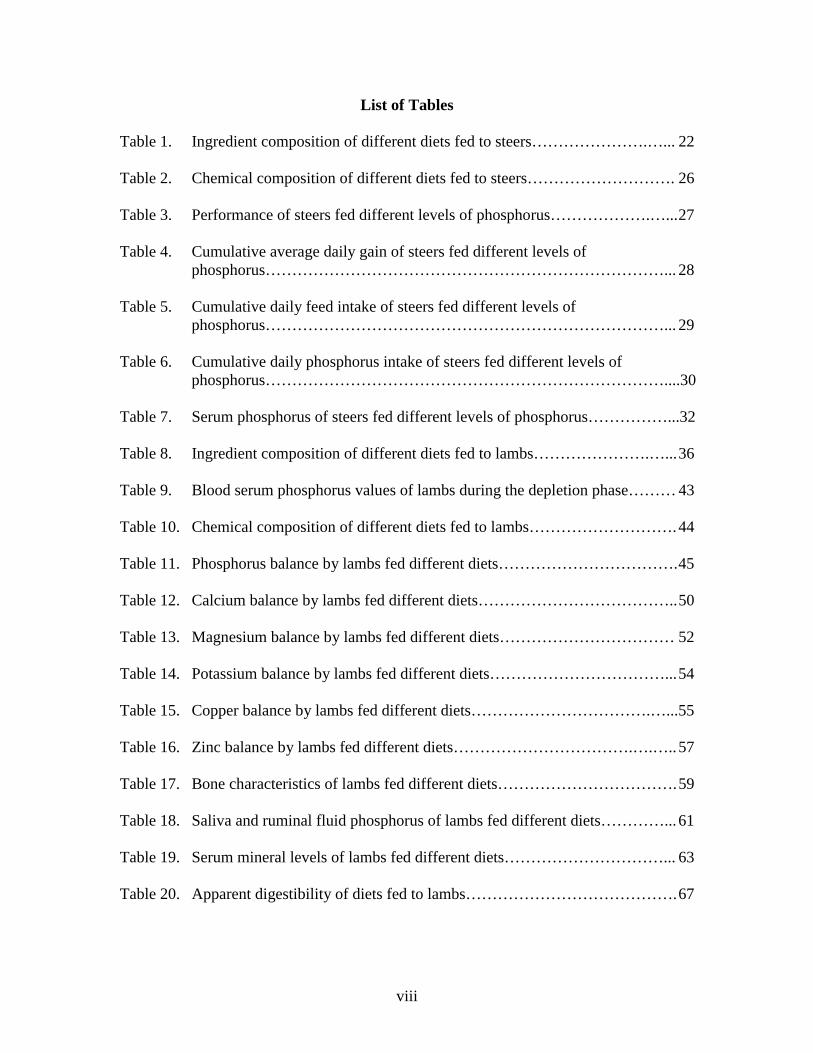
List of Tables
Table 1. Ingredient composition of different diets fed to steers………………….…... 22
Table 2. Chemical composition of different diets fed to steers………………………. 26
Table 3. Performance of steers fed different levels of phosphorus……………….…...27
Table 4. Cumulative average daily gain of steers fed different levels ofphosphorus…………………………………………………………………... 28
Table 5. Cumulative daily feed intake of steers fed different levels ofphosphorus…………………………………………………………………... 29
Table 6. Cumulative daily phosphorus intake of steers fed different levels ofphosphorus…………………………………………………………………....30
Table 7. Serum phosphorus of steers fed different levels of phosphorus……………...32
Table 8. Ingredient composition of different diets fed to lambs………………….…...36
Table 9. Blood serum phosphorus values of lambs during the depletion phase……… 43
Table 10. Chemical composition of different diets fed to lambs……………………….44
Table 11. Phosphorus balance by lambs fed different diets…………………………….45
Table 12. Calcium balance by lambs fed different diets………………………………..50
Table 13. Magnesium balance by lambs fed different diets…………………………… 52
Table 14. Potassium balance by lambs fed different diets……………………………...54
Table 15. Copper balance by lambs fed different diets…………………………….…...55
Table 16. Zinc balance by lambs fed different diets…………………………….….…..57
Table 17. Bone characteristics of lambs fed different diets…………………………….59
Table 18. Saliva and ruminal fluid phosphorus of lambs fed different diets…………...61
Table 19. Serum mineral levels of lambs fed different diets…………………………... 63
Table 20. Apparent digestibility of diets fed to lambs………………………………….67

ix
Table 21. Ruminal fluid pH and ammonia nitrogen and blood urea nitrogen of lambsfed different diets…………………………………………….……………… 69
Table 22. Molar proportions of volatile fatty acids in ruminal fluid oflambs fed different diets………………………………………………….…..71
Table 23. Nitrogen balance by lambs fed different diets……………………….……… 73

1
Introduction
The emphasis of much current agricultural research and recently implemented
agricultural practices has been to improve the sustainability of agriculture. This includes
maintaining the economic viability of agriculture and managing agricultural operations in
an environmentally sound manner. Because there is unavoidable waste associated with
animal agriculture there has been considerable attention focused on the most affordable
and appropriate means of manure disposal. The practice of using manure instead of
commercial fertilizers for crops and pastures was generally accepted as being
economically and environmentally sound. However, the high nutrient content of manure
has presented an environmental concern.
When a nutrient is applied to soil it can either be taken up by plants, volatilized
into the air, or remain in the soil. Soils have a threshold capacity with regards to the
amount of nutrients that can be present. As this threshold is reached, nutrients will run-
off into surface waters or leach into the groundwater system. The presence of nutrients,
specifically C, N, and P, in water leads to an increase in the growth of algae and other
aquatic plants. If this plant growth continues unabated the entire surface area of a body
of water can become covered, thus blocking sunlight from the plants below the surface.
Eventually, these light-deprived plants will die and begin to decompose. Decomposition
removes oxygen from the water and toxic substances may be released into the water.
This process is known as eutrophication, and can result in fish kills and make water
unusable for recreation or consumption.
Phosphorus is one of the nutrients that contribute to this eutrophication. Because
P is an important mineral in many physiological functions, it is provided in livestock

2
diets, and therefore, is present in manure. Recently swine and poultry researchers have
investigated possible nutritional approaches to decrease the fecal excretion of P. Much of
this work has centered on methods of improving the utilization of P in the diet. There has
been little work in ruminant nutrition addressing possible methods of decreasing fecal
excretion of P. One nutritional strategy could be decreasing the amount of P provided in
the diet to a level that would minimize P excretion without compromising animal
performance. A second method could be to improve the utilization of dietary P so that
more remains in the animal to be used for growth and production. The predominant form
of P provided in livestock diets is the organic form of P, phytate. The enzyme phytase is
required to hydrolyze the phytate molecule to make the P available for absorption.
Dietary phytase supplementation to nonruminants improves P utilization and decreases P
excretion.
Not only would decreasing P excreted by ruminants be of benefit to the
environment, but there could be an improvement in animal performance and an economic
advantage to producers. If more P is made available in the animal this could result in
stronger bones, improved rumen function, and an increase in the production of meat and
milk, processes which require P. Producers could benefit economically either through a
reduction in costly P that must be supplemented to the livestock or experience financial
gain associated with the improved animal performance. The economic benefits would be
accompanied by environmental benefits such as improved water and soil quality.
The objectives of these studies were to examine the effects of decreasing dietary P
on animal performance and P utilization in ruminants, and to compare the P utilization by

3
ruminants supplemented with different chemical forms of P, different sources of organic
P, and phytase.

4
Review of Literature
Phosphorus and the Environment
Since the 1960’s agriculture has been recognized as a non-point source of P
pollution (Logan, 1993). Nonpoint sources differ from point sources in that they are
generally not continuous and the pollutant can travel over land, through water, or in the
atmosphere. These factors contribute to the difficulty in quantifying and controlling
nonpoint sources of pollution (Carpenter et al., 1998). According to United States
Environmental Protection Agency (EPA), 50 % of river areas are affected by agricultural
pollution (Parry, 1998). The P that contributes to the pollution of bodies of water
originates from soil erosion and run-off, and waste run-off from livestock operations.
In an effort to recycle nutrients and limit the use of commercial fertilizers, many
agricultural producers have adopted the practice of applying manure to pasture and
cropland. The rates of manure application are typically determined by comparing the N
content of the manure and the N requirement of the crop to be grown. Because livestock
manure is relatively rich in P when compared to the N content of the manure, relative to
plant requirements, excess P is often applied to the soil (Van Horn et al., 1996). As the
P-rich manure is continually applied and only a limited amount is removed by crops, P
accumulates in the soil (Mozafffari and Sims, 1994). Once a threshold level is reached, P
moves into the groundwater or flow into the surface water (Tamminga, 1996). This is
especially a problem in Virginia due to the proximity of many agricultural lands to the
Chesapeake Bay (Daniel et al., 1998). An overabundance of nutrients including C, N,
and P can lead to the eutrophication of water bodies (Carpenter et al., 1998).
Eutrophication is a result of a sharp increase in the growth of aquatic plants, which
5
eventually die and decompose. This decomposition consumes much of the oxygen
present in the water (Sharpley et al., 2000). As the level of available oxygen declines,
drinking and recreational waters become unusable due to fish kills, foul odors,
unpalatability, and the potential release of toxins (Sharpley and Rekolainen, 1997).
Studies have been conducted examining the effects of agricultural practices on
soil P content and movement. Meek et al. (1982) performed an 8-yr experiment in
California where they looked at varying rates of manure application for either 1, 2, 3 or 4
yr. All land areas were planted with the same crop each year, either sorghum, barley,
cotton, or lettuce. Soil samples were taken at the 0 to 30 cm and the 30 to 60 cm depth,
and analyzed for N, P, K, and Na content. With respect to P, land areas that received
only one manure application had twice the available P at the 0 to 30 cm depth 8 yr later,
when compared to land areas that had no manure application. Increasing rates of manure
application resulted in an increase in P as deep as 60 cm.
The effects of manure application to soil have been further elucidated by work
conducted by Mozaffari and Sims (1994). This research took place along the Atlantic
Coastal Plain region of Delaware that has a large number of poultry producers. One of
the objectives of that study was to evaluate the ability of the soil to absorb P at the
surface and subsoil after long-term manure application. The soils used had been treated
with poultry waste and had high soil test P values. The results of these studies indicate a
strong correlation between clay content of the soil and the capacity to absorb P (r = 0.90).
Additionally, the researchers found that when comparing similar soil types, samples from
field border areas had greater P absorption capacity than cultivated areas. The cultivated
areas were the locations of the manure application and the elevated soil test P values.

6
This indicates that the decline in the ability of the soil to hold additional P could be a
direct result of manure application.
Phosphorus Metabolism in Ruminants
Eighty percent of the P present in the ruminant is in skeletal tissue. The
remaining 20% of the body P is actively utilized in energy metabolism and structure, as a
digestive buffer, a component in genetic material, and for the maintenance of the ruminal
microorganisms (Breves and Schröder, 1991; NRC, 1996). The maintenance requirement
of P for beef cattle is 16 mg/kg of BW (NRC, 1996) and 36 mg/kg of BW for sheep
(NRC, 1985). Under conditions of production such as growth, reproduction, and
lactation the requirement increases. Some examples of the increased P requirements of
cattle above maintenance associated with production are 3.9 g P/100 g protein gain, 7.6 g
P/kg fetal weight, and 0.95 g P/kg milk (NRC, 1996). Because of the critical function of
P in the body it is important that P homeostasis is maintained. This homeostasis involves
bone resorption, salivary secretion, intestinal absorption, and urinary excretion (Challa et
al., 1989).
In a metabolism study using ruminally and duodenally cannulated sheep, Scott et
al. (1985) demonstrated the effect of increasing P intake on salivary secretion, absorption,
and excretion of P. The results of this work show that an increase in P intake leads to an
increase in the flow of P at the duodenum and an increase in P absorption. The
researchers also reported that for each 1g increase in P intake, there was an average
increase in fecal P excretion of 0.75 g, an increase in endogenous fecal excretion of
0.41g, and an increase in salivary P secretion of 0.54g. These figures indicate that as P
intake increases the efficiency of P absorption decreases.

7
Challa et al. (1989) reported on three metabolism studies in which different levels
of P were provided to growing calves. In the first two studies the basal diet was deficient
in P and additional P supplementation meeting the P requirement for maintenance was
provided either in the diet or through abomasal infusion. The basal diet for the third
metabolism study met the P requirement for growth and additional P was provided
through venous infusion. The researcher found a strong correlation (r = 0.96) between
quantity of P supply and P absorption when the basal diet was supplemented with
additional P or when P was infused abomasally. This relationship was true up to an
absorptive efficiency of about 85%, then the efficiency of absorption declined with
increasing P supplementation. The decrease in P absorptive efficiency occurred when the
supplemental P exceeded the requirement. As the rate of P absorption increased, there
was also an increase in serum P (r = 0.91). Saliva P values in this study were calculated,
based on the difference between P flow at the reticulum and dietary P intake. According
to these calculations, saliva P increased in relation to the increase in serum P (r = 0.85).
Based on these findings, the authors speculated that saliva P secretion is related to the
concentration of P in the serum. Excess P supplementation resulted in an increase in
urinary P. Endogenous P loss in the feces was found to be highly correlated with P intake
(r = 0.92). Through mathematical calculations, Challa et al. (1989) estimated that if P
intake was zero, the fecal excretion of P would be approximately 8.60 ± 0.93 mg•d-1•kg-1
BW.
Phosphorus Deficiency and Requirements in Ruminants
Clinical signs of P deficiency in ruminants have been documented since 1928
when work by Theiler et al. was reported. This research used a 200 head cow herd

8
grazing a P deficient pasture in South Africa. One half of the cows in the study were in
the control group and only grazed the P-deficient pasture. The remaining cows grazed
the P deficient pastures, but were supplemented with bone meal. In the first year of the
study 30% of the control cows died as a result of botulism or poisoning compared to 4%
of the cows receiving the supplement. Five percent of the control group died of
malnutrition while none of the cows from the supplemented group died of malnutrition.
There was also a treatment effect on reproduction in the first year. Eighty percent of the
supplemented cows calved, compared to 51% for the control group. Additionally, the
effect of P supplementation extended to the calves born to the cows in the study. At 15
mo of age the calves born to the cows receiving the bone meal were almost twice the
weight of the calves born to the control cows. From this brief study the signs of P
deficiency in ruminants were listed as depraved appetite, inappetance, a decrease in
reproductive efficiency, depressed performance, and death.
A 10- yr, three phase study of beef cows with varying levels of P intake showed
the response to different P levels over an extended period and at different stages of
production (Call et al., 1986). In Phase I two groups of Hereford heifers were compared
for 4 yr, from weaning until about 5 mo into the fourth gestation. The two levels of P
were 0.12% to 0.16% and 0.40% to 0.57% (6.0 to 12.1 and 20.6 to 38.1 g P/d,
respectively). For beef cows in this stage of production, the P levels did not significantly
affect weight gain, feed intake, onset of puberty, conception rates or calves born. For
Phase II, one half of the cows from each of the two Phase I diets were reassigned to a
dietary P level of 0.09% to 0.11% (5.1 to 6.6 g P/d). The rest of the cows remained on
the same diet fed in Phase I. At the lower P concentration there were obvious clinical

9
signs associated with P deficiency. Three cows died and the remainder of the animals on
this diet showed less severe signs. These signs included inappetance, emaciation,
lameness, and reproductive failure. Cows on all three diets exhibited depraved appetite,
with a tendency for the cows on the lowest P diet to show this more frequently. In Phase
III cows that had been on the 0.09% to 0.11% P level in Phase II were reassigned to their
Phase I groups. The low P diet for Phase III contained 0.15% to 0.21% P (11.7 to 14.1 g
P/d), and the high P diet contained 0.22% to 0.32% P (17.1 to 20.5 g P/d). An increase in
P intake resulted in an increase in feed consumption and a reduction in the other
deficiency signs. Later data from this same study showed a significant decrease in body
condition scores, a decrease in whole blood P, hypocalcemia, and osteomalacia for cows
on the low P diet (Shupe et al., 1988).
Wise et al. (1958) reported results from two experiments to determine the P
requirement of growing calves less than 1 yr of age. In each experiment 20 Holstein bull
calves were allotted to four experimental diets that varied in P concentration.
Semipurifed diets for Exp. 1 contained 0.09 %, 0.12 %, 0.18 %, and 0.30 % P. In Exp. 2
the basal diet contained 0.10 % P, and dicalcium phosphate was added to the basal diet to
provide P concentrations of 0.14 %, 0.22 %, 0.30 %, and 0.38 % P. In Exp. 1 gains and
feed efficiency improved as the P concentration of the diet increased. Based on the
results of the first experiment the authors concluded that 0.09 %, 0.12 %, and 0.18 %
dietary P are all below the requirement of growing calves. In Exp. 2 the calves receiving
the 0.14 % P diet gained less weight and were less efficient than those receiving the three
diets with higher P concentrations. There were no significant differences in the
performance among calves fed 0.22, 0.30, or 0.38 % P. There was an increase in serum P

10
in response to increasing dietary P. In Exp. 1 the serum P of calves receiving 0.09 % and
0.12 % P were about 4 mg/dL, and 6 mg/dL for calves fed the two diets with higher P.
The serum P values from Exp. 2 increased with increasing dietary P from 0.14 % to 0.22
%. The bone data from Exp. 1 showed a difference in the growth of the femur between
calves receiving the 0.09 % and 0.12 % P diets and those receiving the 0.18 % P diet.
The calves fed the 0.14 % P diet in Exp. 2 had less bone growth than the calves receiving
the three diets with greater percent P. The combined results of these two experiments led
the authors to concluded that there is no benefit in feeding diets with greater than 0.22 %
P to growing calves.
Miller et al. (1987) indicated that the dietary P requirement might be higher than
values reported by Wise et al. (1958). In a growth study with 63 Holstein bull calves in a
feeding study in Georgia seven experimental diets were fed utilizing four levels of dietary
P and two sources of supplemental P. The basal diet contained 0.08% P, and the
supplemented diets contained 0.14, 0.20, or 0.32 % P. The sources of P supplementation
were two commercial sources of dicalcium phosphate. For all measurements of P status
of the calves the authors reported no differences between the sources of P
supplementation. Average daily gain and daily feed intake increased linearly with
increasing P intake. The feed to gain ratio decreased as P intake increased, but at a
decreasing rate. Blood analysis showed that serum inorganic P increased as P intake
increased with a correlation coefficient of r = 0.76. Percent ash of the tibia joint also
increased as P intake. Because the performance measurements and indicators of P status
of the calves continued to increase as P intake increased, the authors concluded that the P
requirement for growth of these young bull calves was 0.32 %.
11
While there are definitive signs of P deficiency in ruminants, recent work has
provoked speculation that the actual P requirement may be lower than current
recommendations. Erickson et al. (1999) conducted a study on the feedlot performance
and subsequent bone and carcass characteristics of finishing beef steers. The steers in
that study were individually fed experimental diets containing 0.14, 0.19, 0.24, 0.29, or
0.34% P for 105 d. The ADG across treatment groups was 1.67 kg and there was no
difference between treatments. There was also no difference in DMI or feed efficiency.
Based on the concentration of P in the experimental diets and the DMI, the P intake for
the steers on the five treatments were 15.9, 19.7, 27.6, 32.1, and 36.4 g/d. Level of
dietary P did not affect bone strength, suggesting that there was no mobilization of
mineral from bone. There was no effect of dietary P intake on carcass maturity, but a
cubic effect was seen with the marbling scores. Thus, there was no effect on finishing
steer performance when dietary P was 30% below the NRC requirement.
A 5 yr study with grazing brood cows was conducted in New Mexico in which P
supplementation was evaluated (Judkins et al., 1985). The researchers measured calving
interval, weaning weight, suckling gain, and percent calf crop to assess performance.
Phosphorus status of the cows was estimated using measurements of P in feces, saliva,
and rib bone biopsies. For 1 yr of the study the control cows had a longer calving
interval and weaned lighter calves than the supplemented cows. They suggested,
however, that these differences could have been the result of the combined effect of low
P and drought during that yr. For all other years there was no difference in performance.
Fecal P reflected P intake, but due to a high standard error there was no consistent effect
of P intake on salivary P. The bones from the P supplemented cows were higher in P,
12
compared to the control cows during lactation, but there was no difference in these values
during the non-lactating period. These results indicate that lack of P supplementation
alone does not cause a depression in performance, but signs of P deficiency may become
evident when combined with situations such as drought.
Field et al. (1975) reported research on the simple and combined effects of Ca and
P deficiencies. They used growing Blackface lambs and provided purified diets that were
nutritionally complete except for the specified deficiencies. The experimental diets were
low Ca with low P, normal Ca with low P, normal P with low Ca, and normal P with
normal Ca. Low Ca and low P were defined as 0.17 and 0.13%, respectively. The
normal level for both minerals was 0.3%. These diets were fed for 16 wk and then the
lambs were slaughtered. Measurements were made for feed intake, serum minerals,
performance, and body composition. The lambs were also examined for health and
condition after 9, 11, 13, and 16 wk. The lambs fed the simple P deficient diet showed a
significant decrease in feed intake and final live weights, compared to the lambs on the
other three treatments. The researchers also reported lower apparent DM digestibility of
the simple P deficient diet (57.7%) compared to the other diets (61.2%), indicating the
possibility of insufficient P in the ruminal fluid to support the microorganism activity.
The P deficient diet was also associated with a decrease in bone size, based on analysis of
the tibia and lumbar vertebra.
Evaluating Phosphorus Status in Ruminants
In conjunction with research of P in ruminant nutrition, various methods of
assessing the P status of ruminants have been examined. Obvious clinical signs such as

13
pica, depressed appetite, and decreased performance are observed with severe dietary P
deficiency.
Cohen (1973) conducted a grazing study in New South Wales, Australia for 12
mo to compare the usefulness of blood, hair, and bone as indicators of P status, based on
the sensitivity of these measurements to the changing P of the pasture. Fifteen yearling
steers grazed the pasture, and pasture samples were collected every 3 mo and analyzed
for P content. No relationship was detected between the pasture P content, which
changed between sampling times, and the P content of hair that did not vary. There was
variation between sampling times for the inorganic serum P, but the changes were not
correlated with the P of the pastures. The P content of the bone samples collected using a
biopsy technique increased during periods of active pasture growth. The bone P values
were correlated with the P content of the pastures (r = 0.97). While the bone P values do
appear to be the most reliable indicator of P status of an animal, because of the variation
of the bone P between animals, the author cautioned against using bone P to estimate P
intake of grazing animals.
Two reports of the results of a grazing study in South Africa (Read et al., 1986a
and Read et al., 1986b) compared the use of blood samples, fecal grab samples, and rib
bone biopsies as indicators of P status. Over four calving periods brood cows were
provided three levels of dietary P, deficient, adequate, and excess. The findings related to
the serum inorganic P supported previous reports that serum P accurately differentiates
between recent P intake. Since there was no difference between the two groups of cows
receiving P supplementation there was no indication of P stores in the body. Values of
fecal P generally correctly ranked the cows according to P intake, but this was not always
14
consistent. There were times when there were no differences in fecal P concentration,
although there was a definite difference in P intake. The authors speculated that this
discrepancy was due to the fact that fecal P was based on grab samples, hence, there was
no quantification of total fecal output. For cows receiving the P deficient and adequate P
treatments there was a flux in bone P during stages of pregnancy and lactation. Because
the cows receiving excess P had constant bone P, the authors concluded that these
animals had sufficient P intake, thus, it was not necessary to mobilize the stored P. The
P-deficient cows also had lower total ash content and decreased bone specific gravity,
compared to the two groups of cows receiving P supplementation.
Phosphorus Availability
The P requirements of livestock are calculated based in part on the availability of
P from feeds and supplements (NRC, 1985, 1996). Phosphorus availability is based on
the chemical form of P in the feed and various animal factors such as age, stage of
production, and overall level of nutrition (Axe, 1998). For ruminants, the NRC (1985,
1996) estimates P availability to be 68%.
Most livestock diets are derived from plant-based feedstuffs. These types of feeds
contain the organic form of P known as phytate (Tillman and Brethour, 1958). Before P
from phytate can be absorbed by the small intestines the phytate molecule must be
hydrolyzed by the enzyme phytase (Clark et al., 1986). Because phytase is produced by
the ruminal microorganisms the general assumption is that there is no difference in the
availability of different forms of P to ruminants (Clark et al., 1986). However, there
have been discrepancies in the literature based on the utilization of different forms of P
by ruminants.

15
In 1958, Tillman and Brethour reported results from a metabolism trial with sheep
comparing inorganic P supplementation (calcium phosphate) to organic P
supplementation (calcium phytate). There were no differences in P digestibility,
retention, or excretion between the forms of P. According to the results of that study, the
P from calcium phytate was 90% as digestible as the P from calcium phosphate. It was
also found that for that study 92% of the organic P was hydrolyzed in the rumen and
made available for absorption.
In 1967 Dutton and Fontenot examined the effect of organic P on Mg metabolism.
This was a mineral balance trial using wethers fed four experimental diets: low Mg plus
inorganic P, high Mg plus inorganic P, low Mg plus organic P, and high Mg plus organic
P. Lambs receiving the low Mg diets had an intake of 0.89 g Mg/d, and those fed the
high Mg diets had an intake of 1.82 g Mg/d. The P intakes for the inorganic P and
organic P diets were similar, 3.15 and 3.06 g/d, respectively. Within levels of dietary
Mg, there was no difference in P absorption. There was a decrease in P retention
associated with the organic P. The average P retention, as a percent of intake, was
15.76% for the inorganic P and 8.75% for the organic P. In that study the sources of P
were monosodium phosphate (inorganic) and a purified phytic acid solution (organic).
In a digestion study Clark et al. (1986) examined the effect of different Ca sources
and amounts on phytate utilization by lactating Holstein cows. The diets were comprised
of 50% corn grain and 50% corn silage. These grain-silage diets were supplemented with
either aragonite, calcite flour, or albacar to provide either 0.6 or 0.9% Ca. The average P
intake study was 0.63% with 33.4% of the dietary P being in the form of phytate. Based
on the fecal excretion of phytate, the apparent digestibility of phytate was estimated to be

16
about 98%. This digestibility values is an average across Ca treatments as there was no
effect of Ca amount or source on phytate utilization.
Phytase Supplementation
Unlike ruminants, nunruminants have a limited ability for phytase production in
the digestive tract. In an effort to decrease P excretion, improve P utilization, and
possibly decrease the need for P supplementation, research has been done to evaluate the
effect of phytase supplementation to the diets of swine and poultry.
A 5 wk feeding trial was conducted with weaned pigs to determine the effects of
supplemental phytase to soybean meal-based diets (Yi et al., 1996). The 10 experimental
diets had either 0.05 or 0.16% available P and phytase was supplemented at 0, 350, 700,
1050, or 1400 units of phytase / kg of diet. Individual pig weights and feed intake by pen
were used to estimate performance. Feed and fecal samples were taken and analyzed to
calculate apparent absorption of P, Ca, and N. At the end of 5 wk, the barrows in this
study were killed for the collection of bones to determine shear force and ash content.
Supplemental phytase resulted in a linear improvement of ADG, ADFI, and feed
conversion for the pigs receiving 0.16% available P. Phosphorus absorption increased
and fecal excretion of P decreased with the addition of phytase. Increases in shear force
and ash content for the metacarpals and 10th rib bones were reported for phytase
supplemented pigs. Based on these results, the authors calculated that 676 units of
phytase per kilogram of diet would replace 1 g of inorganic P.
In two studies the potential of providing supplemental phytase to corn-soybean
meal based diets of pigs in the growing – finishing phase was investigated (Harper et al.,
1997). The results from this study were similar to the earlier study with weaned pigs.

17
The addition of 250 to 500 units of phytase per kilogram of diet improved daily gain and
feed intake during both the grower and finisher phases, compared to the low P diet.
There was also a linear improvement in feed conversion during the grower phase
associated with phytase supplementation. Phosphorus digestibility was improved with
phytase supplementation. Calculated estimates for the fecal excretion of P suggested a
27% reduction during the grower phase and 15% reduction during the finishing phase.
Bone characteristics of shear force, shear energy, and ash content improved linearly with
phytase supplementation.
In addition to interfering with P utilization, phytate can form salts with other
minerals such as Ca, Cu and Zn (Morris, 1986). These salt complexes decrease the
availability of these minerals. Lei et al. (1993) investigated the bioavailability of Zn in a
phytase supplemented diet fed to weanling pigs. The basal diet in this study was corn-
soybean meal and the experimental diets contained two levels of zinc sulfate (30 or 60
mg Zn/kg diet) with and without 1350 units of phytase per kilogram of diet. The first
phase of this study included measurements of performance and plasma mineral levels,
and the second phase was a mineral balance trial. There were improvements in daily
gain, feed intake, and feed conversion associated with phytase supplementation. This
effect was not seen with the Zn supplementation. Zinc supplementation and phytase
supplementation each resulted in an increase in the plasma concentration of Zn, but there
was not a combined effect of Zn and phytase supplementation. In the mineral balance
trial, there was no effect of Zn or phytase supplementation on Zn balance. There was a
reduction in the fecal excretion of P and Ca and an improvement in the retention of these
minerals with phytase supplementation.

18
In a poultry nutrition study Sebastian et al. (1996) explored the effect of phytase
supplementation on the utilization of Ca, Cu, P, and Zn by broilers fed corn-soybean
meal based diets. This was a 3 wk feeding trial that examined performance, retention of
Ca, Cu, P, and Zn, and the concentration of these minerals in the blood and bone. The
experimental diets were the corn-soybean meal diet with normal P, a low phosphate corn-
soybean meal diet, and a low phosphate corn-soybean meal diet with 600 phytase units /
kg diet. At the end of the 3 wk study there was an increase in feed intake and BW for the
low P diet supplemented with phytase compared to the low P diet. The low P plus
phytase diet also resulted in an improvement in Ca, Cu, P, and Zn retention in the male
birds and an improvement in Zn retention in the females. For both males and females,
phytase supplementation resulted in an increase in plasma concentration of Ca and P, but
no effect on Cu and Zn in the plasma. Total ash content of the bones was increased with
dietary phytase but there was no consistent effect on specific mineral concentrations in
the bones associated with phytase supplementation.
Ruminal Phytase
Punj et al. (1969) conducted an in vitro study to determine the availability of
phytin P from some basic cattle feeds including wheat bran, corn, barley, oats, bajra,
cottonseed cake, peanut cake, mustard cake, and gram. Based on the determination of
phytin availability, the researchers assumed the extent of phytase activity in the rumen.
Total P and phytin P were determined for each feed sample. The phytin P of the analyzed
feeds ranged from 40 to 95 % of the total P content. Rate of hydrolysis of phytin was
determined based on fermentation periods of 6, 12, 24, and 36 h. For all feeds there was
limited hydrolysis of phytin by 6 h of fermentation. The percent of phytin hydrolyzed
19
increased dramatically between the 6 and 12 h fermentation times, ranging from 58.4 to
72.2 %. The phytin hydrolysis continued at a slower rate, and by 36 h hydrolysis
averaged 95.5 %. Based on the amount of phytin that was hydrolyzed during this in vitro
study the researchers assumed a high level of phytase activity in the rumen.
Due to the development of microbiological techniques, later work verified the
production of phytase by ruminal bacteria and more thoroughly characterized the
bacteria-derived enzyme. Yanke et al. (1998) used three cannulated steers to determine
the phytase activity of the different components of ruminal fluid. The steers were fed
three different diets: 90 % barley grain plus 10 % hay, 55 % barley grain plus 45 % hay,
and 100 % hay. The highest phytase activity was in the supernatant and bacterial
fractions of the ruminal fluid. The ruminal fluid from the steers receiving the high grain
diet had the highest phytase activity. The all hay diet resulted in the lowest phytase
activity, and the phytase activity of the ruminal fluid from the steer fed the 90 % grain
plus 10 % hay diet was highest. Also in this study, 334 bacterial strains were studied to
determine the presence and relative amount of phytase activity. Of the 101 pure rumen
bacteria cultures, only Prevotella ruminicola, Ruminobacter amylophilus, Selenomonas
ruminantium, and Steptococcus bovis exhibited phytase activity during the plate
screening. Based on the quantification of the phytase activity, the greatest activity of the
enzyme was associated with the Selenomonas ruminatium bacteria. There was also a
limited measurable amount of phytase activity for the Prevotella ruminicola strains.
While the plate screening indicated phytase activity for Ruminobacter amylophilus and
Steptococcus bovis, there was no measurable activity based on the quantification analysis.

20
In subsequent work Yanke et al. (1999) attempted to characterize the development
of phytase activity and the influence of environmental changes on the phytase activity of
Selenomonas ruminatium. Based on the growth curve of Selenomonas ruminatium, the
initiation of phytase activity by these bacteria seemed to occur late in the growth period.
The expression of the enzymatic activity is, however, independent of the presence of
phytate or inorganic P. This is in contrast to the phytase activity from other sources,
which can be stimulated or depressed by the presence or absence of phytate or phosphate.
The mass of this phytase, determined by zymogram analysis, was approximately 46 kDa.
This is similar to the mass of other bacterial phytases, but very different from the mass of
fungal phytases. The optimal temperature for this phytase activity was 55° C, and the pH
optimal range was between 4.0 and 5.5.

21
Experiment 1 – Growth Trial with Steers
Objectives
The objective of this experiment was to evaluate the effects different dietary
levels of P on daily feed intake, average daily gain, gain to feed ratio, and serum P levels.
Experimental ProceduresAnimals and Diets
Twenty-four black white-faced crossbred steers (228 kg) were purchased from a
feeder cattle sale in Dublin, VA and brought to the Smithfield Unit in Blacksburg, VA for
a 112 d growth trial. The animals were blocked by BW and were randomly allotted to
individual feeding stalls within blocks. Also, within block, steers were randomly allotted
to two diets: 1) 0.12% and 2) 0.19% P.
Both of the experimental diets were formulated to contain 9.80 % CP, 55.00%
TDN, and 0.36% Ca. The TDN was calculated for each ingredient based on the analyzed
values of ADF and CP content. The diets consisted of barley straw, corn sugar, corn, wet
sugarcane molasses, urea, limestone, trace mineralized (TM) salt, and Vitamin A from
December 15, 1999, until February 1, 2000. From February 2, 2000, until the end of the
trial on April 5, 2000, due to a shortage of barley straw, it was replaced with wheat straw.
The diets were reformulated based on the chemical analysis of the wheat straw.
Ingredient composition of the diets is given in Table 1.
Each experimental diet was mixed according to the ingredient composition in
Table 1 in 226.8 kg batches in a Davis (H.C Davis Sons MFG, Co., Inc., Bonner Springs,

22
Table 1. Ingredient composition of different diets fed to steersa
Phosphorus level of diets, %b
Date Ingredient 0.12 0.19
12/15/99 – 2/1/00 Barley straw, % 59.9 60.3
Molasses, % 5.0 5.0
Cerulose, % 20.4 8.2
Corn, % 11.9 24.0
Urea, % 1.9 1.6
Limestone, % 0.4 0.4
TM salt, % 0.5 0.5
Vitamin Ac
2/2/00 – 4/5/00 Wheat straw, % 59.9 60.5
Molasses, % 5.0 5.0
Cerulose, % 15.4 0.0
Corn, % 16.9 32.2
Urea, % 1.9 1.5
Limestone, % 0.4 0.4
TM salt, % 0.5 0.5
Vitamin Ac aDM basisbCalculated, DM basisc2222 IU/kg

23
Kansas) mixer for 15 min. Included in the 226.8 kg batch was a 4.54 kg premix of
limestone, TM salt, and Vitamin A. The TM salt contained, 0.7 ppm Co, 3.5 ppm Cu,
17.5 ppm Fe, 0.7 ppm I, 28 ppm Mn, and 35 ppm Zn, as fed basis. Premixes were mixed
for 10 min in a 13.6 kg capacity Hobart (H600 model, The Hobart Manufacturing Co.,
Troy, Ohio) mixer. Individual ingredients were sampled before being added to the Davis
mixer. At completion of mixing of the diets, each batch was sampled as it was being
bagged. Samples were stored in plastic bags for analysis.
The steers were trained to enter their respective stalls where they were fed once
per day at 1500 h. Steers remained in the stalls overnight and at 0700 h they were moved
into an adjoining pen where they had access to water. From December 1, 1999 to
December 14, 1999, the steers were fed 4.54 kg/d of a high-roughage mix, consisting of
40.5% ground corn, 50.4% grass hay, 3.5% soybean meal, 5.0% wet sugarcane molasses,
and 0.6% trace mineralized salt. On December 15, 1999, the steers were started on a 5-d
transition to experimental diets. The experimental diets were increased by 25 % each
day. During the trial, refusals were weighed and recorded each morning after the animals
were placed in the group pen. If an individual animal left no refusals for 4 d, the amount
of feed provided was increased by 0.45kg. If an animal refused more than 0.91 kg during
2 d, the amount fed was decreased by 0.45 kg at the next feeding.
The steers were weighed initially and every 14 d therafter at 0715 h. Blood
samples were taken every 28 d at 0830 h. Body weights and feed intake data were
recorded to calculate ADG and feed efficiency. The blood samples were centrifuged at
600 x g for 15 min and serum was frozen in plastic tubes for eventual chemical analysis.

24
Chemical Analysis
Individual ingredients and mixed feed samples were ground in a Wiley mill
(Thomas Wiley, Laboratory Mill Model 4, Arthur H. Thomas Co. Philadelphia, PA) to
pass through a 1-mm screen. The ground samples were analyzed for DM, ash, Kjeldahl
N (AOAC, 1990), NDF (Van Soest and Wine, 1967) and ADF (Van Soest, 1963). For
Ca and P analyses, the samples were wet ashed in a 2:1 (vol:vol) solution of HNO3 and
HClO4 (Muchovej et al., 1986). Calcium was determined with an atomic absorption
Spectrophotometer (Perkin Elmer 5100 PC, Norwalk, CT). Phosphorus was determined
according to the colorimetric procedure of Fiske and Subbarow (1925) using the
Spectronic 21D® (Milton Roy, Rochester, NY). Serum samples were analyzed for P by
a colorimetric reaction with a molybdate reagent using the automated Beckman CX5
Chemistry Analyzer (Beckman SYNCHRON CX® SYSTEMS, Beckman Instruments,
Inc., Brea, CA).
Statistical Analysis
Data were analyzed using the GLM procedure of SAS (1989) for analysis of
variance as a randomized block design.

25
Results and Discussion
The diets contained 0.15 and 0.19 % P for the 0.12 and 0.19 % P diets,
respectively (Table 2). The diets were similar in concentration of other nutrients
analyzed.
Steer Performance
Overall performance data are presented in Table 3. There was no difference in
the initial or final weights for the two groups of cattle. Average daily gain did not differ
between the two groups, although both groups gained less than the 0.7 kg•hd-1•d-1 that
was projected. For the first 28 d of the growth trial both groups were gaining at or above
the projected level (Table 4). Also at that time, the steers fed the 0.12% P diet gained at a
faster rate than the steers fed the 0.19% P diet (P<0.02). After the 28 d, there was no
treatment effect on ADG and both groups experienced a decline in the rate of gain as the
trial progressed.
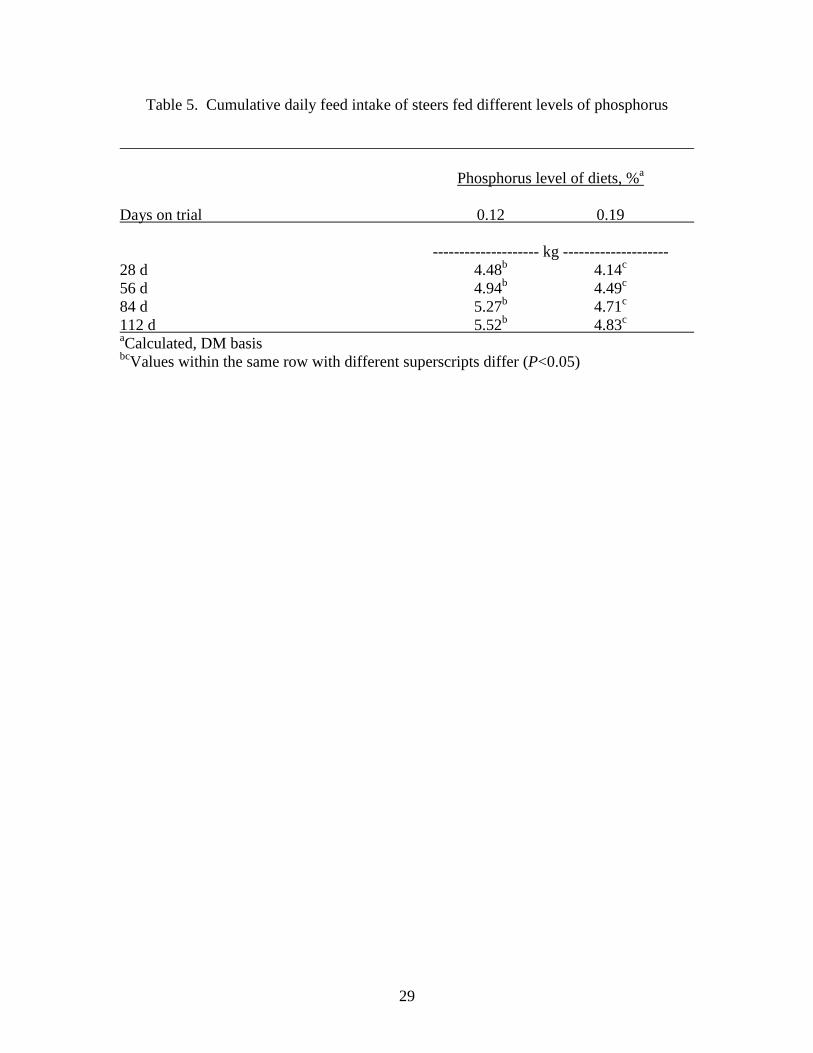
Average daily feed intake was higher (P<0.05) for the steers fed 0.12 % P (Tables
3 and 5). Throughout the 112-d trial the steers fed 0.12 % P had higher (P<0.05) DM
intake than those fed the 0.19 % P diet. As shown in Table 6, the steers on the 0.12% P
diet were still ingesting less (P<0.05) P when intake is expressed as g/d. These figures
indicate that despite an increase in DM intake by steers fed the 0.12% P diet, the steers
fed the 0.19% P diet had a higher P intake. Steers fed the 0.19% P diet tended to have a
better feed conversion than those receiving the 0.12% P diet, but the difference was not
significant (Table 3).
Based on the chemical analysis of these diets, the cattle should have grown at the
projected level. The lower performance, while not related to P content, could have been a

26
Table 2. Chemical composition of different diets fed to steers
Phosphorus level of diets, %a
Date Component 0.12 0.19 -------------------- % --------------------
12/15/99 – 2/1/00 Dry matter 91.25 91.09
Composition of dry matter
P 0.14 0.20
Crude protein 9.45 9.48
Ash 5.98 4.86
NDF 51.72 53.07
ADF 31.02 31.90
Ca 0.35 0.34
2/2/00 – 4/5/00 Dry matter 91.92 92.30
Composition of dry matter
P 0.15 0.17
Crude protein 10.25 10.03
Ash 3.73 3.85
NDF 52.55 55.91
ADF 31.48 32.89
Ca 0.37 0.36 aCalculated, DM basis

27
Table 3. Performance of steers fed different levels of phosphorus
Phosphorus level of diets, %a
Item 0.12 0.19
-------------------- kg --------------------Initial weight (12/15/99) 228 230
Final weight (4/5/00) 273 275
Daily gain, 112 d 0.40 0.39
Daily feed intake 5.52b 4.83c
Feed / gain 13.90 13.57 aCalculated, DM basisbcValues within the same row with different superscripts differ (P<0.02)

28
Table 4. Cumulative average daily gain of steers fed different levels of phosphorus
Phosphorus level of diets, %a
Days on trial 0.12 0.19
-------------------- kg --------------------28 d 0.90b 0.71c
56 d 0.49 0.4184 d 0.48 0.44112 d 0.40 0.39 aCalculated, DM basisbcValues within the same row with different superscripts differ (P<0.02)
29
Table 5. Cumulative daily feed intake of steers fed different levels of phosphorus
Phosphorus level of diets, %a
Days on trial 0.12 0.19
-------------------- kg --------------------28 d 4.48b 4.14c
56 d 4.94b 4.49c
84 d 5.27b 4.71c
112 d 5.52b 4.83c aCalculated, DM basisbcValues within the same row with different superscripts differ (P<0.05)

30
Table 6. Cumulative daily phosphorus intake of steers fed different levels of phosphorus
Phosphorus level of diets, %a
Days on trial 0.12 0.19
-------------------- g --------------------28 d 6.71b 7.86c
56 d 7.40b 8.52c
84 d 7.89b 8.93c
112 d 8.27b 9.17c aCalculated, DM basisbcValues within the same row with different superscripts differ (P<0.05)

31
function of TDN. When these diets were formulated, TDN values of the ingredients were similar
to those reported by NRC (1996). Recent work suggests that this calculation method, based on
ADF values is not accurate (Weiss, 1993). The inaccuracy is partly a result of the variation
among and between feeds. Future TDN estimations should be based on multipart equations that
factor in further measurements of composition.
In this growth study there was no detrimental effect of a 25% decrease in the P
concentration of the diets to growing steers performance. These results are similar to those
reported by Erickson et al. (1999) and Call et al. (1986). For each of those studies there was a
moderate decrease in the P concentration of the diets with no resulting decline in performance.
However, due to the increase in DM intake in the current study, there was only a 9.8% difference
in P intake when expressed as g/d. In the feedlot study (Erickson et al., 1999) two of the
treatments were 0.14 and 0.19% P in the diet. Because there was not a difference in the dry
matter intake in that study, the actual g/d P intake was 19.29% lower for the steers on the 0.14%
P diet. Based on the NRC intake requirements for P, both groups of steers in that study were
taking in almost twice the amount of P required for maintenance. Also, based on the rate of gain
reported here even the steers fed the low-P diet had high enough P intake to maintain this rate of
gain. The steers on the 0.19% diet had more than enough for their rate of gain, further indication
that P was not the limiting factor on performance.
Serum Phosphorus
Values for serum P are presented in Table 7. These data represent the analysis of blood
samples that were collected every 28 d. The serum P was similar between groups for the initial
sampling and for the samples collected at d 28 (P>0.05). By d 56 the steers fed the 0.19 %

32
Table 7. Serum phosphorus of steers fed different levels of phosphorus
Phosphorus level of diets, %a
Days on trial 0.12 0.19
-------------------- mg/dL --------------------0 (initial) 6.27 6.1528 d 6.11 6.6056 d 6.00b 7.30c
84 d 6.33b 7.38c
112 d 5.20b 6.74c aCalculated, DM basisbcValues within the same row with different superscripts differ (P<0.01)

33
P diet had higher (P<0.01) serum P than the steers being fed the 0.12% P diet. This difference
was maintained throughout the remainder of the trial.
While there has been previous work examining the effect that dietary P has on the
performance of beef cattle, very little of this work has included measurements of serum or
plasma P. There has been research concerning P metabolism in ruminants using sheep, and
serum P levels were evaluated for that work. In a metabolism trial conducted to study the effects
of dietary Ca and P in growing lambs the plasma P of the lambs was monitored every wk for 16
wk (Field et al., 1975). In that study, the lambs on the low-P treatment (0.13% P) had lower
plasma P concentrations than the lambs on the other treatments. Similar to the data presented
here, there appeared to be a leveling off of the P concentration at about 6.0 mg/dL. Conversely,
the plasma P values for the lambs began to decline again at 10 wk, and by the end of the 16 wk
study the plasma P concentration for these lambs was below 4.0 mg/dL. In the present study, the
serum P values for the steers receiving the 0.12% P diet had only dropped to 5.20 mg/dL by the
end of the study. As well as being higher than the lamb data reported by Field et al. (1975), this
value is not indicative of P deficiency according to NRC (1996) standards. While prolonged
serum or plasma P concentrations below 4.5 mg/dL may point toward insufficient dietary P, the
best measure of P status in the ruminant is bone P (Read et al., 1986a).

34
Experiment 2 – Metabolism Trial with Lambs
Objectives
The objectives of this study were to (i) compare utilization of inorganic and organic P,
(ii) compare the utilization of different organic P sources and to (iii) determine the efficacy of
phytase supplementation with different sources of organic P in ruminants.
Experimental ProceduresAnimals and Diets
Eighteen crossbred (1/8 Finn, 1/8 Ramboulliet, 1/4 Dorset, 1/2 Suffolk) wethers (23 kg)
were used in two consecutive metabolism trials. The lambs were born at the Southwest Virginia
Agricultural Research and Extension Center, Glade Spring, VA. Two weeks prior to being
transported from Glade Spring to the Smithfield Unit in Blacksburg, VA, on July 21, 2000, the
lambs were vaccinated for Clostridium perfringens C and D (Boehringer Ingelheim Vetmedica,
Inc., St. Joseph, Missouri) and dewormed with an Ivomec (MSD, Division of Merck and Co.,
Inc., Rahway, New Jersey) injection. For the first 2 d at Smithfield the lambs were fed grass
hay. On the third day transition to a high-roughage diet was started, increasing the level of this
feed to 0.45 kg/hd twice per day (0.9 kg/d). The high-roughage diet consisted of ground corn
grain (40.5%), grass hay (50.4%), soybean meal (3.5%), sugarcane molasses (5.0%), and trace
mineralized salt (0.6%). On July 24, 2000, all lambs were given a booster injection for the
Clostridium perfringens C and D and an Ivomec drench. On August 16, 2000, the lambs were
drenched with 5 cc of Panacur (Hoechst Roussel Vet, Warren, NJ) to destroy tapeworms.
For each trial the lambs were blocked by weight and randomly allotted within blocks to
six experimental diets: 1) a negative control diet deficient in P, 2) control diet supplemented with
inorganic P, 3) control diet supplemented with phytic acid, 4) control diet supplemented with

35
phytic acid and phytase, 5) control diet supplemented with cottonseed meal, and 6) control diet
supplemented with cottonseed meal and phytase. For the second trial the lambs were reallotted
to the diets within blocks, with the restriction that no animal would be fed the same diet as in the
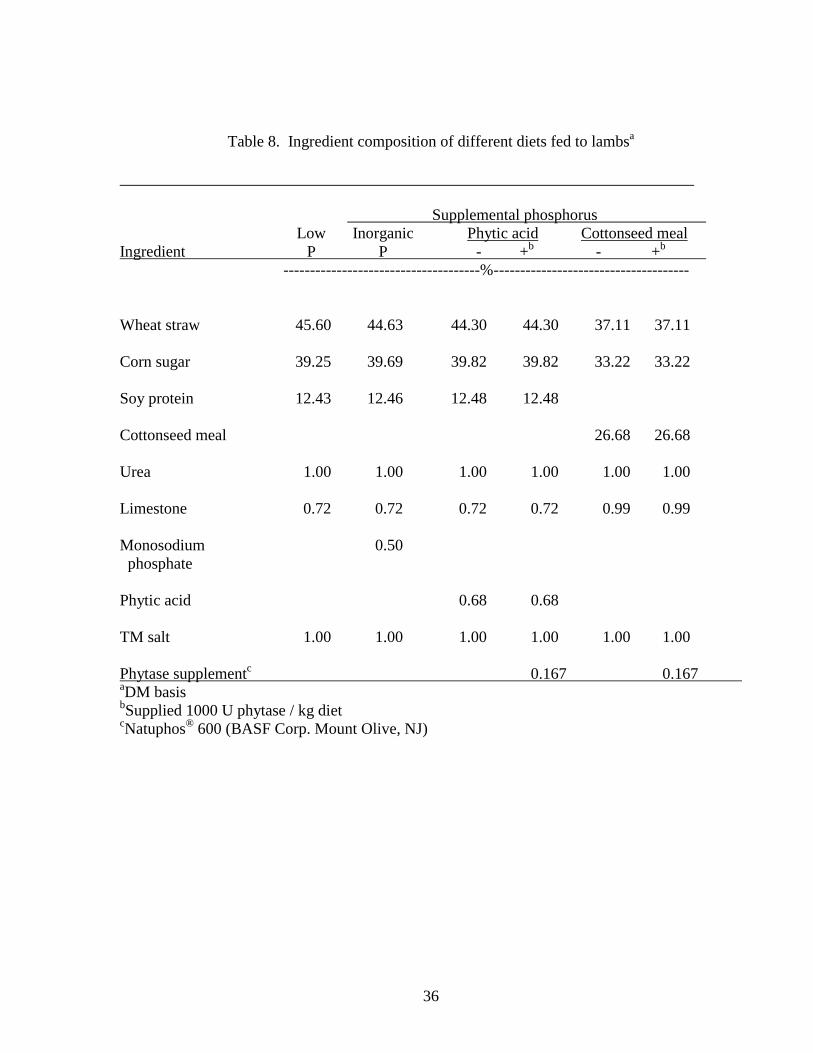
first trial. The ingredients for the diets were wheat straw, corn sugar, soy protein, cottonseed
meal, urea, limestone, trace mineralized salt, monosodium phosphate, phytic acid, and phytase
(Table 8). Phytase was supplemented at a level of 1000 units per kilogram of diet (Natuphos®,
600 BASF Corp. Mount Olive, NJ). The trace mineralized salt contained 1.10 % Mn, 1.4 % Zn,
42 ppm Co, 220 ppm I, 7000 ppm Fe, and 83 ppm Se, as fed basis. Diets were formulated to
provide 16.7 % CP, 65.0 % TDN, and 0.54% Ca, DM basis. The concentrate portion of each diet
was mixed for 15 min using a 54.5 kg capacity Hobart (V-1401 model, The Hobart
Manufacturing Co., Troy, OH) bowl mixer. Urea, trace mineralized salt, limestone,
monosodium phosphate, phytic acid, and phytase supplement were premixed and added to the
appropriate concentrate mix. Premixes were mixed in a 13.6 kg capacity Hobart (H600 model,
The Hobart Manufacturing Co., Troy, OH) bowl mixer for 10 min. The straw portion of the
diets was ground in a hammermill to pass through a 38.1 mm mesh screen, blended in a batch
mixer for 10 min and placed in labeled sacks.
Metabolism Trials
Prior to each metabolism trial all lambs were subjected to a 5 wk depletion period.
During this period the lambs were housed in a drylot with a covered bunk feeder and group
waterer at the Smithfield Unit at Blacksburg, VA and were fed the low-P control diet. The lambs
were weighed and blood was collected via jugular venipuncture once weekly.
After the depletion period the lambs were transported to the Metabolism Unit located on
Glade Road in Blacksburg, VA. The lambs were put in metabolism stalls similar to those
36
Table 8. Ingredient composition of different diets fed to lambsa
Supplemental phosphorus Low Inorganic Phytic acid Cottonseed meal
Ingredient P P - +b - +b -------------------------------------%-------------------------------------
Wheat straw 45.60 44.63 44.30 44.30 37.11 37.11
Corn sugar 39.25 39.69 39.82 39.82 33.22 33.22
Soy protein 12.43 12.46 12.48 12.48
Cottonseed meal 26.68 26.68
Urea 1.00 1.00 1.00 1.00 1.00 1.00
Limestone 0.72 0.72 0.72 0.72 0.99 0.99
Monosodium 0.50 phosphate
Phytic acid 0.68 0.68
TM salt 1.00 1.00 1.00 1.00 1.00 1.00
Phytase supplementc 0.167 0.167 aDM basisbSupplied 1000 U phytase / kg dietcNatuphos® 600 (BASF Corp. Mount Olive, NJ)

37
described by Briggs and Gallup (1949). For each trial the lambs were given subcutaneous
injections of 1,000,000 I.U. of Vitamin A and 150,000 I.U. of Vitamin D upon entering the
metabolism stalls (September 15 and November 20, 2000). The metabolism trials were started
on September 15, 2000, for trial 1, and on November 20, 2000, for trial 2. The first metabolism
trial began with a 3 d adjustment to the stalls during which the lambs remained on the low-P
control diet. There was no adjustment period for the second metabolism trial. Each trial
consisted of a 5 d transition to the experimental diets, 10 d preliminary period, and 10 d total
collection of feces and urine.
The lambs were fed 255 g of their respective experimental diets at 0700 and 1900h each
day during the preliminary and collection periods (510 g/d). Due to the dusty characteristics of
the diets, 50 ml of water were added to the diet of each lamb at each feeding. The amount of
feed provided was based on the highest DM intake of the lambs that consumed the least amount
of feed during the adjustment period of the first metabolism trial. To avoid separation and
settling, the straw and concentrate portions were weighed separately. The straw, concentrate,
and water were mixed by hand just prior to feeding. All lambs were allowed access to the feed 2
h at each feeding. The lambs that had not finished eating after 1 h were offered water for 10 min
and were offered the feed for the last hour. At the end of each feeding, refusals, if any, were
collected, weighed, recorded, and stored frozen. Water was available to all lambs at all times
except during feeding.
Samples of straw and each of the six concentrates were sampled at each feeding
beginning 2 d prior to the start and ending 2 d before the end of the collection period. At the
completion of each metabolism trial straw and concentrate samples for every 2 d were
composited and subsampled (total of five samples). Refusals during the collection period were

38
composited by lamb and weighed. The wet weight was recorded, the samples were dried in a
forced draft oven for 24 h at 60° C, reweighed, the dry weight was recorded, and the dry samples
were stored in plastic bags.
For the 10 d collection periods feces and urine were collected at 0730 h. Feces were
transferred from the metal collection pans to labeled aluminum drying pans. The feces were
weighed, the wet weight recorded, then dried at 60° C for 48 h. The dried fecal samples were
weighed, the dry weight recorded, and composited in plastic buckets with loose fitting lids to
reach atmospheric moisture equilibration. At the end of the collection period the feces from each
lamb were thoroughly mixed and subsampled. The subsamples were stored in labeled plastic
bags until processed for chemical analysis.
Four-liter plastic jugs were used to collect urine. Before being placed under the stalls, 15
mL of a 1:1 (w/w) solution of H2SO4 and H2O and 500 mL of H2O were added to each labeled
jug to prevent N loss. At the time of collection the funnels and metal grids above the funnels
were rinsed with approximately 500 mL of H2O into the urine jugs. The collection jug was
removed from beneath the stall and was replaced with a new collection jug with the acid solution
and water. Each day the urine collected was diluted with water to a constant weight of 5000 g,
thoroughly mixed and 100 mL subsample was placed in a plastic jar and refrigerated. At the end
of the collection period the composited urine sample for each lamb was mixed and a subsample
was collected and stored frozen until chemical analysis.
At the end of the collection period for each of the metabolism trials ruminal fluid samples
were collected 2 h post-feeding using a stomach tube with a strainer and vacuum pump. After
the collection of ruminal fluid all lambs were given access to water for 2 h. At 4 h post-feeding a
halter was placed on each lamb. The halters were fitted with a sponge covered mouthpiece for

39
the lambs to chew. Six hours after feeding the halters were removed and saliva was squeezed out
of the sponges into 15 mL plastic storage tubes. Also at this time blood was collected into 15
mL Vacutainer tubes (Becton Dickinson and Company, Franklin Lakes, New Jersey) by left
jugular venipuncture.
Bone Strength
After completion of the second metabolism trial the lambs were killed by procedures
approved by the Animal Care Committee for collecting the 10th rib bones. The bones were
sealed in plastic bags and stored frozen. The frozen bone samples were partially thawed and
cleaned of all extraneous tissue. The clean bones were then stored frozen until shear force and
ash content were measured. The shear force of the 10th rib bones was determined using an
Instron Universal Testing Machine (model 1123, Instron Corp., Canton, MA). Two
measurements of bone strength, shear force and shear energy, were determined using the 10th rib
bones of the lambs following the second metabolism trial. After the test for strength was
complete, these same bones were used for the determination of ash, as a percent of DM. Shear
force, expressed in Newtons, is the load required to break the bone. The shear energy, expressed
as Newtons/mm, is the load that must be applied in a specified area to break the bone.
Chemical Analysis
Samples of straw, refusals, and concentrates were ground to pass through a 1mm screen
using a Wiley mill (Thomas Wiley, Laboratory Mill Model 4, Arthur H. Thomas Co.
Philadelphia, PA). Because of the sugar content of the concentrate samples they were ground
and blended in a household Osterizer blender (Sunbeam-Oster, Milwaukee, Wisconsin). Dry
matter was determined by drying samples in a 100° C oven for 24 h and percent ash content was
determined by placing dried samples in a Muffle furnace at 500° C for 3 h (AOAC, 1990).
40
Nitrogen was determined according to the Kjeldahl procedure (AOAC, 1990). The fiber
components of NDF, ADF, lignin, and cellulose were determined using the methods described
by Goering and Van Soest (1970) with the Ankom200 Fiber Analyzer (Ankom Technology,
Fairport, NY). The samples were digested with 2:1 (v/v) HNO3:HClO4 for mineral analyses
(Muchovej et al., 1986). Urine was thawed and analyzed for Kjeldahl N (AOAC, 1990).
The blood samples were centrifuged at 1800x g for 15 min following collection. The
serum was separated and frozen until chemical analysis. Concentrations of Ca, Mg, K, Cu, and
Zn in feeds, refusals and fecal digesta, urine, and blood serum were determined on an Atomic
Absorption Spectrometer (Perkin Elmer AAnalyst 800, Norwalk, CT). Phosphorus
concentrations for feed, refusal, and feces was determined according to the method of Fiske and
Subbarow (1925) using the Spectronic® 21D (Milton Roy, Rochester, NY). Serum samples
were analyzed for P by a colorimetric reaction with a molybdate reagent using the automated
Beckman CX5 Chemistry Analyzer (Beckman SYNCHRON CX® SYSTEMS, Beckman
Instruments, Inc., Brea, CA). Blood urea nitrogen was determined using the automated Beckman
CX5 Chemistry Analyzer (Beckman SYNCHRON CX® Systems, Beckman Instruments, Inc.,
Brea, CA). The BUN analysis involved a BUN enzymatic rate reagent. The reaction between
the reagent and the sample produces a change in the absorption at 340 nm and the BUN
concentration is proportional to the change in absorbance.
At the time of collection the ruminal fluid samples were filtered through four layers of
cheesecloth and the pH was measured immediately using a portable pH meter (Accumet Mini pH
Meter, Model AP61, Fisher Scientific Company). Five milliliters of the ruminal fluid were
placed in a 15 mL plastic storage tube containing 1 mL of metaphosphoric acid and 5 mL of an
internal standard (20 µmol/ml 4-methyl valeric acid) for VFA analysis. The VFA analysis was
41
performed by gas chromatography (Varian Vista 6000 Gas Chromatograph, column packed with
10% SP-1200/10% H3PO4 on 80/100 Chromasorb WAW). The concentration of the VFAs were
determined on integration based on a VFA standard containing 51.66 µmol/ml acetic acid, 30.63
µmol/ml propionic acid, 10.4 µmol/ml butyric acid, 5.18 µmol/ml valeric acid, 4.96 µmol/ml
isobutyric acid, and 4.95 µmol/ml isovaleric acid. Another 5 mL sample of ruminal fluid was
added to a 15 mL plastic storage tube containing one drop of H2SO4 for NH3N determination by
the colorimetric method of Beecher and Whitten (1970). A third 5 mL sample of ruminal fluid
was stored in a 15 mL plastic storage tube for P analysis. The ruminal fluid was centrifuged, 0.5
mL of the supernatant was wet ashed using 2:1 (v/v) HNO3:HClO4. The P in ruminal fluid and
saliva was determined by the method given above for serum.
Following the shear force test, the bones were dried at 100° C for 72 h to determine dry
weight. The bones were then ashed at 600° C for 24 h in a Muffle furnace.
Statistical Analysis
Data were analyzed used the GLM procedure of SAS (1989). The model included block,
trial, and treatment. Orthogonal contrasts were made between the control treatment and all of the
P supplemented treatments and between the inorganic P supplementation and organic P
supplementation without phytase. Statistical analysis was also performed to detect differences
between source of organic P, effect of phytase, and interactions between source of organic P and
phytase supplementation.

42
Results and Discussion
Depletion Phase
The serum P values for the depletion phase are presented in Table 9. The initial value of
8.69 mg/dL is slightly higher than the reported normal range of 4 to 8 mg/dL (NRC, 1985).
After the first week of the depletion phase there was a sharp drop in the serum P. During the
final three weeks of the depletion phase an additional slight decrease in the serum P occurred.
However, with the lowest average serum P of 5.11 mg/dL, these lambs were still within the
normal range of P values and would not be considered P deficient.
Chemical Composition of Diets
The chemical composition of the diets is presented in Table 10. Concentrations of the
organic components were similar among the diets, except the CSM diets had a higher (P<0.05)
concentration of lignin, compared to the other diets. The low-P diet had the lowest (P<0.05) P
concentration of all of the diets, the diets supplemented with inorganic P or phytic acid were
intermediate, and the CSM diets had the highest P concentration (P<0.05). The reason for higher
values for the CSM diets was because the actual P values in CSM was higher than the assumed
values (NRC, 1996). Concentrations of Ca, Mg, K, and Cu were also higher (P<0.05) for the
CSM diets than the other diets.
Mineral Balance
The P balance for the lambs receiving the different experimental diets is presented in
Table 11. The P intake for the lambs fed the low-P diet was lower (P<0.005) than the P for the
lambs receiving P supplementation. Lambs receiving inorganic P supplementation had lower

43
Table 9. Blood serum phosphorus values of lambs during the depletion phase
Week Serum phosphorus ---------- mg/dL----------
1 8.682 5.473 5.134 5.18
5 5.11

44
Table 10. Chemical composition of different diets fed to lambs
Supplemental phosphorus Low Inorganic Phytic acid Cottonseed meal
Item P P - +a - +a
Dry matter, % 92.33 92.32 92.23 92.38 92.05 92.13
Composition of dry matter
Crude protein, % 16.53 16.74 16.63 17.15 17.12 16.37
NDF, % 35.87 35.11 34.85 34.85 35.51 36.64
ADF, % 22.47 21.99 21.83 21.83 22.81 23.21
Cellulose, % 19.37 18.96 18.82 18.82 18.86 19.16
Lignin, % 1.65b 1.61b 1.60b 1.60b 1.88bc 2.29c
Ash, % 9.31 10.94 9.62 10.55 9.14 9.87
P, % 0.14b 0.29c 0.26c 0.26c 0.35d 0.36d
Ca, % 0.48b 0.50b 0.45b 0.47b 0.64c 0.62c
Mg, % 0.08b 0.08b 0.08b 0.08b 0.24c 0.24c
K, % 0.29b 0.29b 0.29b 0.29b 0.53c 0.55c
Cu, ppm 3.88b 3.84b 3.70b 3.82b 4.99c 4.52bc
Zn, ppm 115.14b 154.61c 128.85bc 119.18b 105.18b 108.39b
Phytase, U/kg 0 0 0 1975 0 1774 aSupplied 1000 U phytase / kg dietbcdValues in the same row with different superscripts are different (P<0.05).

45
Table 11. Phosphorus balance by lambs fed different diets
Supplemental phosphorus Inorganic Phytic acid Cottonseed meal
Item Low P P - +a - +a SE
Intake (g/d)bcde 0.64 1.34 1.24 1.23 1.64 1.68 0.01
Excretion (g/d)
Fecalbd 0.30 0.48 0.44 0.46 0.65 0.66 0.04
Urinary - 0 .01 0.05 0 .02 0.04 0.01 0.02
Totalbd 0.30 0.49 0.49 0.48 0.68 0.69 0.03
Apparent absorptiong/dbd 0.34 0.87 0.80 0.76 0.99 1.03 0.04
% of intakeb 52.8 64.5 64.5 62.2 60.5 61.0 2.87
Retentiong/dbd 0.34 0.85 0.75 0.75 0.95 1.01 0.03
% of intakeb 52.8 63.5 60.5 60.8 58.2 61.8 2.39aSupplied 1000 U phytase / kg dietbNo phosphorus supplementation vs phosphorus supplementation (P<0.005)cInorganic supplementation vs organic supplementation (P<0.0001)dPhytic acid vs cottonseed meal (P<0.001)eInteraction between source of organic P and phytase supplementation (P<0.02)
46
(P<0.0001) P intake than the lambs receiving organic P supplementation. Phosphorus intake was
lower (P<0.001) for lambs supplemented with phytic acid than those fed the CSM diets. Based
on an average BW of 23 kg and the daily intake maintenance requirement for lambs of 36 mg/kg
BW (NRC, 1985), only the low-P diet was deficient in P. Lambs fed the supplemented diets
received more than the 0.83 g/d P the amount required (NRC, 1985). Fecal excretion of P was
greater (P<0.005) for the lambs receiving P supplementation than for those fed the low-P diet,
undoubtedly a reflection of differences in intake. There was no difference in the fecal excretion
of P between lambs supplemented with inorganic and organic P. However, fecal excretion of P
was higher (P<0.001) for the lambs fed the CSM diets, compared to those fed the phytic acid
diets, again a reflection of the differences in intake. Minimal urinary excretion of P was
detected, and there was no difference between treatments. It is important to point out that the
lambs fed the low-P diet had no urinary excretion of P. Total P excretion followed a similar
pattern as fecal excretion.
The apparent absorption of P, expressed in g/d or percent of intake, was lower (P<0.005)
for the lambs receiving the low-P diet than for the lambs receiving P supplementation. There
was no difference between lambs supplemented with inorganic P and organic P. The amount of
P absorbed was higher (P<0.001) for the lambs fed the CSM than for the lambs fed the phytic
acid. This is most likely related to the higher P intake for the lambs fed the CSM diets. Because
there was minimal urinary excretion of P by lambs receiving any of the experimental diets, the P
retention followed the same trend as the P absorption values.
In a metabolism trial with sheep, Scott et al. (1985) fed a basal diet that provided 1.94 g
P/d. The other treatments provided supplemental P through ruminal infusion at two different

47
levels. The other two levels of P intake were 4.01 and 6.03 g P/d. Each treatment provided more
than the 1.88 g/d required by the sheep. Both the fecal and urinary excretion of P increased as
the intake of P increased, but the increase in urinary excretion of P was attributed to only one
animal. This indicates that the increased P intake is typically reflected by an increase in fecal
excretion of P. When compared to the fecal excretion of P, the urinary excretion by the lambs in
that study was minimal. Unlike the current study, however, all groups did excrete some urinary
P. They also reported a decrease in percent absorption as P intake increased. None of the diets
in that study were P deficient.
A balance trial with Holstein cows was conducted by Morse et al. (1992) to investigate
the effects of dietary P concentration on the excretion of P. Three levels of P were fed. When P
intake increased from 60 to 82 g/d, the fecal excretion increased by more than 4 %. Fecal P
excretion increased by nearly 25 % when the P intake increased from 82 to 112 g/d. Cows fed
the three experimental diets showed some urinary excretion of P, but the highest amount of P
excreted in the urine occurred when the dietary P was increased from 82 to 112 g/d. The authors
pointed out that the excretion of P was related to P intake, and once P equilibrium was reached
the excess dietary P was not retained.
Garcia-Bojalil et al. (1988) reported apparent absorption values of P by lambs from a
metabolism study in which two levels of dietary P were fed, 1.88 or 2.86 g/d. As with the
present research, there was an increase in absorption as a percent of intake for the high P diet
compared to the low-P diet. In that study, both P levels exceeded the requirement for these
lambs. In a metabolism study of the effect of dietary P for growing calves, Challa and
Braithwaite (1988) reported that P absorption was associated with dietary P. The data from that
study indicated a proportional increase in P absorption relative to the increase in P intake.

48
The P absorption values for the inorganic and organic forms of P in the current study
confirm results of a study by Tillman and Brethour (1958), who reported no difference in P
utilization between calcium phosphate and calcium phytate. However, results of the present
study do not agree with those reported by Dutton and Fontenot (1967). They compared
monosodium phosphate and phytic acid in lambs. They reported no difference in P absorption
between these two supplements, but there was a difference in retention values. The P retention
was lower when the P supplement was phytic acid. This decrease in retention was due to an
increase in urinary P excretion. The difference in percent P retention in that study could be due
to the fact that the dietary P provided in the diet exceeded the requirement, compared to the
dietary P levels in the present study. While this does offer an explanation for the decreased P
retention reported by Dutton and Fontenot (1967), this does not explain the difference in
retention between the two forms of P. Perhaps the decrease in P retention associated with phytic
acid is dependent upon the extent to which the dietary P exceeds the P requirement.
The balance data for the present study indicates that phytase supplementation does not
lead to an improvement of P absorption for ruminants as it does for non-ruminants (Yi et. al.,
1996; Han et al., 1997). Yi et al. (1996) tested the bioavailability of P for young pigs when
phytase was added to diets high in organic P. These researchers reported decreased fecal
excretion of P and an increase in P absorption associated with phytase supplementation. Han et.
al. (1997) performed a similar feeding study with swine from weaning through finishing. In that
study, inorganic P supplementation was compared to supplementation of organic P plus phytase.
The pigs fed the diet with organic P and phytase excreted less P, and apparent digestibility of P
was higher than for pigs receiving the inorganic P supplementation.

49
The Ca balance data for the lambs being fed the different experimental diets is presented
in Table 12. The diets supplied more than twice the Ca required by lambs. Lambs receiving the
CSM supplemented diets had higher (P<0.0001) Ca intake compared to the lambs receiving the
phytic acid diets. Consistent with the higher intake, the fecal excretion of Ca was
higher (P<0.0001) for the lambs being fed the CSM diets compared to the phytic acid diets. The
urinary excretion of Ca was higher (P<0.03) for lambs fed the low-P diet than for those fed the
diets with P supplementation. Lambs receiving inorganic P supplementation had higher
(P<0.04) urinary Ca excretion than the lambs receiving organic P supplementation.
While there was no significant effect of P supplementation on Ca absorption, there was a
trend (P<0.09) for the low-P diet to result in lower Ca absorption compared to the diets
supplemented with P. These data are similar to the findings of Challa and Braithwaite (1988).
In their study Ca intake was constant with three different levels of dietary P. They found that a
low P diet resulted in an increase in the fecal excretion of Ca and a decrease in Ca absorption.
Also, like the present study, Challa and Braithwaite (1988) reported higher urinary excretion of P
associated with the low-P diet and a subsequent decrease in Ca retention. The authors theorized
that the mechanism of this response was that as P intake declined, there was a decrease in serum
P that led to less P retention by the bones. Since P was not being retained by the bones, the
requirement for Ca by the skeletal tissue decreased, which led to a decrease in the absorption and
retention of Ca.
With the two organic sources of P supplementation, there was a phytase effect on Ca
absorption when expressed in g/d. However, there was an interaction between source of
organic P and phytase (P<0.004). Phytase supplementation to the phytic acid diet resulted in an
increase in Ca absorption, but when phytase was added to the CSM diets there was a

50
Table 12. Calcium balance by lambs fed different diets
Supplemental Phosphorus Inorganic Phytic acid Cottonseed meal
Item Low P P - +a - +a SE
Intake (g/d)b 2.23 2.33 2.04 2.24 3.03 2.93 0.12
Excretion (g/d)Fecalb 1.91 1.77 1.50 1.59 2.48 2.44 0.10
Urinarycd 0.20 0.14 0.11 0.10 0.05 0.07 0.02
Totalb 2.11 1.92 1.41 1.69 2.53 2.50 0.11
Apparent absorptiong/defg 0.32 0.55 0.54 0.65 0.55 0.50 0.08
% of intakecg 13.3 23.9 26.3 28.8 18.0 16.8 3.48
Retentiong/dcef .12 .41 .03 .55 .50 .43 0.08
% of intakecd 4.3 17.8 -1.4 24.3 16.4 14.4 3.86a Supplied 1000 U phytase / kg dietbPhytic acid vs cottonseed meal (P<0.0001)cNo P supplementation vs P supplementation (P<0.03)dInorganic supplementation vs organic supplementation (P<0.04)ePhytase supplementation vs no phytase supplementation (P<0.02)fInteraction between source of organic phosphorus and phytase supplementation (P<0.004)gNo P supplementation vs P supplementation (P<0.09)
51
decrease in Ca absorption.
These would appear to be in agreement with the swine research by Lei (1993) and the
poultry research by Sebastian (1996). These researchers found that when diets were
supplemented with phytase there was an improvement in Ca absorption by both swine and
poultry. However, in the present study it is difficult to assess whether the improvement in Ca
absorption is a true phytase effect, or is a result of the higher Ca intake. This improvement in Ca
absorption with phytase supplementation was not observed in the lambs fed the CSM diet.
There were differences in Mg balance among dietary treatments (Table 13). The greater
Mg concentration of the CSM diets compared to the other four diets apparently resulted in an
increase (P<0.006) in Mg intake between the low-P diet and the P supplemented diets. There
was also a difference (P<0.002) in Mg intake between inorganic and organic P supplementation,
and between the two sources (P<0.0001) of organic P supplementation. The Mg intake was 0.36
and 1.13 g/d for the phytic acid and CSM diets, respectively. These differences in intake are
reflected in similar differences in Mg excretion in the feces. The range of fecal excretion of Mg
was 0.26 to 0.69 g/d, with lambs eating the CSM diets excreting the most Mg. When apparent
absorption is expressed as g/d or as a percent of intake, these same differences are observed.
Absorption of Mg was lower (P<0.01) for lambs fed the low-P diet. Also, Mg absorption
was lower (P<0.002) for lambs fed organic P, compared to inorganic P. There was no
difference in Mg absorption between inorganic P and phytate supplementation. These results
agree, in part, with those reported by Dutton and Fontenot (1967). In that study, in which
inorganic P and phytic acid were compared, there was no effect of form of P supplementation on
the absorption of Mg. The higher absorption of Mg for the CSM fed lambs in the present study
was due to the higher intake of Mg.

52
Table 13. Magnesium balance by lambs fed different diets
Supplemental phosphorus Inorganic Phytic acid Cottonseed meal
Item Low P P - +a - +a SE
Intake (g/d)bcd .36 .37 .36 .36 1.11 1.14 0.01
Excretion (g/d)
Fecalbcd 0.26 0.27 0.26 0.26 0.68 0.69 0.02
Urinarybc 0.11 0 .08 0.09 0 .09 0.30 0.40 0.03
Totalbcd 0.37 0.35 0.35 0.35 0.98 1.09 0.05
Apparent absorptiong/dbcd 0.09 0.10 0.10 0.10 0.42 0.45 0.02
% of intakebcd 25.9 26.3 27.0 28.0 38.6 40.4 2.39
Retentiong/dbcd - 0.02 0.01 0.01 0.13 0.05 0.04
% of intakebcd 2.8 5.4 5.3 5.3 11.7 4.4 2.64aSupplied 1000 U phytase / kg dietbNo phosphorus supplementation vs phosphorus supplementation (P<0.01)cInorganic phosphorus supplementation vs organic phosphorus supplementation (P<0.002)dPhytic acid vs cottonseed meal (P<0.0001)

53
The balance data for K (Table 14) indicates a treatment response similar to that described
for Mg balance. Potassium intake was higher (P<0.03) for the P supplemented lambs compared
to the low-P lambs. There was also greater (P<0.04) K intake for the lambs receiving the
organic P supplementation as compared to lambs eating the diets supplemented with inorganic P.
Within organic P supplementation, the K intake was higher (P<0.02) for those lambs fed the
CSM diets compared to the K intake of the lambs being fed the phytic acid diets. All of these
differences in intake can be attributed to the higher K concentration of the CSM diets. There
were no differences among the treatments for fecal excretion of K. Urinary K excretion was
lower (P<0.03) for lambs fed the low-P diet than for those fed P supplementation. Potassium
excretion in the urine was higher (P<0.02) for lambs fed the CSM diets than the phytic acid
diets. There was an interaction (P<0.03) of the effect of phytase supplementation X source of
organic P supplementation on urinary K excretion. The addition of phytase to the phytic acid
diet decreased K excreted in the urine, but phytase added to the CSM diet increased K excretion
in the urine. The total loss of K was higher (P<0.02) for the lambs receiving phytic acid,
compared to those receiving CSM.
The Cu balance of the lambs fed the different diets is presented in Table 15. Because of
the greater Cu concentration of the CSM diets compared to the other four diets, there was a
difference (P<0.0001) in Cu intake between the low-P diet and the P supplemented diets. There
was also a difference (P<0.0001) in Cu intake between lambs supplemented with inorganic and
organic P, and between the two sources of organic P supplementation (P<0.0001). The Cu

54
Table 14. Potassium balance by lambs fed different diets
Supplemental phosphorus Inorganic Phytic acid Cottonseed meal
Item Low P P - +a - +a SE
Intake (g/d)bcd 1.37 1.34 1.34 1.36 2.49 2.58 0.04
Excretion (g/d)
Fecal 0.66 0.71 0.80 0.65 0.68 0.66 0.11
Urinaryade 1.26 1.58 1.60 1.23 2.62 4.05 0.35
Totalde 1.92 2.29 2.40 1.88 3.30 4.71 0.40
Apparent absorption
g/dbcd 0.71 0.63 0.54 0.71 1.81 1.92 0.11
% of intakebcd 51.8 47.0 40.3 52.2 72.7 74.4 3.22
Retention
g/dde -0.55 -0.95 -1.06 -0.52 -0.81 -2.13 0.35
% of intake - - - - - - - aSupplied 1000 U phytase / kg dietbNo phosphorus supplementation vs phosphorus supplementation (P<0.03)cInorganic P supplementation vs organic P supplementation (P<0.04)dPhytic acid vs cottonseed meal (P<0.02)eInteraction between source of organic P and phytase (P<0.03)

55
Table 15. Copper balance by lambs fed different diets
Supplemental phosphorus Inorganic Phytic acid Cottonseed meal
Item Low P P - +a - +a SE
Intake (mg/d)bcde 9.15 8.89 8.65 8.99 11.73 10.63 0.16
Excretion (mg/d)
Fecal 0.24 0.24 0.23 0.23 0.27 0.26 0.01
Urinary 0.02 0 .01 0.01 0 .01 0.03 0.08 0.03
Total 0.24 0.24 0.23 0.23 0.27 0.27 0.01
Apparent absorption
mg/dbc 8.91 8.62 8.43 8.75 11.44 10.37 0.02
% of intake 69.8 72.3 71.2 73.2 76.1 73.8 1.45
Retention
mg/dbc 8.90 8.62 8.43 8.75 11.43 10.35 0.03
% of intake 69.8 72.3 71.2 73.2 76.1 73.8 1.45 aSupplied 1000 U phytase / kg dietbPhytic acid vs cottonseed meal (P<0.0001)cInteraction between source of organic P and phytase supplementation (P<0.03)dNo P supplementation vs P supplementation (P<0.0001)eInorganic P supplementation vs organic P supplementation (P<0.0001)

56
intake for the lambs fed the phytic acid diets was 8.82 mg/d, and the intake was 11.18 mg/d for
the lambs fed the CSM diets. There are no differences in the excretion of Cu between any of the
treatments. The absorption of Cu was numerically lower for the lambs fed the low-P diet
compared to the P supplemented diets. The lambs fed the CSM diets had greater (P<0.0001) Cu
absorption than those lambs fed the phytic acid diets, a reflection of differences in intake. There
was an interaction (P<0.03) between phytase and source of organic P. Phytase supplementation
to the phytic acid diets increased Cu absorption, but Cu absorption was decreased when phytase
was supplemented to the CSM diets. Retention of Cu followed the same trend as absoprtion.
The results of this study are inconsistent with earlier work examining the effect of phytase
supplementation on Cu availability. Sebastian et al. (1996) reported an increase in the percent
Cu retained when phytase was added to the diets of broiler chickens.
Zinc absorption data are presented in Table 16. There was higher (P<0.03) intake of Zn
by lambs receiving the diet supplemented with inorganic P compared to the lambs receiving the
diets supplemented with organic P due to the presence of Zn in the P supplement. Despite this
difference in intake, there was no difference in the fecal or urinary excretion of Zn between the
treatments. Since there was little urinary excretion of Zn, the values for Zn absorption and
retention are similar. When absorption or retention was expressed in mg/d, the lambs fed
inorganic P supplementation had greater (P<0.03) Zn absorption and retention than lambs fed
organic P supplementation. This difference may be due to the greater intake. However, when
absorption and retention are expressed as a percent of intake these values are higher (P<0.03) for
the lambs receiving organic P supplementation versus lambs receiving inorganic P
supplementation. There was no difference in Zn absorption between the two sources of organic
P and no effect of phytase supplementation on the absorption of Zn.

57
Table 16. Zinc balance by lambs fed different diets
Supplemental phosphorus Inorganic Phytic acid Cottonseed meal
Item Low P P - +a - +a SE
Intake (mg/d)b 5.41 7.27 6.06 5.60 4.94 5.09 0.15
Excretion (mg/d)
Fecal 1.24 1.85 1.50 1.29 1.17 1.16 0.15
Urinary 0.49 0 .68 0.63 0.52 0.41 0.47 0.29
Total 1.72 2.55 2.13 1.81 1.55 1.63 0.35
Apparent absorption
mg/db 4.15 5.43 4.60 4.31 3.77 3.91 0.15
% of intakeb 77.1 74.6 75.2 76.9 76.5 77.1 1.10
Retention
mg/db 3.69 4.76 3.93 3.80 3.36 3.46 0.35
% of intakeb 68.2 65.1 64.8 67.6 68.0 67.9 1.25aSupplied 1000 U phytase / kg dietbInorganic supplementation vs organic supplementation (P<0.03)
58
The broiler study reported by Sebastian et al. (1996) indicated an improvement in Zn
utilization with phytase supplementation. The absence of a phytase effect on the absorption or
retention of Zn in this study is similar to the utilization of the other minerals evaluated in this
study. These combined findings are evidence that the phytase already present in the rumen is
sufficient to break down the phytate molecule and release any minerals that may be attached.
There was no additive effect of this enzymatic reaction with dietary phytase for ruminants.
Bone Strength and Ash Content
Measurements of strength and ash content of bones are presented in Table 17. There was
no effect of dietary treatment on either measurement of bone strength. There was a trend for the
lambs fed the phytic acid diets to have stronger bones, when expressed as shear force, than the
lambs fed the CSM diets (P<0.13). There was also a trend for an interaction between source of
organic P and phytase on shear force (P<0.07). Phytase added to the phytic acid diet resulted in
an increase in bone strength, while phytase added to the CSM diet resulted in a decrease in bone
strength. There were no treatment effects on the ash content of the bones.
These bone characteristics are further evidence that phytase had no benefit to the
ruminant diet. Addition of phytase to swine diets resulted in greater shear force and ash content
of the bones of pigs (Yi et al., 1996; Harper et al., 1997). Based on improved bone strength and
mineralization, the researchers concluded that addition of phytase increased P availability from
the diet, which prevented mineral mobilization from the skeletal tissue. Since there was no
consistent phytase effect on bone strength in the present study and no effect on ash content, it can
be assumed that dietary phytase supplementation had no effect on bone mineralization or
demineralization. The assumption can also be made that bone mineralization is the same for
ruminants regardless of form of dietary P.

59
Table 17. Bone characteristics of lambs fed different diets
Supplemental phosphorus Inorganic Phytic acid Cottonseed meal
Item Low P P - +a - +a SE
Shear force, Nbc 673.8 635.5 707.6 989.7 765.2 460.9 136.3
Shear energy, N-mm 725.3 603.3 643.5 801.9 748.3 703.4 65.2
Ashd 43.60 44.42 43.45 46.28 40.22 44.83 3.08 aSupplied 1000 U phytase / kg dietbPhytic acid vs cottonseed meal (P<0.13)cInteraction between source of organic P and phytase supplementation (P<0.07)dDry matter basis

60
Saliva and Ruminal Fluid Phosphorus
There were no differences in P content of the saliva for the lambs used in this study
(Table 18). There was a numerical difference in the saliva P between the lambs fed the organic P
diets supplemented with phytase compared to those fed organic P without phytase. Lambs
receiving organic P without phytase had numerically lower P concentration in the saliva versus
those lambs fed organic P with phytase. Earlier studies that reported saliva P values for sheep
did not collect and analyze saliva samples, but calculated the saliva P. These calculations were
based either on the difference between P intake and the flow of P at the duodenum (Scott et al.,
1985) or the difference between P intake and the flow of P at the reticulum (Challa et al., 1989).
Scott et al. (1985) reported an increase in salivary P proportional to the increase in P intake.
Challa et al. (1989) concluded that salivary P secretion had a direct relationship to P intake and P
absorption. The findings of these studies are contradictory to the results of the present study.
The present study revealed no relationship between P intake and salivary P concentration.
The results of the present study are similar to those reported by Judkins et al. (1985). The
values reported by Judkins et al. were not calculated, but analyzed values of saliva samples from
cows that were collected in a similar manner as was used in the current research.
The saliva P reported for the cows did coincide with the rise and fall of intake based on forage
quality, but the saliva from cows not receiving P supplementation only differed from those
receiving P supplementation at one sampling date. It is important at this point to notice the high
standard error for the saliva P in this study. This could be related to the rate of salivary
secretion, which was not quantified for the lambs and would impact the total P secreted in the
saliva.
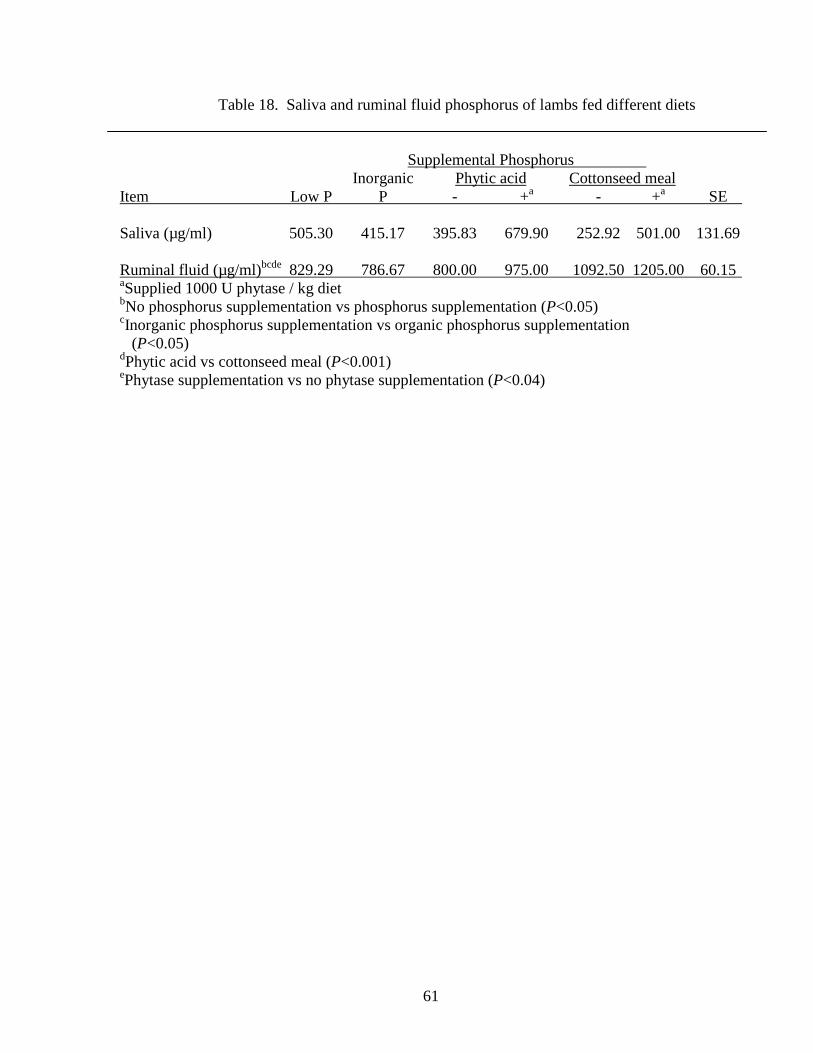
61
Table 18. Saliva and ruminal fluid phosphorus of lambs fed different diets
Supplemental Phosphorus Inorganic Phytic acid Cottonseed meal
Item Low P P - +a - +a SE
Saliva (µg/ml) 505.30 415.17 395.83 679.90 252.92 501.00 131.69
Ruminal fluid (µg/ml)bcde 829.29 786.67 800.00 975.00 1092.50 1205.00 60.15 aSupplied 1000 U phytase / kg dietbNo phosphorus supplementation vs phosphorus supplementation (P<0.05)cInorganic phosphorus supplementation vs organic phosphorus supplementation (P<0.05)dPhytic acid vs cottonseed meal (P<0.001)ePhytase supplementation vs no phytase supplementation (P<0.04)

62
There were differences in the P concentration of ruminal fluid among the dietary P
treatments (Table 18). The lambs fed the low-P diet had lower (P<0.05) ruminal fluid P than
lambs that received P supplementation. The P concentration of the ruminal fluid was also lower
(P<0.05) for those lambs fed the diet supplemented with inorganic P, compared to the lambs fed
the diets supplemented with organic P. Comparisons between the two sources of organic P
indicate higher (P<0.001) ruminal fluid P for lambs fed the CSM supplemented diet, compared
to those receiving phytic acid supplementation. Within the organic P sources, supplementation
with dietary phytase increased the P in the ruminal fluid (P<0.04).
The ruminal fluid P values reported in this study are somewhat lower than the values
reported by Kirk et al. (1985). The lower ruminal fluid P in the lambs receiving the low-P diet
reflects the lower P intake by these lambs. Because the lambs fed the diet with inorganic P
supplementation had lower ruminal fluid P than the lambs fed the diets with organic P
supplementation, this is an indication that ruminants utilize organic P as well as inorganic P.
Higher ruminal fluid P for the lambs receiving the diets with organic P supplementation and
dietary phytase compared to those receiving organic P alone is evidence that supplemental
phytase may hasten hydrolysis of the phytate molecule and improve organic P utilization by
ruminants.
Blood Serum Minerals
Blood serum concentration of P (Table 19) was lower (P<0.04) for the lambs fed the low-
P diets compared to the lambs fed the diets with P supplementation. There were no other
differences in the serum P concentration between treatments, but there are some interesting
trends. Within sources of organic P supplementation, the lambs fed CSM diets had higher serum
P than those fed phytic acid (P<0.06). There was also a trend for phytase supplementation to the

63
Table 19. Serum mineral levels of lambs fed different diets
Supplemental phosphorus Inorganic Phytic acid Cottonseed meal
Item Low P P - +a - +a SE
P (mg/dl)bcd 5.12 6.16 6.28 6.99 7.20 8.42 0.50
Ca (mg/dl)e 8.75 9.24 9.53 9.00 8.51 8.67 0.37
Mg (mg/dl)be 1.83 1.89 1.89 1.85 2.36 2.41 0.09
K (mg/dl)e 16.97 16.12 16.84 15.39 17.51 18.06 0.47
Cu (ppm)f 0.71 0.67 0.67 0.83 0.81 0.71 0.06
Zn (ppm)b 0.54 0.66 0.62 0.68 0.62 0.64 0.04 aSupplied 1000 U phytase / kg dietbNo phosphorus supplementation vs phosphorus supplementation (P<0.04)cPhytic acid vs cottonseed meal (P<0.06)dPhytase supplementation vs no phytase (P<0.12)ePhytic acid vs cottonseed meal (P<0.04)fInteraction between organic phosphorus source and phytase (P<0.02)

64
diets with organic P to increase the serum P (P<0.12). The range of serum P concentration for
the lambs in this study was 5.12 to 8.42 mg/dL.
Serum P is typically used as a diagnostic indicator of P status. Because serum mineral
concentrations can be altered by external influences such as feeding and level of excitement they
are not reliable indicators of mineral reserves. A review article (Engels, 1981) described the
serum P values of ruminants grazing P deficient pastures with or without P supplementation.
Based on the results of these studies, Engels (1981) estimated normal serum P concentration to
be between 4 to 8 mg/dL. NRC (1985) reported that serum P below 4 mg/dL indicates dietary
deficiency. Since the lambs receiving the low-P diet in the present study had serum P of 5.12
mg/dL, the serum P did not indicate a dietary deficiency. However, the mobilization of stored P
could have contributed to the P concentration of the serum. Results of the metabolism study by
Field et al. (1975) indicated that after 16 wk of being fed a P deficient diet lambs will exhibit
serum P at or below 4 mg/dL. The lambs in that study receiving adequate dietary P had serum P
concentrations of 10 mg/dL. The difference in the levels of serum P between that study and the
present work may be due to length of time the P deficient diet was fed. The lambs in the present
study received the experimental diets for 20 d, while the lambs used in the work by Field et al.,
received the experimental diets for 16 wk.
The serum Ca (Table 19) was higher (P<0.04) for lambs fed the phytic acid compared to
lambs fed the CSM diets. There were no other treatment effects on the serum Ca concentrations.
The serum Ca values reported for this study are consistent with the accepted normal range of 8 to
12 mg/dL. All of the serum Ca values in this study are greater than 8 mg/dL. Field et al. (1975)
reported serum Ca values greater than 8 mg/dL for lambs receiving adequate dietary Ca. The
difference in the serum Ca values for the lambs fed the phytic acid diets compared to the values

65
for the lambs fed the CSM diets is likely a response to the greater Ca intake for lambs fed the
CSM diet.
Serum Mg (Table 19) was higher (P<0.04) for the lambs receiving P supplementation
compared to those lambs fed the low-P diets. There was also a difference in the serum Mg based
on the source of organic P. Lambs fed CSM had higher (P<0.04) serum Mg than those fed
phytic acid. All of these differences appear to be related to higher Mg in the CSM diets. The
range of serum Mg in the present study is 1.83 to 2.41 mg/dL. The normal range described by
Engels (1981) is 2 to 5 mg/ dL. There appears to be no effect of P intake or phytase
supplementation on serum Mg.
The only difference in the serum concentration of K (Table 19) was between the sources
of organic P supplementation. Lambs fed the CSM supplemented diets had higher (P<0.04)
serum K than the lambs fed the diets supplemented with phytic acid. There was no effect of the
amount or chemical form of P supplementation on serum K. The elevated serum K for the lambs
receiving the CSM diets compared to those receiving the phytic acid diets was due to the
increased K intake of the lambs receiving the CSM diet.
There was a source of organic P X phytase supplementation interaction (P<0.02) in
serum Cu (Table 19). The addition of phytase to the phytic acid containing diet resulted in an
increase in serum Cu, but adding phytase to the CSM diet decreased serum Cu. The effect of
level of dietary P on serum Cu is similar to results reported for poultry (Sebastian, 1996). The
serum Cu of the broilers in that study was not changed based on amount of dietary P or phytase
supplementation. It is unclear why the results of this study indicate an improvement in Cu
utilization when phytase was added to the phytic acid diet, but declined when phytase was added
to the CSM diet.

66
The serum Zn (Table 19) levels were lower (P<0.04) for lambs receiving the low-P diet
than for the lambs receiving P supplementation. There are no differences in serum Zn based on
the form or source of supplemental P, and no effect of phytase supplementation on serum Zn.
The decrease in serum Zn for lambs fed the low-P diet is unlike the response of serum Zn to low
dietary P in broilers (Sebastian, 1996). The results of that study indicate no change in serum Zn
for broilers fed a P deficient diet. However, like the present study, there was also no effect of
phytase on serum Zn.
For swine there has been a reported phytase effect on serum Zn (Lei et al., 1993). Results
from that feeding study with weanling pigs showed that the addition of 1350 U/kg phytase to the
diet increased serum Zn to levels similar to the levels resulting from Zn supplementation.
Apparent Digestibility
Digestibility values for the DM, OM, CP, NDF, and ADF of the different experimental
diets are presented in Table 20. The DM digestibility was higher (P<0.002) for the phytic acid
supplemented diets, compared to the CSM supplemented diets. There were no treatment effects
on OM digestibility. As with the DM digestibility, the CP digestibility was higher (P<0.002) for
the phytic acid diets compared to the CSM diets. There is also a phytase effect on the
digestibility of the CP in the diets supplemented with organic P. Phytase supplementation to the
phytic acid diets improved the digestibility of CP, but CP digestibility was decreased when
phytase was added to the CSM diets (source of organic P X phytase interaction, P<0.008). The
digestibility of the NDF components of the experimental diets did not differ among treatments.
The ADF digestibility was higher (P<0.002) for the phytic acid supplemented diets compared to
the CSM diets.

67
Table 20. Apparent digestibility of diets fed to lambs
Supplemental phosphorus Inorganic Phytic acid Cottonseed meal
Component Low P P - +a - +a SE ------------------------------------- % -------------------------------------
Dry matterb 69.34 69.73 71.17 72.33 67.92 67.78 0.65
Organic matter 68.23 67.74 68.41 69.88 68.73 68.19 0.88
Crude proteinbc 77.72 77.09 77.89 79.76 69.78 67.92 0.74
NDF 42.11 42.21 45.58 47.66 42.86 44.46 1.77
ADFb 43.64 44.30 46.70 48.73 40.18 41.79 1.87aSupplied 1000 U phytase / kg dietbPhytic acid vs cottonseed meal (P<0.002)cInteraction between source of organic phosphorus and phytase (P<0.008)

68
While the present study indicates no effect of low dietary P on any of the digestibility
measurements, there have been reports of an effect of P intake on digestibility. Field et al.
(1975) reported decrease DM digestibility of diets low in P. A review article by Durand and
Komisarczuk (1988) summarized digestibility results from various studies in which low-P diets
were fed to ruminants. The studies discussed in the review article suggest decreased cell wall
digestibility for low-P diets. An explanation for the discrepancy between these studies and the
current study could be the P recycling through the saliva. As stated previously, there was no
difference in saliva P between the treatments in this study. The salivary P that enters the rumen
of the lambs fed the low-P diet could have compensated for the lower P intake.
The digestibility of the different components reported for the present study are similar to
results reported previously by researchers examining the affects of feeding CSM to ruminants.
Zinn et al. (1997) reported a decrease in OM digestibility and starch digestibility with increasing
levels of CSM fed to feedlot cattle. The decrease in the apparent digestibility of DM and ADF
associated with CSM in this experiment reflects the increased fiber concentrations of these diets.
The decrease in CP digestibility of the CSM diets compared to the phytic acid diets is a
reflection of the difference between the purified soy protein and CSM as protein sources. The
increased digestibility of CP in the phytic acid diets supplemented with phytase indicates that the
previously discussed increase in ruminal fluid P for these lambs may have enhanced ruminal
microorganism activity.
Ruminal Fluid pH and Volatile Fatty Acids
Ruminal fluid pH (Table 21) was not affected by dietary treatment. The pH range of 6.34
to 6.61 indicates that the ruminal fluid pH was normal across all treatments, and reflects the
composition of the diets (Owens and Goetsch, 1988). The inclusion of roughage in the form of
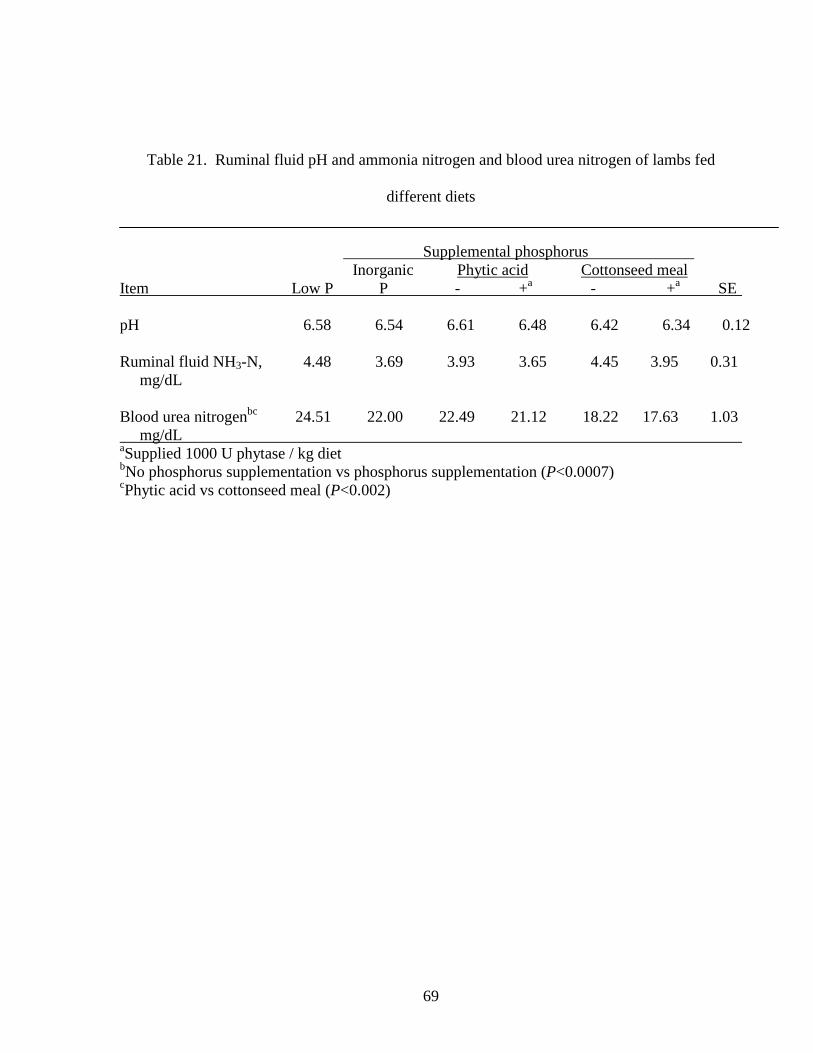
69
Table 21. Ruminal fluid pH and ammonia nitrogen and blood urea nitrogen of lambs fed
different diets
Supplemental phosphorus
Inorganic Phytic acid Cottonseed mealItem Low P P - +a - +a SE
pH 6.58 6.54 6.61 6.48 6.42 6.34 0.12
Ruminal fluid NH3-N, 4.48 3.69 3.93 3.65 4.45 3.95 0.31 mg/dL
Blood urea nitrogenbc 24.51 22.00 22.49 21.12 18.22 17.63 1.03 mg/dL aSupplied 1000 U phytase / kg dietbNo phosphorus supplementation vs phosphorus supplementation (P<0.0007)cPhytic acid vs cottonseed meal (P<0.002)

70
straw in the diets maintains a higher pH than would be seen if the diets had been higher in
concentrates. There were no treatment differences for total volatile fatty acids for the lambs in
this study (Table 22). The acetate, propionate, and butyrate levels are similar across treatments.
Isobutyrate was higher (P<0.0009) for the lambs fed the low-P diet compare to the lambs
receiving P supplementation. Also, isobutyrate was higher (P<0.0003) for phytic acid fed lambs
than for CSM fed lambs. Isovalerate was higher (P<0.0009) for the lambs fed the low-P versus
the P supplemented diets. Lambs fed the phytic acid diets had higher (P<0.0003) isovalerate
than the lambs fed the CSM diets. Valerate was higher (P<0.0009) among the lambs fed low-P
compared to the lambs fed one of the P supplemented diets. The ratio of acetic:propioinc:butyric
acid for the lambs in this study was approximately 50:20:20, and did not differ among dietary
treatments. According to Owens and Goetsch (1988), this ratio is between the expected ratios
for concentrate diets (50:40:10) and roughage diets (65:25:10). The differences between dietary
treatment in the concentrations of isobutyrate, isovalerate, and valerate appear to be attributable
to the lower concentrations of these VFAs for the lambs fed the CSM diets.
Ruminal Fluid Ammonia Nitrogen and Blood Urea Nitrogen
There was no treatment effect on the rumen NH3-N levels for the lambs in this study
(Table 21). The BUN (Table 21) was higher (P<0.0007) for the lambs fed the low-P diet
compared to the lambs fed one of the P supplemented diets, and was higher (P<0.002) for the
lambs fed the phytic acid diets compared to the CSM diets. Both of these differences in BUN
can be attributed to the lower CP digestibility of the CSM diets. There was no effect of phytase
on the BUN of the lambs.

71
Table 22. Molar proportions of volatile fatty acids in ruminal fluid of lambs fed different diets
Supplemental phosphorus
Inorganic Phytic acid Cottonseed mealItem Low P P - +a - +a SE
Total VFA, µmol/mL 109.85 97.02 99.86 98.37 104.96 109.72 9.38
Individual VFA, mol/100 mol
Acetic 48.89 54.81 54.00 54.69 54.54 49.75 2.57
Propionic 19.65 19.15 23.28 20.77 25.48 24.93 2.77
Isobutyricbc 0.53 0.36 0.31 0.30 0.17 0.22 0.06
Butyric 22.94 17.63 13.78 17.57 15.89 19.73 3.21
Isovalericbc 1.03 0.81 0.89 0.66 0.32 0.29 0.09
Valericb 7.62 5.34 4.93 4.96 2.79 3.57 1.11 aSupplied 1000 U phytase / kg dietbNo phosphorus supplementation vs phosphorus supplementation (P<0.0009)cPhytic acid vs cottonseed meal (P<0.0003)
72
Nitrogen Balance
The N balance data by the lambs in this study are presented in Table 23. The intake
values indicate that there was an interaction (P<0.01) between phytase supplementation and the
source of organic P on the N intake. The fecal excretion of N was higher (P<0.04) for lambs fed
the P supplemented diets compared to that of the lambs fed the low-P diet and higher (P<0.002)
for lambs receiving organic P supplementation versus the lambs receiving inorganic P
supplementation. These differences are due to the higher (P<0.0001) fecal excretion of N for the
lambs fed the CSM diets compared to the lambs fed the diets supplemented with phytic acid.
When the N absorption was expressed as g/d, the lambs fed the CSM diets absorbed less
(P<0.0001) N than those fed the phytic acid diets.
Nitrogen absorption was lower (P<0.04) for the lambs receiving P supplementation than
for the lambs fed the low-P diet. There was also an interaction between source of organic P and
phytase supplementation (P<0.01). The addition of phytase to the phytic acid diets resulted in
higher N absorption, but the absorption declined when phytase was added to the CSM diet. This
effect may be due to the increase in N intake for lambs receiving the phytic acid diet
supplemented with phytase, and the decrease in N intake for the lambs receiving the CSM diets
plus phytase. As a percent of intake, N absorption was higher (P<0.04) for the lambs fed the
low-P diet compared to those receiving P supplementation and was greater (P<0.002) when the
lambs received inorganic versus organic P supplementation. Once again, these differences
appear to be due to lower values for the lambs receiving the CSM diets. The N absorption, as a
percent of intake, was less (P<0.0001) for the lambs receiving CSM than for the lambs receiving
phytic acid. Also, as with percent N absorption, when expressed as g/d, there was an interaction

73
Table 23. Nitrogen balance by lambs fed different diets
Supplemental phosphorus
Inorganic Phytic acid Cottonseed mealItem Low P P - +a - +a SE
Intake (g/d)b 12.56 12.56 12.52 13.02 12.97 12.41 0.10
Excretion (g/d)
Fecalcde 2.80 2.88 2.77 2.63 3.92 3.98 0.09
Urinary 6.05 7.56 6.81 7.15 6.08 7.94 0.73
Total 8.85 10.43 9.58 9.78 10.00 11.92 0.71
Apparent absorption
g/dbce 9.76 9.68 9.75 10.39 9.05 8.43 0.12
% of intakebcde 77.72 77.09 77.89 79.76 69.78 67.92 0.74
Retention
g/d 3.71 2.12 2.94 3.24 2.97 0.49 0.72
% of intake 29.58 17.04 23.29 24.89 22.97 3.93 5.71aSupplied 1000 U phytase / kg dietbInteraction between source of organic phosphorus and phytase (P<0.01)cNo phosphorus supplementation vs phosphorus supplementation (P<0.04)dInorganic phosphorus supplementation vs organic phosphorus supplementation (P<0.002)ePhytic acid vs cottonseed meal (P<0.0001)

74
(P<0.01) between the source of organic P and phytase supplementation. Phytase
supplementation to the phytic acid diets resulted in increased N absorption, but when phytase
was added to the CSM diet there was a decrease in the percent N absorbed. There were no
treatment affects on the retention of N.

75
General Discussion
These two experiments were conducted to test the effect of simple P deficiency on steer
performance, and to examine possible methods of improving P absorption and utilization by
ruminants. The motivation for these studies was to investigate nutritional strategies to reduce the
amount of P released into the environment by agricultural production systems. First, it was
theorized that a moderate reduction in dietary P would have no effect on animal performance.
Secondly, while the general assumption is that P utilization by ruminants is the same between
organic and inorganic sources of P, a thorough investigation of the literature indicated
discrepancies to this assumption. It was concluded that if there was a true difference in P
utilization by ruminants due to chemical form or source of dietary P that proper feed
management could decrease P excretion by ruminants. Finally, if there was depressed utilization
of organic P, research in swine and poultry nutrition indicates that this could be overcome with
phytase supplementation.
In Exp. 1 of the present study there was no effect on steer ADG when the dietary P was
reduced by 25% below the requirement. There was also no decrease in feed intake or feed
efficiency associated with low-P intake. In fact, the steers fed the low-P diet had greater
(P<0.05) cumulative daily feed intake. The sheep fed the low-P diet in Exp. 2 did have lower
(P<0.005) P absorption as a percent of intake when compared to the lambs fed the supplemented
diets. The lambs with the lower P intake had lower (P<0.005) fecal excretion of P. This
decrease in fecal P could have positive environmental implications, without adversely affecting
performance. For example, in Exp. 1, lowering the P intake below the NRC (1996) requirement
did not affect performance. This supports similar finding by Call et al. (1986) in which
76
performance of heifers was not affected by dietary P level that was 66 % of the NRC
recommendation. The balance data from Exp. 2 indicated no differences in P absorption
between the different supplements. There was also no improvement of P absorption with
phytase supplementation.
The steers fed the low-P diet in Exp. 1 had final serum P of 5 mg/dL. The lambs fed the
low-P diet in Exp. 2 had serum P of 5.12 mg/dL. These values were lower (P<0.04) than the
serum P values for animals receiving P supplementation, but were greater than the 4 mg/dL that
is reported to indicate dietary P deficiency (NRC, 1996). The serum P values tended to differ
between sources of organic P and with phytase supplementation in Exp. 2. Lambs fed the phytic
acid supplemented diets had lower (P<0.06) serum P than the lambs fed the CSM diets. For both
sources of organic P there was a trend for phytase to increase (P<0.12) the serum P. The
difference in serum P values between lambs fed the phytic acid diets and those fed the CSM diets
may be explained by the difference in P intake between these groups of lambs (P<0.001).
However, the trend for increased serum P when phytase was added to both the phytic acid and
CSM diets shows a possible improvement in the utilization of organic P with supplemental
phytase. These results also support previous reports that serum P is a better indicator of P intake
than of P status (Read et al., 1986).
In Exp. 2 there was no treatment effect on saliva P concentration. This would suggest
that salivary P is constant across chemical form and source of P and is not enhanced by phytase
supplementation. This could, however, be an erroneous conclusion. Because the total saliva
secretion was not quantified it is impossible to compare these values. Individuals may secrete
varying amounts of saliva and some diets may stimulate more saliva production compared to the

77
others. Because there were no differences in P secreted in the saliva, then an increase in total
saliva production would indicate an increase in the flow of P.
The ruminal fluid P from the lambs in Exp. 2 did differ across dietary treatments. The
low-P diet did result in lower (P<0.05) ruminal fluid P than the diets with P supplementation.
Lambs fed organic P supplementation exhibited higher (P<0.05) ruminal fluid P than the lambs
fed inorganic P supplementation, and the lambs fed CSM had higher (P<0.001) ruminal fluid P
than the lambs fed the phytic acid diets. These differences in ruminal fluid P imply a difference
in the utilization of P from the different sources. Increased ruminal fluid P may mean improved
P utilization. There was also an increase in the ruminal fluid P when phytase was added to the
phytic acid and CSM diets. This, like the trend for increased serum P, suggests that
supplemental phytase may improve P utilization by the ruminant.
As indicated by previous research (Read et al., 1986, Cohen 1974) one of the more
reliable indicators of P status is the characterization of the bone. There were no differences in
bone strength or ash content, but there were some interesting trends with the bone strength.
There was a tendency for lambs fed the phytic acid diets to have stronger (P<0.13) bones than
the lambs fed the CSM diets. There was also a trend for an interaction (P<0.07) between source
of organic P and phytase supplementation. Phytase supplementation to the phytic acid diet
tended to increase bone strength, while the addition of phytase to the CSMl diet tended to
decrease bone strength. Because these values for bone strength did not differ between the lambs
fed the low-P diet and those provided P supplementation, it can be concluded that the dietary
deficiency was not great enough or had not lasted long enough to alter the P status of these
lambs.

78
The combined results of these two experiments indicate that a short term reduction in
dietary P by as much as 25 % below the requirement does not affect performance or P status of
an animal. There also was not a drop of serum P below the critical level of 4 mg.dL. However,
there was a decrease in the absorptive efficiency of P when the dietary P was below that of the
requirement. There is no indication of the long-term effects of decreased absorptive efficiency
of P, but because P is an important component in so many physiological functions there could be
eventual clinical signs of this decline in absorption. The chemical form and source do not appear
to affect the absorption of P by ruminants.
79
Implications
Decreasing the dietary P to 25 % below the minimum requirement did not diminish steers
performance. The serum P of these steers did decrease with lowered P intake, but this was not
indicative of a physiological deficiency. Lowering the P intake of lambs by 25 % decreased P
excretion. Chemical form of P did not affect excretion or absorption of P. The findings of the
growth study agree with the conclusions of earlier studies in which low dietary P was provided to
growing animals. This study is also in agreement with earlier work that stated as the intake of P
declined, the absorptive efficiency of P declined. This could be an important tool in diet
formulation for different classifications of animals that may have a higher demand for P. Also,
by improving the utilization of the P that is absorbed it may still be possible to decrease the
amount of dietary P, thereby decreasing the P excretion. This is an area that deserves more
research in the interest of efficient animal production systems and environmental sustainability.

80
Literature Cited
AOAC. 1990. Official Methods of Analysis (15th Ed.). Association of OfficialAnalytical Chemists, Arlington, VA.
Axe, D.E. 1998. Phosphorus value in igredient sources examined. Feedstuffs.70(22):17-19,26-28.
Beecher, G.P. and B.K. Whitten. 1970. Ammonia determination: Reagent modificationand interfering compounds. Anal. Biochem. 36:243-251.
Breves, G. and B. Schröder. 1991. Comparative aspects of gastrointestinal phosphorusmetabolism. Nutr. Res. Rev. 4:125-140.
Briggs, H.M. and W.D. Gallup. 1949. Metabolism stalls for wethers and steers. J.Anim. Sci. 8:479-482.
Call, J.W., J.E. Butcher, J.L. Shupe, J.T. Blake, and A.E. Olson. 1986. Dietaryphosphorus for beef cows. Am. J. Vet. Res. 47:475-481.
Carpenter, S.R., N.F. Caraco, D.L. Correll, R.W. Howarth, A.N. Sharpley, and V.H.Smith. 1998. Nonpoint pollution of surface waters with phosphorus andnitrogen. Ecol. App. 8:559-568.
Challa, J. and G.D. Braithwaite. 1988. Phosphorus and calcium metabolism in growingcalves with special emphasis on phosphorus homeostasis 1. Studies of the effectof changes in the dietary phosphorus intake o phosphorus and calcium metabolism. J. Agric. Sci. (Camb.) 110:573-581.
Challa, J., G.D. Braithwaite, and M.S. Dhanoa. 1989. Phosphorus homeostasis ingrowing calves. J. Agric. Sci. (Camb.) 112:217-226.
Clark, W.D. Jr., J.E. Wolt, R.L. Gilbreath, and P.K. Zajac. 1986. Phytate phosphorusintake and phosphorus disappearance in the gastrointestinal tract of highproducing dairy cows. J. Dairy Sci. 69:3151-3155.
Cohen, R.D.H. 1973. Phosphorus nutrition of beef cattle. 2. Relation of pasture phosphorusto phosphorus content of blood, hair and bone of grazing steers. Aust. J. Exp. Agr. Ani.Husb. 13:5-8.
Daniel, T.C., A.N. Sharpley, and J.L. Lemunyon. 1998. Agricultural phosphorus andeutrophication: a symposium overview. J. Environ. Qual. 27:251-257.
Dutton, J.E. and J.P. Fontenot. 1967. Effect of dietary organic phosphorus on magnesiummetabolism in sheep. J. Anim. Sci. 26:1409-1414.

81
Engels, E.A.N. 1981. Mineral status and profiles (blood, bone and milk) of the grazingruminant with special reference to calcium, phosphorus and magnesium. S. Afr.J. Anim. Sci. 11:171-182.
Durand, M. and S. Komisarczuk. 1987. Influence of major minerals on rumen microbiota.J. of Nutr. 118:249-260.
Erickson, G.E., T.J. Klopfenstein, C.T. Milton, D. Hanson, and C. Calkins. 1999.Effect of dietary phosphorus on finishing steers performance, bone status,and carcass maturity. J. Anim. Sci. 77:2832-2836.
Field, A.C., N.F. Suttle, and D.I. Nisbet. 1975. Effects of diets low in calcium andphosphorus on the development of growing lambs. J. Agric. Sci. 85:435-442.
Fiske, C.H. and Y. Subbarow. 1925. The colorimetric determination of phosphorus. J.Biol. Chem. 66:375-380.
Garcia-Bojalil, C.M., C.B. Ammerman, P.R. Henry, R.C. Littell, and W.G. Blue. 1988.effects of dietary phosphorus, soil ingestion and dietary intake level on performance,phosphorus utilization and serum and alimentary tract mineral concentrations inlambs. J. Anim. Sci. 66:1508-1519.
Goering, H.K. and P.J. Van Soest. 1970. Forage fiber analyses (apparatus, reagents,procedures, and some applications). Agric. Handbook No. 379. ARS, USDA,Washington, DC.
Harper, A.F., E.T. Kornegay, and T.C. Schell. 1997. Phytase supplementation of low-phosphorus growing-finishing pig diets improves performance, phosphorusdigestibility, and bone mineralization and reduces phosphorus excretion. J.Anim. Sci. 75:3174-3186.
Han, Y.M., F. Yang, A.G Zhou, E.R. Miller, P.K. Zu, M.G. Hogberg, and X.G. Lei.1997. Supplemental phytase of microbial and cereal sources improve dietaryphytate phosphorus utilization by pigs from weaning through finishing. J.Anim. Sci. 75:1017-1025.
Judkins, M.B., J.D. Wallace, E.E. Parker, and J.D. Wright. 1985. Performanceand phosphorus status of range cows with and without phosphorussupplementation. J. Range Mgmt. 38:139-143.
Kirk, D.J., L.W. Greene, G.T. Schelling, and F.M. Byers. 1985. Effects of monensin onMg, Ca, P and Zn metabolism and tissue concentrations in lambs. J. Anim. Sci.60:1485-1490.

82
Logan, T.J. 1993. Agricultural best management practices for water pollution control:current issues. Agr. Ecosys. And Environ. 46:223-231.
Lei, X., P.K. Ku, E.R. Miller, D.E. Ullrey, and M.T. Yokoyama. 1993. Supplementalmicrobial phytase improves bioavailability of dietary zinc to weanling pigs.J. Nutr. 123:1117-1123.
Meek, B., L. Graham, and T. Donovan. 1982. Long-term effects of manure on soilnitrogen, phosphorus, potassium, sodium, organic matter, and water infiltrationrate. Soil Sci. Soc. Am. J. 46:1014-1019.
Miller, W.J., M.W. Neathery, R.P. Gentry, D.M. Blackmon, C.T. Crowe, G.O. Ware, andA.S. Fielding. 1987. Bioavailability of phosphorus from defluorinated and dicalciumphosphates and phosphorus requirement of calves. J. Dairy Sci. 70:1885-1892.
Morris, E.R. 1986. Phytate and dietary mineral bioavailability. In: E. Graf (ed.) PhyticAcid Chemistry and Applications, p. 57. Pilatus Press, Minneapolis, MN.
Morse, D. H.H. Head, C.J. Wilcox, H.H. Van Horn, C.D. Hissem, and B. Harris, Jr.1992. Effects of concentration of dietary phosphorus on amount and route ofexcretion. J. Dairy Sci. 75:3039-3049.
Mozaffari, M. and J.T. Sims. 1994. Phosphorus availability and sorption in an AtlanticCoastal plain watershed dominated by animal-based agriculture. Soil Sci. 157:97-107.
Muchovej, R.M.C., V.G. Allen, D.C. Martens, L.W. Zelazny, and D.R. Notter. 1986.Aluminum, citric acid, nitrilotriacetic acid, and soil moisture effects onaluminum and iron concentrations in ryegrass. Agron. J. 78:138-145.
NRC. 1985. Nutrient Requirements of Sheep (6th Ed.). National Academy Press,Washington, DC.
NRC. 1996. Nutrient Requirements of Beef Cattle (7th Ed.). National Academy Press,Washington, DC.
Owens, F.N. and A.L. Goetsch. 1988. Ruminal fermentation. In: D.C. Church, (ed) TheRuminal Animal: Digestive Physiology and Nutrition, p. 145. Waveland Press, Inc.,Prospect Heights, Ill.
Parry, R. 1998. Agricultural phosphorus and water quality: a U.S. environmentalprotection agency perspective. J. Environ. Qual. 27:258-261.
Punj, M.L., A.S. Kochar, and I.S. Bhatia. 1969. Utilization of phytin phosphorus by ruminalmicroorganisms. Indian Vet. J. 46:881-886.

83
Read, M.V.P., E.A.N. Engels, and W.A. Smith. 1986a. Phosphorus and the grazing ruminant.3. Rib bone samples as an indicator of the P status of cattle. S. Afr. J. Anim. Sci.16:13-17.
Read, M.V.P., E.A.N. Engels, and W.A. Smith. 1986b. Phosphorus and the grazing ruminant.4. Blood and faecal grab samples as indicators of the P status of cattle. S. Afr. J. Anim.Sci. 16:18-22.
SAS. 1989. SAS/STAT User’s Guide, Version 6 (4th Ed.), Volume 2. SAS InstituteInc., Cary, NC.
Scott, D., F.G. Whitelaw, W. Buchan, and L.A. Bruce. 1985. The effect of variationin phosphorus intake on salivary phosphorus secretion, net intestinal phosphorusabsorption and faecal endogenous phosphorus excretion in sheep. J. Agric. Sci.,Camb. 105:271-277.
Sebastian, S., S.P. Touchburn, E.R. Chavez, and P.C. Lague. 1996. The effects ofSupplemental microbial phytase on the performance and utilization of dietaryCalcium, phosphorus, copper, and zinc in broiler chickens fed corn-soybeanDiets. Poul. Sci. 75:729-736.
Sharpley, A., B. Foy, and P. Withers. 2000. Practical and innovative measures for thecontrol of agricultural phosphorus losses to water: an overview. J. Environ. Qual.29:1-9.
Sharpley, A.N. and S. Rekolainen. 1997. Phosphorus in agriculture and itsenvironmental applications. In: H. Tunney, O.T. Carton, P.C. Brookes,and A.E. Johnston (Ed.) Phosphorus Loss from Soil to Water. CABInternational, New York, NY.
Shupe, J.L., J.E. Butcher, J.W. Call, A.E. Olson, and J.T. Blake. 1988. Clinical signsand bone changes associated with phosphorus deficiency in beef cattle. Am. J.Vet. Res. 49:1629-1636.
Tamminga, S. 1996. A review on environmental impacts of nutritional strategies inruminants. J. Anim. Sci. 74-3112-3124.
Thieler, A., H.H. Green, and P.J. Du Troit. 1928. Studies in mineral metabolism III.Breeding of cattle on phosphorus deficient pasture. J. Agric. Sci., Camb.18:369-371.
Tillman, A.D. and J.R. Brethour. 1958. Utilization of phytin phosphorus by sheep.J. Anim. Sci. 17:104-112.

84
Van Horn, H.H., G.L. Newton, and W.E. Kunkle. 1996. Ruminant nutrition from anenvironmental perspective: factors affecting whole-farm nutrient balance. J.Anim. Sci. 74:3082-3102.
Van Soest, P.J. 1963. Use of detergents in the analysis of fibrous feeds. II. A rapidmethod for the determination of fiber and lignin. J. Assoc. Off. Agr. Chem.46:829-835.
Van Soest, P.J. and R.H. Wine. 1967. Use of detergents in the analysis of fibrous feeds.IV. The determination of plant cell wall constituents. J. Assoc. Off. Agr. Chem.50:50-55.
Weiss, W.P. 1993. Symposium: Prevailing concepts in energy utilization by ruminants.Predicting energy values of feeds. J. Dairy Sci. 76:1802-1811.
Wise, M.B., S.E. Smith, and L.L. Barnes. 1958. The phosphorus requirement of calves.J. Anim. Sci. 17:89-99.
Yanke, L.J., H.D. Bae, L.B. Selinger, and K.-J. Cheng. 1998. Phytase activity of anaerobicruminal bacteria. Microbiology. 144:1565-1573.
Yanke, L.J., L.B. Selinger, and K.-J. Cheng. 1999. Phytase activity of Selenomas ruminatium:a preliminary characterization. Letters in App. Micro. 29:20-25.
Yi, Z., E.T. Kornegay, V. Ravindran, M.D. Lindemann, and J.H. Wilson. 1996.Effectiveness of Natuphos® phytase in improving the bioavailabilities ofphosphorus and other nutrients in soybean meal-based semipurified dietsfor young pigs. J. Anim. Sci. 74:1601-1611.
Zinn, R.A., M Montano, E. Alvarez, and Y. Shen. 1997. Feeding value ofcottonseed meal for feedlot cattle. J. Anim. Sci. 75:2317-2322.

85
Vita
Rachel Kristina Shanklin was born to Danny B. and Sharon W. Crabtree on June 27,
1972, in Virginia Beach, Virginia. In March of 1980 she moved with her parents to Jonesboro,
Georgia. In June of 1987, she moved to the beef cattle and tobacco farm of her maternal
grandparents in Pennington Gap, Virginia. Here she was a member of the 1990 graduating class
from Lee High School. After high school she attended Virginia Polytechnic Institute and State
University where she earned a Bachelors of Science degree in Animal Science with a minor in
Agricultural Economics in May, 1994. At that time she was employed as a technician in the
Ruminant Nutrition Laboratory in the Animal and Poultry Sciences Department at Virginia
Polytechnic Institute and State University. In October, 1995, she married Jon A. Shanklin and
moved to his family’s dairy farm in Montgomery County, Virginia. She began working towards
a Master of Science degree in Animal and Poultry Sciences (Ruminant Nutrition) at Virginia
Polytechnic Institute and State University in August of 1997.
Rachel K. Shanklin