Effect of Fe ion concentration on corrosion of …...1 The effect of Fe ion concentration on...
36
General rights Copyright and moral rights for the publications made accessible in the public portal are retained by the authors and/or other copyright owners and it is a condition of accessing publications that users recognise and abide by the legal requirements associated with these rights. Users may download and print one copy of any publication from the public portal for the purpose of private study or research. You may not further distribute the material or use it for any profit-making activity or commercial gain You may freely distribute the URL identifying the publication in the public portal If you believe that this document breaches copyright please contact us providing details, and we will remove access to the work immediately and investigate your claim. Downloaded from orbit.dtu.dk on: Apr 25, 2020 Effect of Fe ion concentration on corrosion of carbon steel in CO2 environment Rogowska, Magdalena; Gudme, J.; Rubin, A.; Pantleon, Karen; Ambat, Rajan Published in: Corrosion Engineering, Science and Technology Link to article, DOI: 10.1179/1743278215Y.0000000029 Publication date: 2016 Document Version Peer reviewed version Link back to DTU Orbit Citation (APA): Rogowska, M., Gudme, J., Rubin, A., Pantleon, K., & Ambat, R. (2016). Effect of Fe ion concentration on corrosion of carbon steel in CO2 environment. Corrosion Engineering, Science and Technology, 51(1), 25-36. https://doi.org/10.1179/1743278215Y.0000000029
Transcript of Effect of Fe ion concentration on corrosion of …...1 The effect of Fe ion concentration on...
General rights Copyright and moral rights for the publications made accessible in the public portal are retained by the authors and/or other copyright owners and it is a condition of accessing publications that users recognise and abide by the legal requirements associated with these rights.
Users may download and print one copy of any publication from the public portal for the purpose of private study or research.
You may not further distribute the material or use it for any profit-making activity or commercial gain
You may freely distribute the URL identifying the publication in the public portal If you believe that this document breaches copyright please contact us providing details, and we will remove access to the work immediately and investigate your claim.
Downloaded from orbit.dtu.dk on: Apr 25, 2020
Effect of Fe ion concentration on corrosion of carbon steel in CO2 environment
Rogowska, Magdalena; Gudme, J.; Rubin, A.; Pantleon, Karen; Ambat, Rajan
Published in:Corrosion Engineering, Science and Technology
Link to article, DOI:10.1179/1743278215Y.0000000029
Publication date:2016
Document VersionPeer reviewed version
Link back to DTU Orbit
Citation (APA):Rogowska, M., Gudme, J., Rubin, A., Pantleon, K., & Ambat, R. (2016). Effect of Fe ion concentration oncorrosion of carbon steel in CO2 environment. Corrosion Engineering, Science and Technology, 51(1), 25-36.https://doi.org/10.1179/1743278215Y.0000000029
1
The effect of Fe ion concentration on corrosion of carbon steel in a CO2 environment Magdalena Rogowska a,b,*, Jonas Gudme a, Adam Rubin a, Karen Pantleon b, Rajan Ambat b
a National Oilwell Varco Denmark I/S, Flexible Pipe R&D, Priorparken 480, DK-2605 Brøndby, Denmark b Technical University of Denmark, Department of Mechanical Engineering, Produktionstorvet, Building 425, DK – 2800 Kongens Lyngby, Denmark *Corresponding author: Tel.: +45 41908465 E-mail address: [email protected]
ABSTRACT
In this work, the corrosion behavior of steel wires in solutions containing different concentrations of
Fe2+ was investigated by the linear polarization resistance method, while the evolution of pH was
monitored in-situ and changes of the Fe2+ concentration were monitored ex-situ. Characterization of
the corrosion scales was performed by using microscopic and diffraction techniques. Scale analysis
revealed that the passivation of samples, exposed to initially highly Fe2+ super-saturated solution,
occurred when a formation of a double layer took place, resulting in 30 times lower corrosion rate
compared to samples tested in solutions without initial Fe2+.
Keywords: Carbon Steel; Carbon Dioxide; Supersaturation; Linear Polarization Resistance; Scanning Electron Microscopy; X-ray diffraction; Passivation
1. Introduction
Flexible pipes consist of concentric layers of polymers and steel, which are not bonded together to
preserve the flexibility of the pipe.1 The fatigue life of flexible pipes, which is determined by the
fatigue performance of steel armours, is an important issue. The fatigue resistance of tensile
armours is determined by the applied stresses and operating corrosive environment.2 As a result of
diffusion of small molecules such as methane (CH4), carbon dioxide (CO2), hydrogen sulphide
(H2S), and water (H2O) through the inner liner into the annulus, corrosion of steel armours might
2
occur.1-3 The confined environment, which steel armours are exposed to in the annulus region, is
characterized by a low ratio of free water volume (V) to steel surface area (S), typically below 0,1
ml cm-2 (Ref. 3). Under corrosive conditions, the low V/S ratio results in a fast supersaturation of
Fe2+ in the liquid and corrosion rates are typically below 10 μm/year (Ref. 3). In the annulus region,
unlike bore conditions, there is no vigorous flow of water and even though the pipe moves due to
waves and water current, it is believed that conditions are relatively stagnant.
In the aqueous CO2 environment, the corrosion process of carbon steel occurs through an
electrochemical process, which involves dissolution of iron (Eq. 1) and cathodic evolution of
hydrogen.4 In the presence of CO2, the corrosion rate of carbon steel is increased by a
corresponding increase of the rate of the hydrogen evolution reaction.4-6 It has been reported4,5,7
that cathodic reactions, which take place in aqueous CO2 environment, contain two independent
reactions, such as hydrogen reduction (Equation 2) and carbonic acid reduction (H2CO3, Equation
3). It is, however, still not certain whether the H2CO3 is directly reduced or whether it dissociates to
form bicarbonate (HCO3-).
𝐹𝐹𝐹𝐹 → 𝐹𝐹𝐹𝐹2+ + 2𝐹𝐹− (1)
2𝐻𝐻+ + 2𝐹𝐹− → 𝐻𝐻2 (2)
2𝐻𝐻2𝐶𝐶𝑂𝑂3 + 2𝐹𝐹− → 𝐻𝐻2 + 2𝐻𝐻𝐶𝐶𝑂𝑂3− (3)
The most common corrosion product formed in an aqueous CO2 environment, is iron carbonate
(FeCO3). When the concentration of Fe2+ and CO32- exceeds the solubility limit, a formation of
FeCO3 takes place4,8-10 according to the reaction presented in equation 4.
𝐹𝐹𝐹𝐹2+ + 𝐶𝐶𝑂𝑂32− → 𝐹𝐹𝐹𝐹𝐶𝐶𝑂𝑂3 (𝑠𝑠) (4)
There are many factors which influence formation of FeCO3, and one of the most important is the
chemistry of the water4. The rate of FeCO3 precipitation is controlled by the crystal growth rate9 and
in order to ensure fast scale precipitation and, consequently, low corrosion rates, high

3
supersaturation (SR) with respect to FeCO3 must be provided as presented by equation 5, where Rgr
is the crystalline film growth rate and kgr is the crystal growth constant.6,9,11
𝑅𝑅𝑔𝑔𝑔𝑔 = 𝑘𝑘𝑔𝑔𝑔𝑔(𝑆𝑆𝑅𝑅 − 1)2 (5)
Supersaturation (Eq.6) is often described as a driving force for crystal growth12 and in order to have
a precipitation of FeCO3 it must be much larger than unity and the growth rate constant (kgr) must
be large as well9. SR, as shown from equation 6, is influenced by Fe2+ and CO32- concentrations.
The solubility product (Ksp) of FeCO3, which is also present in equation 6, depends on the
temperature and ionic strength.10
𝑆𝑆𝑅𝑅 =𝐶𝐶𝐹𝐹𝐹𝐹2+ 𝐶𝐶𝐶𝐶𝐶𝐶32−
𝐾𝐾𝑠𝑠𝑠𝑠 (6)
In order to ensure high SR and formation of protective FeCO3 scale, the concentration of Fe2+ and
pCO2 must be relatively high, and the pH should be larger than 5 (Ref.9). It has been reported13,14
that the Fe2+ concentration in the solution is one of the main factors that determine the kinetics of
FeCO3 formation and resulting corrosion rates. Results show13,14 that exposing samples to solutions
saturated or nearly saturated with Fe2+, lead to formation of protective FeCO3, while no
development of FeCO3 was seen in solutions with Fe2+ content below the solubility limit of FeCO3.
However, the kinetics of FeCO3 formation are also dependent on the exposing temperature. At room
temperature, the kinetics of scale formation are very slow, and longer times are needed to develop
protective scales, or a non-protective scale might be formed even when ensuring high SR of the
solution.9,15-17 Due to the high precipitation rate of FeCO3 at temperatures above 60oC, dense and
protective scales are formed even at low supersaturations and, consequently, low corrosion rates can
be achieved.4,8,12,15,16 It has been reported7,9,18-20 that the pH of the solution also has a big impact on
the scale formation and it influences the solubility limit of FeCO3 and resulting corrosion rates.
Nešić et al.9 have reported that in order for a FeCO3 precipitation to occur, the pH has to exceed a
4
critical value, which depends on Fe2+ concentration, temperature and ionic strength. When
increasing the pH, the concentration of H+ is decreased and the concentration of CO32- is increased.
It results in a lower solubility limit of FeCO3 (Ref.20) and consequently higher supersaturation,
which leads to faster and more protective scale precipitation.21-23 Videm and Dugstad14 have shown
that by increasing pH from 4.2 to 7 the corrosion rate was decreased by a factor of three in a
solution saturated with Fe2+. It is in clear contrast to solutions with low pH, where the solubility
limit of FeCO3 is higher and more Fe2+ is needed for forming FeCO3 (Ref.22). When uniform
corrosion of carbon steel takes place, the anodic and cathodic current densities are equal, which
indicates that Fe2+ and HCO3- are produced simultaneously in the same amounts and in the same
place.24 In the non-buffered solutions, where pH can spontaneously evolve, the pH is directly
related to the alkalinity of the solution, i.e. to the concentration of HCO3-, which is associated with
the amount of Fe2+ present in the solution.
The other very important factor which influences the scale formation is the volume to steel area
ratio (V/S ratio). The V/S ratio has a significant impact on the time needed to obtain high
supersaturation of Fe2+ in the solution. It has been reported3,15,17 that for tests performed with low
V/S ratio, the time needed to obtain high supersaturation of Fe2+, and thus to exceed the solubility
limit of FeCO3, was shorter compared to tests performed with high V/S ratio. Nevertheless, Rubin
et al.3 have reported that by exposing samples to V/S ratio of 40 ml cm-2 and a solution initially
super saturated with Fe2+, very low corrosion rates of 20 μm/year were observed, which were
comparable to corrosion rates (10 μm/year) obtained for samples exposed to low V/S ratio of 0.22
ml cm-2. These results are particularly important when performing corrosion fatigue testing on a
laboratory scale. In the corrosion fatigue tests, the low V/S ratio observed in the annulus is difficult
to obtain due to space limitations in the test vessel. Consequently, in order to simulate high
supersaturation of Fe2+, which is present in the annulus of a flexible pipe, samples are exposed to
5
solutions initially supersaturated with Fe2+. It is believed that the correct simulation of a confined
environment has a significant impact on the corrosion and, consequently, the fatigue behavior of
steel wires and therefore it is important to know the influence of the initial concentration of Fe2+ on
the fatigue resistance of steel wires. The work presented in this paper is part of a study on corrosion
fatigue mechanisms in aqueous CO2 environment. In order to distinguish the difference between the
impacts of corrosion processes from the impact of dynamic loading on the fatigue life of steel wires,
the first experiments were performed in load-free conditions and are presented in this paper. Further
results from the experiments performed in the same corrosive media, while testing samples
dynamically, will be published elsewhere.
The focus of this paper was to investigate the influence of the initial Fe2+ concentration and
corresponding alkalinity of the solution (HCO3-), together with the resulting pH value on the scale
morphology and the corrosion resistance of steels used in flexible pipes. Experiments were
performed with different initial Fe2+ and HCO3- concentrations under high supersaturated
conditions. Variation of corrosion rates as a function of exposure time were measured using linear
polarization resistance, which was performed during the entire corrosion tests in solutions saturated
with CO2 under atmospheric pressures at 20oC. The pH evolution was measured in-situ and
supported with measurements of Fe2+ concentrations. Electrochemical measurements were
supported with the analysis of corrosion scales using scanning electron microscopy and X-ray
diffraction studies. The commercial Multiscale model was used for thermodynamic calculations to
understand the limits of solubility of FeCO3 in presence of CO2 and compared with levels
determined experimentally.
6
2. Experiment
2.1. Experimental setup for corrosion testing
The experimental setup consisted of a de-aeration vessel, a pre-corrosion vessel, and an
electrochemical cell (Fig. 1). All vessels were made of glass and equipped with 316L steel tubing to
avoid any ingress of oxygen. The electrochemical cell contained a saturated calomel electrode (REF
421 Reference Electrode, Calomel) as a reference electrode, a platinum counter electrode with a
surface area of 310 cm2, and a rectangular carbon steel specimen as a working electrode with a
surface area of 6 cm2. Apart from the working electrode, the electrochemical cell had three
additional samples (each 49.5 cm2), which were used for the scale analysis and one weight loss
coupon used for mass loss determination (6 cm2). Additionally, the setup was equipped with a pH
electrode to monitor the pH changes during the entire test.
2.2. Material and specimen preparation
The material used for the electrochemical experiments was carbon steel with a composition of 0.77
wt-% C, 0.24 wt-% Si, 0.65 wt-% Mn, 0.17 wt-% P, 0.06 wt-% S, Fe as the balance. The yield
strength of the material is 1350 MPa. As-received, from cold rolling process (Ra = 0.38 ± 0.05 μm),
surface conditions are used for the experiment to simulate material conditions under use in flexible
pipes. Prior to each experiment, the electrode surface was thoroughly degreased with acetone,
cleaned with ethanol, and dried in a hot air flow.
2.3. Electrolyte solution
Electrochemical experiments were conducted in artificial seawater with a chemical composition
according to ASTM D1141 (Table 2), under 1 bar CO2 conditions. The flow rate of CO2 gas was
250 ml min-1. The temperature of the electrolyte solution was set to 20±1oC. The solution was de-
aerated in the de-aeration vessel by purging nitrogen gas until the oxygen content was lower than 5
ppb. The dissolved oxygen was measured by using optical oxygen sensor (Visiferm DO 225).
7
The whole setup was flushed with nitrogen in order to remove any oxygen. Electrochemical
experiments were carried out with four starting Fe2+ concentrations namely: 0 mg L-1, 370 mg L-1,
514 mg L-1, and 1300 mg L-1 (the last concentration refers to the high super-saturation condition).
The corresponding alkalinity (HCO3- concentration) of the test solutions is shown in Table 3. In
order to generate electrolytes containing different concentrations of Fe2+, steel wool was exposed to
de-aerated seawater under 1 bar CO2 in the pre-corrosion vessel for different periods of time. Due to
corrosion of the steel wool, the generation of Fe2+ together with HCO3- took place. When the
solution obtained a specific Fe2+ concentration, it was transported to the test vessel. The Fe2+
contents were measured by ultraviolet-visible spectrophotometry method using a Shimadzu UV-
1800 Spectrophotometer, with an error margin of 1 %. The pH of the test solutions was measured
using a pH meter (Mettler InPro4800i). The water free volume to steel area ratio was 24 ml cm-2
during all the experiments. The volume of the test solution was 3.8 L. In order to ensure the
homogenous bulk solution mixing, the electrolyte was stirred at 350 rev min-1. Details of test
solutions are listed in Table 3.
2.4. Electrochemical measurements
In order to perform electrochemical measurements, the CH Instruments Electrochemical Analyzer
potentiostat together with CHI602b software were used. Linear Polarization Resistance (LPR)
measurements were carried out as a function of exposure time on the same sample during continued
exposure. Potentials were scanned between - 20 to 20 mV vs. open-circuit potential at a scan rate of
0.166 mv s-1. All potentials were measured with respect to SCE. The intersection of the anodic and
cathodic part was measured as Ecorr.
The area-averaged corrosion current density is calculated according to equation 7, where B is the
Stearn-Geary constant, Rp is the polarization resistance and A is the area of the specimen.25 For
each tested sample, the B value was calibrated, so that the integral material loss, found from the
8
LPR measurements, fitted with the weight loss obtained experimentally (see Table 1). Depending
on the exposure conditions, the B values varied from 20 to 27 mV.
𝐼𝐼𝑐𝑐𝑐𝑐𝑔𝑔𝑔𝑔 = 𝐵𝐵𝑅𝑅𝑠𝑠𝐴𝐴
(7)
2.5.Scale analysis
To assess the morphology of the resulting corrosion scales, cross sections of the exposed samples
were metallographically prepared and investigated by means of scanning electron microscopy
(SEM, Zeiss EVO MS10) using secondary electrons (SE) and back-scattered electrons (BE).
Qualitative phase analysis of the corrosion products was performed by means of X-ray Diffraction
(XRD, Bruker AXS Diffractometer D8 Discover). Measurements were performed with Cr-Kα
radiation and carried out on the surface of the samples resulting in a penetration depth of up to 17
μm.
2.6. Thermodynamic calculations
Thermodynamic calculations were performed with the commercially available Multiscale model
(version 8.1) to calculate the solubility limit of FeCO3 and saturation ratio (SR) with respect to
FeCO3 (see Eq. 6), for different Fe2+ and corresponding HCO3- concentrations (see Table 4).
Calculations were performed for artificial seawater with a chemical composition according to the
ASTM D1141 standard (see Table 2) at 1 bar CO2 at 20oC.
3. Results
3.1. Thermodynamic calculations
9
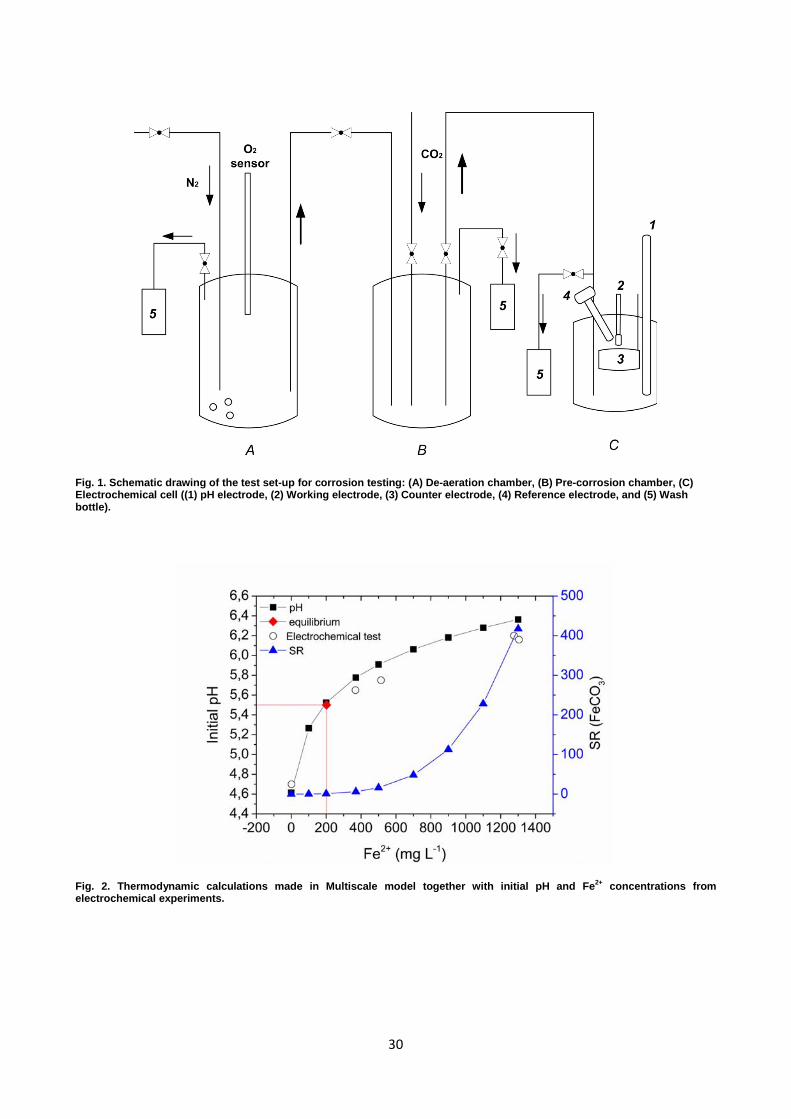
Fig. 2 presents thermodynamic calculations of pH and saturation ratio (SR) with respect to FeCO3
as a function of the initial Fe2+ and HCO3- concentration together with the experimental data
obtained from the solution analysis of the electrolyte used for electrochemical testing. The solubility
limit of FeCO3, calculated by the Multiscale model, in 1 bar CO2 at 20oC was equal to 202 mg L-1 of
Fe2+ and the pH 5.5. Results revealed that for all experiments of the present work, super saturated
conditions existed except for the experiment with initial pH of 4.7 and 0 mg L-1 of Fe2+. Calculated
results also showed that by increasing the initial Fe2+ and HCO3- content in the electrolyte, the SR
was similarly increased. It was shown that pH was increasing with Fe2+ concentration, which was
directly related to increasing HCO3- content in the solution. Overall, the pH measured from the
electrochemical experiments and the corresponding Fe2+ content were in a good agreement with the
calculations.
3.2. Electrochemical testing and electrolyte analysis
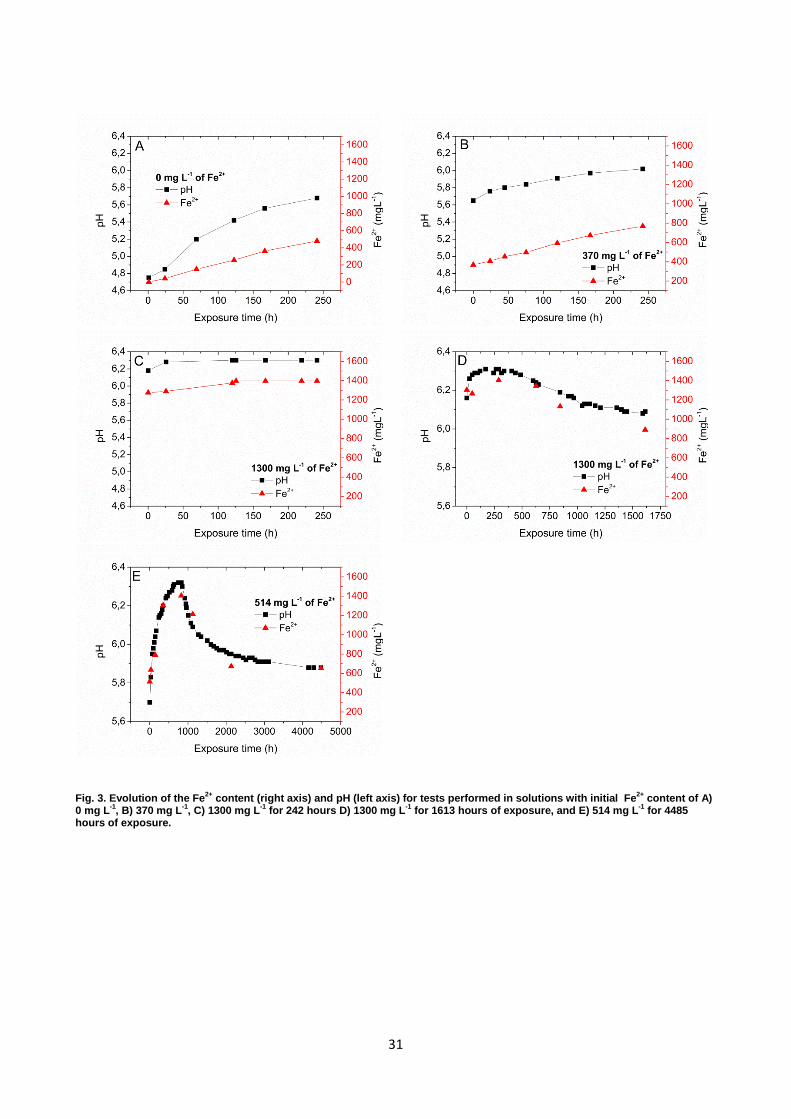
3.2.1. Evolution of Fe2+ and pH Fig. 3 presents the evolution of pH and Fe2+ as a function of exposure time in the solutions with
various initial Fe2+ concentrations. The trends of pH evolutions were observed to follow changes in
Fe2+ concentrations as a direct consequence of changing the HCO3- concentration in the solution.
Results from the tests without initial Fe2+ (Fig. 3 A) and with 370 mg L-1 of Fe2+ (Fig. 3 B) showed
that the pH increased simultaneously with an increase in the Fe2+ content in the solution during the
time of exposure. Results shown in Fig. 3 C (highly super saturated condition) showed that the pH
increased at the beginning of the test and stabilized after 125 hours. However, it should be noticed
that no data is available between 25 and 125 hours, so stabilization could have occurred earlier. For
the prolonged test with initially high super saturated conditions (Fig. 3 D) and 514 mg L-1 of Fe2+
(Fig. 3 E), pH increased until it reached a maximum level of 6.3 after 250 hours and 921 hours,
respectively, and it decreased with further exposure time and so the Fe2+ concentration does as well.
10
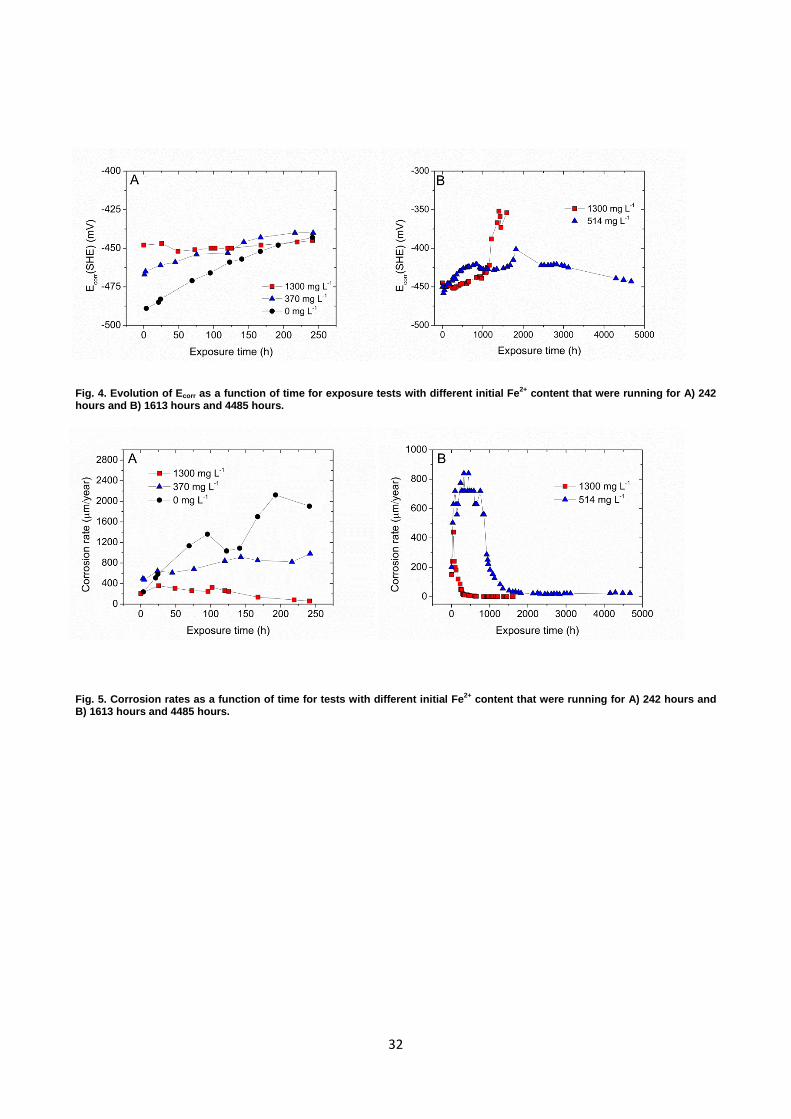
3.2.2. Evolution of the corrosion potential To further explore the impact of Fe2+ concentrations and pH changes on the electrochemical
behavior of the material and its scale formation, the evolution of the corrosion potential (Ecorr) was
analyzed. The curves in Fig. 4 clearly show that the initial Ecorr values were influenced by different
initial Fe2+ concentration in the corrosive media. The Ecorr value for the experiment with highest
concentration of Fe2+ in the solution had more positive potential in the beginning of the test
compared to potentials measured in solutions without initial Fe2+ and with 370 mg L-1 (Fig. 4 A).
For experiments without initial Fe2+ and with 370 mg L-1 of Fe2+, Ecorr increased as a function of
exposure time and stabilized after approximately 167 and 75 hours, respectively. For the sample
exposed to the highly supersaturated solution (1300 mg L-1), the measured potential revealed a
constant value of -450 mV during the whole test and after approximately 440 hours it started to drift
towards more positive values (Fig. 4 B). Further, the corrosion potential for the sample exposed to
the solution with 514 mg L-1 of Fe2+ (Fig. 4 B) increased at the beginning of the test, and after 1820
hours it began declining again reaching the final value of approximately -440 mV. The corrosion
potentials measured in the experiments are higher compared to the theoretical values obtained from
the Nernst equation, where the potential varies from -670 mV up to -580 mV for Fe2+ content of 1
mg L-1 and 1300 mg L-1, respectively. The calculated potentials represent theoretical equilibrium
conditions and in this case, only take the impact of the Fe2+ concentration on the obtained potential
into account. However, in the experiments presented in this paper, the equilibrium was not obtained.
Additionally, the potential obtained experimentally in the present tests, was not only influenced by
the concentration of Fe2+ but also by the formation of corrosion scale and its protective properties,
which could explain differences between experimentally measured and theoretical potentials.
3.2.3. Corrosion rates
11
Fig. 5 presents the corrosion rates as a function of exposure time for samples exposed to solutions
with various initial Fe2+ concentrations. The maximum corrosion rate was observed for samples
tested in solutions containing no initial Fe2+ (0 mg L-1), where the corrosion rate increased as a
function of time and reached 1905 µm/year (Fig. 5 A). The addition of 370 mg L-1 of Fe2+ to the
solution decreased the final corrosion rate to 981 µm/year (Fig. 5 A). A decrease of the corrosion
rate in CO2 environment with time was first observed when exposing samples to highly
supersaturated solution: corrosion rates of 60 µm/year were obtained after 242 hours (Fig. 5 A) and
1.5 µm/year after approximately 440 hours of exposure (Fig. 5 B), which correlates very well with
increasing corrosion potential after approximately the same time of exposure, as shown in
Fig. 4 B. Electrochemical experiments revealed that the time needed to obtain a decrease in
corrosion rate is considerably longer for the sample exposed to the solution with 514 mg L-1 (826
hours) than the one with 1300 mg L-1 (48 hours) (Fig. 5 B). It should be noticed that for samples
tested in a solution with an initial Fe2+ content of 514 mg L-1, a decrease in corrosion rate occurred
approximately at the same time when the maximum Fe2+ concentration and pH was reached, as
presented in Fig. 3 E.
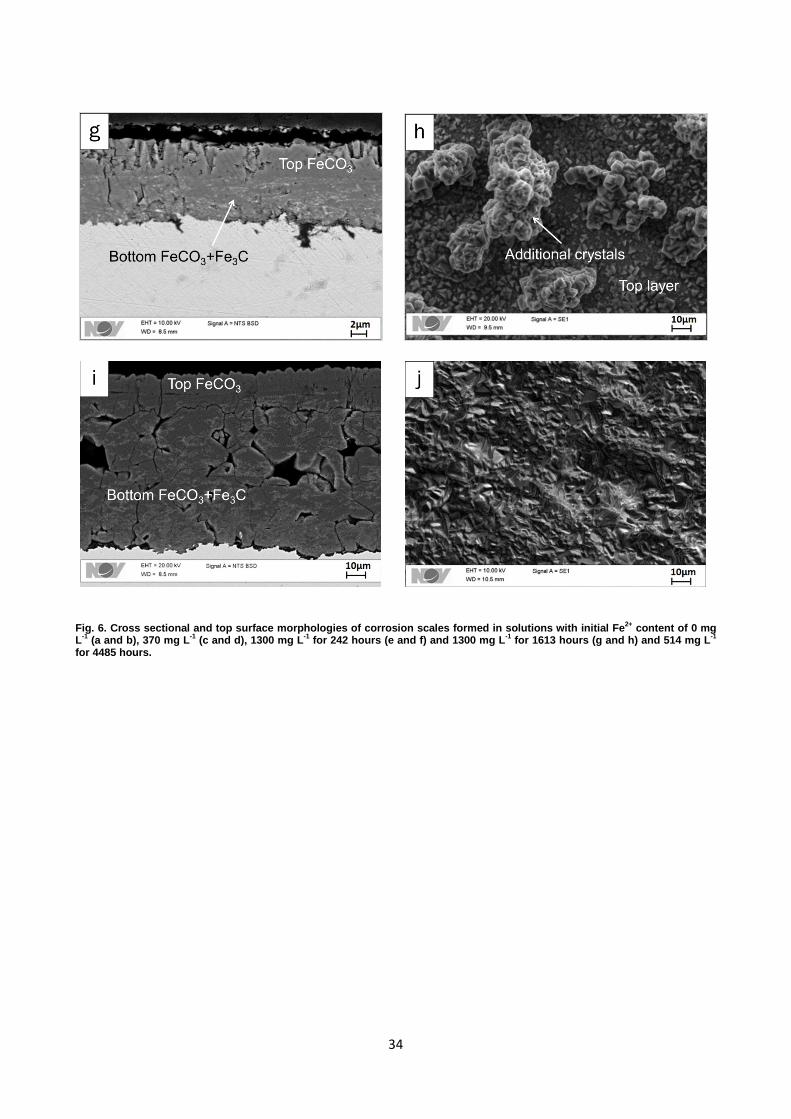
3.3. SEM and XRD analysis The top surface and cross-sectional morphologies of the corrosion scales formed in solutions with
various initial Fe2+ concentrations are shown in Fig. 6. The thickness of the layer decreased with
increase in initial Fe2+ content (~ 12 µm for solutions with no initial Fe2+ (Fig. 6 a) and ~5 µm in
highly super saturated environment (Fig. 6 e). Depending on the exposure conditions, the corrosion
scales exhibited differences in morphologies. For samples exposed to solutions without initial Fe2+
and with 370 mg L-1 of Fe2+ , the corrosion scales had similar characteristics and were composed of
light grey phases integrated in a darker matrix (Fig. 6 a and c). This indicated that there was a
12
chemical difference between these two regions and the corrosion layer must have contained two
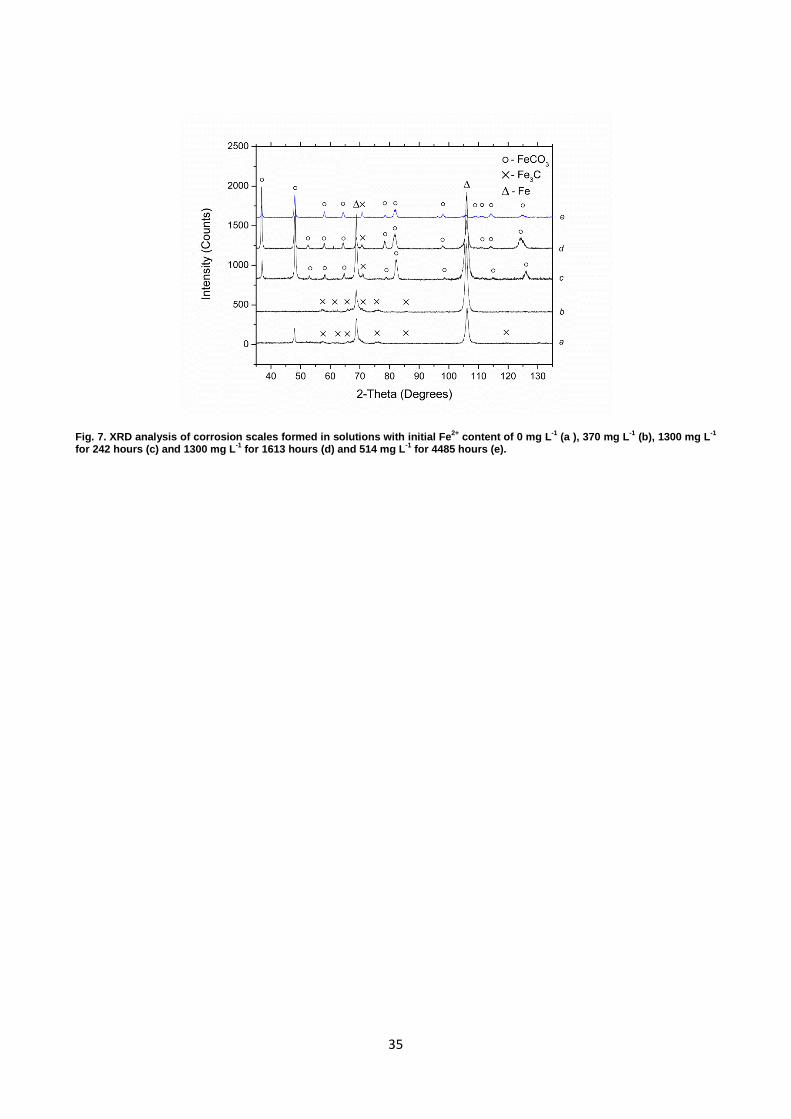
different phases. The XRD measurements (see Fig. 7) revealed many cementite (Fe3C) peaks for
samples exposed to solutions without Fe2+ and with 370 mg L-1 of Fe2+. A single FeCO3 peak was
also detected when testing with 0 mg L-1 of Fe2+, which is in contrast to the sample exposed to the
solution with 370 mg L-1 Fe2+, where no FeCO3 could be detected. Additionally, the top surface
scale analysis did not show characteristic FeCO3 crystals for samples exposed to 0 mg L-1 and 370
mg L-1 Fe2+ (see Fig. 6 b and d, respectively). This might indicate that either the crystals were too
small to see with the resolution used in this paper due to short exposure time, or there was another
corrosion product formed with a non-crystalline structure, which would not be detectible with XRD.
Consequently, it can be concluded that the corrosion scale formed in a solution with an initial Fe2+
of 0 mg L-1 and 370 mg L-1 consisted of Fe3C originating from the steel embedded in a corrosion
product, which could be FeCO3 (for 0 mg L-1 of Fe2+) or non-crystalline phase. Due to the higher X-
ray penetration depth (17 μm for high diffraction angles) compared to the thicknesses of these
scales, it cannot be excluded that some Fe3C was measured from the substrate of the material.
Surface analysis also revealed some cracks formed in the corrosion scales, which are seen in Fig. 6
b and d, which are mostly likely formed during preparation of the samples. When exposing the
samples to highly supersaturated solutions, a dense double-layered scale was formed (Fig. 6 e). It
consisted of an upper, homogeneous layer and a bottom, inhomogeneous layer, which was also
observed for samples tested in solutions with no initial Fe2+ and with 370 mg L-1 of Fe2+ (Fig. 6 a
and c, respectively), with light grey regions integrated in the darker matrix. The SEM analysis
revealed protrusions of corrosion products with more compact scale beneath (Fig. 6 f). The sample
exposed to highly super saturated solution for a prolonged time (Fig. 6 g) also showed the formation
of a double layer with additional protrusions on the top (Fig. 6 h). Due to extended exposure time,
13
the corrosion scale was approximately twice the thickness compared to the scale formed after
exposing for 242 hours.
Formation of a double-layered scale was also observed for the sample exposed to the solution
initially containing 514 m L-1 of Fe2+ (Fig. 6 i). The bottom layer was seven times thicker in the
solution with 514 mg L-1 (Fig. 6 i) than in 1300 mg L-1 of Fe2+ (Fig. 6 g). Many cracks and pores
were also present in the bottom part of the scale, while a compact and thin layer covering the
bottom layer was formed on the top (Fig. 6 i and j).
XRD results showed that a number of FeCO3 peaks with high intensities were detected for samples
exposed to highly super saturated solutions (Fig. 7 patterns c and d) and electrolytes with 514 mg L-
1 of Fe2+ (Fig. 7 e). This indicated that the volume fraction of this phase was much larger than
obtained for the two other scales formed in solutions without iron ions and 370 mg L-1 of Fe2+ (Fig.
7 a and b, respectively). Further, there was a shift in the position of a FeCO3 peaks for samples
exposed to highly super saturated solution (Fig. 7 d) and with 514 mg L-1 of Fe2+ (Fig. 7 e)
compared to peaks recorded for samples exposed to solutions without Fe2+ (Fig. 7 a) and with 370
mg L-1 Fe2+ (Fig. 7 b): peaks were shifted towards lower diffraction angles indicating changes of the
state of internal stresses, compared to those detected in pattern a and c in Fig. 7. The XRD
measurements also revealed the presence of Fe3C. However, only a single Fe3C peak with low
intensity was detected for samples tested in highly super saturated solutions (Fig. 7 c and d) and 514
mg L-1 (Fig. 7 e). Due to the large thickness of the corrosion scale formed in a solution with 514 mg
L-1 of Fe2+, compared to the maximum penetration depth of the X-ray beam (17 µm), it can be
concluded that the Fe3C phase was present in the corrosion scale. This, together with the observed
morphology of the corrosion scale, indicated that the bottom layer consisted of Fe3C integrated in a
FeCO3 matrix, while the top layer contained only FeCO3 phase, as shown in Fig. 6 i. This is also
applicable for double scales formed in highly super saturated solutions (Fig. 6 e and g) and
14
confirms the results discussed above, i.e. that the Fe3C measured from solutions with no Fe2+ and
370 mg L-1, indeed, originated from the corrosion scale and not the substrate.
4. Discussion Overall analysis of the results showed that the initial concentration of Fe2+ and HCO3
-, together with
resulting pH, in the solution had a significant impact on the electrochemical behavior of steel,
corrosion rate, and scale formation. It is important to emphasize that it is not the concentration of
Fe2+ that directly affects the corrosion rate, but the kinetics of scale formation and its morphology
are influenced by the initial concentration of Fe2+, as shown by the results.
It was shown that the general corrosion rate decreased when increasing the initial concentration of
Fe2+ in the solution, which is in agreement with formerly published results.3,13,14,17 Despite of the
formation of a relatively thick corrosion scale (12 μm), which was formed in solutions with no
initial Fe2+ and 370 mg L-1, the scale was not protective, which was reflected in the increasing
corrosion rates with the exposure time, even though the saturation level for FeCO3 was exceeded in
both tests. Current results, from the tests performed with initial Fe2+ concentration of 0 and 370 mg
L-1, confirm that protectiveness of the formed corrosion scale depends more on its structure and
morphology rather than on thickness and the scales formed at room temperature can be even 100
μm thick and still non-protective. 4,15,26 At room temperature, the process of FeCO3 precipitation is
much slower compared to high temperatures (above 60oC) and when the corrosion rate is faster than
the scale formation, a porous and non-protective corrosion layer is developed26. However, based on
the SEM analysis, no porosity was seen for scales formed in solutions with an initial Fe2+ of 0 mf L-
1 and 370 mg L-1. Han et al.22 have reported that due to non-uniform formation of a corrosion scale,
a galvanic effect between film-covered surface (cathode) and uncovered parts of metal surface
(anode) enhanced the corrosion rate of steel; this might have also taken place for samples tested in
15
solutions with an initial Fe2+ of 0 mg L-1 and 370 mg L-1, which would explain their increasing
corrosion rate with exposure time.
SEM analysis showed that for samples exposed to solutions with an initial Fe2+ of 0 mg L-1 and 370
mg L-1, a single corrosion layer was formed, which consisted of Fe3C embedded in a corrosion
product. XRD analysis, performed for samples exposed to solutions with 0 mg L-1 Fe2+ suggested
that the scale consisted of Fe3C embedded in FeCO3 matrix, which was also reported by Berntsen et
al.27. However, corrosion scale did not have typical FeCO3 crystals, which might indicate either that
the crystals, were too small to be seen with the used resolution, or that another corrosion product
was formed as well. It has been reported28, 29 that one of the corrosion products formed in aqueous
CO2 environment was ferrous hydroxide (Fe(OH)2), which might not have a crystalline structure
and thus could not be detected with XRD. Since both scales have a similar morphology, it is
expected that both scales consisted of Fe3C originating from the steel embedded in a corrosion
product of Fe(OH)2 and/or FeCO3. Cementite (Fe3C) is a second predominant phase in the corrosion
scale formed in aqueous CO2 environment. In a ferritic-pearlitic microstructure, cementite is
considered as non-corroding part of steel and may become a site for cathodic reactions30,31, which
lead to micro galvanic coupling between the Fe3C and ferrite (α-Fe) and consequently increasing
corrosion rates. This was confirmed by Mora-Mendoza et al.32, where it has been shown that the
corrosion rate of mild steel in CO2 solution with pH 5.5 increased with exposure time as a results of
un-oxidized Fe3C and its galvanic effect on the corrosion rate. Berntsen et al.27 have reported that
due to preferential dissolution of ferrite (α-Fe), Fe3C accumulates on the surface and becomes
embedded in the FeCO3 film. Crolet et al.24 that the main difference between protective and non-
protective morphologies of the corrosion scales formed in aqueous CO2 environment is the
presence of empty cementite (Fe3C) layer in contact with steel surface in case of non-protective
scales and fill of Fe3C network with FeCO3 in case of protective corrosion layers. However, despite
16
of a clear increase in corrosion rate, which indicated formation of non-protective scales for samples
tested in solutions with initial Fe2+ concentration of 0 mg L-1 and 370 mg L-1, no empty Fe3C layer
was observed close to the metal surface with the SEM resolution employed in this paper.
With the generation of the test solution with a high supersaturation of Fe2+ by corrosion of steel
wool under CO2 sparging, a large concentration of Fe2+ and the equivalent amount of HCO3- was
created. After transfer of the test solution to the test vessel, only the corrosion of the test specimens
could provide additional Fe2+ to the solution. It was shown that such conditions lead to a formation
of a protective corrosion scale and very low corrosion rates of 1.5 µm/year , in accordance with the
practical experience with flexible pipe. Decrease in corrosion rate was also seen in a solution
containing initially 514 mg L-1 of Fe2+, but the minimum corrosion rate of 25 µm/year was first seen
after 2324 hours.
Results from tests performed with solutions highly supersaturated with Fe2+, showed that a double
layer scale was formed. It was clear that high initial Fe2+ concentration facilitated formation of a
dense and protective scale, which was reflected in a decreased corrosion rate and increased (more
noble) corrosion potentials. These results are in a good agreement with already published data,23
where it was shown that by exposing samples to solution initially highly supersaturated with Fe2+,
thus by providing high SR, a rapid reduction of the corrosion rate was seen due to the formation of
protective corrosion layer. It is known that higher supersaturation of Fe2+ increases the rate of a
formation of FeCO3 scale,20 which might have also taken place when exposing samples to solutions
with Fe2+ of 1300 mg L-1, which would support the statement that high supersaturation of Fe2+ is
necessary for the formation of protective films.13,14 The thermodynamic calculations presented in
the present paper support this observation where the saturation ratio of FeCO3, which is a driving
force of scale formation,20 was much higher in solutions with 1300 mg L-1 (SR=417) than in
solutions with 370 mg L-1 (SR=6) and 514 mg L-1 of Fe2+ (SR=16).
17
Based on the detected phases by XRD measurements, it is likely that a bottom layer of corrosion
product consisted of Fe3C integrated in a FeCO3 matrix and the top layer contains only the FeCO3
phase. It has been reported31,33,34 that the formation of FeCO3 is associated with the steel
microstructure. The steel used for this investigation has a microstructure with a very fine dispersion
of Fe3C in ferrite with less than 10% by volume of carbide-free ferrite. Ferrite grains are relatively
small (2-5 μm) and widely distributed. According to Al-Hassan et.al30 and Sun et al.31, due to more
positive potential of Fe3C, cementite does not corrode and provides effective cathodes, thus in the
present steel cathodes are abundant even on the most local scales. Since the cementite (Fe3C) does
not dissolve, it will provide a good geometrical marker for the location of the original surface. With
the observed two-layer scale, the outer (top) layer consisting only of FeCO3 with no cementite may
have grown at least partly by precipitation from the solution, which could explain decreasing
concentration of Fe2+ in the electrolyte with time, as it was also reported by Berntsen et al.27 It
cannot, however, be excluded that Fe2+ may also be provided by diffusion from the steel side. The
present study does not allow a distinction between the two possible sources of Fe2+. It is believed
that the FeCO3 present in the bottom layer was primarily formed from the Fe2+ due to dissolution of
the steel substrate, which explains the presence of Fe3C originating from the steel in the scale, but
certainly Fe2+ present in the bulk solution also contributed to the process of scale formation. It is
suggested that the interface between the bottom and the top layer presents the original surface of the
material. The formation a double layer has been also reported by Dugstad et al.35 when exposing
steel armours used in flexible pipes to artificial seawater, with a high initial Fe2+ concentration of
2000 ppm, at 1 bar CO2. The corrosion layer consisted of an inner layer, which consisted of FeCO3
and Fe3C together with alloying elements originating from the steel, and an outer layer of FeCO3
precipitated from the Fe2+ in the solution. A similar morphology of the corrosion scale was also
reported by Gao et al.,36 where experimental and SEM results showed that by performing tests at 10
18
bar CO2 at 75oC and pH 6.5, a formation of double layer corrosion film took place. Similar to
current results, the two layers were divided by a straight line, which represented the initial surface
of the material. Gao et al.36 has reported that the layer formed closer to the metal surface had a two-
phase structure and a higher resistance compared to the outer homogenous layer. Results from
extended exposure to highly supersaturated solutions with Fe2+ showed that the scale became even
more protective with time. It is in a good agreement with formerly published results,12,37 where it
has been shown that the surface coverage percentage by FeCO3 increased with exposure time, and
at the same time the corrosion scale became denser and more protective.
Formation of a double layer, with a similar morphology compared to the scale formed in highly
supersaturated conditions, was also seen for the sample exposed to the solution with 514 mg L-1 of
Fe2+. However, the thickness of the bottom part of the scale was seven times larger than the one
formed in highly super saturated solution, which was also reflected in the extended time needed for
the corrosion rate to decrease. The XRD measurements revealed a shift in the position of FeCO3
peaks, similar to the pattern obtained for samples exposed to solutions initially highly super
saturated with Fe2+ for a prolonged time. The shift in the FeCO3 peaks position is most likely
related to the presence of compressive stresses in the formed scale. It might be that the level of
stress, which was high enough to be visible in a peak shift in XRD, could be first seen when the
thickness of the corrosion scale was larger due to longer exposure times. It has been suggested by
Nešić et al.23 that in order to form protective corrosion scales in solutions containing Fe2+ below
super saturated conditions, extended exposure times are necessary. Even though the current
experiment was running with Fe2+ concentration that was much higher than the solubility limit of
FeCO3 (202 mg L-1), as predicted by thermodynamic calculations, long exposure times of 2324
hours were needed to see formation of a protective corrosion layer and corresponding low corrosion
rates of 25 μm/year.
19
The results from prolonged exposure times in solutions with an initial Fe2+ of 514 mg L-1 of Fe2+
1300 mg L-1 showed a clear correlation between decreasing concentration of Fe2+ and decreasing
corrosion rates of tested samples. It was shown that for samples tested in a solution with an initial
Fe2+ of 514 mg L-1, a decrease of Fe2+ concentration occurred approximately at the same time when
the corrosion rate started to decrease, while for samples tested in a solution initially highly super
saturated with Fe2+ (1300 mg L-1), a decrease of Fe2+ was seen when a corrosion rate of 1.5 μm
year-1 was observed. It is important to emphasize that when the solution is highly super saturated
with respect to FeCO3, the precipitation of FeCO3 will occur on all available surfaces, including the
test vessel and its ancillaries, at the same time contributing to a long-term decrease in Fe2+
concentration and due to removed excess of HCO3- with the general CO2 gas bubbling, to a long-
term decrease of pH towards that predicted by thermodynamics for a solution saturated with FeCO3.
Consequently, observed decreasing concentration of Fe2+ in the solution cannot be directly used to
estimate the rate of scale formation, but the time when the Fe2+ concentration started to decrease, as
shown by current results, can be used as an indication when the protective scale starts to be formed,
which is reflected in decreasing corrosion rate.
Results from close packed experiments with free water volume to steel surface ratio (V/S) of 0.2 ml
cm-2 (Ref.3) showed that it is not the thickness of the electrolyte above the steel surface, but the
Fe2+ concentration in the solution that influences steel corrosion rates. Despite the high V/S ratio
(40 ml cm-2), materials exposed to highly super saturated conditions obtained similar corrosion rates
as those tested in the close packed conditions with a V/S of 0.2 ml cm-2 (as in the annulus of a
flexible pipe). However, the V/S ratio has a significant influence on the time, which is needed to
reach supersaturation of Fe2+ in the test solution when starting with a non Fe2+ containing
electrolyte. With lower V/S ratio, supersaturation with Fe2+, together with HCO3-, and the
corresponding maximum pH are reached faster compared to tests executed with high V/S ratio. It
20
has been reported by Rubin et al.3 that the maximum pH for V/S = 0.17 ml cm-2 was reached after
48 hours, whereas at V/S = 40 ml cm-2 peak values were first noticed after approximately 528
hours. Traditional electrochemical laboratory experiments are designed with a large V/S ratio (small
working electrode and large volume of electrolyte) and with relatively short test times. This means
that the chemistry (Fe2+ concentration) of the electrolyte changes slowly during the testing period
and consequently the behavior found in this work might never be experienced. It should also be
emphasized that in operating conditions, findings presented in this paper, will only apply for
conditions with no or low replenishment of corrosive media such as in confined conditions, which
are relevant for the present case.
Corrosion rates presented in this paper for highly super saturated conditions with Fe2+ correlated
very well with former results from close packed cell tests reported in the literature3, which show
that when performing closely packed cell tests, a high pH of 6.2 was obtained within 48 hours of
exposure. This is negligible compared to the lifetime of a flexible pipe which is typically 20-30
years. It can therefore be assumed that from the very beginning of the operation of the pipe, steel
wires, are exposed to highly supersaturated environment with Fe2+ during service. Consequently, it
is expected that the low corrosion rate found in this investigation for highly supersaturated solutions
is applicable to the annulus region for the entire life time of the flexible pipe.
It has been reported39-43 that when exposing materials to corrosive media, their fatigue life is
decreased compared to the air conditions. Consequently, the corrosive environment and the
resulting corrosion behavior of steel armours have a significant impact on the fatigue life of steel
armours situated in the annulus region and consequently the fatigue performance of the entire
flexible pipe. The results presented in this paper indicate that steel armours exposed to simulated
annulus conditions (high initial supersaturation) only experience high corrosion rates initially, while
after a short time the corrosion rate decreases to 1.5 μm/year, which has been also supported by
21
other authors.3,44-48 It indicates that the corrosion process of steel armours stops relatively quickly
after the water and corrosive gases (CO2) reach the annulus region. Consequently, when the
protective layer is formed and the corrosion rate decreases to almost zero, the corrosion process is
expected to have lower impact on the fatigue life of steel armours, which is beneficial for the
lifetime of a flexible pipe.
In order to predict fatigue damage of a flexible pipe, corrosion fatigue tests of steel armours are
performed on a laboratory scale. A correct simulation of the annulus conditions when performing
corrosion fatigue experiments, plays an important factor not only in predicting fatigue life of a
flexible pipe but also in optimizing its design. In the corrosion fatigue tests, the annulus conditions
are typically simulated by exposing steel armours to solution with high initial concentration of Fe2+.
However, the results presented in this paper show that even small changes in the initial Fe2+
concentration have a significant impact on the kinetics of scale formation and accordingly how fast
a decrease of corrosion rate of steel armours can be observed. Consequently, in order to ensure a
close simulation of the annulus conditions when performing corrosion fatigue testing, it is important
to expose steel armours to solution with high initial supersaturation of Fe2+.
5. Conclusion
1. Analysis of Fe2+ evolution showed that a decrease in Fe2+ and corresponding pH, was
directly related to a decrease in a corrosion rate of analyzed samples. A twice as fast
decrease in Fe2+ concentration and pH was observed in solutions initially highly super
saturated with Fe2+ compared to solutions with Fe2+ concentration marginally above the
solubility limit of FeCO3.
22
2. Analysis of the Fe2+ together with obtained corrosion rates for samples exposed to different
initial Fe2+, revealed that before protective FeCO3 can be formed, high supersaturation of
Fe2+ (~1300 mg L-1) needs to be built up in the solution.
3. Electrochemical measurements confirmed that the initial amount of Fe2+ in the solution had
a significant impact on the corrosion rate of steel materials. Results showed that high initial
supersaturation of Fe2+ is required for fast formation of protective layers and decrease of
corrosion rates close to 1.5 μm/year.
4. Metallographic and diffraction analysis showed that the morphology of the scale depended
on the initial exposure environment and exposure time. Samples exposed to the solution
without Fe2+ or in super saturated solution for a short exposure time, formed scales
consisting of Fe3C embedded in FeCO3, while under highly supersaturated conditions, the
scale showed a double layer with an inner layer of Fe3C embedded in FeCO3 and an outer
FeCO3 layer.
5. The results from experiments performed with simulated annulus conditions (high
supersaturation of Fe2+) showed fast decrease of corrosion rate to 1.5 μm/year, indicating
that the corrosion process stops relatively quickly after the water and CO2 gases reaches the
annulus region. The low corrosion rate of steel armours is believed to have a beneficial
impact on the fatigue life of a flexible pipe.
6. The results showed that small changes in initial Fe2+ have a large impact on the corrosion
rates of steel armours. Consequently, in order to correctly simulate annulus conditions, when
performing corrosion fatigue testing, high supersaturation of Fe2+ must be provided from the
beginning of the test.

23
Acknowledgements The authors would like to acknowledge InnovationsFonden in Denmark for providing financial
support in the project.
References [1] A. Rubin and J. Gudme: 'Qualification of Steel Wire for Flexible Pipes', NACE International,
Houston, TX, March 2006, Paper 06149.
[2] A. Rubin and J. Gudme: 'Test method for corrosion fatigue testing of cold rolled steel wire in
sour and sweet environment based on deflection controlled four point bending', NACE
International, Houston, TX, March 2009, Paper 09103.
[3] A. Rubin, S. Overby, T. S. Nielsen, M. Haahr, J. Gudme: 'Corrosion rates of carbon steel in
confined environments', NACE International, Houston, TX, 2012, Paper 01495.
[4] S. Nešić: 'Key issues related to modelling of internal corrosion of oil and gas pipelines – A
review', Corros. Sci., 2007, 49, 4308–4338.
[5] M. Nordsveen, S. Nešić, R. Nyborg, A. Stangeland: 'A Mechanistic Model for Carbon Dioxide
Corrosion of Mild Steel in the Presence of Protective Iron Carbonate Films-Part 1: Theory and
Verification', Corrosion, 2003, 59, 443–456.
[6] S. Nešić, R. Nyborg, A. Stangeland, M. Nordsveen: 'Mechanistic Model for CO2 Corrosion
with Protective Iron Carbonate Films', NACE International, Houston, TX, March 2001, Paper
01040.
[7] S. Nešić: 'An Electrochemical Model for Prediction of Corrosion of Mild Steel in Aqueous
Carbon Dioxide Solutions', Corrosion, 1996, 52, 280–294.
[8] S. Nešić, K.-L. J. Lee: 'A Mechanistic Model for Carbon Dioxide Corrosion of Mild Steel in the
Presence of Protective Iron Carbonate Films -Part 3: Film Growth Model', Corrosion, 2003, 59,
616-628.
24
[9] S. Nešić, M. Nordsveen, R. Nyborg: 'A Mechanistic Model for Carbon Dioxide Corrosion of
Mild Steel in the Presence of Protective Iron Carbonate Films -Part 2: A Numerical
Experiment', Corrosion, 2003, 59, 489-497.
[10] W. Sun, S. Nešić, R. C. Woollam: 'The effect of temperature and ionic strength on iron
carbonate (FeCO3) solubility limit', Corros. Sci., 2009, 51, 1273–1276.
[11] J. W. Mullin: Crystallization, 3rd ed. (Oxford Press, 1993), page 242.
[12] W. Sun, S. Nešić: 'Kinetics of Corrosion Layer Formation: Part 1—Iron Carbonate Layers in
Carbon Dioxide Corrosion', Corrosion, 2008, 64, 334–346.
[13] K. Videm, A. Dugstad: 'Corrosion of carbon steel in an aqueous carbon dioxide environment.
II: Film formation', Mater. Performance, 1989, 28, 46–50.
[14] K. Videm, A. Dugstad: 'Corrosion of carbon steel in an aqueous carbon dioxide environment. I:
Solution effects', Mater. Performance, 1989, 28, 63–67.
[15] A. Dugstad: 'The Importance of FeCO3 Supersaturation on the CO2 Corrosion of Carbon
Steels', NACE International, Houston, TX, March 1992, Paper 14.
[16] R. Nyborg and A. Dugstad: 'Mesa Corrosion Attack in Carbon Steel and 0.5 % Chromium
Steel', NACE International, Houston, TX, March 1998, Paper 29.
[17] B. Kinsella, Y. J. Tan, S. Bailey: 'Electrochemical Impedance Spectroscopy and Surface
Characterization Techniques to Study Carbon Dioxide Corrosion Product Scales', Corrosion,
1998, 54, 835–842.
[18] S. Nešić, G. T. Solvi, J. Enerhaug: 'Comparison of the Rotating Cylinder and Pipe Flow Tests
for Flow-Sensitive Carbon Dioxide Corrosion', Corrosion, 1995, 51, 773–787.
[19] V. Ruzic, M. Veidt, S. Nešić: 'Protective Iron Carbonate Films—Part 3: Simultaneous Chemo-
Mechanical Removal in Single-Phase Aqueous Flow', Corrosion, 2007, 63, 758–769.
25
[20] A. Dugstad: 'Fundamental Aspects of CO2 Metal Loss Corrosion - Part 1: Mechanism', NACE
International, Houston, TX, 2006.
[21] K. Chokshi, W. Sun, S. Nešić: 'Iron Carbonate Scale Growth and the Effect of Inhibition in
CO2 Corrosion of Mild Steel', NACE International, Houston, TX, 2005, Paper 05285.
[22] J. Han, B. N. Brown, S. Nešić: 'Investigation of the Galvanic Mechanism for Localized Carbon
Dioxide Corrosion Propagation Using the Artificial Pit Technique', NACE International,
Houston, TX, 2007, Paper 07323.
[23] S. Nešić, J. Lee, V. Ruzic: 'A Mechanistic Model of Iron Carbonate Film Growth and the
Effect on CO2 Corrosion of Mild Steel', NACE International, Houston, TX, 2002.
[24] J. L. Crolet, N. Thevenot, S. Nešić: 'Role of Conductive Corrosion Products in the
Protectiveness of Corrosion Layers', Corrosion, 1998, 54, 194–203.
[25] W. Stephen Tait: 'An Introduction to Electrochemical Corrosion Testing for Practicing
Engineers & Scientists', Pair O Docs Professionals, 1994.
[26] A. Dugstad: 'Mechanism of Protective Film Formation During CO2 Corrosion of Carbon Steel',
NACE International, Houston, TX, 1998, Paper 31.
[27] T. Berntsen, M. Seiersten, T. Hemmingsen: 'Effect of FeCO3 Supersaturation and Carbide
Exposure on the CO2 Corrosion Rate of Carbon Steel', Corrosion, 2013, 69, 601-613.
[28] J. Han, Y. Yang, S. Nesic, B. N. Brown: 'Roles of Passivation and Galvanic Effects in
Localized CO2 Corrosion of Mild Steel', NACE International, Houston, TX, 2008, Paper 08332.
[29] A. Pfennig, R. Wiegand, M. Wolf, C.-P. Bork: 'Corrosion and corrosion fatigue of AISI 420C
(X46Cr13) at 60 °C in CO2-saturated artificial geothermal brine', Corros. Sci., 2013, 68, 134–
143.
[30] S. Al-Hassan, B. Mishra, D. L. Olson, M. M. Salama: 'Effect of Microstructure on Corrosion of
Steels in Aqueous Solutions Containing Carbon Dioxide', Corrosion, 1998, 54, 480–491.
26
[31] J. B. Sun, G.A. Zhang, W. Liu, M.X.Lu: 'The formation mechanism of corrosion scale and
electrochemical characteristic of low alloy steel in carbon dioxide-saturated solution', Corros.
Sci., 2012, 57, 131–138.
[32] J. L. Mora-Mendoza, S. Turgoose: 'Fe3C influence on the corrosion rate of mild steel in
aqueous CO2 systems under turbulent flow conditions', Corros. Sci., 2002, 44, 1223–1246.
[33] M. Ueda, A. Ikeda:' Effect of Microstructure and Cr Content in Steel on CO2 Corrosion',
NACE International, Houston, TX, March 1996, Paper 13.
[34] D. A. López, T. Pérez, S. N. Simison: 'The influence of microstructure and chemical
composition of carbon and low alloy steels in CO2 corrosion. A state-of-the-art appraisal',
Mater. Des., 2003, 24, 561–575.
[35] A. Dugstad, L. Børvik, S. Palencsar, P. A. Eikrem: 'Corrosion Testing of Steel Armour Wires
in Flexible Pipes- A parametric Study', NACE International, Houston, TX, March 2015, Paper
5829.
[36] M. Gao, X. Pang, K. Gao: 'The growth mechanism of CO2 corrosion product films', Corros.
Sci., 2011, 53, 557–568.
[37] Y. Zhang, X. Pang, S. Qu, X. Li, K. Gao: 'Discussion of the CO2 corrosion mechanism
between low partial pressure and supercritical condition', Corros. Sci., 2012, 59, 186–197.
[38] G. Schmitt: 'Fundamental Aspects of CO2 Metal Loss Corrosion - Part II: Influence of
Different Parameters on CO2 Corrosion Mechanisms', NACE International, Houston, TX, 2006.
[39] A. Félix-Henry: 'Prevention and Monitoring of Fatigue-Corrosion of Flexible Risers’ Steel
Reinforcements', Proceedings of the 26th International Conference on Offshore Mechanics and
Arctic Engineering, San Diego, California, US, June 2007, Paper 29186.
[40] R. Akid: 'Corrosion fatigue', Shreir’s Corrosion, 2010, 928–953.
[41] Y. Z. Wang: 'Corrosion Fatigue', Uhlig’s Corrosion Handbook, 3rd edn, 2011, 195–202.
27
[42] R. A. Y. Wang, R. Akid: 'Role of Nonmetallic Inclusions in Fatigue, Pitting, and Corrosion
Fatigue', Corrosion, 1996, 52, 92–102.
[43] J. Congleton, I. H. Craig, R. A. Olieh, R. N. Parkins: 'Some electrochemical and
microstructural aspects of corrosion fatigue', 367-389, 1983, American Society for Testing and
Materials.
[44] F. Ropital, C. Condat-Taravel, J. N. Saas, C. Duret: 'Methodology to Study the General
Corrosion of Steel Armours in Simulated Conditions of Flexible Pipe Aannulus Influence of
Confinement and Evaluation of the pH', The European Corrosion Congress, Moscow, Russia,
September 2000.
[45] C. Taravel-Condat, N. Desamais: 'Qualification of High Strength Carbon Steel Wires for Use
in Specific Annulus Environment of Flexible Pipes Containing CO2 and H2S', Proceedings of
the 25th International Conference on Offshore Mechanics and Arctic Engineering, Hamburg,
Germany, June 2006, Paper 92394.
[46] E. Remita, F. Ropital, J. Kittel: 'Experimental and Theoretical Investigation of the Uniform
Corrosion in the Annulus of Offshore Flexible Pipelines', NACE International, Houston, TX,
March 2008, Paper 08538.
[47] E. Remita, B. Tribollet, E. Sutter, F. Ropital, X. Longaygue, J. Kittel, C. Taravel-Condat, N.
Desamais: 'A Kinetic Model of CO2 Corrosion in the Confined Environment of Flexible Pipe
Aannulus', The European Corrosion Congress, Freiburg, Germany, September 2007.
[48] R. Clements: 'Corrosion Assessment Prediction for a Confined Flexible Pipe Annulus', The
European Corrosion Congress, Edinburgh, Scotland, September 2008.
28
List of table captions
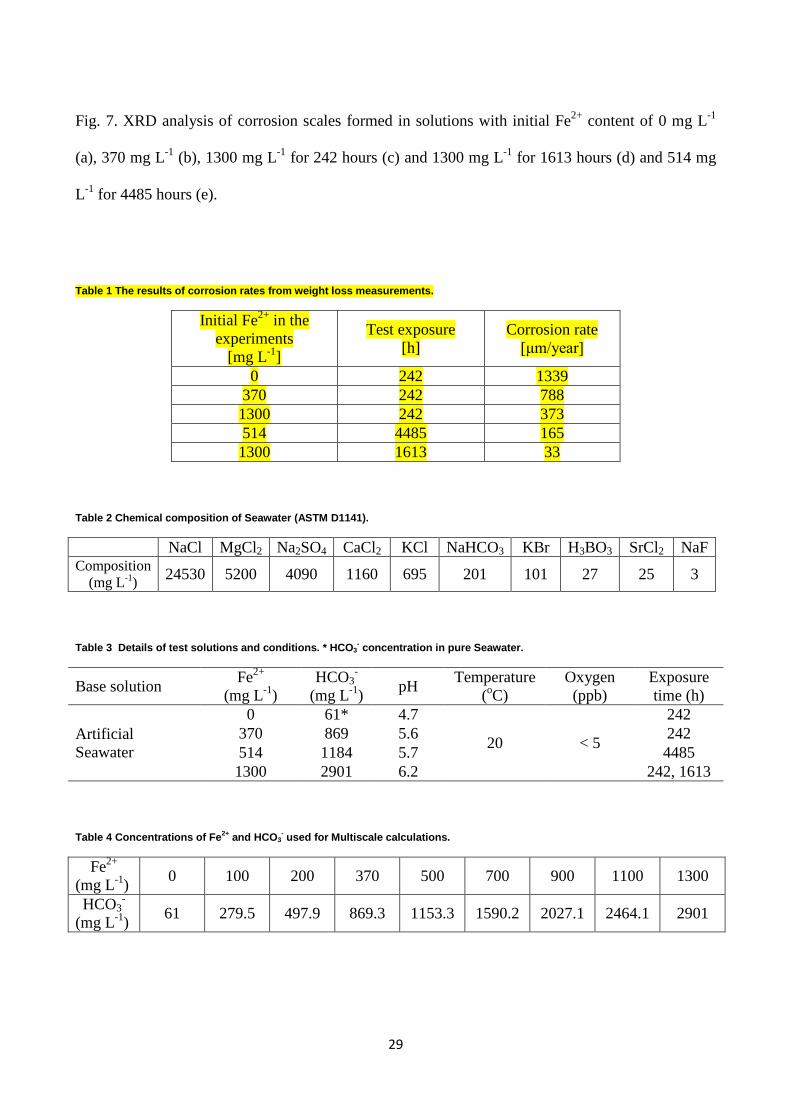
Table 1 The results of corrosion rates from weight loss measurements.
Table 2 Chemical composition of Seawater (ASTM D1141).
Table 3 Details of test solutions and conditions. * HCO3- concentration in pure Seawater.
Table 4 Concentrations of Fe2+ and HCO3- used for Multiscale calculations.
List of figure captions
Fig. 1. Schematic drawing of the test set-up for corrosion testing: (A) De-aeration chamber, (B) Pre-
corrosion chamber, (C) Electrochemical cell ((1) pH electrode, (2) Working electrode, (3) Counter
electrode, (4) Reference electrode, and (5) Wash bottle).
Fig. 2. Thermodynamic calculations made in Multiscale model together with initial pH and Fe2+
concentrations from electrochemical experiments.
Fig. 3. Evolution of the Fe2+ content (right axis) and pH (left axis) for tests performed in solutions
with initial Fe2+ content of A) 0 mg L-1, B) 370 mg L-1, C) 1300 mg L-1 for 242 hours D) 1300 mg
L-1 for 1613 hours of exposure, and E) 514 mg L-1 for 4485 hours of exposure.
Fig. 4. Evolution of Ecorr as a function of time for exposure tests with different initial Fe2+ content
that were running for A) 242 hours and B) 1613 hours and 4485 hours.
Fig. 5. Corrosion rates as a function of time for tests with different initial Fe2+ content that were
running for A) 242 hours and B) 1613 hours and 4485 hours.
Fig. 6. Cross sectional and top surface morphologies of corrosion scales formed in solutions with
initial Fe2+ content of 0 mg L-1 (a and b), 370 mg L-1 (c and d), 1300 mg L-1 for 242 hours (e and f)
and 1300 mg L-1 for 1613 hours (g and h) and 514 mg L-1 for 4485 hours.
29
Fig. 7. XRD analysis of corrosion scales formed in solutions with initial Fe2+ content of 0 mg L-1
(a), 370 mg L-1 (b), 1300 mg L-1 for 242 hours (c) and 1300 mg L-1 for 1613 hours (d) and 514 mg
L-1 for 4485 hours (e).
Table 1 The results of corrosion rates from weight loss measurements.
Initial Fe2+ in the experiments
[mg L-1]
Test exposure [h]
Corrosion rate [μm/year]
0 242 1339 370 242 788 1300 242 373 514 4485 165 1300 1613 33
Table 2 Chemical composition of Seawater (ASTM D1141).
NaCl MgCl2 Na2SO4 CaCl2 KCl NaHCO3 KBr H3BO3 SrCl2 NaF Composition
(mg L-1) 24530 5200 4090 1160 695 201 101 27 25 3
Table 3 Details of test solutions and conditions. * HCO3- concentration in pure Seawater.
Base solution Fe2+
(mg L-1) HCO3
- (mg L-1) pH Temperature
(oC) Oxygen (ppb)
Exposure time (h)
Artificial Seawater
0 61* 4.7
20 < 5
242 370 869 5.6 242 514 1184 5.7 4485 1300 2901 6.2 242, 1613
Table 4 Concentrations of Fe2+ and HCO3- used for Multiscale calculations.
Fe2+ (mg L-1) 0 100 200 370 500 700 900 1100 1300
HCO3-
(mg L-1) 61 279.5 497.9 869.3 1153.3 1590.2 2027.1 2464.1 2901
30
Fig. 1. Schematic drawing of the test set-up for corrosion testing: (A) De-aeration chamber, (B) Pre-corrosion chamber, (C) Electrochemical cell ((1) pH electrode, (2) Working electrode, (3) Counter electrode, (4) Reference electrode, and (5) Wash bottle).
Fig. 2. Thermodynamic calculations made in Multiscale model together with initial pH and Fe2+ concentrations from electrochemical experiments.
31
Fig. 3. Evolution of the Fe2+ content (right axis) and pH (left axis) for tests performed in solutions with initial Fe2+ content of A) 0 mg L-1, B) 370 mg L-1, C) 1300 mg L-1 for 242 hours D) 1300 mg L-1 for 1613 hours of exposure, and E) 514 mg L-1 for 4485 hours of exposure.
32
Fig. 4. Evolution of Ecorr as a function of time for exposure tests with different initial Fe2+ content that were running for A) 242 hours and B) 1613 hours and 4485 hours.
Fig. 5. Corrosion rates as a function of time for tests with different initial Fe2+ content that were running for A) 242 hours and B) 1613 hours and 4485 hours.

33
34
Fig. 6. Cross sectional and top surface morphologies of corrosion scales formed in solutions with initial Fe2+ content of 0 mg L-1 (a and b), 370 mg L-1 (c and d), 1300 mg L-1 for 242 hours (e and f) and 1300 mg L-1 for 1613 hours (g and h) and 514 mg L-1 for 4485 hours.
35
Fig. 7. XRD analysis of corrosion scales formed in solutions with initial Fe2+ content of 0 mg L-1 (a ), 370 mg L-1 (b), 1300 mg L-1 for 242 hours (c) and 1300 mg L-1 for 1613 hours (d) and 514 mg L-1 for 4485 hours (e).