Effect of Fatigue / Vigilance/ Environment on Inspectors ... · Effect of Fatigue / Vigilance/...
67
Effect of Fatigue / Vigilance/ Environment on Inspectors Performing Fluorescent Penetrant and/or Magnetic Particle Inspection Year 1 Interim Report By Colin G. Drury, Monique Saran and John Schultz January 2004 Prepared for Federal Aviation Administration William J. Hughes Technical Center Atlantic City International Airport, NJ 08405 Contract #03-G-012
Transcript of Effect of Fatigue / Vigilance/ Environment on Inspectors ... · Effect of Fatigue / Vigilance/...
Effect of Fatigue / Vigilance/ Environment on Inspectors Performing Fluorescent Penetrant and/or
Magnetic Particle Inspection
Year 1 Interim Report
By
Colin G. Drury, Monique Saran and John Schultz
January 2004
Prepared for
Federal Aviation Administration William J. Hughes Technical Center
Atlantic City International Airport, NJ 08405 Contract #03-G-012
Table of Contents Executive Summary.......................................................................................................... 3 1.0 Overall Project Objectives ......................................................................................... 5 2.0 Anatomy on an Inspection Task ................................................................................ 6
2.1 The Search and Decision Functions ...................................................................... 8 2.1.1 Search................................................................................................................. 8 2.1.2 Decision ........................................................................................................... 11
2.2 Inspection Reintegrated........................................................................................ 12 3.0 Temporal Aspects of Inspection .............................................................................. 19
3.1 Daily Effects: Circadian Rhythms....................................................................... 19 3.2. Weekly Effects: Shift Work and Sleep Loss ...................................................... 20 3.3. Hourly Effects: Vigilance .................................................................................... 26 3.4 Minute Effects: Sequential Tasks ........................................................................ 34 3.5 Inspector Survey ................................................................................................... 34
4.0 Experimental Design For Inspection Fatigue Experiments .................................. 36 4.1 Factors Affecting Performance and Well-Being. ............................................... 36 4.2 Measuring Performance and Well-Being in Fatigue ......................................... 36
4.2.1 Performance Measures..................................................................................... 37 4.2.2 Well-Being Measures....................................................................................... 38
4.3 Design Alternatives for Inspection Fatigue Experiments.................................. 39 4.4 Detailed Experimental Design. ............................................................................ 40
4.4.1 Participants................................................................................................ 41 4.4.2 Simulation ................................................................................................. 42 4.4.3 Event Log.................................................................................................. 43 4.4.4 Measures ................................................................................................... 44 4.4.5 Blades........................................................................................................ 45
5.0 Conclusions................................................................................................................ 47 6.0 Objectives for Year 2 ............................................................................................... 48 References........................................................................................................................ 50 List of Figures.................................................................................................................. 57 List of Acronyms............................................................................................................. 59 Appendix 1....................................................................................................................... 61
ii
Executive Summary Failure of both airframe inspection (Aloha incident) and engine inspection (Sioux City incident, Pensacola incident) has highlighted the potential impact of human limitations on inspection system performance. A common thread in all three incidents was that inspection failure occurred during inspection tasks of normal working duration, i.e. a working shift with typical breaks. A number of visual and NDI techniques require the inspector to work continuously on quite repetitive tasks for extended time periods. They also typically occur over several shifts and can thus involve inspecting at low periods of the human circadian rhythm and the effects of cumulative fatigue from overtime and shift work. This project is designed to provide guidance on good practices for inspection personnel to manage temporal aspects of their jobs. It reviews the pertinent literature and will undertake a series of direct experiments to demonstrate whether findings from the literature are applicable to aircraft inspection. In the five months of Year 1, we have concentrated on the literature of potential applicability to aircraft inspection, and also developed the software and hardware tools for the experimental program. Temporal effects in the literature occur over four times scales:
1. Weekly, where the issues are shift work and cumulative fatigue from hours of work, sleep loss, days worked, overtime and shift work.
2. Daily, where circadian rhythms are predominant, so that time of day is the main
driver. 3. Hourly, where the issues are times spent continuously on tasks, and the timing,
nature and duration of rest periods 4. Minute, where the concern is sequential effects in repetitive tasks: does the
detection of a defect on one item inspected affect the behavior or performance on subsequent items?
The literature on each of these was reviewed, and the fourth time scale was found to be of little importance for inspection tasks. However, the other three time scales are potentially important to aircraft inspection. In particular, long duration signal detection tasks, known as vigilance tasks, show reduced performance with increased time-on-task in many laboratory situations. They are also sensitive to the first two time scales. While it is still not clear how closely vigilance mimics aviation inspection tasks, it is quite clear that vigilance tasks are particularly sensitive to the effects of circadian lows and cumulative fatigue from shift working. Thus inspection tasks with vigilance-like characteristics are performed at times when decrements would be expected. A number of
3

integrative models appear to give sound advice on avoiding cumulative fatigue states. If we establish that these do indeed predict inspection performance changes (Year 2), these models can be spelled out in detail and recommended for aircraft inspection use. In our visits to inspection sites, we collected data on hours of work using a survey developed in the UK for aviation mechanics. We found for our first sample (23 inspectors) that the typical work/rest schedule was 2 hours work followed by 10 minutes rest, which would again give cause for concern if vigilance tasks were indeed close mimics of inspection. The vigilance decrement literature shows performance declines over time periods of less than one hour for some types of vigilance task. Tasks particularly susceptible to decrements are those where there is no constantly –available comparison standard, and where signals are rare, both characteristics of aircraft inspection. Other factors causing a vigilance decrement are less relevant: untrained personnel and symbolic stimuli. Again, it is only after relevant experiments that we can establish how well these mainly laboratory studies represent aircraft inspection that we can apply the vigilance literature conclusions with confidence. The first of a series of experiments has been designed, using insights from site visits and FAA personnel, to answer some of the questions concerning validity of shift work and vigilance conclusions to aviation inspection tasks. The software has been written for a simulation of the FPI reading task, but not yet been pilot tested. The software will allow the participant to view all sides of an inspected item, currently a turbine blade, as it would appear under UV light. The areas of fluorescing penetrant / developer can be removed using a swab tool and any remaining indications can be viewed with a 4x magnifier tool. An event log captures the times of all keystrokes / mouse button presses, and also the use of the tools, so that speed and accuracy of performance can be measured. In addition we will use the TLX and SOFI scales to measure the workload and fatigue of the participants. The design of the initial screening experiment will be a 26-1 fractional factorial to minimize experiment size for a large number of potential factors. This design will give main effects and two-way interactions, to allow future parametric experiments to be structured efficiently by using only significantly interacting factors.
4
1.0 Overall Project Objectives (Modified from proposal). Failure of both airframe inspection (Aloha incident) and engine inspection (Sioux City incident, Pensacola incident) has highlighted the potential impact of human limitations on inspection system performance. A common thread in all three incidents was that inspection failure occurred during inspection tasks of normal working duration, i.e. a working shift with typical breaks. A number of visual and NDI techniques require the inspector to work continuously on quite repetitive tasks for extended time periods. These techniques can include on-aircraft inspection, for example tie clips in the crown area of a B-737, or eddy-current inspection of whole rivet rows on lap splices in similar aircraft. Most extended repetitive tasks, however, occur in off-aircraft inspection of components. Examples are fluorescent penetrant inspection of engine rotor blades, eddy current inspection of large batches of wheel bolts, and magnetic particle inspection of landing gear components. In all of these, the a priori similarity to classical vigilance tasks suggests that performance (defect detection) may decrease with time spent inspecting. This is the classic Vigilance Decrement, characterized by detection performance decreasing rapidly over the first 20-30 minutes of a vigilance task, and remaining at a lower level as time on task increases. Thus, vigilance decrement could be expected to occur under normal working conditions in aviation inspection. A number of these off-aircraft tasks can occur in darkened rooms (to enhance fluorescence effects) and in social isolation. Both may affect the vigilance decrement. In addition, there are cumulative affects of fatigue over multiple days, particularly when working other than day shifts. Finally, much inspection is performed outside day shift conditions, and there are known to be performance deficits associated with circadian rhythms, which may apply to inspection tasks. Thus a study is needed to determine how fatigue affects inspection performance, whether the fatigue comes from the time spent continuously inspecting, or whether it is accumulated over several days, or whether it comes from a “low” in the circadian cycle of performance, typically in the early morning hours. This project uses analyses of inspection tasks to relate the published literature on vigilance, circadian rhythms and cumulative fatigue to specific aspects of aircraft inspection performance, then performs a series of experiments to confirm any effects expected from the literature. In the following sections we first use task analytic techniques to provide detailed links between the tasks of aircraft inspection and concepts in the literature. Next, we examine the literature for its relevance to the issues of fatigue, drawing interim conclusions about potential effects of fatigue on good practices in inspection. Finally, design an experimental framework, and a first screening experiment, to provide specific evidence to guide future good practices.
5
2.0 Anatomy on an Inspection Task Note: The following section is considerably modified from Drury and Watson’s Good Practices in Visual Inspection (2002).1 Both Fluorescent Penetrant Inspection and Magnetic Particle Inspection include a large visual inspection component, although each is preceded by a series of preparation steps to render any defect more visible, usually under ultraviolet illumination. In our visits to aircraft inspection sites to study FPI and MPI first-hand, we have seen how inspectors perform their tasks, particularly the “reading” aspects rather than the considerable “component preparation” aspects of both of these NDI techniques. Human factors studies of industrial inspection go back to the 1950’s when psychologists attempted to understand and improve this notoriously error-prone activity. From this activity came literature of increasing depth focusing on analysis and modeling of inspection performance. Two early books brought this accumulated knowledge to practitioners: Harris and Chaney (1969)2 and Drury and Fox (1975).3 Much of the practical focus at that time was on enhanced inspection techniques or job aids, while the scientific focus was on application of psychological constructs, such as vigilance and signal detection theory, to modeling of the inspection task. More recent reviews of inspection tasks include comprehensive book chapters (Drury, 1992;4 2001;5 Drury and Prabhu, 1994),6 as well as journal papers (Megaw, 1979;7 Craig and Colquohoun, 1977;8 Gallwey, 1998a9 and b10). To understand inspection, and to provide a link between inspection and the psychology / human factors literature, we use the generic functions which comprise all inspection tasks whether manual, automated or hybrid. Table 1 shows these functions, with the specific application to visual inspection in aviation. We can go further by taking each function and listing its correct outcome, from which we can logically derive the possible errors (Table 2). Note that the technical term for a potential defect located by search but not yet confirmed by decision is “indication”. Humans can operate at several different levels in each function depending upon the requirements. Thus, in Search, the operator functions as a low-level detector of indications, but also as a high-level cognitive component when choosing and modifying a search pattern. It is this ability that makes humans uniquely useful as self-repro-gramming devices, but equally it leads to more error possibilities. As a framework for examining inspection functions at different levels the skills/rules/knowledge classifica-tion of Rasmussen (1983)11 will be used. Within this system, decisions are made at the lowest possible level, with progression to higher levels only being invoked when no decision is possible at the lower level.
6
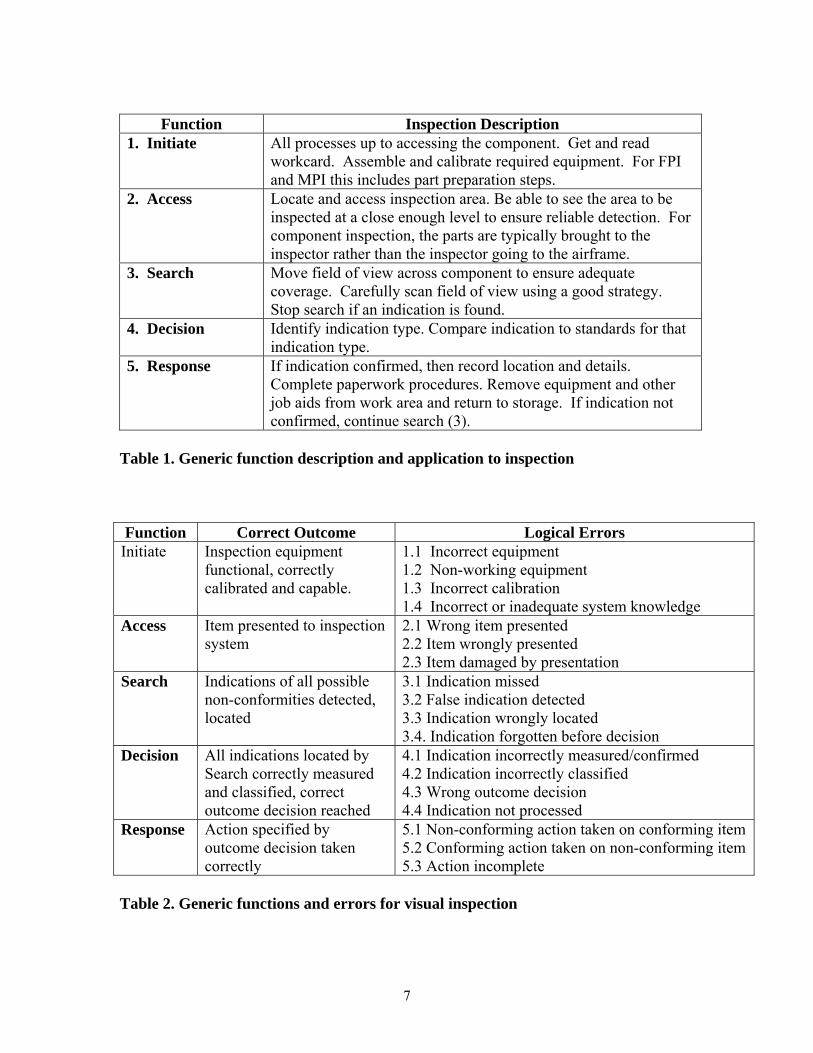
Function Inspection Description
1. Initiate All processes up to accessing the component. Get and read workcard. Assemble and calibrate required equipment. For FPI and MPI this includes part preparation steps.
2. Access Locate and access inspection area. Be able to see the area to be inspected at a close enough level to ensure reliable detection. For component inspection, the parts are typically brought to the inspector rather than the inspector going to the airframe.
3. Search Move field of view across component to ensure adequate coverage. Carefully scan field of view using a good strategy. Stop search if an indication is found.
4. Decision Identify indication type. Compare indication to standards for that indication type.
5. Response If indication confirmed, then record location and details. Complete paperwork procedures. Remove equipment and other job aids from work area and return to storage. If indication not confirmed, continue search (3).
Table 1. Generic function description and application to inspection Function Correct Outcome Logical Errors
Initiate Inspection equipment functional, correctly calibrated and capable.
1.1 Incorrect equipment 1.2 Non-working equipment 1.3 Incorrect calibration 1.4 Incorrect or inadequate system knowledge
Access Item presented to inspection system
2.1 Wrong item presented 2.2 Item wrongly presented 2.3 Item damaged by presentation
Search Indications of all possible non-conformities detected, located
3.1 Indication missed 3.2 False indication detected 3.3 Indication wrongly located 3.4. Indication forgotten before decision
Decision All indications located by Search correctly measured and classified, correct outcome decision reached
4.1 Indication incorrectly measured/confirmed 4.2 Indication incorrectly classified 4.3 Wrong outcome decision 4.4 Indication not processed
Response Action specified by outcome decision taken correctly
5.1 Non-conforming action taken on conforming item 5.2 Conforming action taken on non-conforming item 5.3 Action incomplete
Table 2. Generic functions and errors for visual inspection
7

For most of the functions, operation at all levels is possible, but some functions typically lack higher levels. Access to an item for inspection is an almost purely mechanical function, so that only skill-based behavior is appropriate. The response function is also typically skill-based, unless complex diagnosis of the defect is required beyond mere detection and reporting. Such complex diagnosis is often shared with others, e.g. engineers or managers, if the decision involves expensive procedures such as changing components or delaying flight departure. For a more complete discussion of the application of Rasmussen’s SRK hierarchy to inspection, see Drury and Prabhu (1994)6 and for an application to steel inspection see Dalton and Drury (2004).12
2.1 The Search and Decision Functions The functions of search and decision are the most error-prone in general, although for much of inspection, especially NDI, FPI and MPI, setup can cause its own unique errors. Search and decision have been the subjects of considerable mathematical modeling in the human factors community, with direct relevance to visual inspection. The sections on search and decision are adapted from Drury (1999).13
2.1.1 Search In the visual aspects of inspection tasks, the inspector must move his/her eyes around the item to be inspected to ensure that any defect will eventually appear within an area around the line of sight in which it is possible to achieve detection. This area, called the visual lobe, varies in size depending upon target and background characteristics, illumination and the individual inspector’s peripheral visual acuity. As successive fixations of the visual lobe on different points occur at about three per second, it is possible to determine how many fixations are required for complete coverage of the area to be searched. Eye movement studies of inspectors show that they do not follow a simple pattern in searching an object. Some tasks have very random appearing search patterns (e.g., circuit boards), whereas others show some systematic search components in addition to this random pattern (e.g., aircraft structures). However, all who have studied eye movements agree that performance, measured by the probability of detecting an imperfection in a given time, is predictable assuming a random search model. The equation relating probability (pt) of detection of a single imperfection in a time (t) to that time is
exp1 p t ⎟⎠⎞
⎜⎝⎛−−=
tt
where t is the mean search time. Further, it can be shown that this mean search time can be expressed as
apnAt
t o=
8
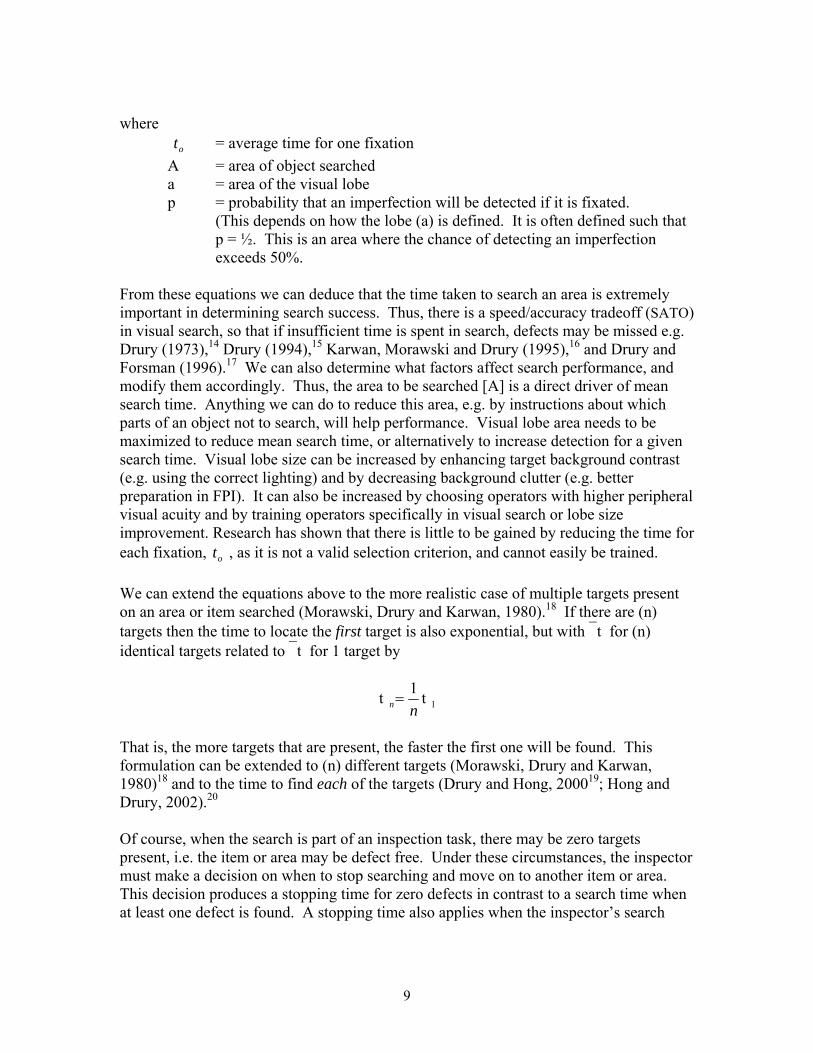
where = average time for one fixation ot A = area of object searched a = area of the visual lobe
p = probability that an imperfection will be detected if it is fixated. (This depends on how the lobe (a) is defined. It is often defined such that p = ½. This is an area where the chance of detecting an imperfection exceeds 50%.
From these equations we can deduce that the time taken to search an area is extremely important in determining search success. Thus, there is a speed/accuracy tradeoff (SATO) in visual search, so that if insufficient time is spent in search, defects may be missed e.g. Drury (1973),14 Drury (1994),15 Karwan, Morawski and Drury (1995),16 and Drury and Forsman (1996).17 We can also determine what factors affect search performance, and modify them accordingly. Thus, the area to be searched [A] is a direct driver of mean search time. Anything we can do to reduce this area, e.g. by instructions about which parts of an object not to search, will help performance. Visual lobe area needs to be maximized to reduce mean search time, or alternatively to increase detection for a given search time. Visual lobe size can be increased by enhancing target background contrast (e.g. using the correct lighting) and by decreasing background clutter (e.g. better preparation in FPI). It can also be increased by choosing operators with higher peripheral visual acuity and by training operators specifically in visual search or lobe size improvement. Research has shown that there is little to be gained by reducing the time for each fixation, , as it is not a valid selection criterion, and cannot easily be trained. ot We can extend the equations above to the more realistic case of multiple targets present on an area or item searched (Morawski, Drury and Karwan, 1980).18 If there are (n) targets then the time to locate the first target is also exponential, but with ⎯t for (n) identical targets related to ⎯t for 1 target by
1t 1t nn=
That is, the more targets that are present, the faster the first one will be found. This formulation can be extended to (n) different targets (Morawski, Drury and Karwan, 1980)18 and to the time to find each of the targets (Drury and Hong, 200019; Hong and Drury, 2002).20
Of course, when the search is part of an inspection task, there may be zero targets present, i.e. the item or area may be defect free. Under these circumstances, the inspector must make a decision on when to stop searching and move on to another item or area. This decision produces a stopping time for zero defects in contrast to a search time when at least one defect is found. A stopping time also applies when the inspector’s search
9
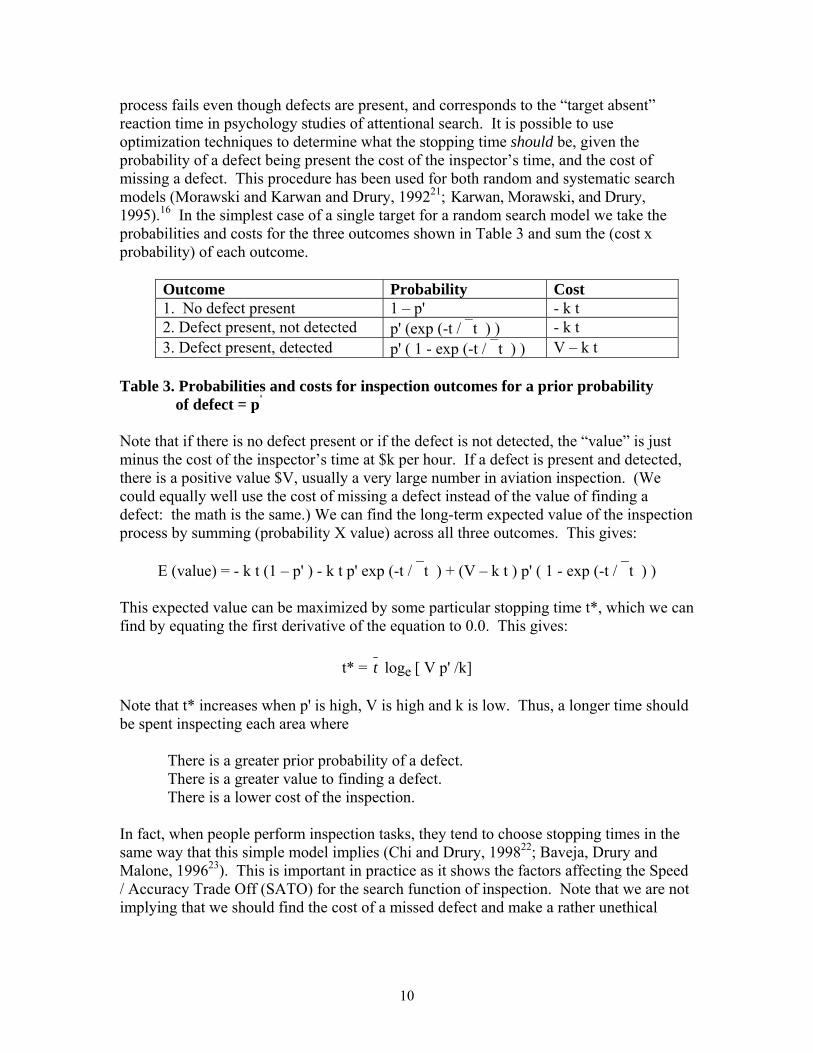
process fails even though defects are present, and corresponds to the “target absent” reaction time in psychology studies of attentional search. It is possible to use optimization techniques to determine what the stopping time should be, given the probability of a defect being present the cost of the inspector’s time, and the cost of missing a defect. This procedure has been used for both random and systematic search models (Morawski and Karwan and Drury, 199221; Karwan, Morawski, and Drury, 1995).16 In the simplest case of a single target for a random search model we take the probabilities and costs for the three outcomes shown in Table 3 and sum the (cost x probability) of each outcome.
Outcome Probability Cost 1. No defect present 1 – p' - k t 2. Defect present, not detected p' (exp (-t / ⎯t ) ) - k t 3. Defect present, detected p' ( 1 - exp (-t / ⎯t ) ) V – k t
Table 3. Probabilities and costs for inspection outcomes for a prior probability of defect = p'
Note that if there is no defect present or if the defect is not detected, the “value” is just minus the cost of the inspector’s time at $k per hour. If a defect is present and detected, there is a positive value $V, usually a very large number in aviation inspection. (We could equally well use the cost of missing a defect instead of the value of finding a defect: the math is the same.) We can find the long-term expected value of the inspection process by summing (probability X value) across all three outcomes. This gives:
E (value) = - k t (1 – p' ) - k t p' exp (-t / ⎯t ) + (V – k t ) p' ( 1 - exp (-t / ⎯t ) ) This expected value can be maximized by some particular stopping time t*, which we can find by equating the first derivative of the equation to 0.0. This gives:
t* = t loge [ V p' /k] Note that t* increases when p' is high, V is high and k is low. Thus, a longer time should be spent inspecting each area where
There is a greater prior probability of a defect. There is a greater value to finding a defect. There is a lower cost of the inspection.
In fact, when people perform inspection tasks, they tend to choose stopping times in the same way that this simple model implies (Chi and Drury, 199822; Baveja, Drury and Malone, 199623). This is important in practice as it shows the factors affecting the Speed / Accuracy Trade Off (SATO) for the search function of inspection. Note that we are not implying that we should find the cost of a missed defect and make a rather unethical
10
calculation of the costs of an aircraft catastrophe compared to the costs of paying an inspector. That is not how the MSG-3 process works. But analyses such as the derivation of optimal stopping time t* allow us to define in a quantitative manner the pressures on inspectors, and hence, derive good practices for helping inspectors improve their effectiveness. Note also that the analysis above represents only visual search (hence there are no decision errors such as false alarms), that it only covers the simplest situation of one possible defect with a known prior probability, and that it assumes that a rather naïve economic maximization is the ultimate goal of the inspection system. These limitations can be removed with more complex models, e.g. Chi and Drury (2001)24. The equation given for search performance assumed random search, which is always less efficient than systematic search. Human search strategy has proven to be quite difficult to train, but recently Wang, Lin and Drury (1997)25 showed that people can be trained to perform more systematic visual search. Also, Gramopadhye, Drury and Sharit (1997)26
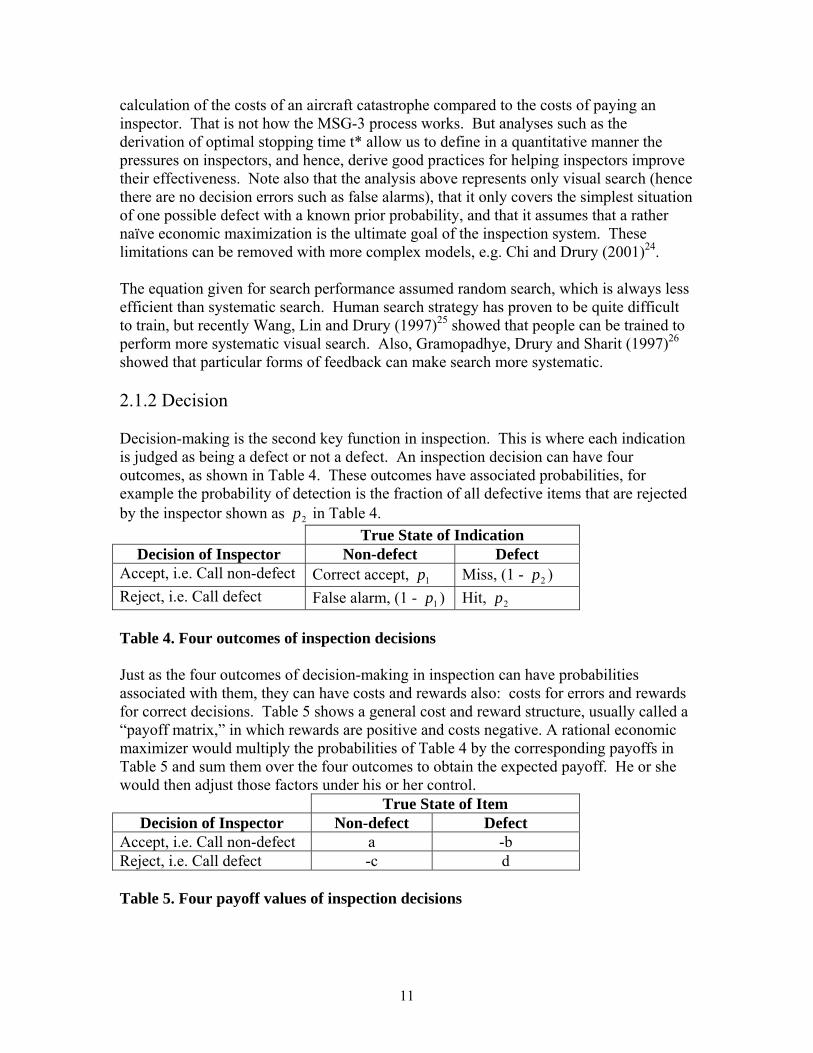
showed that particular forms of feedback can make search more systematic. 2.1.2 Decision Decision-making is the second key function in inspection. This is where each indication is judged as being a defect or not a defect. An inspection decision can have four outcomes, as shown in Table 4. These outcomes have associated probabilities, for example the probability of detection is the fraction of all defective items that are rejected by the inspector shown as in Table 4. 2p
True State of Indication Decision of Inspector Non-defect Defect
Accept, i.e. Call non-defect Correct accept, 1p Miss, (1 - ) 2pReject, i.e. Call defect False alarm, (1 - ) 1p Hit, 2p Table 4. Four outcomes of inspection decisions Just as the four outcomes of decision-making in inspection can have probabilities associated with them, they can have costs and rewards also: costs for errors and rewards for correct decisions. Table 5 shows a general cost and reward structure, usually called a “payoff matrix,” in which rewards are positive and costs negative. A rational economic maximizer would multiply the probabilities of Table 4 by the corresponding payoffs in Table 5 and sum them over the four outcomes to obtain the expected payoff. He or she would then adjust those factors under his or her control.
True State of Item Decision of Inspector Non-defect Defect
Accept, i.e. Call non-defect a -b Reject, i.e. Call defect -c d Table 5. Four payoff values of inspection decisions
11
Basically, Signal Detection Theory (SDT, e.g. McNichol, 197227) states that and can vary in two ways. First, if the inspector and task are kept constant, then as increases, decreases, with the balance between and defined mathematically. The particular relationship between and is known as the bias, as it reflects the inspector’s bias towards acceptance or rejection. Second, and can be changed together by changing the discriminability for the inspector between acceptable and rejectable objects. The most often tested set of assumptions comes from a body of knowledge known as the theory of signal detection. This theory has been used for numerous studies of inspection, for example, sheet glass, electrical components, and ceramic gas igniters, and has been found to be a useful way of measuring and predicting performance. It can be used in a rather general nonparametric form (preferable) but is often seen in a more restrictive parametric form in earlier papers (Drury and Addison, 1963).
1p 2p
1p
2p 1p 2p
1p 2p
1p 2p
28 McNichol is a good source for details of both forms. The objective in improving decision-making is to reduce decision errors. These can arise directly from forgetting imperfections or standards in complex inspection tasks or indirectly from making an incorrect judgment about an imperfection’s severity with respect to a standard. Ideally, the search process should be designed to improve the conspicuity of rejectable imperfections (nonconformities) only, but often the measures taken to improve conspicuity apply equally to nonrejectable imperfections. Reducing decision errors usually reduces to improving the discriminability between imperfection and a standard. Changes in bias can only improve one aspect of inspection performance (e.g. missed defects) at the expense of reducing performance on the complementary defect (e.g. false alarms). Bias is typically affected by the costs and payoffs (Table 5) and by the overall probability of a defect occurring. Mathematically, the optimum bias moves towards reduced misses when the costs / payoffs for defects are high, and when the probability of a defect occurring is high. Unfortunately, the probability of defects occurring in many aircraft inspection tasks is inherently low, particularly for engine components such as titanium hubs, which fail rarely, but can have disastrous consequences when the do fail, e.g. Sioux City DC-10 incident and Pensacola MD-80 incident. Decision performance can be improved by providing job aids and training that increase the size of the apparent difference between the imperfections and the standard (i.e. increasing discriminability). One example is the provision of limit standards well-integrated into the inspector’s view of the item inspected. Limit standards change the decision-making task from one of absolute judgment to the more accurate one of comparative judgment. Harris and Chaney (1969)2 showed that limit standards for solder joints gave a 100% performance improvement in inspector consistency for near-borderline cases. 2.2 Inspection Reintegrated From the above analysis, it is clear that inspection is not merely the decision function.
12

The use of models such as signal detection theory to apply to the whole inspection process is misleading in that it ignores the search function. For example, if the search is poor, then many defects will not be located. At the overall level of the inspection task, this means that probability of detection (PoD) decreases, but this decrease has nothing to do with setting the wrong decision criteria. Even such devices as ROC curves should only be applied to the decision function of inspection, not to the overall process unless search failure can be ruled out on logical grounds. This can be illustrated from the data on visual inspection of lap joints for rivet cracks (Drury, Spencer and Schurman, 1997).29 In the Benchmark evaluation of inspection performance noted earlier, one task was a standardized one of inspecting several panels with (grown) cracks starting at rivet holes. These were the panels used in the earlier ECRIRE study of eddy current inspection (Spencer and Schurman, 1995).30 By analyzing video tapes of the inspectors performing this inspection task, it was possible to find out whether the inspection process at each rivet had been only search or search-plus-decision. Decisions could be seen from the inspectors interrupting their search to change the angle of their flashlight, or move their head for a different viewing angle, or even feel the rivet area. Thus, search failure (i.e. never locating an indication) could be distinguished from decision failure (either failing to report an indication as a defect (miss), or reporting a defect where none existed (false alarm)). Figures 1 and 2 show the distributions across inspectors of search and decision success, respectively (from Drury, 1999).13
0
1
2
3
4
5
0.1 0.2 0.3 0.4 0.5 0.6 0.7 0.8 0.9 1
p(Search Sucess)
Num
ber o
f Ins
pect
ors
Figure 1. Distribution of search performance for 11 visual inspectors. Note that probability of search success is quite narrowly grouped around a mean of 0.6. This shows that most of the lack of defect detection was due to poor search performance
13
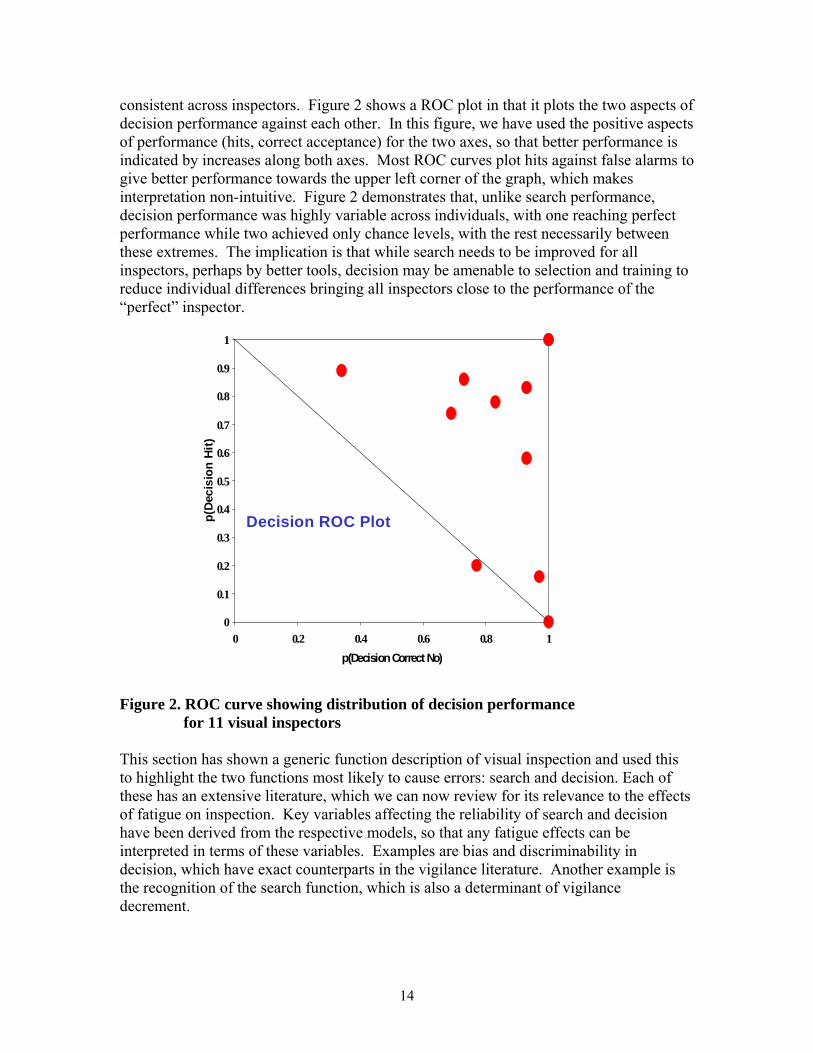
consistent across inspectors. Figure 2 shows a ROC plot in that it plots the two aspects of decision performance against each other. In this figure, we have used the positive aspects of performance (hits, correct acceptance) for the two axes, so that better performance is indicated by increases along both axes. Most ROC curves plot hits against false alarms to give better performance towards the upper left corner of the graph, which makes interpretation non-intuitive. Figure 2 demonstrates that, unlike search performance, decision performance was highly variable across individuals, with one reaching perfect performance while two achieved only chance levels, with the rest necessarily between these extremes. The implication is that while search needs to be improved for all inspectors, perhaps by better tools, decision may be amenable to selection and training to reduce individual differences bringing all inspectors close to the performance of the “perfect” inspector.
0
0.1
0.2
0.3
0.4
0.5
0.6
0.7
0.8
0.9
1
0 0.2 0.4 0.6 0.8 1p(Decision Correct No)
p(De
cisi
on H
it)
Decision ROC Plot
Figure 2. ROC curve showing distribution of decision performance for 11 visual inspectors
This section has shown a generic function description of visual inspection and used this to highlight the two functions most likely to cause errors: search and decision. Each of these has an extensive literature, which we can now review for its relevance to the effects of fatigue on inspection. Key variables affecting the reliability of search and decision have been derived from the respective models, so that any fatigue effects can be interpreted in terms of these variables. Examples are bias and discriminability in decision, which have exact counterparts in the vigilance literature. Another example is the recognition of the search function, which is also a determinant of vigilance decrement.
14
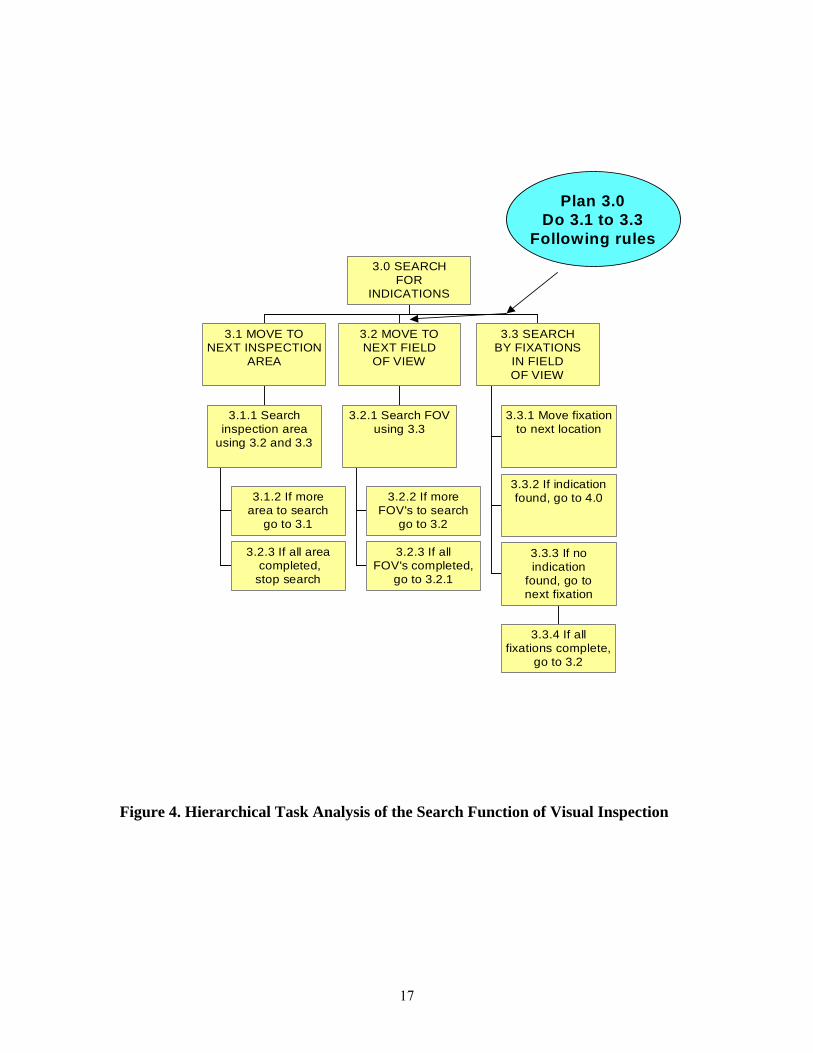
inally, we can extend the simple function analysis of inspection given in Table 1 to a
ture.
nded
Fmore detailed task analysis, such as Hierarchical Task Analysis (HTA), a standard method in human factors for relating task components to the relevant research literaFigure 3 shows the HTA for one type of inspection, Visual Inspection (Drury and Watson, 2002).6 This figure only gives the top level of analysis. HTA can be exteto analyze tasks in more and more detail, using progressive redescription. Figures 4 and 5 show then next level for the two key functions of search and decision, respectively. Even more detail is possible (see Drury and Watson, 2002)1 but the point is that any analysis of a task such as inspection can be performed in considerable detail, and has been for several inspection tasks such as FPI and Borescope inspection.
15

1.3 TEST,CALIBRATEEQUIPMENT
1.2 ASSEMBLEEQUIPMENT
1.1 USEDOCUMENTATION
TO PLAN TASK
1.0 INITIATEINSPECTION
2.2 ACCESSINSPECTION
AREA
2.1 LOCATETASK AREA
2.0 ACCESSINSPECTION
TASK
3.3 SEARCHBY FIXATIONS
IN FOV
3.2 MOVE TONEXT FIELD
OF VIEW
3.1 MOVE TONEXT INSPECTION
AREA
3.0 SEARCHFOR
INDICATIONS
4.3 COMPAREINDICATION
TO STANDARD
4.2 MEASUREINDICATION
SIZE
4.1 IDENTIFYINDICATION
TYPE
4.0 DECISIONON
INDICATION
5.4 FINALDECISION
5.3 RECORDDEFECT TYPE,
COMMENTS
5.2 RECORDDEFECT
LOCATION
5.1 CHECKDEFECT
LOCATION
5.0 RESPONDON
INSPECTION
6.3 RETURNSUPPORT
EQUIPMENTTO STORAGE
6.2 CLEANEQUIPMENT
6.1 REMOVEEQUIPMENT.
SUPPLIES FROMINSPECTION AREA
6.0 RETURNEQUIPMENT
TO STORAGE
0.0 PERFORMVISUAL
INSPECTION
Figure 3. Top Level of Hierarchical Task Analysis of Visual Inspection
16
3.1.2 If morearea to search
go to 3.1
3.2.3 If all area completed,stop search
3.1.1 Searchinspection area
using 3.2 and 3.3
3.1 MOVE TONEXT INSPECTION
AREA
3.2.2 If moreFOV's to search
go to 3.2
3.2.3 If allFOV's completed,
go to 3.2.1
3.2.1 Search FOVusing 3.3
3.2 MOVE TONEXT FIELD
OF VIEW
3.3.1 Move fixationto next location
3.3.2 If indicationfound, go to 4.0
3.3.4 If allfixations complete,
go to 3.2
3.3.3 If noindication
found, go tonext fixation
3.3 SEARCHBY FIXATIONS
IN FIELDOF VIEW
3.0 SEARCHFOR
INDICATIONS
Plan 3.0Do 3.1 to 3.3
Following rules
Figure 4. Hierarchical Task Analysis of the Search Function of Visual Inspection
17

4.1.3 IF noseverity estimateneeded, THEN
go to 6.0
4.1.3 Determineneed for
severity estimate
4.1.2 Classifyindication
4.1.1 Recognizeindication type
4.1 IDENTIFYINDICATION
TYPE
4.2.1 Estimatesize from
landmarks
4.2.2 Measuresize usinggraticule
4.2.3 Measuresize usingcomputer
4.2 MEASUREINDICATION
SIZE
4.3.1.2 Calculate(indication
minus standard)
4.3.1.1 Estimate(indication
minus standard)
4.3.2 Makedecision onindication
4.3.1 Locatestandardfor defect
4.3 COMPAREINDICATION
TO STANDARD
4.0 DECISIONON INDICATION
Plan 4.0If indication found
do 4.1 to 4.3 inorder
Figure 5. Hierarchical Task Analysis of the Decision Function of Visual Inspection
18
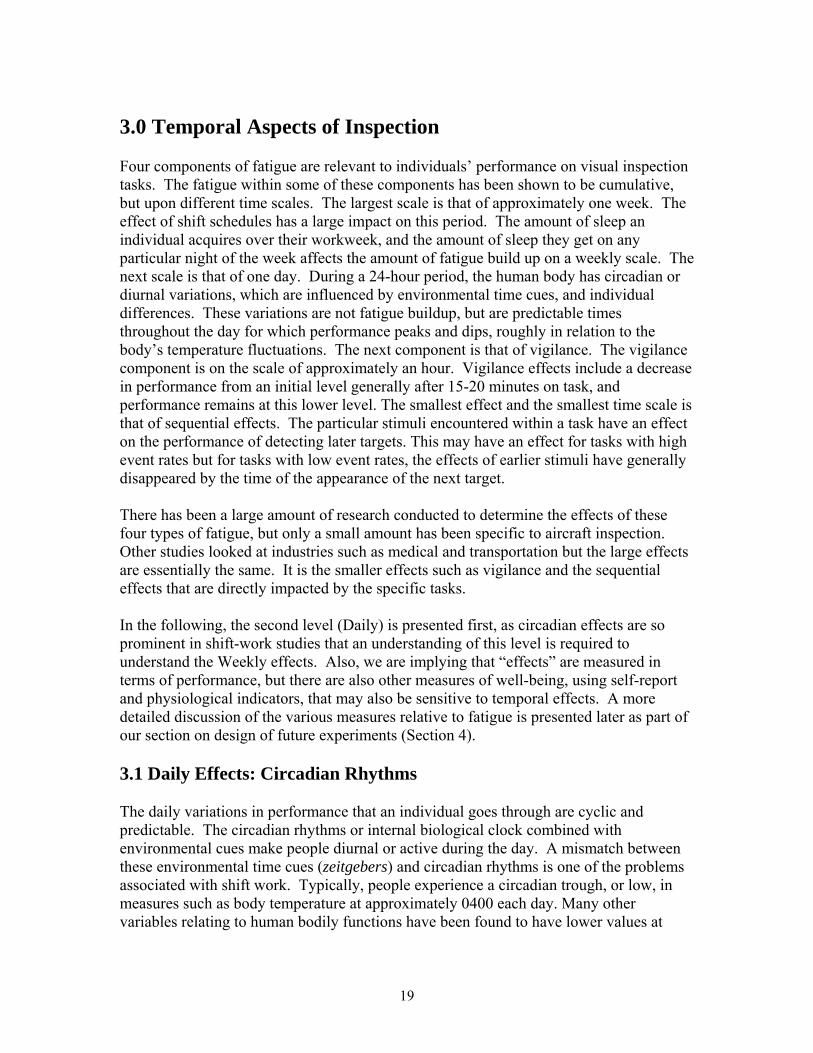
3.0 Temporal Aspects of Inspection Four components of fatigue are relevant to individuals’ performance on visual inspection tasks. The fatigue within some of these components has been shown to be cumulative, but upon different time scales. The largest scale is that of approximately one week. The effect of shift schedules has a large impact on this period. The amount of sleep an individual acquires over their workweek, and the amount of sleep they get on any particular night of the week affects the amount of fatigue build up on a weekly scale. The next scale is that of one day. During a 24-hour period, the human body has circadian or diurnal variations, which are influenced by environmental time cues, and individual differences. These variations are not fatigue buildup, but are predictable times throughout the day for which performance peaks and dips, roughly in relation to the body’s temperature fluctuations. The next component is that of vigilance. The vigilance component is on the scale of approximately an hour. Vigilance effects include a decrease in performance from an initial level generally after 15-20 minutes on task, and performance remains at this lower level. The smallest effect and the smallest time scale is that of sequential effects. The particular stimuli encountered within a task have an effect on the performance of detecting later targets. This may have an effect for tasks with high event rates but for tasks with low event rates, the effects of earlier stimuli have generally disappeared by the time of the appearance of the next target. There has been a large amount of research conducted to determine the effects of these four types of fatigue, but only a small amount has been specific to aircraft inspection. Other studies looked at industries such as medical and transportation but the large effects are essentially the same. It is the smaller effects such as vigilance and the sequential effects that are directly impacted by the specific tasks. In the following, the second level (Daily) is presented first, as circadian effects are so prominent in shift-work studies that an understanding of this level is required to understand the Weekly effects. Also, we are implying that “effects” are measured in terms of performance, but there are also other measures of well-being, using self-report and physiological indicators, that may also be sensitive to temporal effects. A more detailed discussion of the various measures relative to fatigue is presented later as part of our section on design of future experiments (Section 4). 3.1 Daily Effects: Circadian Rhythms The daily variations in performance that an individual goes through are cyclic and predictable. The circadian rhythms or internal biological clock combined with environmental cues make people diurnal or active during the day. A mismatch between these environmental time cues (zeitgebers) and circadian rhythms is one of the problems associated with shift work. Typically, people experience a circadian trough, or low, in measures such as body temperature at approximately 0400 each day. Many other variables relating to human bodily functions have been found to have lower values at
19
night. These include heart rate, blood pressure and the urinary excretion of potassium (Folkard and Monk 1985).31 In general humans show the same type of phasic behavior in performance as these biological rhythms, but there are differences between individuals in the timing of the beginnings of phases. The start and end times of work shifts has been shown by multiple studies to be importance when trying to minimize circadian disruption during any particular shift (Folkard, 2002;32 Fletcher and Dawson, 2001a33). Many studies of shift work contain evidence for circadian rhythm influence on performance decrements. In a Bakan Vigilance task over three sessions (one session before the nap and two after), Della Rocco, Comperatore, Caldwell, Cruz (2000)34 showed a increase in false responding of 600% from session 1 to session 3, possibly due to session 3 matching the time of the circadian trough. Pigeau et al (1995)35 conducted a field study of air traffic controllers and showed there was a gradual deterioration in performance between 0300 and 0600 on the midnight shift, which would coincide with the circadian trough and the phase onset differences between individuals. Smith et al (1998)36 tested nurses and industrial workers and recommended matching shift work to human circadian rhythms in order to prevent sleep loss when not working. Fletcher and Dawson, (2001a)33 found a significant main effect for predicted fatigue scores and start or end of shift, shift duration and time of day. Fatigue scores were significantly higher at the end than beginning of shift and fatigue scores were greater for longer shifts. They also found that fatigue scores were highest for shifts beginning between 0000 and 0800, next highest for beginning between 0800 and 1600, and the lowest were for shifts beginning between 1600 and 2400. They concluded that “shift duration should always be interpreted relative to the time-of day that it is occurring”, (Fletcher and Dawson, 2001a,33 p.84). Simon Folkard’s (2002)32 recommendations that influence daily performance include; a maximum of four hours should be worked before a break, a minimum break of 10 minutes should be given, with five minutes added for each hour worked since the last break, and the end time of the night shift should not occur after 0800. 3.2. Weekly Effects: Shift Work and Sleep Loss The fatigue effects of shifts may span a period of a week or more. This fatigue is cumulative and Fletcher and Dawson (2001a)33 showed how fatigue builds up over the course of a week. This fatigue also interacts with circadian variations. As it is difficult to separate the two, and most studies have looked at both sources of fatigue together. Fletcher and Dawson (1998)37 developed a model of fatigue during a work period, based on the duration and circadian timing of the work period, the recovery non-work period and its duration and the time at which these occur. The model gives fatigue values of work and non-work periods and allows the calculation of the fatigue level for an individual based on their shift schedule history of work and non-work periods at any
20
particular point in time. They discuss that the relative contribution of earlier work and rest periods to fatigue tends to decrease over time and that work from months prior will contribute less than will the previous week, but that the exact nature of this function is unknown. They arbitrarily assigned a linearly declining function which weights the current hour at a hundred percent and the same hour in the previous week at zero percent. Their model predicts fatigue scores in terms of standard, moderate or high. Standard is up to 40 points, moderate is up to 200% of the maximum fatigue scores for the standard, or 80 points. High fatigue scores are any over 80 points. This 80-point level is equivalent to 21-23 hours of sleep deprivation following 5 days of work and 2 days off. They showed the fatigue scores associated with a number of shift schedules. The fatigue scores showed considerable variation in average and peak scores, but all 24-hour shift systems produced fatigue scores greater than the average workweek. The mixed start time schedules did this as well. The aviation schedule that contained fewer hours than the standard workweek still produced higher fatigue scores because most of the aviation work occurred at night. Empirical evaluations of this model were conducted, comparing the model to data from cumulative sleep deprivation studies, continuous sleep deprivation studies and contemporary work scheduling recommendations. Data from the sleep deprivation studies included two performance measures of direct relevance to aircraft inspection; lapses in the psychomotor vigilance task (PVT) and duration the slowest 10% of reaction time responses in PVT. They found correlations of 0.92 and 0.91 respectively. A comparison of the model and multiple sleep latency test values was conducted and an r-value of -0.97 was obtained. The data from the continuous sleep deprivation studies included behavioral measures of vigilance, performance, sleepiness and tiredness. The correlations of the data with the model gave r-values of -0.75, -0.75, 0.82, and 0.79, respectively. Field-based evaluations of this model were conducted using train drivers (Fletcher and Dawson, 2001b)38. Data was analyzed from 193 train drivers who filled in sleep and work diaries, wore Actigraph watches, and performed subjective alertness ratings and objective performance tests before and after each shift for a period of two weeks. VAS, a standard visual analog scale was used to measure self-rated alertness, one end was ‘extremely alert’, and the other was ‘not at all alert’. The computerized OSPAT test was used as the objective measure of performance. This test requires an individual to return a randomly moving cursor to the center of a circular target using a track ball. The scores from this test include components of hand eye coordination, reaction time and vigilance. Significant correlations were found between predicted fatigue, VAS alertness, and OSPAT scores for the start and end of shifts, excluding the correlation between predicted fatigue and OSPAT at the beginning of shifts. Both the correlations between predicted fatigue, VAS-alertness and OSPAT scores with time of day effects, and the correlations between predicted fatigue, VAS-alertness and OSPAT scores with day of sequence effects contained inconsistent significant relationships. They also found the predicted fatigue scores had significant correlations with VAS-alertness, regardless of day of the
21
week, but the correlations of predicted fatigue and OSPAT scores were opposite than expected. A significant effect was seen with predicted fatigue scores and the main effects of start and end of shift, shift duration, and time of day. The mean fatigue score was greater for longer shifts, and fatigue scores for the period between 0000 and 0800 were significantly higher than the period of 0800 to 1600. A significant fatigue score interaction was found between the start and end times and time of day. In addition, predicted fatigue scores for days four and five were higher than those for days one, two and three. Recommendations from these results include (Fletcher and Dawson, 2001b38): work as few night shifts in a row as possible (the maximum should be limited to three), start time of 2000 could reduce fatigue on the night shift, permanent night shift should be avoided, avoid dingle days off between night shifts, maximum of three morning shifts in succession (dependent upon start time), forward rotation is preferable over backward (however their model does not support this recommendation, and is also affected by start times). Della Rocco and Cruz (1995)39 studied the 2-2-1 rotating shift schedule with air traffic controllers in order to investigate sleep patterns on this schedule, and the cumulative sleep loss that may be incurred. This schedule requires working two afternoon shifts followed by two morning shifts and then a night shift within a five-day period. This was a four-week study in which the first week was used to acclimatize the participants to wearing physiological monitors, and the following three weeks involved and A-B-A work schedule where the subjects worked straight days during the second and fourth weeks and worked the 2-2-1 schedule during the third week. They used the Multiple Task Performance Battery to assess performance and recorded physiological measures of core body temperature, heart rate, and activity level. Daily logs of sleep/ wake times and sleep quality ratings were kept, and neuroendocrine measures and mood and sleepiness scales were also used. The results from the sleep pattern data showed that the 2-2-1 schedule significantly disrupted the sleep/wake cycle. There were also significant differences between the younger and older groups in that the older group received approximately one hour more of sleep per night. Sleep quality ratings declined over the course of the 2-2-1 schedule. Performance decrements were only seen on the night shift. The performance data was presented in Della Rocco and Cruz (1996)40 using the CAMI Multiple Task Performance Battery (MTPB). The MTPB included tasks of red and green light monitoring, meter monitoring, mental arithmetic, target identification, code lock, and critical tracking. There were significant performance decrements on the night shift for both age groups. Based upon these findings it is not clear that the 2-2-1 schedule is a better or worse schedule than any other, but it is clear that performance is worse on the midnight shift. Recommendations based upon this information would be to alleviate some of the causes of performance decrements on the midnight shift. In a follow-on study, Della Rocco, Comperatore, Caldwell, Cruz (2000)34 looked at the
22

effects of napping on performance and subjective measures of mood, sleep quality and sleepiness during the midnight shift. They used sixty Air Traffic Control Specialists (ATCS), in three different midnight shift conditions; long nap (LN), short nap (SN), and no nap (NN). The long nap was 2 hour and the short nap was 45 minutes. Each participant worked three morning shifts and then rapidly rotated to the midnight shift. The tests for performance included the Air Traffic Scenarios Test (ATST), and a modified version of the Bakan vigilance test. Sleep EEG measures were used with the Stanford Sleepiness Scale (SSS) to assess mood, sleep quality and sleepiness. Activity monitors were used to study the rest/activity cycles of participants for the five days before laboratory testing occurred. Both the napping conditions resulted in better performance than the no nap condition, which suggests that naps could be an effective countermeasure for the midnight shift. Cruz, Detwiler, Nesthus and Boquet (May 2002a, July 2002b, Nov 2002c),41,42,43 presented the results of a comparison of clockwise and counterclockwise rotating schedules in three parts; sleep, performance and effects on core body temperature and neuroendocrine measures. They had participants work one week of day shifts and then rotate either clockwise or counterclockwise (shifts included early morning, afternoon, and midnight shifts) for two weeks. They used the MTPB and the Bakan Vigilance Task and administered a Morningness-Eveningness Questionnaire and a biographical questionnaire. The participants were given physiological monitoring devices to measure core body temperature, heart rate, wrist activity (Actigraph), ambient light and logbooks for SSS ratings, Positive and Negative Affect Schedule (PANAS) ratings, and sleep onset and awake times. Their results showed that sleep duration, timing and quality were only dependent upon sleep period and subjective sleepiness was dependent on shift and rating time (Cruz et al, May 2002a).41 The next section that evaluated performance (Cruz et al, July 2002b)42 showed no difference between the groups with respect to performance, but did show circadian effects. The analysis of the effects of core body temperature and neuroendrocrine measures showed no difference for the cortisol measure, but the clockwise group had a significantly greater increase in melatonin. The core body temperatures showed a significantly lower amplitude and a delay of the acrophase for the counter-clockwise group. They are unsure of the sources of these physiological differences between the two groups, but attribute them to similarities to circadian resynchronization during westward travel. These differences in physiological measures do not seem to have caused any differences in performance between the two groups. The clockwise rotation and the counterclockwise rotation do not seem to differ significantly enough to recommend one over the other. Another model of fatigue developed by French and Morris (2003),44 “considers sleep wake cycles and circadian rhythmicity as a quantifiable predictor of excessive operator fatigue as well as a way to immediately apply fatigue related effects in artificial agents”. This model was initially developed to rapidly decide the most effective operational work-rest schedule, by predicting periods of heightened risk of fatigue-induced errors. The fatigue algorithm, the FAtigue DEgradation tool (FADE), predicts human response capability for tasks over an extended period of sleep wake cycles. The algorithm focuses
23
on the interaction of prolonged sleep deprivation or fragmented sleep with circadian disruption on crew performance and on sleep recovery from fatigue. It was based on data collected using 18 pilots as subjects in a 52-hour sleep deprivation study. It is based on performance on a fatigue sensitive task, a divided attention version of the Maniken task. The FADE results were also compared to another test, a pattern recognition test from the NASA Space Cognitive Assessment Test (SCAT) battery. In order to show the effectiveness of the FADE algorithm it was used to predict fatigue levels with a contemporary maritime schedule and with another schedule, which considers circadian sleep / wake rhythms. This was conducted on the first two weeks of a 6 month deployment. The contemporary schedule was a 4/8 cycle in which a four-hour watch occurs after 8 hours of rest or another duty. The other schedule is non-rotating and is more in line with circadian rhythms. The results of this testing showed the FADE results correlated significantly with both the Maniken, and SCAT data, r=0.92, p‹0.92 and r=0.872, p‹0.024. The FADE algorithm was then used to find operationally significant limits to human effectiveness. A score of 4 was associated with 18 hours of sleep deprivation and this is where caution is advised. A FADE score of 6 was associated with 21 hours of sleep deprivation so this was considered the score that would call for extreme caution and immediate fatigue countermeasures. This is based on 18 hours of sleep deprivation causing a significant number of errors of omission during the study, and at 21-24 hours of sleep deprivation there were significant delays in response time. These results were also compared to other studies and found consistent. Smith et al (1998)36 developed a process model of adaptation to shift work, which looked at sleep, social, and domestic disturbances for both nurses and a sample of industrial workers. The model specifically proposes that individual differences in personality, age and situational workload variables will negatively influence sleep, family, and social life. This model was tested with self-report data. The questionnaires used were the Standard Shift work Index (SSI), the Composite Morningness Questionnaire, the Circadian Type Inventory, the Coping Questionnaire, the General Health Questionnaire, the Job Diagnostic Survey, and seven items from the Cognitive-Somatic Anxiety Questionnaire. Their model provided an adequate fit to the data collected from the questionnaires but there were differences in some items between the nursing and industrial groups. “Regardless of type of shift schedule or job, shift workers with inflexible sleeping habits and who experienced greater workload incurred increased sleep disturbances. Such disturbances triggered increased use of disengagement (avoidant and passive) coping strategies, which were associated with undesirable short-term outcomes (increased emotional problems and fatigue)”. The authors recommended ameliorating sleep, non work disturbances and the ineffective coping strategies, and matching shift work to human circadian rhythms. Johnson et al (2001)45 looked specifically at Aviation Maintenance personnel (AMTs) and characterized selected environmental conditions of their workplaces and the amount
24
of sleep AMTs obtained. The participants were one-hundred AMTs who were given questionnaires. The temperature, lighting and sound levels where they worked were also monitored, as were sleep conditions over a two-week, 24 hour/day duration. Actigraph watches, which measure any human motion, are designed for long term monitoring of motor activity and were used to assess actual sleep time by monitoring the duration of relative inactivity. The Mini-Logger was used to collect the temperature, sound pressure and light data. Sound was the same across all airlines and there was significantly less noise on the late shift. Both light and temperature had large ranges. The questionnaire contained 41 items and addressed basic demographic information, information regarding personal habits, and information about fatigue and alertness while at work. In total, 499 questionnaires were analyzed. The Actigraph data showed that participants slept on average between 4.2 and 6 hours, but that over 60% of participants reported sleeping over 6 hours. This shows the unreliability of self reported sleep data. Perceived levels of fatigue changed but perceived alertness did not change from the beginning to the end of the shift. Recommendation from this study include changing the culture of aviation maintenance personnel through education about sleep habits, or an education plan related to “Fitness for Duty” and to equate sleep loss with the use of drugs and alcohol. Teaching individuals about the signs for fatigue was another possible recommendation. Based upon the environmental information, specifically temperature, recommendations were made to cover situations such as unscheduled maintenance and the high temperatures on the flight line. They include; “adequate staffing, reasonable scheduling of activity, proper pacing in high temperature conditions, plenty of water, and adequate rest throughout the work shift.” This study did not break out inspectors or NDI personnel specifically, and so may not be strictly relevant to our project. However, with the following study, it does represent current practice across the aviation maintenance and inspection domain. Smith et al (1998)36 measured 8 and 12 hour shifts to determine the optimal length of a shift. They found no significant differences between the two shifts except as they may affect specific individuals, although their results were somewhat equivocal. Folkard’s (March 2002)32 recommendations for “good practice” for both diurnal variations and shifts for aviation maintenance personnel are based on his review of literature of work schedules and their impact on health and safety. He uses three underlying principles:
1. Minimize the build up of fatigue over periods of work 2. Maximize the dissipation of fatigue over periods of rest 3. Minimize sleep problems and circadian disruption (p.56)
A summary of his recommendations that apply to shifts are as follows:
1. No shift should be scheduled to go over 12 hours. 2. A minimum of 11 hours should be allowed between the end of one shift and the
beginning of the next.
25
3. Work should not be scheduled for more than 48 hours (60 with any overtime) for a period of seven consecutive days.
4. Two successive rest days should be given (plus the 11 hours given between shifts).
5. A total of 28 annual days of vacation for those on shift work. 6. Successive night shifts should be limited to 6 for shifts up to 8 hours long, 4 for
shifts over 8 up to 10 hours, and 2 for shifts longer than 10 hours, and 7. Successive night shifts with 12 or more hours should be immediately followed
with two days of rest (increased to 3 if the successive nights exceeded three or 36 hours of work).
Other general recommendations include giving at least 28 days of notice for rotating schedules, that employers should consider developing risk management systems, development of educational programs, personnel should be required to report for work adequately rested, and that personnel should be either discouraged or prevented from moonlighting. These studies cover many aspects of shift work that can cause the accumulation of fatigue during a workweek, and offer a wide range of recommendations to counteract some of these effects and many of the findings overlap. They also cover a number of measurements that are relevant and techniques for obtaining these measurements. 3.3. Hourly Effects: Vigilance A watch keeper’s ability to maintain sustained attention first came under experimental scrutiny in World War II. The research was driven by the finding that trained observers in anti-submarine patrol aircraft reported less detections as their watch progressed (Mackworth, 1948).46 The task was simulated in the laboratory with an apparatus that produced regular visible events, most of which were benign, but occasional ones that were defined as “signals” or “targets.” Using naval personnel as participants, Mackworth found that detection performance decreased in every half-hour interval of the task. He labeled this the “vigilance decrement.” Because he used half-hour time periods in the Navy’s standard four-hour watch for collecting his data, his results are often interpreted as vigilance declining after 30 minutes of time on task. This is something of a misconception, as in fact about half of the loss is found in the first 15 minutes, and performance does not get much worse beyond 30 minutes (Teichner, 1974,47 quoted in Huey and Wickens, 199348). Indeed, Figure 6 shows the time course of detection performance in one study by (Craig and Coquhoun, 1977),8 when the initial fall in performance can be seen clearly. Since the early studies, a considerable body of knowledge has been accumulated on vigilance tasks, with thousands of experiments in many laboratories. A laboratory vigilance task has participants attempting to detect relatively rare signals but important in a continuous task that has the participant’s full attention. Performance is measured by:
26
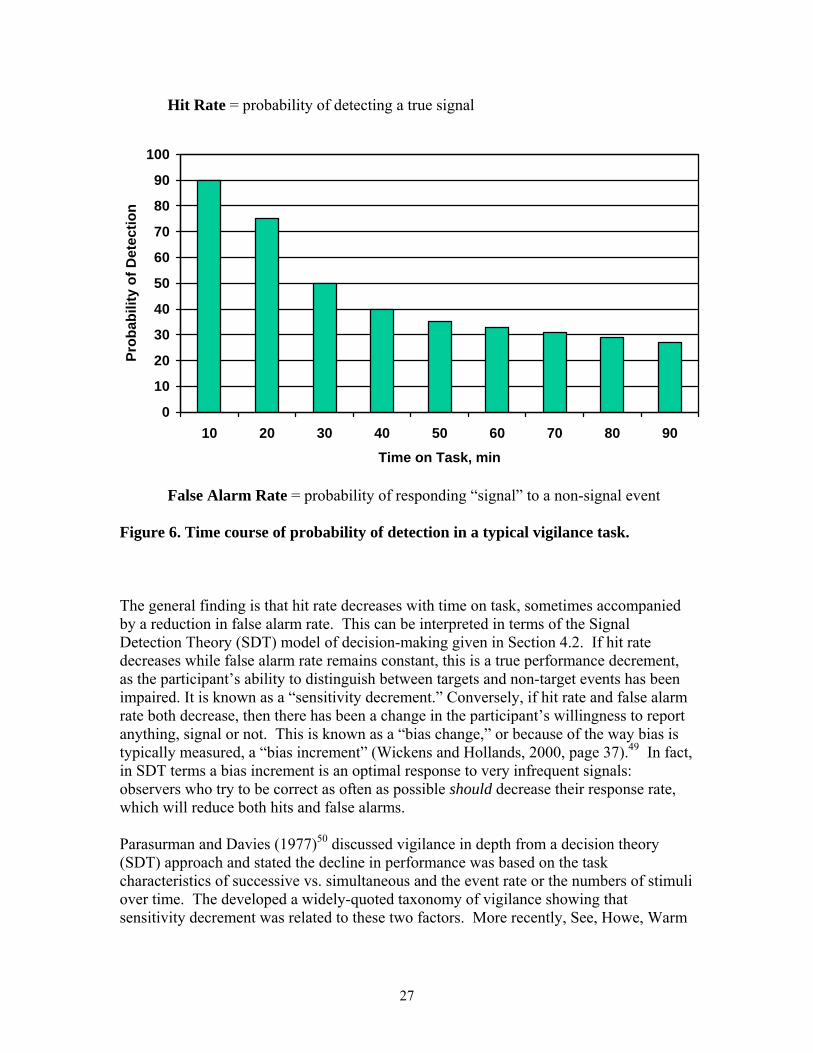
Hit Rate = probability of detecting a true signal
0
10
20
30
40
50
60
70
80
90
100
10 20 30 40 50 60 70 80 90Time on Task, min
Prob
abili
ty o
f Det
ectio
n
False Alarm Rate = probability of responding “signal” to a non-signal event Figure 6. Time course of probability of detection in a typical vigilance task. The general finding is that hit rate decreases with time on task, sometimes accompanied by a reduction in false alarm rate. This can be interpreted in terms of the Signal Detection Theory (SDT) model of decision-making given in Section 4.2. If hit rate decreases while false alarm rate remains constant, this is a true performance decrement, as the participant’s ability to distinguish between targets and non-target events has been impaired. It is known as a “sensitivity decrement.” Conversely, if hit rate and false alarm rate both decrease, then there has been a change in the participant’s willingness to report anything, signal or not. This is known as a “bias change,” or because of the way bias is typically measured, a “bias increment” (Wickens and Hollands, 2000, page 37).49 In fact, in SDT terms a bias increment is an optimal response to very infrequent signals: observers who try to be correct as often as possible should decrease their response rate, which will reduce both hits and false alarms. Parasurman and Davies (1977)50 discussed vigilance in depth from a decision theory (SDT) approach and stated the decline in performance was based on the task characteristics of successive vs. simultaneous and the event rate or the numbers of stimuli over time. The developed a widely-quoted taxonomy of vigilance showing that sensitivity decrement was related to these two factors. More recently, See, Howe, Warm
27

and Dember (1995)51 conducted a meta analysis of the sensitivity decrement in vigilance and determined that these task characteristics are a large component of the vigilance decrement but that the sensory-cognitive component must be investigated as well. Their revision to the taxonomy is based upon exceptions to the earlier model when sensitivity decrements would be expected but not seen or the reverse. They propose this mismatch between actual performance and the predictions of the model arise from the distinction between sensory tasks and cognitive tasks. They define sensory tasks as those that require discrimination of changes in physical characteristics of a signal, whereas cognitive tasks use alphanumeric or symbolic stimuli. They showed through their analysis that the magnitude of the decrement was positively related to event rate for simultaneous tasks, but negatively for cognitive tasks and that the decrement was negatively related to event rate for cognitive but positively to sensory tasks when successive discriminations were involved. These results seem to show that there may be at least three factors that affect vigilance: event rate, type of discrimination and the sensory vs. cognitive aspect. These two taxonomic works give a general picture of vigilance but many hundreds of studies of these three and other characteristics have been conducted. The factors known to affect vigilance performance have also been classified (Wickens and Hollands, 2000)49 into those that contribute to the Sensitivity Decrement. We can combine these with the earlier taxonomies to give:
1. Low signal strength, i.e. targets are not easily distinguished from background. 2. Cognitive load, i.e. symbolic or alphanumeric stimuli 3. Time or location uncertainty, i.e. targets do not appear at regular intervals, or at
specific locations. 4. Higher memory load, i.e. having to remember what a signal looks like rather than
having a typical signal permanently in view (sequential tasks). 5. Observers who are not highly practiced, i.e. the task is not automatic.
Other factors contribute to Bias Increment:
1. Low probability that an event is a signal, i.e. many events, few of which should be responded to.
2. Low levels of feedback, i.e. observers rarely find out whether or not they missed a true signal. (Feedback is more generally a part of the payoff system associated with the defined rewards of a vigilance task. However, these rewards are defined as they constitute feedback.)
3. Environmental isolation, including social isolation. Overall, it appears that sensitivity loss comes from sustained high levels of cognitive demand. The task may be boring subjectively, but it is not easy. A relatively high level of mental resources must be applied to the task over prolonged periods (Hitchcock, et al, 2003).52
28
We can list some of the major factors known to affect vigilance in more detail.
The presence of other targets does not seem to be a determining factor of performance decrements. Craig and Colquhoun (1977)8 had subjects monitor for either two different targets or just one target and found that the overall level of detection and the amount of decrement within each session were not affected by searching for a second target relative to groups searching for only one of the two targets. Changing target types and number of targets; target type influences probability of detection, but changing number of targets does not. Monk (1976)53 studied target uncertainty with dots of differing brightness. The brightness of the dot determined whether the indication was a target or non-target, and target uncertainty was found to produce a 9.5% increase in search time. Goldberg and Bernard (1991)54 found that non-defective shapes were recognized more quickly than defective shapes and both reaction times and errors were strongly related to probabilities. Molloy and Parasuraman (1996)51 examined the effects of task complexity and time on task. For time on task in both the simple- and the multi-complex task performance was better in the first ten minutes vs. the last ten minutes of a 30 min. session. In the single complex condition detection was equally good in both time periods. For the multi-complex task monitoring for a single failure of automation control was poorer than when participants monitored under manual control.
Event rate has been studied in detail and high event rates have been shown to lead to greater numbers of detections. According to See et al (1995)51 in their meta-analysis, the model they developed predicted that sensitivity decrements would occur in tasks that have a high event rate and involve successive discrimination. Successive tasks are where an observer must maintain a standard in working memory and compare successive targets to the standard. Simultaneous tasks are comparative judgments. The stimulus either does or does not contain a specific stimulus characteristic.
Other studies have looked at signal probabilities and the possibility that individuals may be matching their behavior to their internal idea of the probability of a signal. Vickers et al (1977)56 used a decreasing signal probability to investigate criterion changes. Criterion changes involve either becoming more or less conservative over time. This criterion change is associated with less false alarms with a more conservative criterion and more false alarms with a less conservative criterion. They found that the probability of reporting a signal and false alarm increased over the session while the probability of correct rejections and misses decreased during this time. They showed a significant decrease in beta and no change in sensitivity, which may be related to the decreasing signal probability and adaptation of the participants to it.
29
Teichner (1974)47 looked at 37 studies of vigilance using simple signals and found that the initial detection level what the determinant of performance for the rest of the watch period. Performance was found to depend primarily on the initial detection level, the nature of the signal (static or dynamic), and the duration of the watch, which led to the development of a watch keeping decremental function. In Catchpole et al (2002)57 they conducted a field study of threat Image Projection (TIP) with airport baggage screeners. This involves the placement of a fictional threat onto the screeners monitor in order to evaluate their performance. Their results suggest that the screeners may adapt their responses in the expectation of a threat, and may have decreased vigilance if a fictional threat image has been recently presented. This is similar to probability matching discussed earlier.
A recent study was initiated specifically to measure the effects of event rate and presence of another target on the search component of inspection. Panjawani and Drury (2003)58 used an extremely low defect rate of 1 defect on one of ten daily sessions with 50 items per session (rate = 0.002). They found that both probability of target and presence of a secondary target affected different aspects of performance. Because the ten sessions were only of about 10 – 15 min. duration, and the critical target only occurred once in the session, no within session decrement could be found. The study does show that the event rate findings extend even to very low defect rates (1 in ten days) typical of aircraft inspection tasks. Rest Breaks have been a much studied vigilance decrement countermeasure. A 10 minute warm up, or vigilance increment, was shown in the study by Pigeau, et al, 1995).35 This was a field study with air traffic controllers in which two types of break schedules were tested. Either 20/20 or 60/60, which meant that 20 minutes were worked and then a break of 20 minutes was given and the other condition was the same but with 60 minute periods of work and rest. In the 60/60 conditions there was a 10-minute warm up period over at the beginning of the working period over which performance improved. A similar but non-significant effect was seen in the 20/20 condition, this is the opposite of the vigilance decrement that is generally found and may have been due to this being a field study rather than a controlled study. There was also a shift and time on task interaction, only the midnight shift on the 60/60 work/rest schedule induced longer RT’s than the 20/20 schedule. This is more of a circadian trough than a vigilance decrement, as it was not seen with the 60/60 schedules during the day.
Clearly, inspection tasks can often be characterized as attempting to detect rare (even extremely rare) but important signals over long periods of time. Thus, a priori, vigilance and inspection tasks have features in common, namely sustained attention. But equally, vigilance and inspection tasks may be quite different. Inspection often occurs in a noisy and social environment of a hangar rather than in a sound proofed isolation of a laboratory, although FPI and MPI inspection
30
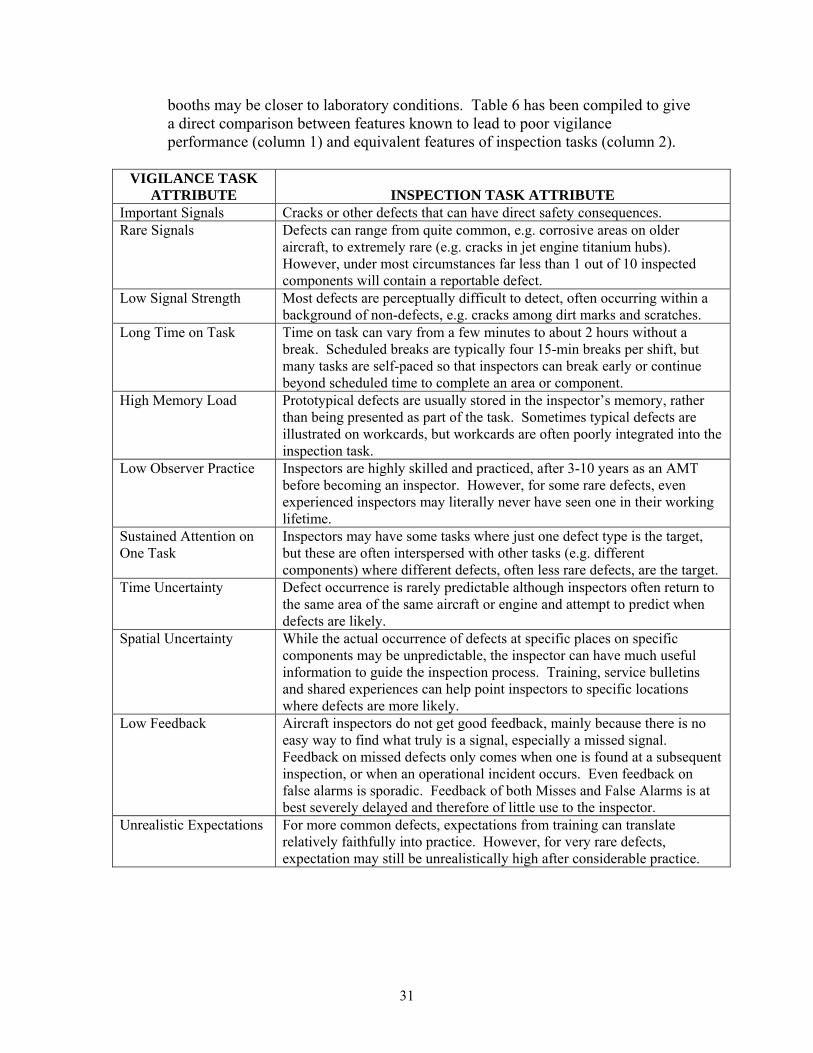
booths may be closer to laboratory conditions. Table 6 has been compiled to give a direct comparison between features known to lead to poor vigilance performance (column 1) and equivalent features of inspection tasks (column 2).
VIGILANCE TASK ATTRIBUTE
INSPECTION TASK ATTRIBUTE
Important Signals Cracks or other defects that can have direct safety consequences. Rare Signals Defects can range from quite common, e.g. corrosive areas on older
aircraft, to extremely rare (e.g. cracks in jet engine titanium hubs). However, under most circumstances far less than 1 out of 10 inspected components will contain a reportable defect.
Low Signal Strength Most defects are perceptually difficult to detect, often occurring within a background of non-defects, e.g. cracks among dirt marks and scratches.
Long Time on Task Time on task can vary from a few minutes to about 2 hours without a break. Scheduled breaks are typically four 15-min breaks per shift, but many tasks are self-paced so that inspectors can break early or continue beyond scheduled time to complete an area or component.
High Memory Load Prototypical defects are usually stored in the inspector’s memory, rather than being presented as part of the task. Sometimes typical defects are illustrated on workcards, but workcards are often poorly integrated into the inspection task.
Low Observer Practice Inspectors are highly skilled and practiced, after 3-10 years as an AMT before becoming an inspector. However, for some rare defects, even experienced inspectors may literally never have seen one in their working lifetime.
Sustained Attention on One Task
Inspectors may have some tasks where just one defect type is the target, but these are often interspersed with other tasks (e.g. different components) where different defects, often less rare defects, are the target.
Time Uncertainty Defect occurrence is rarely predictable although inspectors often return to the same area of the same aircraft or engine and attempt to predict when defects are likely.
Spatial Uncertainty While the actual occurrence of defects at specific places on specific components may be unpredictable, the inspector can have much useful information to guide the inspection process. Training, service bulletins and shared experiences can help point inspectors to specific locations where defects are more likely.
Low Feedback Aircraft inspectors do not get good feedback, mainly because there is no easy way to find what truly is a signal, especially a missed signal. Feedback on missed defects only comes when one is found at a subsequent inspection, or when an operational incident occurs. Even feedback on false alarms is sporadic. Feedback of both Misses and False Alarms is at best severely delayed and therefore of little use to the inspector.
Unrealistic Expectations For more common defects, expectations from training can translate relatively faithfully into practice. However, for very rare defects, expectation may still be unrealistically high after considerable practice.
31
Isolated Inspection Environment
The hangar and even the shop inspection environment are typically noisy, social and distracting. Both noise and social interaction and even some forms of distraction have been found to improve vigilance performance in laboratory tasks.
Table 6. Comparison between attributes of vigilance tasks and aircraft inspection tasks
32
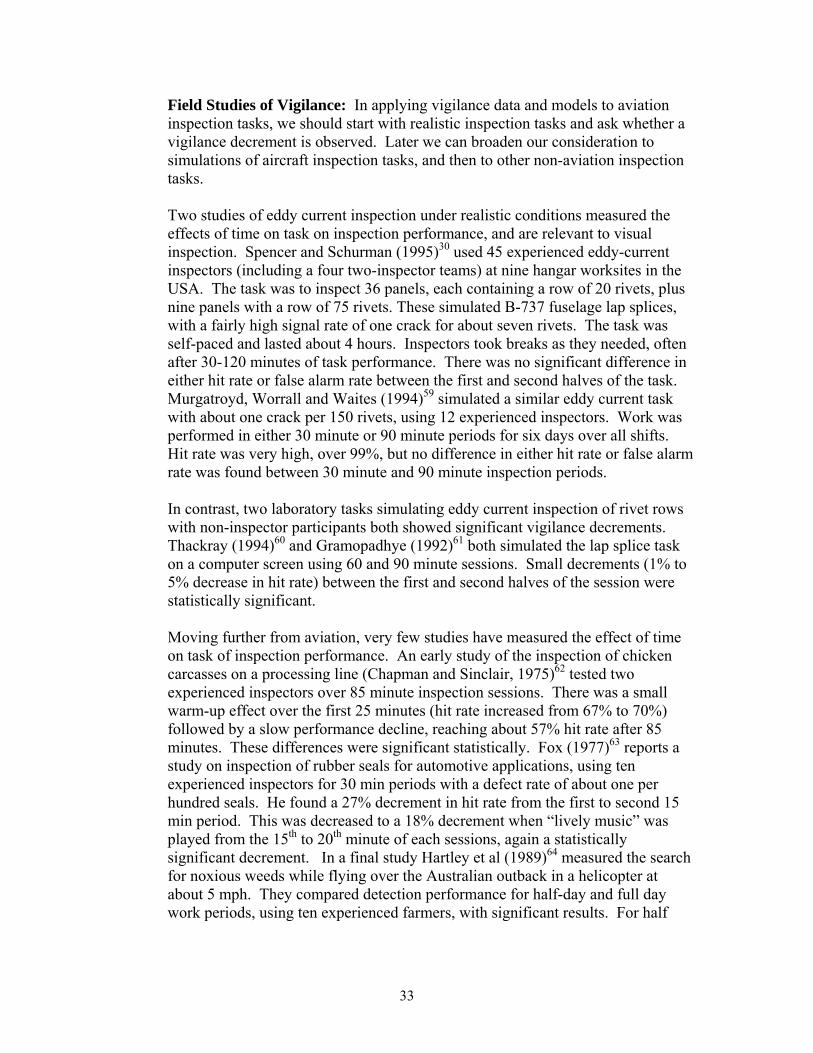
Field Studies of Vigilance: In applying vigilance data and models to aviation inspection tasks, we should start with realistic inspection tasks and ask whether a vigilance decrement is observed. Later we can broaden our consideration to simulations of aircraft inspection tasks, and then to other non-aviation inspection tasks. Two studies of eddy current inspection under realistic conditions measured the effects of time on task on inspection performance, and are relevant to visual inspection. Spencer and Schurman (1995)30 used 45 experienced eddy-current inspectors (including a four two-inspector teams) at nine hangar worksites in the USA. The task was to inspect 36 panels, each containing a row of 20 rivets, plus nine panels with a row of 75 rivets. These simulated B-737 fuselage lap splices, with a fairly high signal rate of one crack for about seven rivets. The task was self-paced and lasted about 4 hours. Inspectors took breaks as they needed, often after 30-120 minutes of task performance. There was no significant difference in either hit rate or false alarm rate between the first and second halves of the task. Murgatroyd, Worrall and Waites (1994)59 simulated a similar eddy current task with about one crack per 150 rivets, using 12 experienced inspectors. Work was performed in either 30 minute or 90 minute periods for six days over all shifts. Hit rate was very high, over 99%, but no difference in either hit rate or false alarm rate was found between 30 minute and 90 minute inspection periods.
In contrast, two laboratory tasks simulating eddy current inspection of rivet rows with non-inspector participants both showed significant vigilance decrements. Thackray (1994)60 and Gramopadhye (1992)61 both simulated the lap splice task on a computer screen using 60 and 90 minute sessions. Small decrements (1% to 5% decrease in hit rate) between the first and second halves of the session were statistically significant. Moving further from aviation, very few studies have measured the effect of time on task of inspection performance. An early study of the inspection of chicken carcasses on a processing line (Chapman and Sinclair, 1975)62 tested two experienced inspectors over 85 minute inspection sessions. There was a small warm-up effect over the first 25 minutes (hit rate increased from 67% to 70%) followed by a slow performance decline, reaching about 57% hit rate after 85 minutes. These differences were significant statistically. Fox (1977)63 reports a study on inspection of rubber seals for automotive applications, using ten experienced inspectors for 30 min periods with a defect rate of about one per hundred seals. He found a 27% decrement in hit rate from the first to second 15 min period. This was decreased to a 18% decrement when “lively music” was played from the 15th to 20th minute of each sessions, again a statistically significant decrement. In a final study Hartley et al (1989)64 measured the search for noxious weeds while flying over the Australian outback in a helicopter at about 5 mph. They compared detection performance for half-day and full day work periods, using ten experienced farmers, with significant results. For half
33
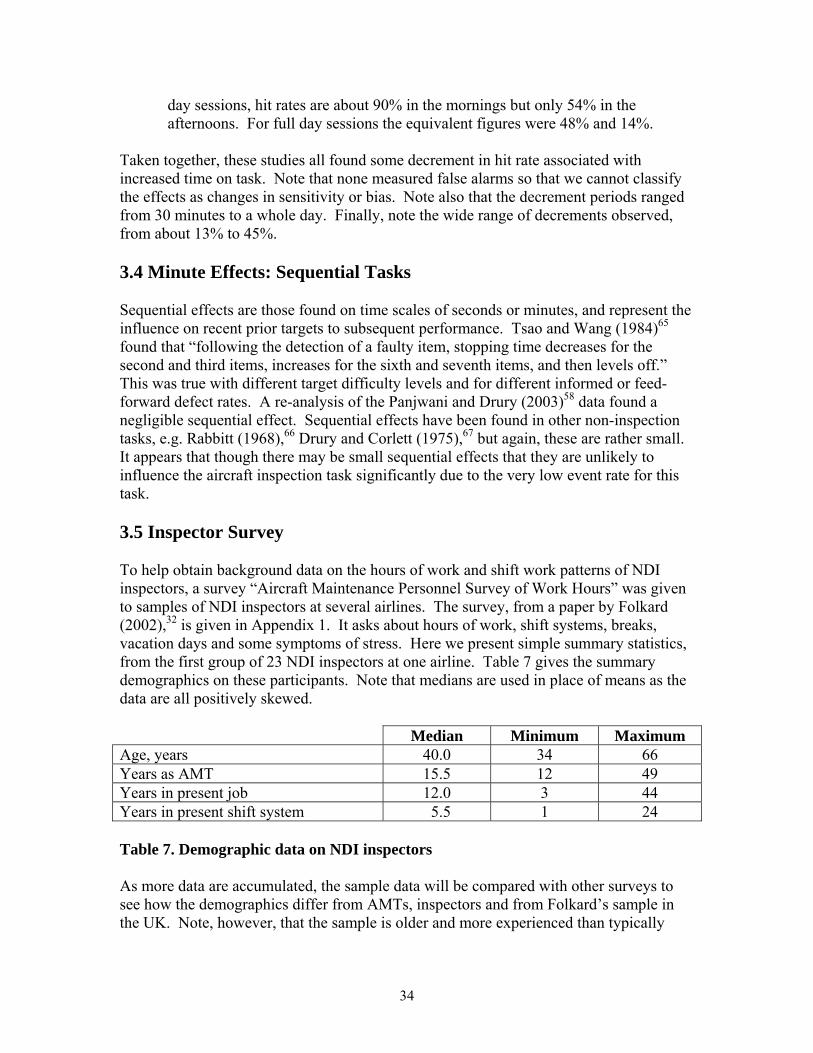
day sessions, hit rates are about 90% in the mornings but only 54% in the afternoons. For full day sessions the equivalent figures were 48% and 14%.
Taken together, these studies all found some decrement in hit rate associated with increased time on task. Note that none measured false alarms so that we cannot classify the effects as changes in sensitivity or bias. Note also that the decrement periods ranged from 30 minutes to a whole day. Finally, note the wide range of decrements observed, from about 13% to 45%. 3.4 Minute Effects: Sequential Tasks Sequential effects are those found on time scales of seconds or minutes, and represent the influence on recent prior targets to subsequent performance. Tsao and Wang (1984)65 found that “following the detection of a faulty item, stopping time decreases for the second and third items, increases for the sixth and seventh items, and then levels off.” This was true with different target difficulty levels and for different informed or feed-forward defect rates. A re-analysis of the Panjwani and Drury (2003)58 data found a negligible sequential effect. Sequential effects have been found in other non-inspection tasks, e.g. Rabbitt (1968),66 Drury and Corlett (1975),67 but again, these are rather small. It appears that though there may be small sequential effects that they are unlikely to influence the aircraft inspection task significantly due to the very low event rate for this task. 3.5 Inspector Survey To help obtain background data on the hours of work and shift work patterns of NDI inspectors, a survey “Aircraft Maintenance Personnel Survey of Work Hours” was given to samples of NDI inspectors at several airlines. The survey, from a paper by Folkard (2002),32 is given in Appendix 1. It asks about hours of work, shift systems, breaks, vacation days and some symptoms of stress. Here we present simple summary statistics, from the first group of 23 NDI inspectors at one airline. Table 7 gives the summary demographics on these participants. Note that medians are used in place of means as the data are all positively skewed. Median Minimum Maximum Age, years 40.0 34 66 Years as AMT 15.5 12 49 Years in present job 12.0 3 44 Years in present shift system 5.5 1 24 Table 7. Demographic data on NDI inspectors
As more data are accumulated, the sample data will be compared with other surveys to see how the demographics differ from AMTs, inspectors and from Folkard’s sample in the UK. Note, however, that the sample is older and more experienced than typically
34
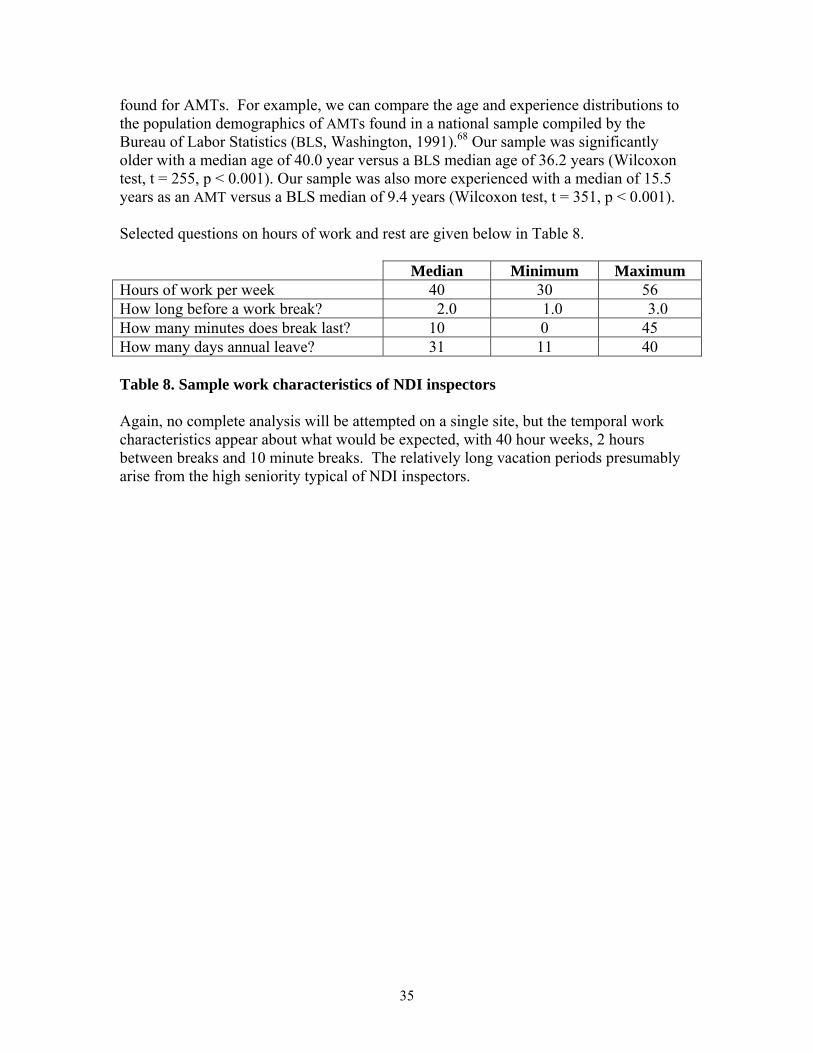
found for AMTs. For example, we can compare the age and experience distributions to the population demographics of AMTs found in a national sample compiled by the Bureau of Labor Statistics (BLS, Washington, 1991).68 Our sample was significantly older with a median age of 40.0 year versus a BLS median age of 36.2 years (Wilcoxon test, t = 255, p < 0.001). Our sample was also more experienced with a median of 15.5 years as an AMT versus a BLS median of 9.4 years (Wilcoxon test, t = 351, p < 0.001). Selected questions on hours of work and rest are given below in Table 8. Median Minimum Maximum Hours of work per week 40 30 56 How long before a work break? 2.0 1.0 3.0 How many minutes does break last? 10 0 45 How many days annual leave? 31 11 40 Table 8. Sample work characteristics of NDI inspectors Again, no complete analysis will be attempted on a single site, but the temporal work characteristics appear about what would be expected, with 40 hour weeks, 2 hours between breaks and 10 minute breaks. The relatively long vacation periods presumably arise from the high seniority typical of NDI inspectors.
35
4.0 Experimental Design For Inspection Fatigue Experiments From the literature on fatigue and vigilance decrement applied to inspection tasks we generated lists of (a) factors affecting performance and inspector well-being, and (b) measures relevant to performance and inspector well-being. Using these we can now make explicit the design alternatives in any experimental study aimed at quantifying the effect of hours of work on inspection in aviation. 4.1 Factors Affecting Performance and Well-Being. We can generate lists under the conventional SHELL or TOMES headings, and later determine whether each factor should be fixed at a single level, built in to the experiments at multiple levels, used as a co-variate in the design or randomized to prevent its effects contaminating or biasing the study outcomes (Drury, 1995).69 We have updated the list in the proposal based on our additional literature and findings from the field interviews.
Task (Software)
Time on Task (including dark adaptation if required) Probability of a true defect
Operator (Liveware)
Training on specific task, here the background as inspector or not Cognitive skills: search and decision ability Inspector Age
Machine (Hardware)
Display contrast Display brightness
Environment (Environment)
Lighting level in booth Rest breaks, non-social interruptions Time of day and prior sleep patterns
4.2 Measuring Performance and Well-Being in Fatigue Because our focus is on temporal effects in inspection tasks, we need to define carefully how such effects can be measured. For any system with a human element, there are broadly two measures:
36
Performance: Effect of the human on the system Well-Being: Effect of the system on the human
Thus, in aircraft inspection, we can measure performance as probability of detection (PoD), probability of false alarm (PFA) and some measure of speed or time taken or unit inspected. These measures are clearly of the greatest immediate interest as they delineate the factors that must be controlled by management and regulators, i.e. system reliability/safety and system timeliness. However, even if the desired performance can be achieved, the system will not perform for long if the human in the system pays a high price in well-being. If the inspector becomes injured or stressed, then performance either ceases or deteriorates. System level symptoms are sickness, absenteeism or labor turnover. Thus, we cannot ignore measures of such factors as fatigue symptoms, drowsiness/alertness, workload or stress. These can be measured both physiologically and psychologically. To understand better the findings on temporal effects in inspection tasks, the following section gives a short description of the measurements used, concentrating on inspection or its component tasks (e.g. search and decision). Vigilance tasks are probably the most relevant. 4.2.1 Performance Measures All of these measures also have appropriate statistics: mean and variability. High performance consists of performing the task well (good mean) and consistently (low variability). In visual search, the goal is to locate an indication. Typical measures are (Drury, 1994):15
1. Probability of search success 2. Search time, i.e. how long it took to search an item to end up finding the
indication. 3. Stopping time (i.e. how long it took to search a complete item when no
indication was found. Stopping time is the time at which the inspector decides that further search is unproductive and so moves to the next item.
Note that in a visual search task, false alarms are logically not present, although they do occur occasionally. If an indication is located (search success) it is the subsequent decision task that generates the false alarms. In decision and vigilance tasks, performance is measured by:
1. Probability of detection of a true signal (PoD), i.e. a true defective is detected. 2. Probability of false alarm (PFA), i.e. a non-signal is called as a defect. 3. Reaction time or response latency after the appearance of a target (e.g. Pigeau et
al, 1995).35
37

Again, the variability of these measures is itself a useful metric for poor performance (e.g. Thackray et al, 1977).65
4.2.2 Well-Being Measures These can be broadly classified by the techniques used in measurement: physiological or psychological. Physiological: Measures known to be correlated to fatigue, stress or alertness. These include:
1. Heart rate mean and variability 2. Respiration rate 3. Blood pressure (systolic and diastolic) 4. Skin conductance 5. Muscle tone in un-used muscles 6. Body temperature 7. Measures from blood or urine samples, e.g. catecholamines 8. Objective measures of factors known to affect fatigue or stress, e.g. hours of sleep
prior to work (e.g. Johnson et al, 2001)45 9. Blood flow to brain (TCD paragraph) 10. Brain wave activity 11. Body movement
TCD, Transcranial Doppler sonograpy, allows continuous monitoring of blood flow in the left and right cerebral hemispheres (Hitchcock, et al 2003).52 They showed for both levels of signal salience (high and low), that the detection rate of critical signals was very stable and remained high in the 100% cue-reliability condition but declined over time in the 80%, 40%, and no-cue conditions. The performance effects for cueing were closely mirrored by changes in cerebral blood flow in the right hemisphere in conjunction with low salience signals. Overall, the study shows that evidence for right hemispheric brain system that is involved in the functional control of vigilance performance over time. Critical evoked potentials were measured by Parasuraman and Davies (1977) in relation to event rate and signal regularity. Both late amplitude and latency measures of the CEP are significantly related to within session performance changes, different response latencies associated with different response categories, and to effects of event rate and signal regularity. Psychological: These are measures obtained by directly asking the inspector about their well-being. They are important in, for example, stress measurement, as stress is really only present if the inspector feels (reports) stress or its associated symptoms. Just because psychological measures use judgments by the inspector, and are therefore “subjective”, does not mean that they are unreliable or invalid. We have many validated
38
scales for concepts such as fatigue, boredom or stress.
1. Alertness, e.g. VAS. This is a standard visual analog scale and was used by Fletcher and Dawson (2001a)33 to measure self-rated alertness. This test consists on a 100mm line with the label ‘extremely alert’ at one end, and ‘not at all alert’ at the other.
2. Workload, e.g. JLX. Subjects ratings of workload on subscales, ranging from 1 to 100 are averaged to produce a workload score.
3. Boredom - Boredom proneness (BP) is considered an isolated, single measurable trait and a 28 item scale Sawin and Scerbo (1995).70 The Boredom Proneness Scale (BPS) was developed to measure this trait (Farmer and Sunderberg, 1986).71
4. Stress - (SACL Stress Arousal Checklist from Mackay and Cox,1985).72 This questionnaire has questions pertaining to stress and arousal resulting from work, and measures the levels of each.
5. Pearson’s scale – Scale analysis of fatigue checklist (Pearson, 1957). 6. A new scale called the Swedish Occupational Fatigue Inventory (SOFI)
developed by Ahsberg and Kzellberg (1997) to measure fatigue in many jobs. Only certain subscales are relevant to our work, as physical fatigue is unlikely to be a factor. However, we will use the whole 25-item inventory and let the data determine whether this is an accurate assessment.
4.3 Design Alternatives for Inspection Fatigue Experiments Whatever decisions we make about factors and levels, and indeed the whole experimental design, we must determine the validity and reliability of the experiments in answering the questions set in the Execution Plan. Reliability is the ability of the experiment to be replicated and still give the same outcome. High reliability demands strict control, over all variables, not just those appearing as factors at multiple levels but also those fixed or randomized. For example, if we restricted ourselves to a single defect size (e.g. crack length) we would need to control this exactly as any variation would reduce the reliability of the experiment. Validity, on the other hand, is the ability to apply the results directly to a target situation, i.e. the inspector using FPI or MPI in the inspection booth of a hangar at an airline or repair station. This is determined not just by surface realism but by cognitive correspondence between the experiment and the target task. As was noted earlier, the vigilance decrement can be easily and reliably demonstrated in a simulated setting (e.g. lab experiment) using naïve participants. What is largely missing is the same demonstration in a field setting with actual inspectors. Thus we must make known trade-offs between the control condition associated with increased reliability and the desire for validity in actual inspection situations. In particular, we must make choices of material and participant variables with some care. At a meeting in September 2003 with Russell Jones to determine the direction of experimental work, we considered three levels of realism for both the experimental materials and the participants:
39
Material: 1. Real parts, either parts being inspected for use on aircraft, or test samples
available at airlines, engine shops or Sandia Labs (AANC). 2. Realistic computer models of parts, either 2-D or 3-D, that can be used for
realistic interactions using computer graphics techniques. 3. Computer-based vigilance tasks using more abstract materials typical of prior
vigilance studies. Participants: 1. Aircraft Inspectors, either military or civilian available at airlines, repair
stations, engine shops. 2. Unemployed factory workers available for training and experimentation in the
Buffalo area. 3. Student participants, ranging from typical undergraduate psychology majors in a
participant pool to graduate students in aerospace engineering. We could potentially add students in A&P schools.
The third alternative in each list was rejected, as this would just produce another vigilance study, adding little to the thousands already reported. Real parts are difficult to use in FPI due to the poor repeatability of repeated processing, which would cause large uncontrolled changes in the visual appearance of parts and cracks. Similarly, it will be difficult to recruit aircraft inspectors in the present airline and military climates. The preferred alternative is to use unemployed factory workers with a high quality visual representation of parts, e.g. engine blades, on a computer graphics system, with a small sample check using aircraft inspectors on the same system, and possibly another small sample check on aircraft inspectors with a sample of real blades. SUNY Buffalo has used unemployed factory workers in previous inspection studies to good effect. With less than a day’s training, they can perform the limited inspection task required to the same standard as industrial inspectors. We can pay them a useful rate for either day or night work. This was done to good effect in earlier studies at the University at Buffalo (Gallwey and Drury, 1986;75 Drury and Kleiner, 1984;76 Bishu and Drury, 198677) where expert and novice performance differed in level but not in pattern. We can also use engineering students as an additional resource, although students at A&P schools would potentially be more useful. 4.4 Detailed Experimental Design. After an extensive literature review, a variety of possible experimental tasks/inspections were considered as in the proposal. From those considered, the experimenters choose the Florescent Penentrant Inspection (FPI) to serve as a platform to design a computer-based simulation because it is typically repetitive, and performed under conditions. More specifically the simulation would be designed to mimic the tasks involved with the FPI of turbine fan blades. This very common, yet repetitive NDI inspection task is quite
40

standard throughout the airline industry. To aid in the design of the simulation, two onsite visits were conducted; the first was with two major airlines, at their headquarters maintenance facility. Both sites allowed experimenters full access to their FPI area’s for blade NDI. These visits proved to be instrumental in the fine-tuning of the simulation to better capture how the inspections are conducted on site. Along with physical design layouts of the FPI lines, data was collected on the environmental factors that affect the performance of the inspectors. These included lighting levels in the FPI booths, thermal environments in which the inspections are conducted, and the background noise levels that are present. The way to design a successful and efficient experiment is to perform not one but a series of experiments. At this stage, the six variables we expect to include at multiple levels are:
1. Time on Task 2. Probability of a true defect 3. Inspector or not 4. Lighting level in booth 5. Rest breaks, non-social interruptions 6. Time of day
Other variables, such as display and other environmental parameters will be fixed at levels appropriate to current NDI practice. There are three other factors that we intend to include as covariates:
1. Prior sleep patterns 2. Participant age 3. Cognitive skills: search and decision ability
As explained in the proposal, we intend to run a screening experiment with each factor at 2 levels giving only 26 = 64 combinations to find the significant interactions. We will probably run this as a fractional factorial 26-1 = 32 combination experiment, aliasing higher-order interactions with main effects. This is a Resolution VI design, where all main effects and 2-way interactions are only aliased with higher order interactions. The results from the screening experiment will be used to design a series of parametric experiments using only the significant interactions. For example, if only (Time on Task) x (Lighting Level) and (Probability of Defect) x (Time of Day) were significant interactions, we would have two 2-facator experiments giving a much smaller set of conditions to test. 4.4.1 Participants Two separate groups of subjects will be employed in the pilot testing and screening
41
experiments stages. To help validate and ensure face validity of the simulation, certified NDI inspectors will be used in the pilot-testing phase of the simulation. These individuals’ posses intimate knowledge of the FPI task and will be able to point out possible design flaws and conflicts in the simulation. Once the pilot testing stage of the simulation is complete, experimenters will employee both NDI inspectors and unemployed factors workers to conduct the simulation experiments. Participants will be trained on the specific task of FPI on turbine blades, and formally familiarized with the operations of the computer-based simulation. 4.4.2 Simulation The FPI simulation was created using Visual Basic®, and Windows® XP as an operating platform. Two Dell® (Pentium® IV) computers with 17-inch LCD displays, utilizing a keyboard and mouse as external input devices, will be used as the primary inspection stations. These computers are located in the Research Institute for Safety and Security in Transportation (R.I.S.S.T.) Laboratory at the University at Buffalo. The simulation itself was design to serve two purposes, first to mimic the task elements comprised in a FPI inspection, and second function to capture relevant performance elements (i.e. time on task, probability of detection, etc.) for purposes of statistical analysis. All of these critical measures are captured in an event log. Figure 12 is an actual screenshot from the FPI simulation. The simulation is comprised of several elements. The center window allows the operator to inspect one view of the blade at a time. This view can be changed by use of a navigational tool. The navigational arrows allow the user to cycle through the six discrete views of each blade just as one would turn a cube in three-dimensional space. The six faces have been labeled Front, Rear, Leading Edge, Trailing Edge, Base, and Tip. As the user selects each of the various views, the time and view name are recorded in the event log. This will allow for further analysis of search patterns and behaviors. Once the user locates the desired view, he/she can begin the inspection task. The objective is to locate and correctly recognize small cracks in the blade. The operator will have to decide whether or not a fault is present by cycling through the various views. To aid in the decision process, two tools have been included in the simulation that are also utilized by industry inspectors. The first is a magnification tool selected using the mouse. This allows for a one-time magnification (4x) of the image to mimic the use of a 4x scope by the inspector. Once selected any desired portion of the blade that they wish to magnify may be selected. Once magnified, the user may still move around the rest of the image allowing for viewing of the entire image under magnification. To remove the magnification the user need simply deselect the magnification option. The second tool, the swab, is used to remove background noise. Once a potential crack is discovered, inspectors in industry use an alcohol swab to wipe the area to remove possible background noise (excess florescent penentrant). Once this is done the inspector may more easily discern whether the anomaly was in fact a defect or just noise. The
42
swab tool will serve the same purpose. Once selected, the user will have the ability to swab away any potential defects to discern their fault status. This swabbing process works on a layering scheme that will be further explained in the following section. At the end of the inspection of each blade, the inspector can select the report tool. Once this tool is selected, a dialogue box is displayed in which the user may record any found defects, the location and view where it was located, or that the blade was defect free. All this information is captured and recorded in the event log. The user may then select the next bade for inspection. 4.4.3 Event Log The event log serves as a mechanism to capture participant’s movements, their decisions, and the selected conditions under which they are interacting with the inspection simulation. This recording process is accomplished in several stages all of which are recorded into a Microsoft® Notepad file. The first process involves capturing details of the experimenter conducting the trial, the trial number corresponding to conditions under which the simulation is operating (i.e. fault probability, environmental conditions, etc…), and the participant number. This data is input through a series of prompts at the start of the program. The next portion of data collection involves time on task recordings. Once the initial prompts are correctly entered, the participant is prompted with a start key to begin the inspection simulation. Once the start key is selected, the simulation records all key and tool selection choices and their corresponding times. The system clock tags each of event selections in hundredths of a second (i.e. 10.26 seconds), and records them into the action catalog in the data file (see Figure 7). The final recording process involves capturing search patterns of the participants. To gain additional insight to the search strategies employed by the participants, the simulation also captures the area’s where the swab tool is used (starting and ending points), and a reporting log. The swab selection (time), and the starting and end points are captured to determine whether similar search patterns are being employed throughout the study. The Reporting tool dialog box allows the participants to report their findings at any point in the inspection of a blade, typically when a defect is found. The reporting box is opened by selecting the Report tool with the mouse. Once selected, the keyboard may be used to enter the status or condition of the blade (i.e. faults discovered, fault locations, fault types). This log may then be used to determine the order or pattern in which the blade was inspected, and whether or not the correction condition of the blade was determined. All of the data is formatted for easy pasting into statistical and spreadsheet programs.
43

Figure 7. Event Log 4.4.4 Measures From the event log we can calculate times for searching each view, as well as probabilities of using the tools. The swab tool gives useful information to help distinguish between Search errors and Decision errors. If the swab tool is not used at a defect, then the Search cannot have succeeded. If it is used and the defect is still not detected, then a Decision error has occurred. This allows us to make distinctions of importance in relating the data to the literature, as much of the vigilance literature does not include a search component. It also enables us to find appropriate interventions as those for search are quite different from those in decision (e.g. discussion in Drury, 2001).5 In addition to speed and accuracy measures of performance, we intend to measure the reported state of the participant. This will include at least the NASA TLX scale of workload and the SOFI scales of fatigue. There has been recent evidence that vigilance is perceived as having high workload and being fatiguing, so that we need to make the same measures for our inspection simulation to be able to relate our findings to those in the literature.
44
4.4.5 Blades A set of sixty-three blades was photographed at the AANC at Sandia National Laboratories. These were blade #3 from the compressor stage of a JT8-D engine. During year two it is planned to photograph two similar sets of different blades to allow enough blades for both training and experimentation. Each blade is comprised of six separate views/images, which together to create a three-dimensional rendering of the blade. The views for 64 blades were captured at Sandi Laboratories in Albuquerque, NM. Blades were photographed using a fixture to ensure consistency among the blade images. The images where then download to a computer and transferred into individual folders and labeled to their appropriate view. The images were next manipulated in Adobe® Photoshop to make them more closely resemble the lighting and viewing conditions that industry inspectors’ experience, and to ensure contrast consistency. Figure 8 shows the six views of a typical blade after color consistency adjustments. Once the desired levels were attained, a process of dual layering began. Residual florescent penetrant creates visual background noise that can either be seen as possible faults or obscure faults under the florescent lighting (see Figure 9). It is the inspector’s task to discriminate the noise from faults, which they do by using an alcohol swab (also in simulation). If the marking remains after the swabbing, then a fault is present. If the marking can be rubbed away, then it was just residual penentrant. To mimic this background effect, and ensure that the fault is not scraped away, a dual layering process was employed. Layer one consists of the original re-contrasted images, and fault/s if inserted. The second layer then consists of a transparent layer containing the inserted background noise. This second layer is then matted over the first layer. This matting effect allows for background noise to cover and conceal faults and add distracters. These background effects may then be safely removed using the scraper tool without disturbing or removing the fault/s that may lie underneath. This process helps to create a very realistic rendering of what industries inspectors must contend with.
45
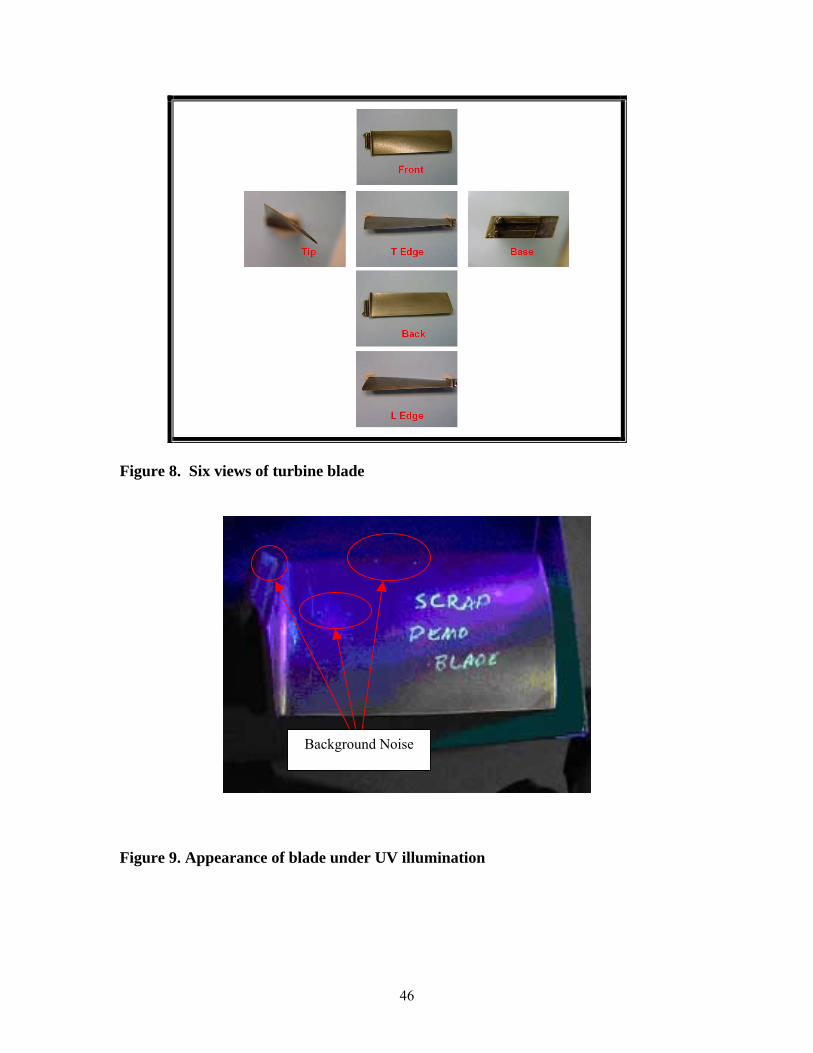
Figure 8. Six views of turbine blade
Background Noise
Figure 9. Appearance of blade under UV illumination
46
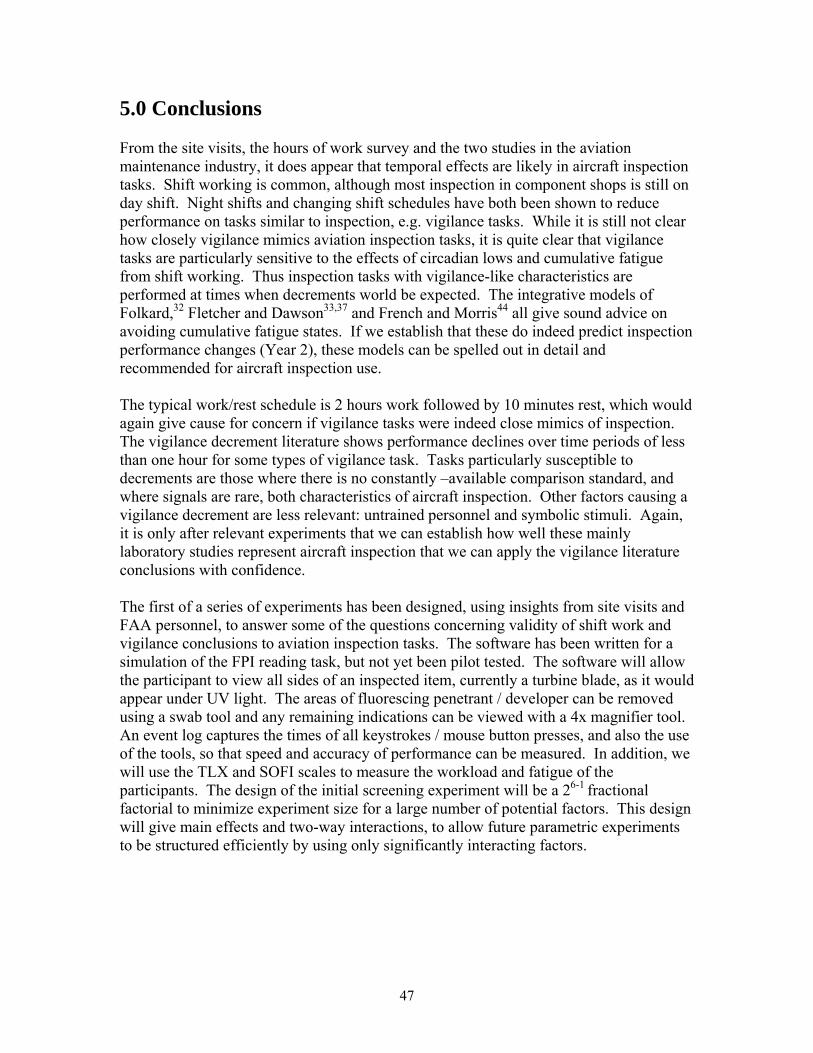
5.0 Conclusions From the site visits, the hours of work survey and the two studies in the aviation maintenance industry, it does appear that temporal effects are likely in aircraft inspection tasks. Shift working is common, although most inspection in component shops is still on day shift. Night shifts and changing shift schedules have both been shown to reduce performance on tasks similar to inspection, e.g. vigilance tasks. While it is still not clear how closely vigilance mimics aviation inspection tasks, it is quite clear that vigilance tasks are particularly sensitive to the effects of circadian lows and cumulative fatigue from shift working. Thus inspection tasks with vigilance-like characteristics are performed at times when decrements world be expected. The integrative models of Folkard,32 Fletcher and Dawson33,37 and French and Morris44 all give sound advice on avoiding cumulative fatigue states. If we establish that these do indeed predict inspection performance changes (Year 2), these models can be spelled out in detail and recommended for aircraft inspection use. The typical work/rest schedule is 2 hours work followed by 10 minutes rest, which would again give cause for concern if vigilance tasks were indeed close mimics of inspection. The vigilance decrement literature shows performance declines over time periods of less than one hour for some types of vigilance task. Tasks particularly susceptible to decrements are those where there is no constantly –available comparison standard, and where signals are rare, both characteristics of aircraft inspection. Other factors causing a vigilance decrement are less relevant: untrained personnel and symbolic stimuli. Again, it is only after relevant experiments that we can establish how well these mainly laboratory studies represent aircraft inspection that we can apply the vigilance literature conclusions with confidence. The first of a series of experiments has been designed, using insights from site visits and FAA personnel, to answer some of the questions concerning validity of shift work and vigilance conclusions to aviation inspection tasks. The software has been written for a simulation of the FPI reading task, but not yet been pilot tested. The software will allow the participant to view all sides of an inspected item, currently a turbine blade, as it would appear under UV light. The areas of fluorescing penetrant / developer can be removed using a swab tool and any remaining indications can be viewed with a 4x magnifier tool. An event log captures the times of all keystrokes / mouse button presses, and also the use of the tools, so that speed and accuracy of performance can be measured. In addition, we will use the TLX and SOFI scales to measure the workload and fatigue of the participants. The design of the initial screening experiment will be a 26-1 fractional factorial to minimize experiment size for a large number of potential factors. This design will give main effects and two-way interactions, to allow future parametric experiments to be structured efficiently by using only significantly interacting factors.
47
6.0 Objectives for Year 2 (from Objectives sent to FAA Project Monitor January 2004) For Year 2 (Feb 1 2004 to Jan 31 2005) the objectives are a mixture of Phase I and Phase II tasks from the original Execution Plan of January 2002. Because Year 1 was originally meant to be 12 months (Feb 2002 to Jan 2003), Phase I was designed to coincide with Year 1. When the grant did not start until August 2003, we attempted to complete most of the tasks of Phase I before the end of Year 1 on January 31, 2004. We have been successful in performing the detailed literature survey, making contact with and visiting inspection worksites, designing the software for the simulation study and designing the experiments to be run. We have not completed sufficient pre-testing of the design, nor have we been able to collect sufficient survey and interview data on hours of work, the inspection environment and strategies to combat fatigue in the five months of the re-scheduled Year 1. Thus we will continue some of these objectives into Phase II to compensate for the reduced duration of Year 1. Phase II was originally planned to cover Year 2 and Year 3. Thus the new objectives for Year 2, the first part of Phase II with some remaining parts of Phase I, to run from February 1, 2004 to January 31, 2005 is as follows:
i. Interview additional inspection personnel, especially those in shop situations such as FPI and MPI, to determine distribution of working times and what strategies (e.g. rest breaks) are used to help combat fatigue.
ii. Sample additional typical inspection situations, e.g. FPI and MPI, to determine the visual and social environments actually encountered
iii. Use design of experiments (DoE) procedures to run a screening experiment using the factors identified in Year 1 using a mix of engineering students and inspectors as agreed with Rusty Jones in September 2003. These factors will consist of at least duration of work period, visual environment, social environment, shift and scarcity of defects. For 6 factors a 2(6-1) experiment will be run to measure the presence of interactions between factors.
iv. Quarterly (December, March, July, and September) research progress status reports. Informal e-mail reports from the program manager aviation maintenance human factors to Les Vipond.
v. Phase II reports (to be published in the AAR-100 aviation maintenance human factors FY04 program review).
vi. Grantee will submit an annual report using AAR-100’s Productivity Report website (http://www.hf.faa.gov/report/)
vii. If agreed, University at Buffalo: SUNY can host the annual grantees meeting in September 2004. We will need to discuss cost arrangements for such an event.
48
Deliverables for Year 2 will be:
i. Report on the screening experiment ii. Report on the distribution of working times and what strategies (e.g. rest
breaks) are used to help combat fatigue, and the visual and social environments actually encountered
iii. A paper will be submitted to the HFES annual meeting (New Orleans, October 2004) on the literature we have collected in Year 1. This will be entitled “Temporal effects in inspection on four time scales”
49
References Ahsberg, G. and Kjellberg, A. (1997). Perceived quality of fatigue during different occupational tasks: Development of a questionnaire. International Journal of Industrial Ergonomics, 20(2), 121-135. Bavejo, A., Drury, C. G., Karwan, M. and Malone, D. M. (1996). Derivation and test of an optimum overlapping-lobe model of visual search, IEEE Transactions on systems, man, and cybernetics, 28, 161-168. Bishu, R.R. and Drury, C.G. (l986). A Comparison of Performance in a Surface-Wiring Task Using Laboratory and Plant Subjects. Proceedings of the Human Factors Society 30th Annual Meeting l986, 393-397. Bureau of Labor Statistics (BLS, Washington, 1991). Catchpole, K., Fletcher, J., McClumpha, A., Miles, A. and Zar, A. (2002) Threat image projection: applied signal detection for aviation security. Proceedings of the IEEE Conference on Human Factors and Power Plants, 41-45. Chapman, D. E. and Sinclair, M. A. (1975). Ergonomics in inspection tasks in the food industry. In C. G. Drury and J. G. Fox (Eds), Human Reliability in Quality Control, London, Taylor & Francis, 231-252. Chi, C.-F. and Drury, C. G. (1998). Do people choose an optimal response criterion in an inspection task? IIE Transactions (1998), 30, 257-266. Chi, C.-F.- and Drury, C. (2001). Limits to human optimization in inspection performance, International Journal of Systems Science, 32 (6), 689–701. Craig, A. (1985). Field studies of human inspection: The application of vigilance research. Hours of Work: Temporal Factors in Work-Scheduling. Chichester, John Wiley and Sons, 133-145. Craig, A. and Coquhoun, W. P. (1977). Vigilance effects in complex inspection. In R. R. Mackie (ed), Vigilance, Theory, Operational Performance, and Physiological Correlates. New York and London, Plenum Press. Cruz, C. E., Boquet, A., Detwiler, C. and Nesthus, T. E. (May 2002). A Laboratory Comparison of Clockwise and Counter-Clockwise Rapidly Rotating Shift Schedules, Part II: Sleep. FAA Tech Report. Cruz, C. E., Boquet, A., Detwiler, C. and Nesthus, T. E. (July 2002). A Laboratory Comparison of Clockwise and Counter-Clockwise Rapidly Rotating Shift Schedules, Part II: Performance. FAA Tech Report.
50

Cruz, C. E., Boquet, A., Detwiler, C. and Nesthus, T. E. (November 2002). A Laboratory Comparison of Clockwise and Counter-Clockwise Rapidly Rotating Shift Schedules, Part II: effects on Core Body Temperature and Neuroendocrine Measures. FAA Tech Report. Dalton, J. and Drury, C. G. (2004). Inspectors’ performance and understanding in sheet steel inspection. Occupational Ergonomics. The Netherlands, IOS Press, Vol. 4. No. 1. Della Rocco, P. S. and Cruz, C. E. (May 1995). Shift work, Age, and Performance Investigation of the 2-2-1 Shift Schedule Used in Air Traffic Control Facilities I. The Sleep/Wake Cycle. FAA Tech Report. Della Rocco, P. S. and Cruz, C. E. (September 1996). Shift Work, Age, and Performance: Investigation of the 2-2-1 Shift Schedule Used in Air Traffic Control Facilities II. Laboratory Performance Measures. FAA Tech Report. Della Rocco, P. S., Comperatore, C., Caldwell, L. and Cruz, C. E. (February 2000). The Effects of Napping on Night Shift Performance. FAA Tech Report. Drury, C. G. (l973). The Effect of Speed of Working on Industrial Inspection Accuracy. Applied Ergonomics, 4, 2-7. Drury, C. G. (1992). Inspection Performance. In G. Salvendy (ed.), Handbook of Industrial Engineering (2nd Edition), John Wiley & Sons, New York. Drury, C. G. (1994). The speed-accuracy trade-off in industry. Ergonomics, 37, 747-763. Drury, C. G. (1995). Designing ergonomics studies and experiments. In J. R. Wilson and E. N. Corlett (Eds), Evaluation of Human Work (Second Edition), Chapter 5, Taylor and Francis, New York, 113-144. Drury, C. G. (1999). Human Factors Good Practices in Fluorescent Penetrant Inspection, Human Factors in Aviation Maintenance - Phase Nine, Progress Report, DOT/FAA/AM-99/xx, National Technical Information Service, Springfield, VA. Drury, C. G. (2001). Human Factors and Automation in Test and Inspection, In G. Salvendy, Handbook of Industrial Engineering, Third Edition, Chapter 71, John Wiley & Sons, New York, 1887-1920. Drury, C. G. and Addison, J. L. (l973). An industrial study of the effects of feedback and fault density on inspection performance. Ergonomics, l6, l59-l69. Drury, C.G. and Corlett, E.N. (l975). Control of Performance in Multi-element Repetitive Tasks. Ergonomics, l8, 279-298.
51

Drury, C. G. and Forsman, D. R. (1996). Measurement of the speed accuracy operating characteristic for visual search. Ergonomics, 1996, 39(1), 41-45. Drury, C. G. and J. G. Fox (Eds.) (1975). Human Reliability in Quality Control, London, Taylor & Francis. Drury, C. G. and Hong, S.-K. (2000). Generalizing from single target search to multiple target search. Theoretical Issues in Ergonomics Science. 1(4), 303-314. Drury, C. G. and Kleiner, B. M. (l984). A Comparison of Blink Aided and Manual Inspection Using Laboratory and Plant Subjects. Proceedings of l984 Human Factors Annual Meeting, 670-674. Drury, C. G. and Prabhu, P. V. (1994). Human factors in test and inspection. In G. Salvendy and W. Karwowski (eds.), Design of Work and Development of Personnel in Advanced Manufacturing. New York, J. Wiley, 355-402. Drury, C. G. and Watson, J. (2002). Good Practices in Visual Inspection, Final Report for the FAA/Office of Aviation Medicine. Drury, C. G., Spencer, F. W. and Schurman, D. (1997). Measuring human detection performance in aircraft visual inspection. In Proceedings of the 41st Annual Human Factors and Ergonomics Society Meeting, Albuquerque, NM. Farmer, R. and N. D. Sunderberg. (1986). Boredom Proneness- The Development and correlates of a new scale. Journal of Personality Assessment, 50, 4-17. Fletcher, A. and Dawson, D. (1998). A Work-Related Fatigue Model Based on Hours-of-Work. Managing fatigue in transportation: proceedings of the 3rd Fatigue in Transportation Conference, Fremantle, Western Australia, 189-208. Fletcher, A. and Dawson, D. (2001a). A quantitative model of work-related fatigue: empirical evaluations. Ergonomics, 44(5), 475-488. Fletcher, A. and Dawson, D. (2001b). Field-based validations of a work-related fatigue model based on hours of work. Transportation Research Part F 4, 75-88. Folkard, S. (2002). Work Hours of Aircraft Maintenance Personnel. Civil Aviation Authority, CAA Paper 2002/06. Folkard, S. and Monk, T. (1985). Hours of Work, Temporal Factors in Work-Scheduling, Chichester, John Wiley and Sons. Fox, J. G. (1977). Quality control of coins, In H. G. Maule and J. S.Weiner (eds), Case Studies in Ergonomics Practice, London, Taylor & Francis, Vol. 1.
52
French, J. and Morris, C. S. (2003). Modeling Fatigue Degraded Performance in Artificial Agents. Proceeding of the Human Factors and Ergonomics Society 47th Annual Meeting, 307-310. Gallwey, T. J. and Drury, C. G. (1986). Task complexity in visual inspection. Human Factors, 28 (5), 595-606. Gallwey, T. J. (1998a). Evaluation and control of industrial inspection: Part I – Guidelines for the practitioner1, International Journal of Industrial Ergonomics, Volume 22, Issues 1-2, 1 August 1998, Pages 37-49 Gallwey, T. J. (1998b). Evaluation and control of industrial inspection: Part II – The scientific basis for the guide1, International Journal of Industrial Ergonomics, Volume 22, Issues 1-2, 1 August 1998, Pages 51-65. Goldberg, J. H. and Bernard, T. M. (1991). Influence of Perceived Defect Probability on Visual Inspection Time. In W. Karwawski and J.W. Yates (eds), Advances in Industrial Ergonomics and Safety III, New York, Taylor and Francis. Gramopadhye, A. K. (1992). Training for Visual Inspection. Unpublished Dissertation, State University of New York at Buffalo, Buffalo, NY. Gramopadhye, A. K., Drury, C. G. and Sharit, J. (1997). Feedback strategies for visual search in airframe structural inspection. Int. Journal of Industrial Ergonomics, 19(5), 333-344. Harris, D. H. and F. B. Chaney (1969). Human Factors in Quality Assurance. New York, John Wiley and Sons. Hartley, L. R., Arnold, P. K., Hobryn, H. and MacLeod, C. (1989). Vigilance, Visual Search and Attention in an Agricultural Task. Applied Ergonomics, 20(1), 9-16. Hitchcock, E. M., Warm, J. S., Matthews, G., Demeber, W. N., Shear, P. K., Tripp, L. D., Mayleben, D. W. and Parasuraman, R. (2003). Automation cueing modulates cerebral blood flow and vigilance in a simulated air traffic control task. Theoretical Issues in Ergonomic Science, 4(1-2), 89-112. Hong, S.-K. and Drury, C. G. (2002). Sensitivity and validity of visual search models for multiple targets. Theoretical Issues in Ergonomic Science, 1-26. Huey, B. M. and Wickens, C. D. (1993). Workload Transition: Implications for Individual and Team Performance, The National Academy of Sciences. Johnson, W. B., Mason, F., Hall, S. and Watson, J. (January 2001). Evaluation of
53
Aviation Maintenance Working Environments, Fatigue, and Human Performance. Tech Report R04-0167 A. Karwan, M., Morawski, T. B. and Drury, C. G. (1995). Optimum speed of visual inspection using a systematic search strategy. IIE Transactions (1995), 27, 291-299. Mackay, C. and Cox, T. (1994). Stress Arousal Checklist (SACL). In J. Fischer and K. Corcoran (eds), Measures for clinical practice: A sourcebook. 2nd edition, New York, Free Press, 632-633). Mackworth, N. H. (1948). The breakdown of vigilance during prolonged visual search. Quarterly Journal of Experimental Psychology, 1, 6-21. McNichol, D. (1972). A Primer of Signal Detection Theory. Sydney, Australia, Allen and Unwin. Megaw, E. D. (1979). Factors affecting visual inspection accuracy. Applied Ergonomics, 10, 27-32. Molloy, R. and Parasuraman, R. (1996). Monitoring an Automated System for a Single Failure: Vigilance and Task Complexity Effects. Human Factors, 38(2), 311-322. Monk, T. (1976). Target Uncertainty in Applied Visual Search. Human Factors, 18(6), 607-612. Morawski, T., Drury, C. G., and Karwan, M. H. (l980). Predicting search performance for multiple targets. Human Factors, 22.6, 707-7l8. Morawski, T. B., Drury, C. G., and Karwan, M. H. (1992). The Optimum Speed of Visual Inspection Using a Random Search Strategy. IIE Transactions, 24, 122-133. Murgatroyd, R. A., Worrall, G. M., and Waites, C. (1994). A Study of the Human Factors Influencing the Reliability of Aircraft Inspection, AEA/TSD/0173. Risley, AEA Technology. Panjawani, G. and Drury, C. G. (2003). Effective Interventions in Rare Event Inspection. Proceedings of the Human Factors and Ergonomics Society Annual Meeting, Denver, CO, 41-45. Parasuraman, R. and D.R. Davies. (1977) A taxonomic Analysis of Vigilance Performance. In R. R. Mackie (ed), Vigilance, Theory, Operational Performance, and Physiological Correlates, New York and London, Plenum Press. Pearson, R. G. (1957). Scale analysis of a fatigue checklist. Journal of Applied Psychology, 41, 186-191.
54

Pigeau, R.A., Angus, R.G., O’Neill, P. and Mack, I. (1995). Vigilance Latencies to Aircraft Detection among NORAD Surveillance Operators. Human Factors, 37(3), 622-634. Rabbitt, P. M. A. (1968). Repetition effects and signal classification strategies in serial choice-response tasks. Quarterly Journal of Experimental Psychology. 20, 232-240. Rasmussen, J. (1983). Skills, rules, knowledge: signals, signs and symbols and other distinctions in human performance models. IEEE Transactions: Systems, Man and Cybernetics, SMC-13(3), 257-267. Sawin, D. A. and Scerbo, M. W. (1995). Effects of Instruction Type and Boredom Proneness in Vigilance: Implications for Boredom and Workload. Human Factors, 37(4), 752-765. See, J., Howe, S. R., Warm, J. S. and Dember, W. N. (1995). Meta-Analysis of the Sensitivity Decrement in Vigilance. Psychological Bulletin, 117(2), 230-249. Smith, L., Folkard, S., Tucker, P. and Macdonald, I. (1998). Work Shift Duration: a review comparing eight and 12 hour shift systems. Occupational Environmental Medecine, 55, 217-229. Smith, C. S., Robie, C., Folkard, S., Barton, J., Macdonald, I., Smith, L., Spelten, E., Totterdell, P. and Costa, G. (1999). A Process Model of Shiftwork and Health. Journal of Occupational Health Psychology. 4(3), 207-218. Spencer, F. and D. Schurman (1995). Reliability Assessment at Airline Inspection Facilities. Volume III: Results of an Eddy Current Inspection Reliability Experiment. DOT/FAA/CT-92/12. Atlantic City, FAA Technical Center. Thackray, R. (1994). Correlates of individual differences in non-destructive inspection performance, DOT/FAA/Am-94/xx. Proceedings of the Human Factors in Aviation Maintenance - Phase Four, Volume 1, Program Report, Springfield. Teichner, W. H. (1974). The Detection of a Simple Visual Signal as a Function of Time of Watch. Human Factors, 16(4), 339-353. Thackray, R. I., Bailey, J. P. and Touchstone, R. M. (1977). Physiological, Subjective and Performance Correlates of Reported Boredom and Monotony while Performing a Simulated Radar Control Task. In R. R. Mackie (ed), Vigilance, Theory, Operational Performance, and Physiological Correlates, New York and London, Plenum Press. Tsao, Y.-C. and Wang, T.-G.. (1984). Inspectors’ Stopping Policy After Fault Detection. Human Factors, 26(6), 649-657.
55

Vickers, D., Leary, J. and Barnes, P. (1977). Adaptation to Decreasing Signal Probability. In R. R. Mackie (ed), Vigilance, Theory, Operational Performance, and Physiological Correlates, New York and London, Plenum Press. Wang, M.-J. J., Lin, S.-C. and Drury, C. G. (1997). Training for strategy in visual search. International Journal of Industrial Engineering, 20, 101-108. Wickens, C. D. and Hollands, J. G. (Eds) (2000). Engineering Psychology and Human Performance (Third Edition), NJ, Prentice Hall.
56

List of Figures Figure 1 - Distribution of search performance for 11 visual inspectors…………..13 Figure 2 - ROC curve showing distribution of decision performance…………….14 for 11 visual inspectors Figure 3 - Top Level of Hierarchical Task Analysis of Visual Inspection………..16 Figure 4 - Hierarchical Task Analysis of the Search Function of ………………...17 Visual Inspection Figure 5- Hierarchical Task Analysis of the Decision Function of ……………….18 Visual Inspection Figure 6 - Time course of probability of detection in a typical vigilance task…….27 Figure 7 - Event Log……………………………………………………………….44 Figure 8 - Six views of turbine blade………………………………………………46 Figure 9 - Appearance of blade under UV illumination……………………………46
57
List of Tables Table 1 - Generic function description and application to inspection …………….7 Table 2 - Generic functions and errors for visual inspection ……………………...7 Table 3 - Probabilities and costs for inspection outcomes for a prior probability...10 of defect = p'
Table 4 - Four outcomes of inspection decisions………………………………….11 Table 5 - Four payoff values of inspection decisions……………………………...11 Table 6 - Comparison between attributes of vigilance tasks and …………………32 aircraft inspection tasks Table 7 - Demographic data on NDI inspectors …………………………………..34 Table 8 - Sample work characteristics of NDI inspectors ………………………...35
58
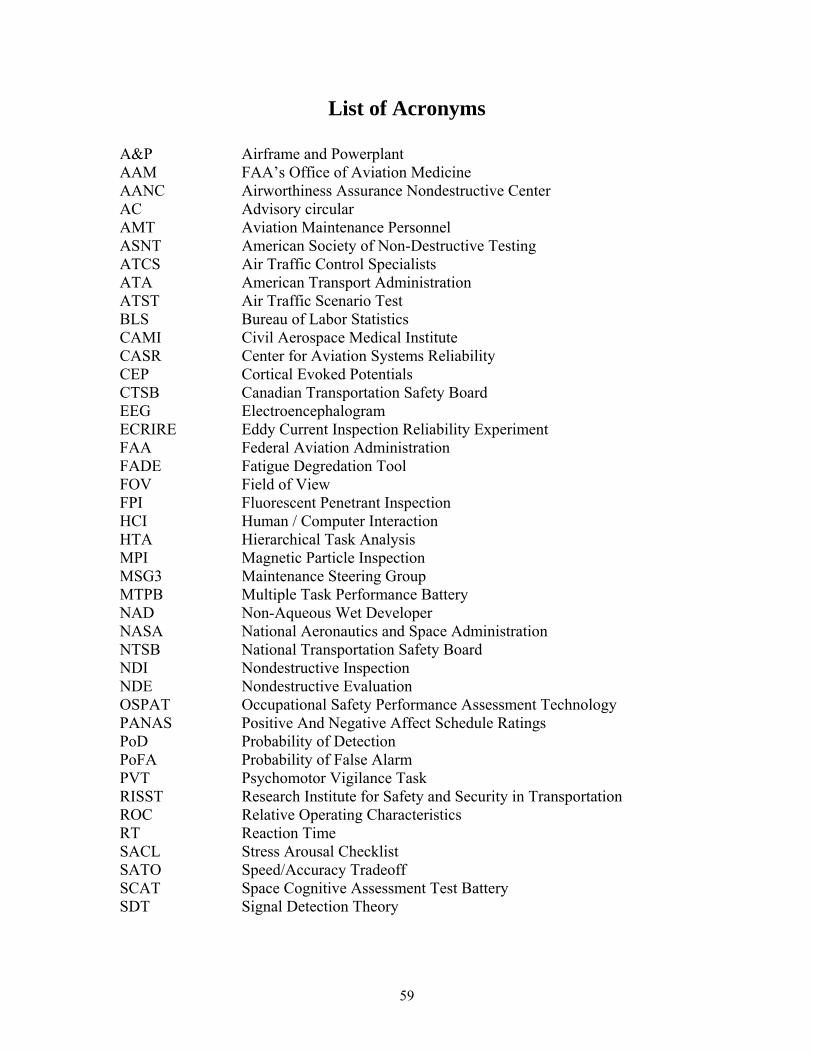
List of Acronyms A&P Airframe and Powerplant AAM FAA’s Office of Aviation Medicine AANC Airworthiness Assurance Nondestructive Center AC Advisory circular AMT Aviation Maintenance Personnel ASNT American Society of Non-Destructive Testing ATCS Air Traffic Control Specialists ATA American Transport Administration ATST Air Traffic Scenario Test BLS Bureau of Labor Statistics CAMI Civil Aerospace Medical Institute CASR Center for Aviation Systems Reliability CEP Cortical Evoked Potentials CTSB Canadian Transportation Safety Board EEG Electroencephalogram ECRIRE Eddy Current Inspection Reliability Experiment FAA Federal Aviation Administration FADE Fatigue Degredation Tool FOV Field of View FPI Fluorescent Penetrant Inspection HCI Human / Computer Interaction HTA Hierarchical Task Analysis MPI Magnetic Particle Inspection MSG3 Maintenance Steering Group MTPB Multiple Task Performance Battery NAD Non-Aqueous Wet Developer NASA National Aeronautics and Space Administration NTSB National Transportation Safety Board NDI Nondestructive Inspection NDE Nondestructive Evaluation OSPAT Occupational Safety Performance Assessment Technology PANAS Positive And Negative Affect Schedule Ratings PoD Probability of Detection PoFA Probability of False Alarm PVT Psychomotor Vigilance Task RISST Research Institute for Safety and Security in Transportation ROC Relative Operating Characteristics RT Reaction Time SACL Stress Arousal Checklist SATO Speed/Accuracy Tradeoff SCAT Space Cognitive Assessment Test Battery SDT Signal Detection Theory
59

SHELL Software Hardware Equipment Liveware SNL/AANC Sandia National Laboratories SOFI Swedish Occupational Fatigue Inventory SRK Skills Rule Knowledge SSI Standard Shiftwork Index SSS Stanford Sleepiness Scale TCD Transcranial Doppler neurosonography TIP Threat Image Projection TLX Task Load Index TOME Task Operator Machine Environment UV Ultraviolet VAS Visual Analog Scale
60

Appendix 1
61
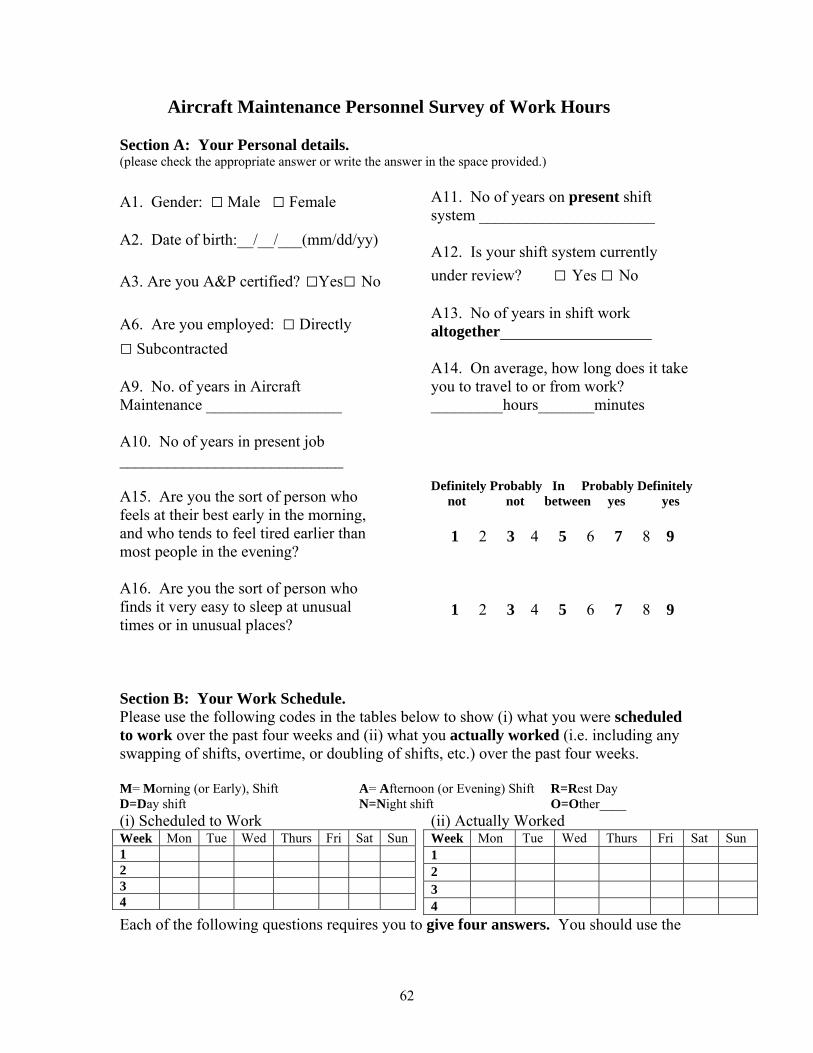
Aircraft Maintenance Personnel Survey of Work Hours Section A: Your Personal details. (please check the appropriate answer or write the answer in the space provided.) A1. Gender: □ Male □ Female A2. Date of birth:__/__/___(mm/dd/yy) A3. Are you A&P certified? □Yes□ No A6. Are you employed: □ Directly □ Subcontracted A9. No. of years in Aircraft Maintenance _________________ A10. No of years in present job ____________________________ A15. Are you the sort of person who feels at their best early in the morning, and who tends to feel tired earlier than most people in the evening? A16. Are you the sort of person who finds it very easy to sleep at unusual times or in unusual places?
A11. No of years on present shift system ______________________ A12. Is your shift system currently under review? □ Yes □ No A13. No of years in shift work altogether___________________ A14. On average, how long does it take you to travel to or from work? _________hours_______minutes Definitely Probably In Probably Definitely not not between yes yes 1 2 3 4 5 6 7 8 9 1 2 3 4 5 6 7 8 9
Section B: Your Work Schedule. Please use the following codes in the tables below to show (i) what you were scheduled to work over the past four weeks and (ii) what you actually worked (i.e. including any swapping of shifts, overtime, or doubling of shifts, etc.) over the past four weeks. M= Morning (or Early), Shift A= Afternoon (or Evening) Shift R=Rest Day D=Day shift N=Night shift O=Other____(i) Scheduled to Work Week Mon Tue Wed Thurs Fri Sat Sun 1 2 3 4
(ii) Actually Worked Week Mon Tue Wed Thurs Fri Sat Sun 1 2 3 4
Each of the following questions requires you to give four answers. You should use the
62
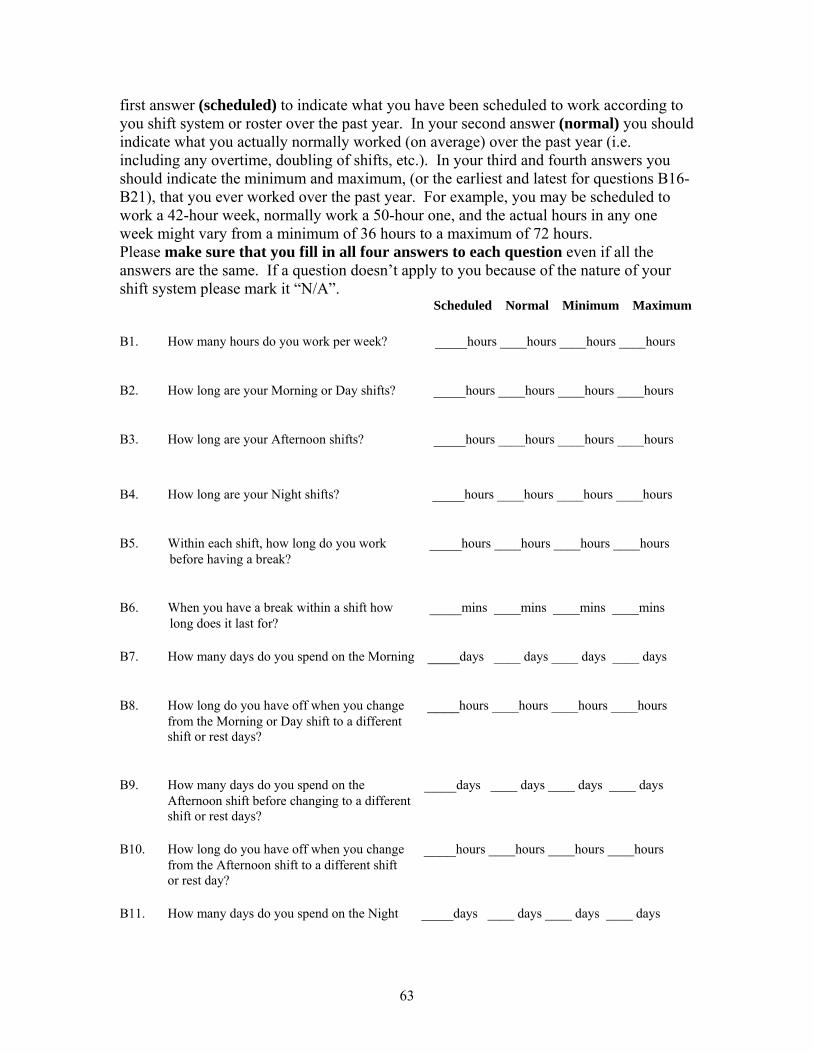
first answer (scheduled) to indicate what you have been scheduled to work according to you shift system or roster over the past year. In your second answer (normal) you should indicate what you actually normally worked (on average) over the past year (i.e. including any overtime, doubling of shifts, etc.). In your third and fourth answers you should indicate the minimum and maximum, (or the earliest and latest for questions B16-B21), that you ever worked over the past year. For example, you may be scheduled to work a 42-hour week, normally work a 50-hour one, and the actual hours in any one week might vary from a minimum of 36 hours to a maximum of 72 hours. Please make sure that you fill in all four answers to each question even if all the answers are the same. If a question doesn’t apply to you because of the nature of your shift system please mark it “N/A”.
Scheduled Normal Minimum Maximum B1. How many hours do you work per week? ____hours ____hours ____hours ____hours B2. How long are your Morning or Day shifts? ____hours ____hours ____hours ____hours B3. How long are your Afternoon shifts? ____hours ____hours ____hours ____hours B4. How long are your Night shifts? ____hours ____hours ____hours ____hours B5. Within each shift, how long do you work ____hours ____hours ____hours ____hours before having a break? B6. When you have a break within a shift how ____mins ____mins ____mins ____mins long does it last for? B7. How many days do you spend on the Morning ____days ____ days ____ days ____ days B8. How long do you have off when you change ____hours ____hours ____hours ____hours
from the Morning or Day shift to a different shift or rest days?
B9. How many days do you spend on the ____days ____ days ____ days ____ days
Afternoon shift before changing to a different shift or rest days?
B10. How long do you have off when you change ____hours ____hours ____hours ____hours from the Afternoon shift to a different shift or rest day?
B11. How many days do you spend on the Night ____days ____ days ____ days ____ days
63
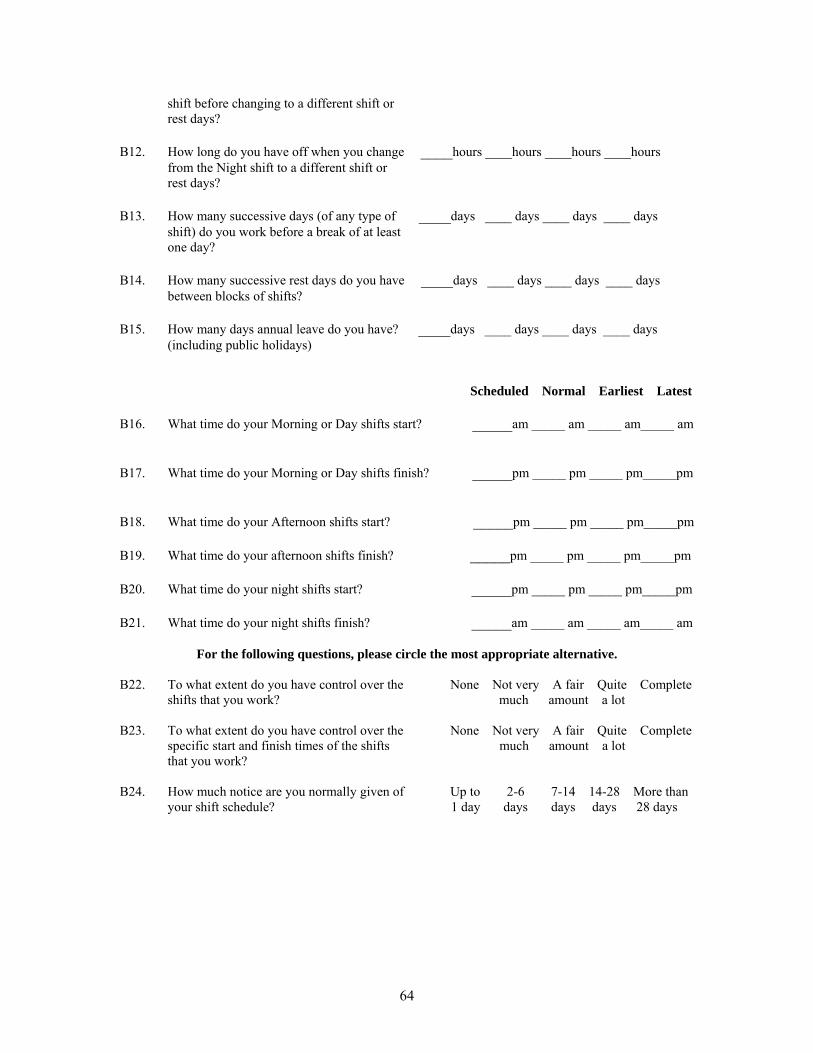
shift before changing to a different shift or rest days?
B12. How long do you have off when you change ____hours ____hours ____hours ____hours from the Night shift to a different shift or
rest days? B13. How many successive days (of any type of ____days ____ days ____ days ____ days
shift) do you work before a break of at least one day?
B14. How many successive rest days do you have ____days ____ days ____ days ____ days between blocks of shifts? B15. How many days annual leave do you have? ____days ____ days ____ days ____ days (including public holidays)
Scheduled Normal Earliest Latest B16. What time do your Morning or Day shifts start? _____am _____ am _____ am_____ am B17. What time do your Morning or Day shifts finish? _____pm _____ pm _____ pm_____pm B18. What time do your Afternoon shifts start? _____pm _____ pm _____ pm_____pm B19. What time do your afternoon shifts finish? _____pm _____ pm _____ pm_____pm B20. What time do your night shifts start? _____pm _____ pm _____ pm_____pm B21. What time do your night shifts finish? _____am _____ am _____ am_____ am
For the following questions, please circle the most appropriate alternative.
B22. To what extent do you have control over the None Not very A fair Quite Complete shifts that you work? much amount a lot
B23. To what extent do you have control over the None Not very A fair Quite Complete
specific start and finish times of the shifts much amount a lot that you work? B24. How much notice are you normally given of Up to 2-6 7-14 14-28 More than
your shift schedule? 1 day days days days 28 days
64

Section C: Sleep, Fatigue and Performance. The following questions relate to your sleep, fatigue and performance. If a question doesn’t apply to you because of the nature of you work schedule please mark it “N/A”.
How much sleep do you get between: C1. Successive Morning or Day shifts? C2. Successive Afternoon shifts? C3. Successive Night Shifts? C4. Successive Rest Days?
“Normally” Minimum Maximum ______hours______hours_____hours ______hours______hours_____hours ______hours______hours_____hours ______hours______hours_____hours
For the following questions, please circle the most appropriate alternative. On average, how alert or sleepy do you feel on: C5. The Morning or Day shift? C6. The Afternoon shift? C7. The Night shift?
Very Alert Neither Sleepy Very alert alert (but not sleepy nor fighting (fighting sleepy sleep sleep) 1 2 3 4 5 6 7 8 9 1 2 3 4 5 6 7 8 9 1 2 3 4 5 6 7 8 9
On, average how likely do you think you are to make a minor mistake on: C8. The Morning or Day shift? C9. The Afternoon shift? C10. The Night shift?
Very Fairly In Fairly Very unlikely unlikely between likely likely 1 2 3 4 5 6 7 8 9 1 2 3 4 5 6 7 8 9 1 2 3 4 5 6 7 8 9
On average, how confident are you that you can drive home safely after: C11. The Morning or Day shift? C12. The Afternoon shift? C13. The Night shift?
Very Fairly In Fairly Very Un- Confident Confident between Un confident Confident 1 2 3 4 5 6 7 8 9 1 2 3 4 5 6 7 8 9 1 2 3 4 5 6 7 8 9
65
Section D: General. D1. How much does your work schedule interfere with your leisure activities, family life, and non-leisure
Not at A Some- Quite a Very All little what lot much 1 2 3 4 5 6 7 8 9
activities (e.g. going to the doctor, library, bank, hairdresser, etc.)? D2. Do you do any other paid work that might exacerbate the work-hour problems that you experience?
1 2 3 4 5 6 7 8 9
D3. How often do you suffer from an upset stomach or indigestion?
Almost Quite In Quite Almost Never Seldom Between Often Always 1 2 3 4 5 6 7 8 9
D4. How often do you suffer from minor infectious diseases (e.g. colds or flu)?
1 2 3 4 5 6 7 8 9
D5. How often do you suffer from shortness of breath, aches and pains in your chest, or heart palpitations?
1 2 3 4 5 6 7 8 9
D6. How often do you suffer from aches and pains in you muscles and/or joints?
1 2 3 4 5 6 7 8 9
D7. Overall, do the advantages of your work schedule outweigh the disadvantages?
Definitely Probably Maybe Probably Definitely Not Not Yes Yes 1 2 3 4 5 6 7 8 9
If you have any additional comments to make about your shift system, or about this survey, please write them here. If you need more room, please use the back of this page. ________________________________________________________________________________________________________________________________________________ Thank you for completing this survey. All results are held in strict confidence by SUNY Buffalo researchers. No individual responses will be given to your employers or the FAA. Colin G. Drury (716)645-2039
66

67