Effect of extractions on dynamic mechanical properties of ... · E ect of extractions on dynamic...
35
Effect of extractions on dynamic mechanical properties of white mulberry (Morus alba) Aida Se Golpayegani, Iris Br´ emaud, Joseph Gril, Marie-France Th´ evenon, Olivier Arnould, Kambiz Pourtahmasi To cite this version: Aida Se Golpayegani, Iris Br´ emaud, Joseph Gril, Marie-France Th´ evenon, Olivier Arnould, et al.. Effect of extractions on dynamic mechanical properties of white mulberry (Morus alba). Journal of Wood Science, Springer Verlag, 2012, 58, pp.153-162. <10.1007/s10086-011-1225- 7>. <hal-00689021> HAL Id: hal-00689021 https://hal.archives-ouvertes.fr/hal-00689021 Submitted on 19 Apr 2012 HAL is a multi-disciplinary open access archive for the deposit and dissemination of sci- entific research documents, whether they are pub- lished or not. The documents may come from teaching and research institutions in France or abroad, or from public or private research centers. L’archive ouverte pluridisciplinaire HAL, est destin´ ee au d´ epˆ ot et ` a la diffusion de documents scientifiques de niveau recherche, publi´ es ou non, ´ emanant des ´ etablissements d’enseignement et de recherche fran¸cais ou ´ etrangers, des laboratoires publics ou priv´ es.
Transcript of Effect of extractions on dynamic mechanical properties of ... · E ect of extractions on dynamic...
Effect of extractions on dynamic mechanical properties
of white mulberry (Morus alba)
Aida Se Golpayegani, Iris Bremaud, Joseph Gril, Marie-France Thevenon,
Olivier Arnould, Kambiz Pourtahmasi
To cite this version:
Aida Se Golpayegani, Iris Bremaud, Joseph Gril, Marie-France Thevenon, Olivier Arnould, etal.. Effect of extractions on dynamic mechanical properties of white mulberry (Morus alba).Journal of Wood Science, Springer Verlag, 2012, 58, pp.153-162. <10.1007/s10086-011-1225-7>. <hal-00689021>
HAL Id: hal-00689021
https://hal.archives-ouvertes.fr/hal-00689021
Submitted on 19 Apr 2012
HAL is a multi-disciplinary open accessarchive for the deposit and dissemination of sci-entific research documents, whether they are pub-lished or not. The documents may come fromteaching and research institutions in France orabroad, or from public or private research centers.
L’archive ouverte pluridisciplinaire HAL, estdestinee au depot et a la diffusion de documentsscientifiques de niveau recherche, publies ou non,emanant des etablissements d’enseignement et derecherche francais ou etrangers, des laboratoirespublics ou prives.
1
Effect of extractions on dynamic mechanical properties of 1
white mulberry (Morus alba L.) 2
Original article 3
Aida Se Golpayegani*1,2, Iris Brémaud1, Joseph Gril1, Marie- France Thevenon2, 4
Olivier Arnould1, Kambiz Pourtahmasi3 5
1) Laboratoire de Mécanique et Génie Civil (LMGC), Université Montpellier 2, CNRS 6
UMR5508, Place E. Bataillon, cc 048, 34095 Montpellier Cedex 5, France 7
2) Production et valorisation des bois tropicaux et méditerranéens, CIRAD PERSYST 8
Department, TA B40/16 BP 5035, 34398 Montpellier Cedex 5, France 9
3) Department of Wood and Paper Science and Technology, Faculty of Natural Resources, 10
University of Tehran, Iran 11
*Corresponding author: Aida Se Golpayegani, Phone number: +33 4 6714 (9642), Fax 12
number: +33 4 6714 (4792). Email address: [email protected] 13
Keywords: anisotropy, damping coefficient, DMA, extractives, vibrational properties, white 14
mulberry wood (Morus alba L.). 15
16
17
18
19
*Manuscript-Revised&OLFNKHUHWRGRZQORDG0DQXVFULSW0DQXVFULSW5HYLVHGGRF &OLFNKHUHWRYLHZOLQNHG5HIHUHQFHV
2
Abstract: 20
Vibrational properties of wood are affected by several parameters, of which extractives can be 21
one of the most important ones. Wood for European musical instruments has been often 22
studied, but traditional Middle Eastern ones had been left unnoticed. In this study white 23
mulberry (Morus alba L.), the main material for long-necked lutes in Iran, was extracted by 24
five solvents of various polarities (water included). Free-free bar forced vibrations were used 25
to measure longitudinal (L) loss tangent (tanδ), storage (elastic) modulus (E′) and specific 26
modulus (E′/γ) in the acoustic range. Their anisotropy between the 3 axes of orthotropy was 27
determined by DMA (dynamic mechanical analysis). Native wood had a quite low EL′/γ but 28
its tanδ was smaller than expected, and the anisotropy of tanδ and E′/γ was very low. Removal 29
of extractives caused tanδ to increase and moduli to decrease. Acetone, the most effective 30
solvent on damping despite a moderate extraction yield, increased tanδL by at least 20% but 31
did not modify E′/γ as much. When used successively, its effects masked those of solvents 32
used afterwards. Anisotropy of E′/γ was nearly unchanged after extraction in methanol or hot 33
water, while tanδ was much more increased in R than in T direction. Results suggest that in 34
white mulberry, damping is governed more by nature and localization of extractives rather 35
than by their crud abundance. 36
37
38
39
40
41
3
Introduction: 42
Wood has always been considered as a multifunctional material. Each of its versatile 43
properties makes it appropriate for a particular final use. Wood historical use in musical 44
instruments is in relation with its dynamic mechanical, or vibrational, properties, including 45
mechanical damping (loss tangent) tanδ, storage (elastic) modulus E′ and specific modulus 46
E′/γ. As a quasi-orthotropic material at the macroscopic scale, wood has different properties in 47
longitudinal (L), radial (R) and tangential (T) directions (Backman and Lindberg1; Nairn2; 48
Brémaud et al3). In the case of wood used for Western classical string instruments, it is 49
generally accepted that a low tanδ and high E′/γ in axial direction, and a high anisotropy, are 50
convenient for obtaining a soundboard of good quality. However, few studies have addressed 51
the vibrational properties of wood used in Middle-East instruments. String instruments in Iran 52
can be traced back to 970 B.C. Long-necked lutes Tar, Setar and Kamancheh are specifically 53
made from white mulberry (Morus alba L.), which is also used for the Japanese short-necked 54
lute Biwa (Yoshikawa4). 55
Sources of variations in dynamic mechanical properties of wood include cell arrangement and 56
grain angle, microfibril angle within the cell wall, proportions of constitutive polymers, as 57
well as the presence of additional compounds (Ono and Norimoto5,6; Obataya et al7; Noda et 58
al8; Bucur9). Although in lower quantities than cell wall constitutive polymers, extractives can 59
have a considerable effect on mechanical and damping properties of wood. Exceptionally low 60
damping of some musically important woods was somehow correlated with their extractives. 61
Extractives impact can be studied either through correlations between their amounts and 62
vibrational properties variation resulting by their removal, or by the re-injection of extracts 63
into a “neutral” wood. Methanol extraction increased the tanδ of heartwood by 15 to 37% in 64
red cedar (Thuja plicata) and up to 60% in African Padauk (Pterocarpus soyauxii), while E′/γ 65
4
slightly decreased (Yano10; Brémaud et al.11). Impregnation of water-soluble extractives of 66
pernambuco (Caesalpinia echinata) into spruce decreased tanδ by a half (Matsunaga et al.12). 67
The formation of hydrogen bonds between extractives and cell wall matrix was proposed as a 68
possible cause of tanδ reduction (Matsunaga et al.13). Impregnation of Sitka spruce with 69
isolated key chemical compounds from muirapiranga (Brosimum rubescens), a Moraceae as is 70
mulberry, decreased tanδ by up to 25%, both in axial and radial directions. This was explained 71
by motion restriction of matrix macromolecules due to extractives entering (Minato et al.14). 72
Contrary to these studies, water-soluble extractives of Reed (Arundo dunax L.) increased both 73
tanδ and E′ (Obataya and Norimoto15; Obataya et al.16). Extractives can also change wood 74
equilibrium moisture content (EMC) (Hernandez17). Higher EMC induces higher tanδ and 75
lower E′/γ (Akitsu et al.18; Obataya et al.19). The potential effect of extractives on vibrational 76
properties could come from their chemical structure, cellular location and relation with basic 77
polymers (Matsunaga et al.13; Brémaud et al.11). Removing extractives using solvents of 78
different polarities could give a first idea about their polarity and possible cellular location. 79
Our work aims at evaluating the dynamic mechanical properties of white mulberry and 80
understanding the possible contribution of extractives. Basic properties of samples from 81
different regions of Iran were compared in a previous study (Se Golpayegani20; Pourtahmasi 82
and Se Golpayegani21). In the present article, mulberry wood was extracted in five solvents of 83
different polarities. In order to separate the overlapping effect of various solvents, they were 84
used both as independent extracting agents, and in a successive order on the same specimens, 85
to determine changes in acoustical properties along the grain. Furthermore, the effects on the 86
anisotropy of tanδ, E′ and E′/γ were also studied after extraction by the two solvents with 87
highest yields. 88
89
5
Material and Methods 90
Material 91
Mulberry trees were cut in Iran and kept for one month in outdoor conditions. Wood was 92
selected there by a professional instrument maker. Several 500×50×50 mm (L×R×T) rods 93
were cut from the middle of the heartwood and sent to France, in three batches within one 94
year. The 1st batch (used for powder samples and independent extractions on vibrational 95
specimens) and 2nd batch (successive extractions on vibrational specimens) came from the 96
same tree; the 3rd (specimens for DMA) came from another tree. 97
A portion of each rod was ground, the fraction passing through 40 mesh and retained on 60 98
mesh sieves was kept for powder extractions (TAPPI standard method T207_cm22). For 99
vibrational tests, the rods were cut into approx. 200 axial specimens of dimensions 100
150×15×2 mm3 (L×R×T), from which 77 specimens were kept for extractions and controls 101
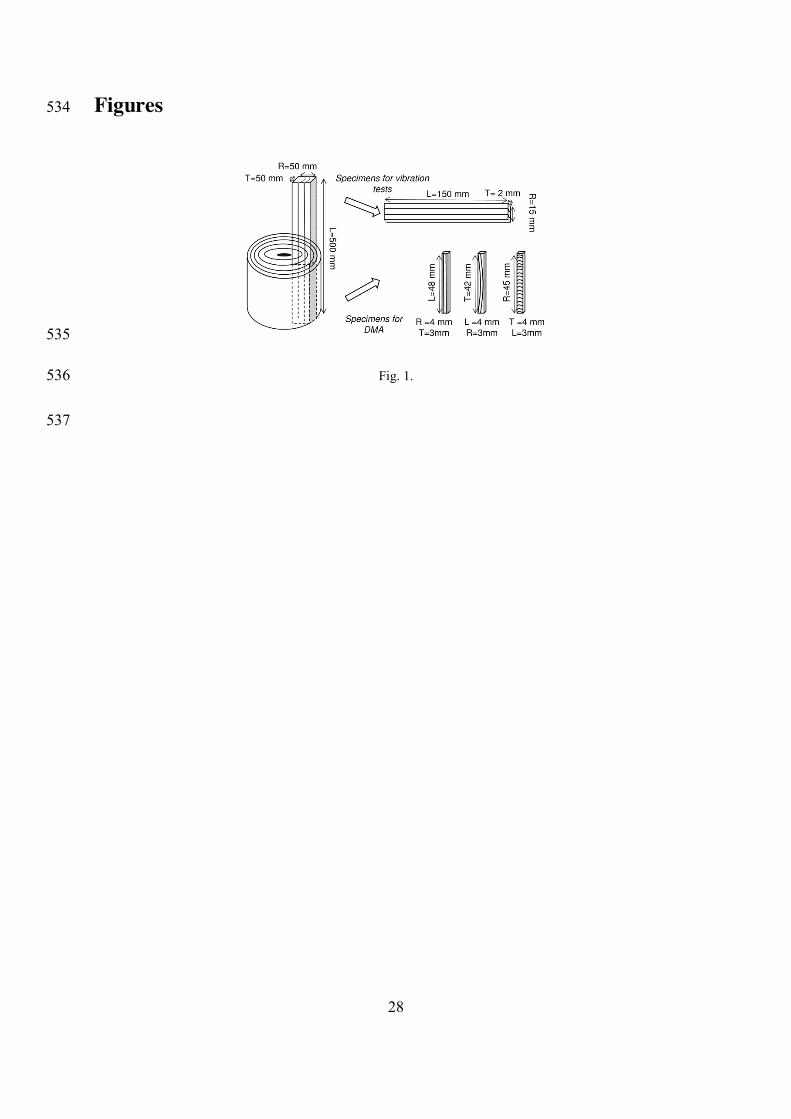
(Table 1). For DMA (Dynamic Mechanical Analysis), specimens were cut to a cross section 102
of 4×3 mm2 and a length of 42-48 mm (Fig. 1). 14 specimens were prepared in each direction 103
of orthotropy leading to a total number of 42. 104
Conditioning and physical measurements 105
The specimens were oven dried at 60˚C for 48 h. This procedure ensured that the equilibrium 106
was reached in adsorption. Residual moisture content, as compared with oven drying at 107
103°C, was around 1.36±0.49%. Specimens were then kept for three weeks in controlled 108
conditions of 20±2˚C and 65±5% RH. This procedure was repeated before any mechanical 109
measurement. Specific gravity γ (both oven dried and air dried) and EMC were recorded. 110
EMC of native wood was of 7.9±0.8%. 111

6
Although mechanical measurements could not be run in a climatic chamber, mass change was 112
small: -0.3±0.4% for native state specimens, both during vibrational and DMA tests. For 113
treated specimens, mass change was negligible (-0.1±0.1%) during vibrational tests, and less 114
than during DMA tests (-0.6±0.7%). 115
Measurement of dynamic mechanical properties 116
Axial dynamic mechanical properties were measured both by vibrational tests and by DMA, 117
while anisotropy was studied only by DMA. 118
Non-contact forced bending vibrations of free-free bars 119
A frequency scan was imposed through an electric magnet facing a tiny steel plate (15-20 mg, 120
a negligible additional weight) glued at one end of each specimen. A laser triangulation 121
sensor measured the displacement. A program developed with LabView® software 122
(Brémaud23) monitored vibration emission and detection. Specific elastic (storage) modulus 123
(EL′/γ) was calculated from the first resonance frequency by the Euler-Bernoulli formula and 124
elastic modulus (EL′) was obtained by multiplying EL′/γ by specific gravity (γ). Damping 125
coefficient was measured using both bandwidth at half power in the frequency domain (or 126
quality factor) and logarithmic decrement of amplitude in the time domain after stopping the 127
vibration. Both measurements shall be equivalent to loss tangent tanδ, if tanδ << 0.1, which is 128
the case for air-dry wood in this temperature/frequency range. Three repetitions were made 129
for each specimen. Resonance frequencies were in the range of 200-400 Hz. 130
DMA (Dynamic mechanical analyzer) 131
The viscoelastic behavior of specimens was measured using a BOSE® ELF3230 DMA 132
equipped with tension/compression fatigue grips, a 22 N (±0.17% maximum error) load cell 133
7
and a high-resolution displacement sensor (1 mm range with ±0.26% maximum error). The 134
specimens were fixed between two clamps with a working distance of 35 mm and tested in 135
tension along their longest direction. The tests were done in purely alternative 136
tension/compression loading controlled in displacement with an amplitude of ±0.0175 mm 137
corresponding to a maximum tension/compression strain of ±0.02% (i.e., within the linear 138
viscoelastic region, see Sun et al.24). Using BOSE WinTest® analysis software, E* (norm of 139
the complex modulus), E′ (storage modulus), E′′ (loss modulus) and tanδ (loss tangent) were 140
calculated. Both moduli and tanδ were corrected for the stiffness of the whole apparatus 141
(around 1785 N/mm with a negligible viscous contribution), measured using a stiff steel 142
specimen. Frequency sweeps from 0.1 to 10 Hz were run in triplicate for each specimen, 143
native and then treated. 144
Extraction procedures 145
Extractions used solvents of increasing polarity: hexane (HX), dichloromethane (DM), 146
acetone (AC), methanol (ME) and hot water (HW). Most used Soxhlet extractors. Groups of 147
specimens, with similar ranges in properties, were defined after vibrational tests in native 148
state and subjected to different treatments (Table 1). 149
For extractions on powder and on solid specimens for vibrational tests, extractions were run 150
both in an independent (or parallel) and in a successive (or serial) way. Independent extraction 151
means that a sample is submitted to one extraction in a given solvent, and its properties are 152
measured before and after this single treatment. In this case, hot water extraction from 153
vibrational specimens was run (for 8h) at 70°C (not using Soxhlet). Successive extractions 154
means that a given group of specimens is submitted to extraction, first by the less polar 155
solvent (HX), then oven-dried (brief process: weighted, air-dry stabilized, weighted, 156
8
mechanically tested, and dried again for solid wood specimens), then extracted by the next 157
solvent (DM), and so on. In this case, a “standard” Soxhlet extraction (<95°C) was run for 158
water (complete description of conditions can be found in table 1). 159
Specimens were dried before being extracted, so that less polar solvents could not enter cell 160
walls. Control specimens underwent only physical steps (drying and stabilization) and were 161
measured in the same time and condition as extracted ones. For determination of extractive 162
content, 3 g of powder were put in a cellulose cartridge, extracted for 8 h, and their oven-dry 163
(48 h at 60°C) weight loss was measured. For solid wood, as color hardly changed during 164
extraction, duration of 12 h was chosen. Based on the yields of extractions in vibrational 165
specimens, ME and HW were applied as independent solvents on DMA specimens. For each 166
anisotropic direction, 4 specimens served as controls, 5 were extracted in ME and 5 in HW 167
(70°C, without Soxhlet). Although hemicelluloses may be partially depolymerized at 168
moderately high temperatures for water-saturated wood (Placet et al25; Assor et al26), 169
treatment temperatures and duration were sufficiently low to neglect such effect. 170
Results and Discussion 171
Properties of native mulberry wood 172
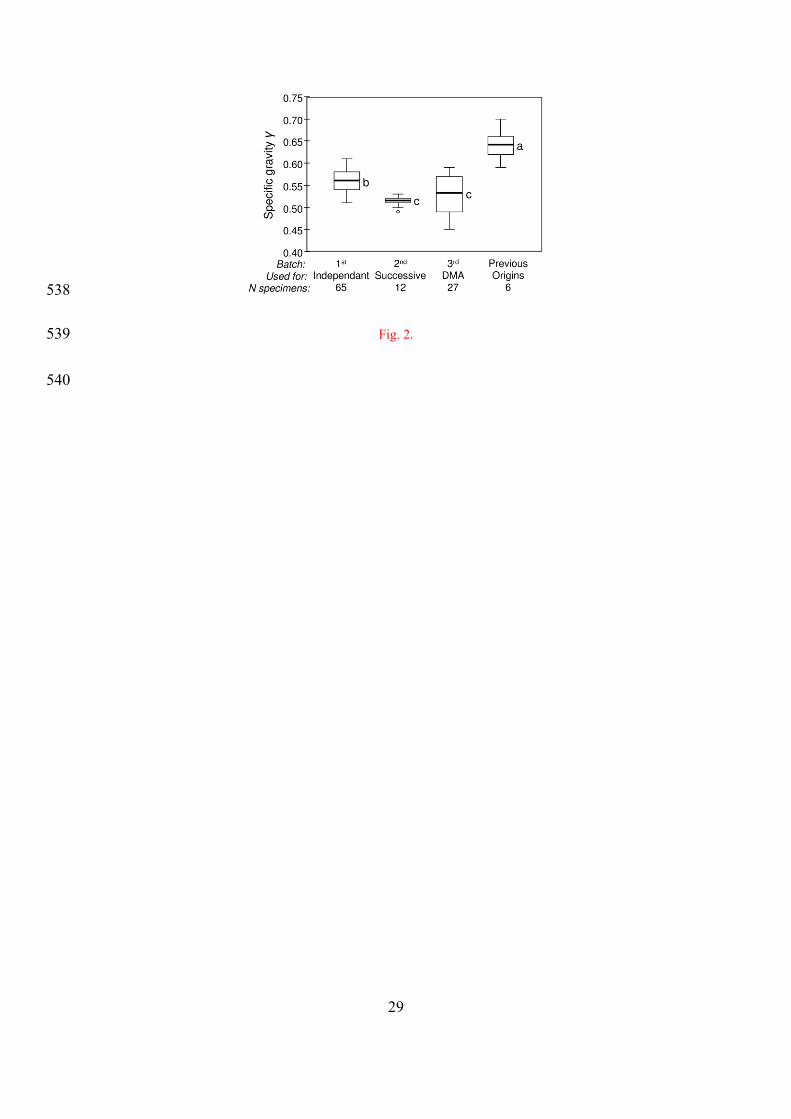
The specific gravity γ of the mulberry wood under study ranged from 0.45 to 0.61 (Fig. 2). 173
This was significantly lighter than wood from different regions in a previous study (Se 174
Golpayegani20). The 1st batch (used for independent extractions) was significantly denser than 175
the 2nd one (used for successive extractions), although they came from the same tree. The 3rd 176
batch (used for DMA), which came from a different tree, covered a broad range, but its 177
9
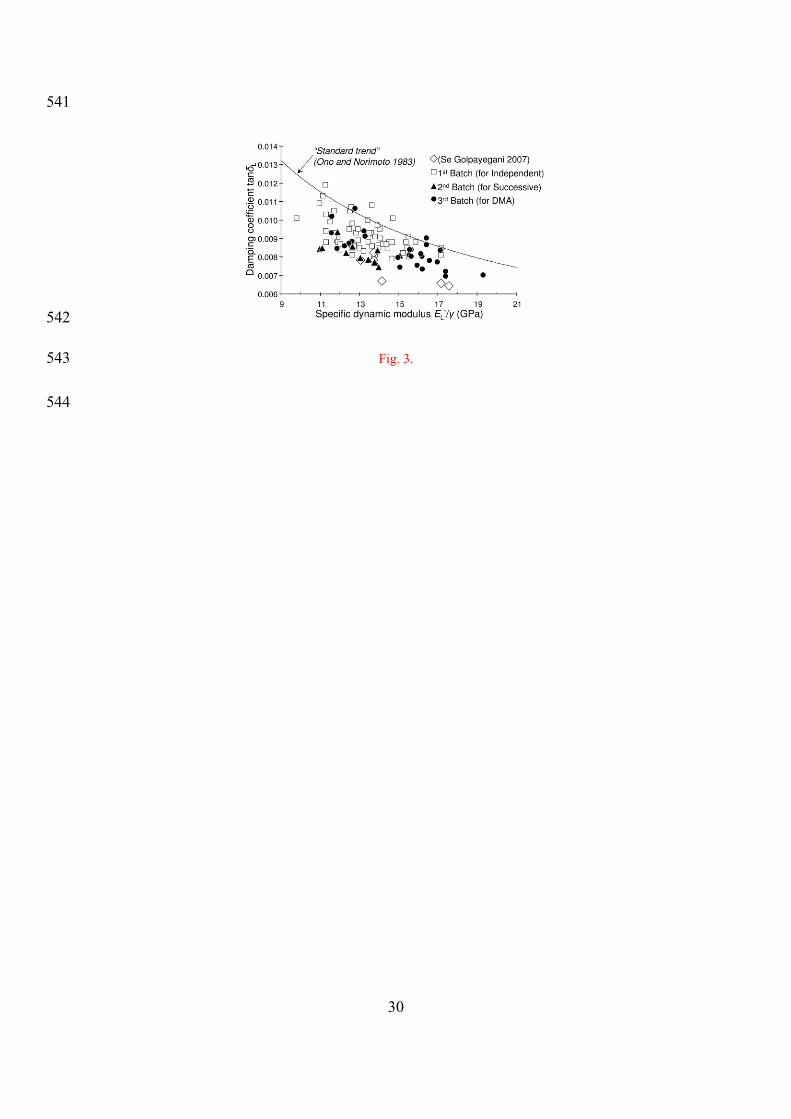
average γ was not significantly different from the 2nd batch. Differences in density were not 178
clearly related to those in vibrational properties (Fig. 3). 179
The specific dynamic modulus in L direction of all studied batches of wood was rather low 180
(Fig. 3) and variable (11-18 GPa). Although dispersion was quite large, tanδL was negatively 181
related to E'L/γ. However, all batches generally had a lower tanδL than the “standard trend” 182
from Ono and Norimoto 5, 6, a statistical relationship obtained on 20 softwoods and 30 183
hardwoods that can be considered as a reference. In the 1st and 3rd batches tanδL was in 184
average 6% and 11% lower than “standard”, but with a higher dispersion than in 2nd batch and 185
in wood from a previous study (Se Golpayegani20), for which tanδ was always within the 186
lower range (21% and 23% lower than the standard). 187
tanδL measured with DMA method was higher than that measured with free-free vibration. 188
However, it exhibited a decreasing trend against frequency, so that the difference could be 189
attributed to the higher frequency of the free-free vibration. This decrease of tanδ with 190
frequency was also observed in other directions, as well as a slight increase of elastic moduli. 191
However, the anisotropic ratios remained constant in the observed frequency range. In the 192
following analysis, only the values measured at 10 Hz will be used. Ordering of the different 193
tanδ in the 3 principal directions was the same as previously reported, i.e., tanδT > tanδR > 194
tanδL (Ono and Norimoto27). However, damping anisotropies between the three main 195
directions were small: R/L≈ 1.03, T/L≈ 1.34, and T/R≈ 1.30. These values were lower than 196
those collected from several studies by Brémaud et al.3 in which the average ratios were of 2.7 197
(R/L), 2.9 (T/L) and 1.14 (T/R) for hardwoods. Similarly, the anisotropy of E′ agrees with 198
well-known relationships, i.e., E′ L >> E′ R ≥ E′ T, but actual values of ratios (L/R ≈ 4, L/T ≈ 8 199
and R/T ≈ 1.9) were in the lower range of anisotropy compared with literature reviews (e.g., 200
Guitard and El Amri28,Nairn2). It can be noted that mulberry has a low longitudinal E′ /γ and a 201

10
very reduced anisotropy when compared with resonance spruce that is used for top plates of 202
Western string instruments, and is closer to maple (used for back and sides) in this respect. 203
Yield of extraction 204
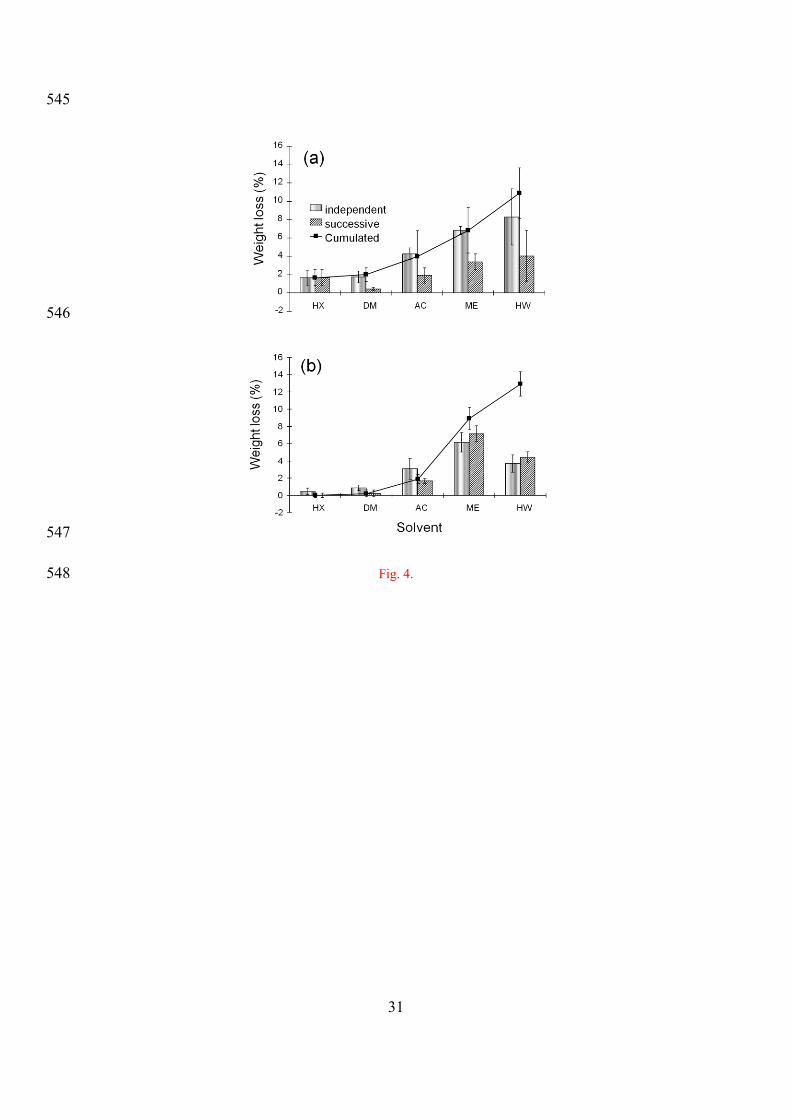
In wood powder (Fig. 4a), approximately the same cumulated amount of extractives was 205
removed when applying solvents independently or successively. In solid wood (Fig. 4b), on 206
the contrary, cumulated weight losses differed between these two extraction procedures, 207
suggesting some structural effect on the accessibility to various solvents. This was supported 208
by different extraction yields from axial, radial and tangential DMA specimens: 9, 14 and 209
18% respectively for ME. 210
Less polar solvent HX and DM, which should reach only the lumen, removed small and 211
comparable amounts (1.6% and 1.7%) when used independently on powder. Their yields were 212
much smaller in solid wood. When DM was used after HX, its yield was very low, suggesting 213
that HX had already removed most of extractives accessible to apolar solvents. Similarly, AC 214
had a smaller yield when used after HX and DM, suggesting that when used independently, it 215
also removed compounds from lumens. Although AC and ME are thought to be able to 216
solubilize similar types of compounds, ME caused the most exhaustive extraction from solid 217
wood: 6.2% when used independently. Its efficiency was even increased when used after AC 218
(7.14% from solid wood). On the contrary, in powder, HW had the highest yield (8.31%) 219
when used independently, while it had a much smaller yield on solid. This suggests that in 220
solid wood, polar extractives are more easily removed by ME than by HW, as the final 221
cumulated yields were however similar between powder and solid. 222
Extraction effects on EL′/γ 223

11
As extractions change the mass and specific gravity (Table 2, Table 3) of wood specimens, 224
EL′/γ values should be corrected for the contribution of extractives to γ: 225
' '
apL L
efc ap
E E
, (1) 226
where (EL′/γ)ap and γap are the apparent measured values, and (EL′/γ)c is the corrected value 227
taking into account the specific gravity γef after the most effective extraction (ME). (EL′/γ)c 228
should be more representative of an “extractives-free cell wall” modulus, and appeared 0.01 229
to 1.2 GPa higher than the apparent one (Table 2, Table 3). 230
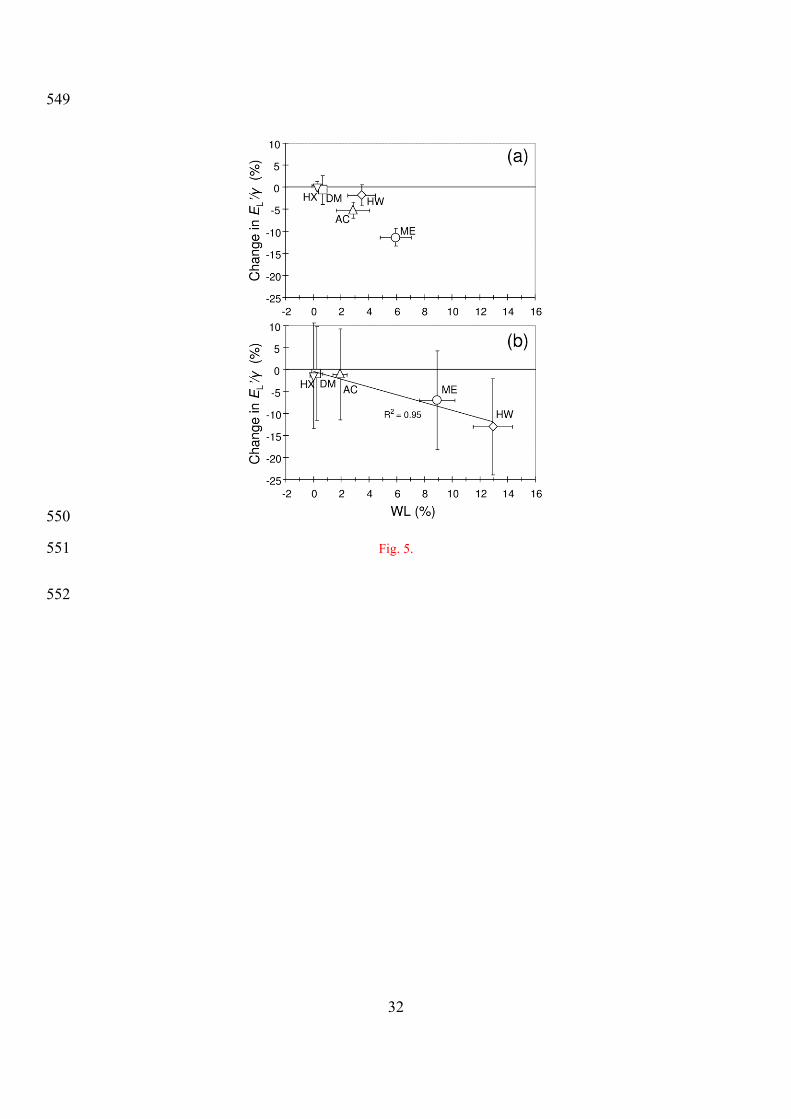
Corrected EL′/γ gradually decreased due to extractions. HX, DM, AC, ME and HW modified 231
EL′/γ by 0.2%, -0.6%, -5%, -11% and -1.8% respectively after independent extractions (Fig. 232
5a). Cumulated changes (i.e. relative to native state) after successive extractions followed a 233
similar trend but with a bigger amplitude (Fig. 5b). EL′ shows a similar gradual decrease. 234
Decrease in EL′/γ appears nearly proportional to weight loss for different solvents (Fig. 5b), 235
which suggests that extractives removed by AC, ME and HW bulked the cell wall matrix, and 236
affected elasticity independently of compounds removed by these various solvents. 237
Changes in tanδL related to weight loss 238
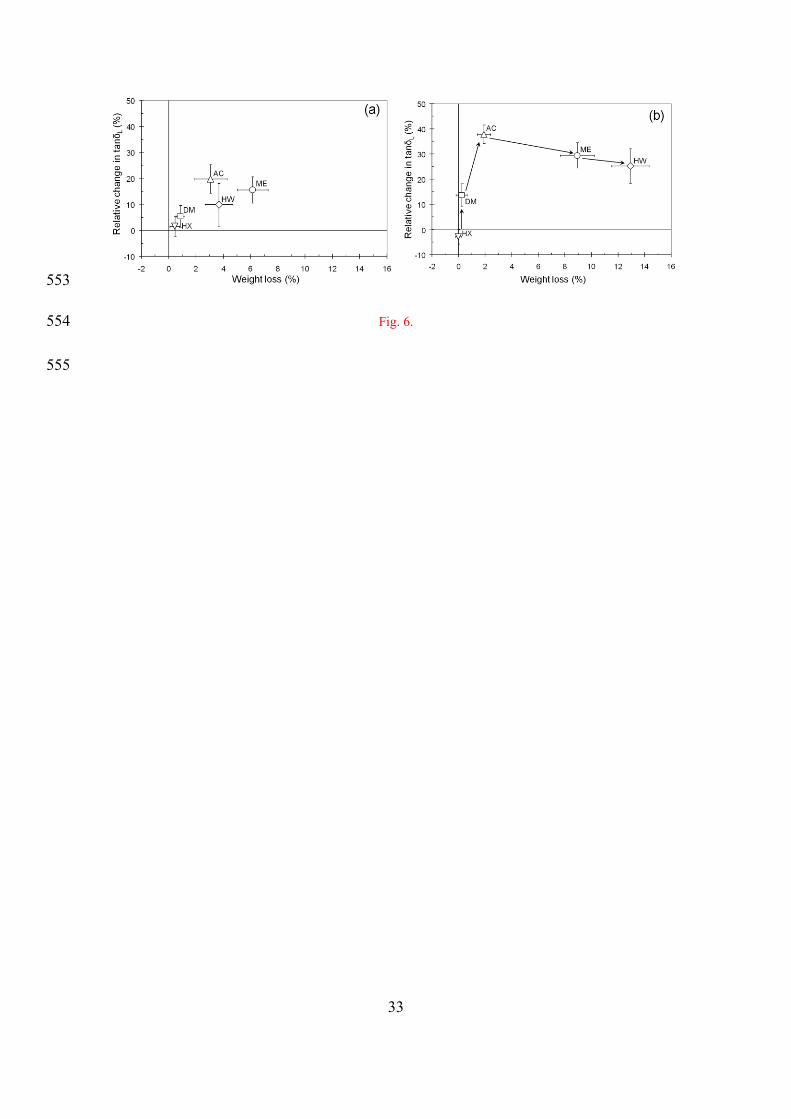
Figure 6 shows relative changes in tanδL caused by each solvent either used individually or 239
after others (successively). Apolar solvents (HX and DM) removed small amounts (approx. 240
1%) of extractives, probably from the lumens, resulting in small changes in tanδL. In 241
successive extraction, however, DM increased tanδL by 14%, which might be linked to 242
previous exposition to HX. On the other hand, in another species (Padauk), DM was able to 243

12
slightly attain cell wall and increase tanδL of approx. 20% for approx. 3% extracts removed 244
(Brémaud et al.11). 245
More polar solvents (AC, ME and HW) are expected to remove higher proportions of cell 246
wall extractives, more susceptible to alter tanδL. However, the highest change in tanδL 247
resulted from AC extraction (≈+20% independently or used after DM, ≈+38% for cumulated 248
successive effect), although its weight loss was moderate. ME and HW, despite their higher 249
yields, had smaller effects on tanδL both in independent and in successive-cumulated order. 250
When used after AC, ME even reduced tanδL lower than the value for the previous state (AC-251
extracted, Fig. 6b). On the contrary, in other species, methanol extractives often have a high 252
“anti-damping” effect in wood (Yano10; Minato et al.14; Brémaud et al.11). Acetone has also 253
been used recently in this kind of study, on two tropical species (Brémaud23; Brémaud et 254
al.11). It was more efficient than ME in one species, and less in the other. The contrasted 255
effects observed in mulberry could be explained by different hypotheses: (i) AC reached all 256
extractives able to alter damping, leaving only “inactive” compounds for subsequent ME or 257
HW extractions. As drying cycles could reduce tanδL by ≤8%, changes in tanδL after ME and 258
HW in successive order could partly reflect drying history of specimens. However, a smaller 259
effect on tanδL of ME and HW than that of AC was also observed for independent extractions, 260
without cumulated drying cycles. This brings us to the second hypothesis ; (ii) Two kinds of 261
extractives compounds would co-exist in cell walls, some decreasing, and some increasing, 262
tanδL in native wood. AC would have removed the first ones, so that extraction of remaining, 263
“tanδL raising”, compounds by ME and HW would decrease again the tanδL of solid wood. 264
In various woods, methanol is reported to take out non-structural carbohydrates and phenolics 265
(e.g. Rowe and Conner29). White mulberry has quite important content of phenolic extractives 266
(De Rosso et al.30). In some woods, polyphenols can form part of the fiber cell wall matrix 267
13
(Kleist and Bauch31), while in some other woods, they may be either preferentially in vessels, 268
parenchyma walls (Dünisch et al.32), or too much condensed to enter the cell wall substance 269
(Koch and Kleist33). In the later hypothesis, ME might have removed some lumen deposits, 270
resulting in a lower ratio between changes in tanδL and extraction yield. However, decreases 271
in E′ L/γ after ME or HW suggested cell wall location. Thus, ME could have removed 272
compounds such as sugars or simple phenols, which presence will increase tanδL (Obayata et 273
al.15; Sakai et al.34). A decrease in tanδL is also observed after ME extraction of Thuja plicata 274
sapwood – which should contain non-structural carbohydrates – whereas a completely 275
opposite effect is observed in the heartwood of the same species (Yano10). In mulberry, 276
extraction in HW, following ME, did not bring additional changes in tanδL, although it further 277
removed ≈4% extractives. In Caesalpinia echinata, water soluble extractives decrease tanδL 278
in wood, which was first ascribed to their ability to form hydrogen bonds with cell walls 279
components (Matsunaga et al.12). But other extractives, without hydroxyl groups and/or 280
insoluble in water, also reduce tanδL (Minato et al.14; Brémaud et al.11). Finally, differences in 281
tanδL might be related to changes in wood moisture content (Dunlop35; Obayata et al.19; 282
Inokuchi et al.36). However, changes in EMC due to independent extractions were small 283
(Table 2). In successive extractions (Table 3), with higher cumulated yields, EMC was more 284
significantly increased after ME and HW. This, however, should lead to an increase in tanδL, 285
instead of the observed decrease for successive use of ME and HW. 286
Therefore, the present results suggest the co-existence of some “tanδ – lowering” and of some 287
“tanδ – raising” compounds in the heartwood of white mulberry. The first ones are extractable 288
by ME but also with AC and HW, consequently independent extraction with those solvents 289
had always resulted in an increase in tanδL. The latter compounds, being probably 290
hydrophilic, are not extractable by HX, DM or AC. Thus a successive extraction using ME 291
14
and HW had reduced tanδL, as the “tanδ – lowering” had been already removed by previous 292
solvents and there were only the “tanδ – raising” components left. The methodology using 293
both independent and successive series of extraction might reveal similar trends in other 294
species. 295
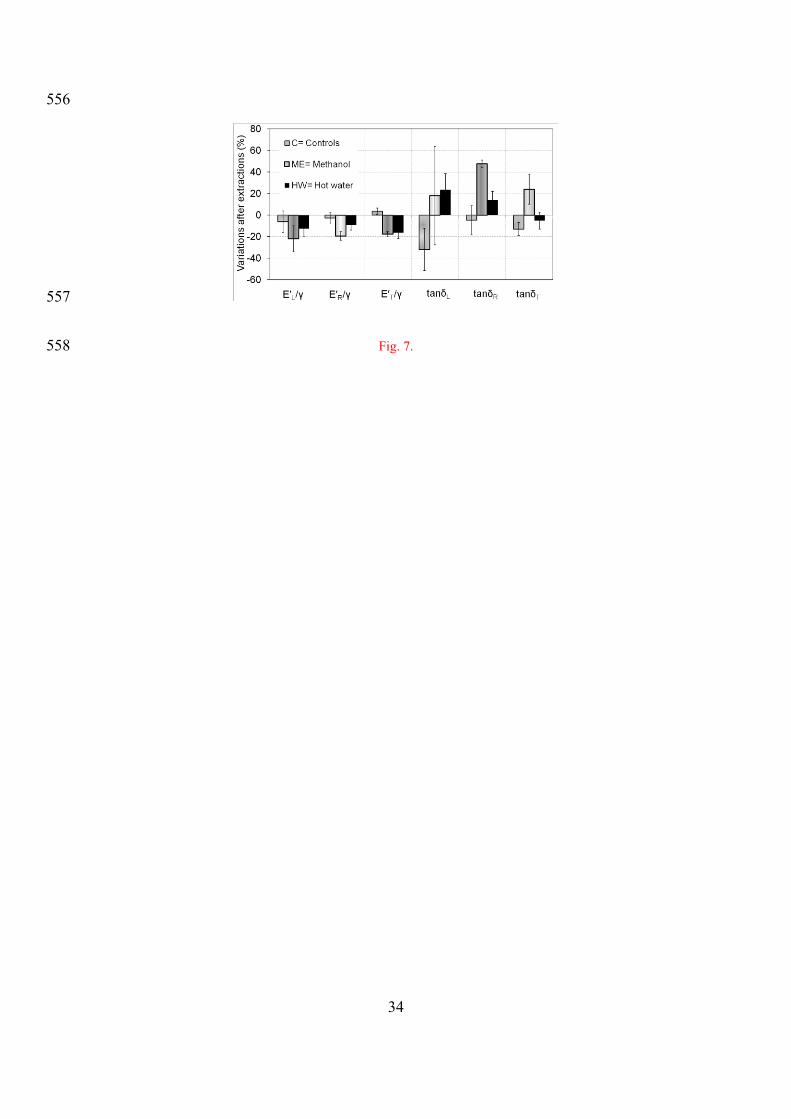
Changes in anisotropic properties due to extractions 296
Figure 7 shows the variations in E′/γ and tanδ in the three principal directions of orthotropy 297
after extractions with HW and ME or 2 drying cycles (controls). Variations in E′/γ after ME 298
extraction were similar in all three directions: -18% to -20%, although weight losses were 299
different (9%, 14% and 18% for L, R and T specimens respectively). Hot water caused both 300
lower weight losses (6-8% in L, R and T), and smaller decrease in E′/γ along L and R 301
directions, while it was similar to ME in T direction. 302
Concerning tanδ, uncertainty was high in L direction, as clamping of specimens may crush 303
wood in the softer transverse direction. Even controls showed important variations, which 304
cannot be ascribed to physico-chemical changes. However, after ME extraction, change in 305
radial tanδ was at least twice more important than in L (DMA estimations and changes in 306
vibrational tests) and T direction (Fig. 7). 307
The quasi-isotropic effect of extractions on E′/γ is quite surprising. In previous works, 308
extractives stiffened the transverse moduli (Yano et al.37; Minato et al.14), but not the axial 309
one, in which the influence of the microfibrillar reinforcement predominates (Ono and 310
Norimoto 5, 6; Obataya et al.7). However, mulberry wood has a low longitudinal E′/γ, 311
suggesting high microfibril angle, and is characterized by a very low anisotropy in native 312
state. Effects of extractions on tanδ were clearly different in radial and tangential directions. 313
This is interesting, as there are relatively few works on the tanδR/tanδT anisotropy and sources 314
15
of variations. Backman and Lindberg1 stated that, for softwood, in tensile test latewood 315
contributes mostly to the response in tangential direction while most of the strain occurs in 316
early wood in radial direction. In mulberry, a ring-porous hardwood, the response in radial 317
tension tests would more involve vessels and rays, whose cell walls are thinner, but are also 318
susceptible to contain higher proportions of extractives (Koch38; Kleist and Bauch31; Dünisch 319
et al.32). Thus, the very high change in tanδR after ME extraction (≈ 50%) could express a 320
bigger modification of rays and vessels, than of fibers. 321
Conclusion 322
Dynamic mechanical properties E′/γ, tanδ, and their anisotropic ratios in the 3 principal axes 323
were measured on white mulberry wood (Morus alba L.), a representative raw material for 324
musical instruments in Iran. They were compared before and after extractions by different 325
solvents in order to investigate extractives effects. Results could be synthesized as follows: 326
- Mulberry wood has a quite low E'L/γ but its damping factor (tanδL) is lower than 327
expected. The anisotropy of these two properties is also much lower than average. 328
- Combining two methods of extractions -using each solvent as an individual agent and 329
using solvents in a successive order on a single sampling- could suggest the 330
importance of extractives nature compared to their amount. 331
- The highest changes in tanδL were not due to the most polar solvents, with highest 332
extraction yields, but to acetone. Nevertheless, acetone did not alter E′L/γ with the 333
same intensity, suggesting that the extracted amounts or compounds were not essential 334
for wood stiffness. 335
16
- The different effects of methanol extraction on tanδL, between individual extraction 336
and when used successively after acetone, suggest the existence of two types of tanδ 337
altering compounds in white mulberry. Some would be able to increase, some other 338
would be able to reduce the damping, and both types would be accessible by acetone 339
and methanol independently. 340
- Changes in E′/γ were nearly isotropic between the 3 principal axes of orthotropy, may 341
be due to the very low anisotropy of mulberry in native state. On the contrary, tanδ 342
was much more modified in radial than in tangential direction, suggesting different 343
responses to extractions of rays and vessels walls as compared to fibers ones. 344
It should be noted that even though extractives are found to definitely affect vibrational 345
properties of Morus alba L., it would be enlightening to identify the most important 346
compounds present in those extractives and how they cause changes in vibrational properties. 347
348
17
References 349
1. Backman AC, Lindberg KAH (2001) Differences in wood material responses for 350
radial and tangential direction as measured by dynamic mechanical thermal analysis. J 351
Mater Sci 36:3777-3783 352
2. Nairn JA (2007) A numerical study of the transverse modulus of wood as a function of 353
grain orientation and properties. Holzforschung 61:406-413 354
3. Brémaud I, Gril J, Thibaut B (2010) Anisotropy of wood vibrational properties: 355
dependence on grain angle and review of literature data. Wood Sci Technol :DOI 356
10.1007/s00226-010-0393-8 357
4. Yoshikawa S (2007) Acoustical classification of woods for string instruments. J 358
Acoust Soc Am 122:568–573 359
5. Ono T, Norimoto M (1983) Study on Young's modulus and internal friction of wood 360
in relation to the evaluation of wood for musical instruments. Jpn J Appl Phys 22:611-361
614 362
6. Ono T, Norimoto M (1984) On physical criteria for the selection of wood for 363
soundboards of musical instruments. Rheol Acta 23:652-656 364
7. Obataya E, Ono T, Norimoto M (2000) Vibrational properties of wood along the grain. 365
J Mater Sci 35:2993-3001 366
8. Noda E, Aoki T, Minato K (2002) Physical and chemical characteristics of the 367
blackened portion of Japanese persimmon (Diospyros kaki). J Wood Sci 48: 245-249 368
369
18
9. Bucur V (2006)Acoustics of wood. Springer series in wood science. Timell, T.E., 370
Wimmer, R. Springer-Verlag, Berlin Heidelberg New York 371
10. Yano H (1994) The changes in the acoustic properties of Western Red Cedar due to 372
methanol extraction. Holzforschung 48:491-495 373
11. Brémaud I, Amusant N, Minato K, Gril J, Thibaut B (2011) Effect of extractives on 374
vibrational properties of African Padauk (Pterocarpus soyauxii Taub.). Wood Sci 375
Technol 46:461-472 376
12. Matsunaga M, Minato K, Nakatsubo F (1999) Vibrational property changes of spruce 377
wood by impregnation with water-soluble extractives of pernambuco (Guilandina 378
echinata Spreng.). J Wood Sci 45:470-474 379
13. Matsunaga M, Obataya E, Minato K, Nakatsubo F (2000) Working mechanism of 380
adsorbed water on the vibrational properties of wood impregnated with extractives of 381
pernambuco (Guilandina echinata Spreng.). J Wood Sci 46:122-129 382
14. Minato K, Konaka Y, Brémaud I, Suzuki S, Obataya E (2010) Extractives of 383
muirapiranga (Brosimun sp.) and its effects on the vibrational properties of wood. J 384
Wood Sci 56:41-46 385
15. Obataya E, Norimoto M (1999) Acoustic properties of a reed (Arundo donax L.) used 386
for the vibrating plate of a clarinet. J Acoust Soc Am 106:1106-1110 387
16. Obataya E, Umezawa T, Nakatsubo F, Norimoto M (1999) The effects of water-388
soluble extractives on the acoustic properties of reed (Arundo donax L.). 389
Holzforschung 53(1):63-67 390
19
17. Hernandez RE (2007) Moisture sorption properties of hardwoods as affected by their 391
extraneous substances, wood density, and interlocked grain. Wood Fiber Sci 39:132-392
145 393
18. Akitsu H, Norimoto M, Morooka T, Rowell RM (1993) Effect of humidity on 394
vibrational properties of chemically modified wood. Wood Fiber Sci 25:250-260 395
19. Obataya E, Norimoto M, Gril J (1998) The effects of adsorbed water on dynamic 396
mechanical properties of wood. Polymer 39:3059-3064 397
20. Se Golpayegani A (2007) Evaluation of mulberry's wood (Morus alba L.), considering 398
its use in making Iranian musical instruments (in Farsi). Master thesis, Wood science 399
and technology, Faculty of natural resources, University of Tehran, Iran: 150 400
21. Pourtahmasi K, Se Golpayegani A (2008) Introducing Mulberry’s wood (Morus alba 401
L.) used in bowl shaped musical instruments of Iran. Le bois : instrument du 402
patrimoine musical. Eds. Leconte S, Vaiedelich S. 29 May 2009 Cité de la Musique, 403
Paris. 404
22. Tappi standard (2008) T207_cm, T.S.m. Water solubility of wood and pulp. Technical 405
Assiciation of the Pulp and Paper Industry, USA 406
23. Brémaud I (2006) Diversity of woods used or usable in musical instruments making. 407
(In French). PhD thesis, University of Montpellier II: 302 408
24. Sun N, Das S, Frazier CH (2007) Dynamic mechanical analysis of dry wood: Linear 409
viscoelastic response region and effects of minor moisture changes. Holzforschung 410
61:28-33 411
20
25. Placet V, Passard J, Perré P (2008) Viscoelastic properties of wood across the grain 412
measured under water-saturated conditions up to 135 °C: evidence of thermal 413
degradation. J Mater Sci 43:3210-3217 414
26. Assor C, Placet V, Chabbert B, Habrant A, Lapierre C, Pollet B, Perré P (2009) 415
Concomitant Changes in Viscoelastic Properties and Amorphous Polymers during the 416
Hydrothermal Treatment of Hardwood and Softwood. J Agric Food Chem 57:6830–417
6837 418
27. Ono T, Norimoto M (1985) Anisotropy of dynamic Young's Modulus and internal 419
friction in wood. Jpn J Appl Phys 24:960-964 420
28. Guitard D, El Amri F (1987) Modèles prévisionnels de comportement élastique 421
tridimensionnel pour les bois feuillus et les bois résineux. Ann Sci For 44:335-348 422
29. Rowe JW, Conner A (1979) Extractives in Eastern Hardwoods-A Review. General 423
Technical report FPL18. Madison, Wisconsin, USA, Forest Products Laboratory, 424
Forest Service, U.S. Department of Agriculture:72 425
30. De Rosso M, Cancian D, Pnighel A, Dalla Vedova A, Flamini R (2009) Chemical 426
compounds released from five different woods used to make barrels for aging wines 427
and spirits: volatile compounds and polyphenols. Wood Sci Technol 43:375-385 428
31. Kleist G, Bauch J (2001) Cellular UV Microspectrophotometric Investigation of 429
Sapelli Heartwood (Entandophragma cylindricum Sprague) from Natural Provenances 430
in Africa. Holzforschung 55:117-122 431
32. Dünisch O, Richter HG, Koch G (2010) Wood properties of juvenile and mature 432
heartwood in Robinia pseudoacacia L. Wood Sci Technol 44:301-313 433
21
33. Koch G, Kleist G (2001) Application of Scanning UV Microspectrophotometry to 434
Localise Lignins and Phenolic Extractives in Plant Cell Walls. Holzforschung 55:563-435
567 436
34. Sakai K, Matsunaga M, Minato K, Nakatsubo F (1999) Effects of impregnation of 437
simple phenolics and natural polycyclic compounds on physical properties of wood. J 438
Wood Sci 45:227-232 439
35. Dunlop JI (1978) Damping loss in wood at mid kilohertz frequencies. Wood Sci 440
Technol 12:49 441
36. Inokuchi Y, Fushitani M, Kubo T, Sato K (1999) Effects of water extractives on the 442
moisture-content dependence of vibrational properties of Bamboo. Mokuzai gakkaishi 443
45:77-84 444
37. Yano H, Kyou K, Furuta Y, Kajita H (1995) Acoustic properties of Brazilian 445
rosewood used for guitar back plate. Mokuzai gakkaishi 41:17-24 446
38. Koch G (2004) Topochemical characterization of lignins and phenolic extractives in 447
wood cell walls. Lenzinger Berichte 83:6-12 448
449
450
451
452
453
454

22
Acknowledgments Authors are grateful to SCAC (Service de Coopération et d’Action Culturelle) of French 455
embassy in Tehran and ISMO (Iranian Center for international research and collaboration) for supporting this 456
project. 457

23
Tables 458
Table 1: Specimens number and treatments for both independent and successive methods of extraction 459
Number of specimens Solvent Drying and stabilization condition
Number of cycles of drying and stabilization
12 Hexane (HX)
60°C for 48 h
followed by
20±2˚C & 65±5% RH for 3weeks
2
12 Dichloromethane (DM) 2
12 Acetone (AC) 2
12 Methanol (ME) 2
5 Hot Water (HW, 70°C) 2
12 HX/DM/AC/ME/HW (100°C) 6
12 Controls 6
15 DMA(5L, 5R, 5T) ME 2
15 DMA(5L, 5R, 5T) HW (70°C) 2
12 DMA(4L, 4R, 4T) Controls 2
460
461
462
463
464
465
466
467
468
469
470
471
472
473
24
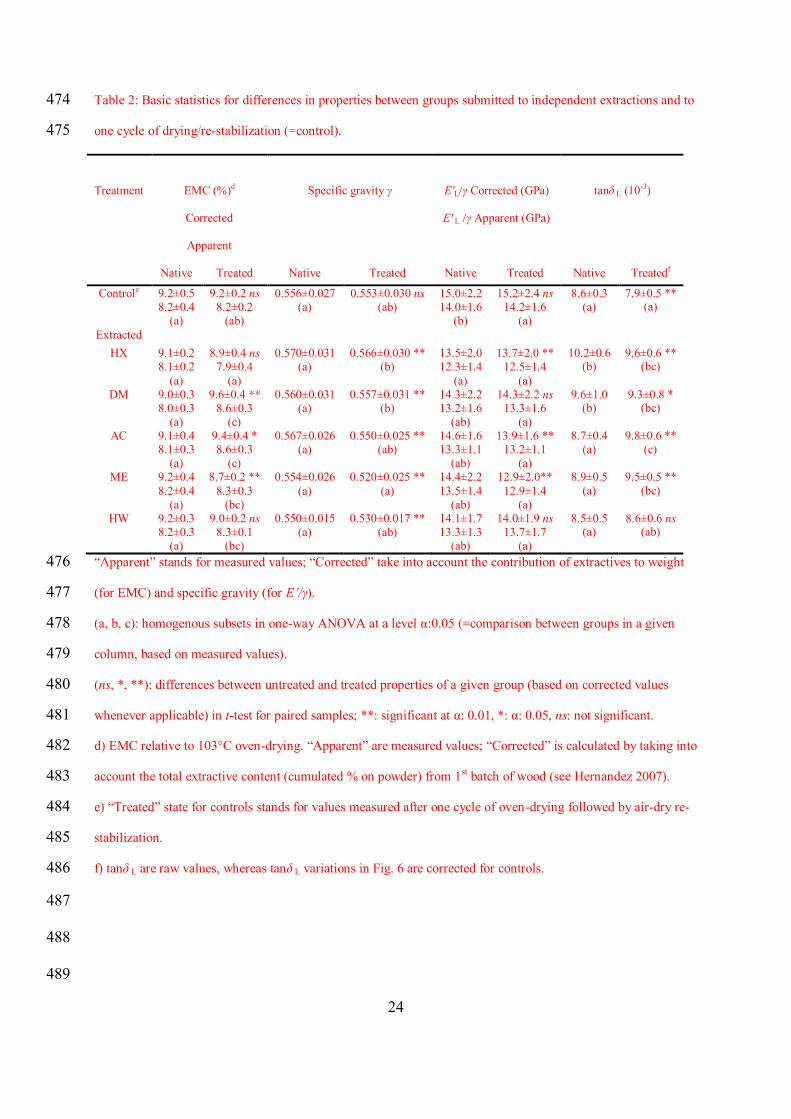
Table 2: Basic statistics for differences in properties between groups submitted to independent extractions and to 474
one cycle of drying/re-stabilization (=control). 475
Treatment
EMC (%)d
Corrected
Apparent
Specific gravity γ
E′L/γ Corrected (GPa)
E′ L /γ Apparent (GPa)
tanδ L (10-3)
Native Treated Native Treated Native Treated Native Treatedf
Controle 9.2±0.5 8.2±0.4
(a)
9.2±0.2 ns 8.2±0.2
(ab)
0.556±0.027 (a)
0.553±0.030 ns (ab)
15.0±2.2 14.0±1.6
(b)
15.2±2.4 ns 14.2±1.6
(a)
8.6±0.3 (a)
7.9±0.5 ** (a)
Extracted HX 9.1±0.2
8.1±0.2 (a)
8.9±0.4 ns 7.9±0.4
(a)
0.570±0.031 (a)
0.566±0.030 ** (b)
13.5±2.0 12.3±1.4
(a)
13.7±2.0 ** 12.5±1.4
(a)
10.2±0.6 (b)
9.6±0.6 ** (bc)
DM 9.0±0.3 8.0±0.3
(a)
9.6±0.4 ** 8.6±0.3
(c)
0.560±0.031 (a)
0.557±0.031 ** (b)
14.3±2.2 13.2±1.6
(ab)
14.3±2.2 ns 13.3±1.6
(a)
9.6±1.0 (b)
9.3±0.8 * (bc)
AC 9.1±0.4 8.1±0.3
(a)
9.4±0.4 * 8.6±0.3
(c)
0.567±0.026 (a)
0.550±0.025 ** (ab)
14.6±1.6 13.3±1.1
(ab)
13.9±1.6 ** 13.2±1.1
(a)
8.7±0.4 (a)
9.8±0.6 ** (c)
ME 9.2±0.4 8.2±0.4
(a)
8.7±0.2 ** 8.3±0.3
(bc)
0.554±0.026 (a)
0.520±0.025 ** (a)
14.4±2.2 13.5±1.4
(ab)
12.9±2.0** 12.9±1.4
(a)
8.9±0.5 (a)
9.5±0.5 ** (bc)
HW 9.2±0.3 8.2±0.3
(a)
9.0±0.2 ns 8.3±0.1
(bc)
0.550±0.015 (a)
0.530±0.017 ** (ab)
14.1±1.7 13.3±1.3
(ab)
14.0±1.9 ns 13.7±1.7
(a)
8.5±0.5 (a)
8.6±0.6 ns (ab)
“Apparent” stands for measured values;; “Corrected” take into account the contribution of extractives to weight 476
(for EMC) and specific gravity (for E’/γ). 477
(a, b, c): homogenous subsets in one-way ANOVA at a level α:0.05 (=comparison between groups in a given 478
column, based on measured values). 479
(ns, *, **): differences between untreated and treated properties of a given group (based on corrected values 480
whenever applicable) in t-test for paired samples; **: significant at α: 0.01, *: α: 0.05, ns: not significant. 481
d) EMC relative to 103°C oven-drying. “Apparent” are measured values;; “Corrected” is calculated by taking into 482
account the total extractive content (cumulated % on powder) from 1st batch of wood (see Hernandez 2007). 483
e) “Treated” state for controls stands for values measured after one cycle of oven-drying followed by air-dry re-484
stabilization. 485
f) tanδ L are raw values, whereas tanδ L variations in Fig. 6 are corrected for controls. 486
487
488
489
25
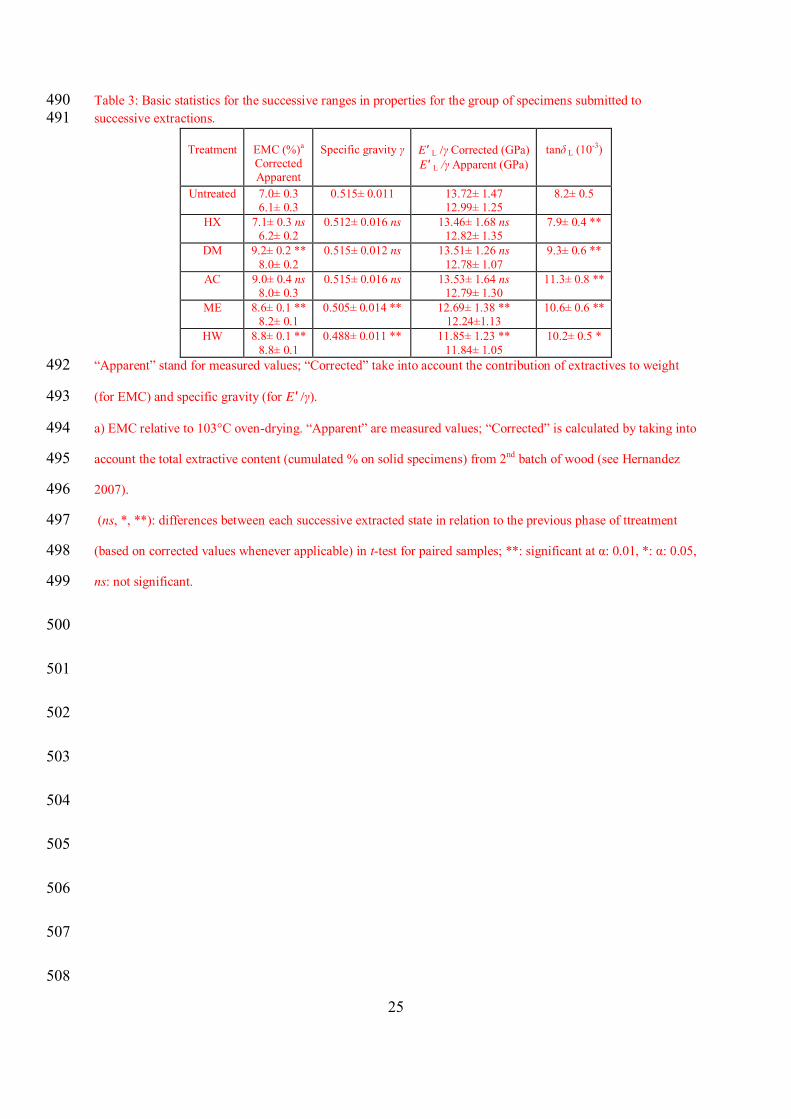
Table 3: Basic statistics for the successive ranges in properties for the group of specimens submitted to 490 successive extractions. 491
Treatment
EMC (%)a Corrected Apparent
Specific gravity γ
E′ L /γ Corrected (GPa) E′ L /γ Apparent (GPa)
tanδ L (10-3)
Untreated 7.0± 0.3 6.1± 0.3
0.515± 0.011 13.72± 1.47 12.99± 1.25
8.2± 0.5
HX 7.1± 0.3 ns 6.2± 0.2
0.512± 0.016 ns 13.46± 1.68 ns 12.82± 1.35
7.9± 0.4 **
DM 9.2± 0.2 ** 8.0± 0.2
0.515± 0.012 ns 13.51± 1.26 ns 12.78± 1.07
9.3± 0.6 **
AC 9.0± 0.4 ns 8.0± 0.3
0.515± 0.016 ns 13.53± 1.64 ns 12.79± 1.30
11.3± 0.8 **
ME 8.6± 0.1 ** 8.2± 0.1
0.505± 0.014 ** 12.69± 1.38 ** 12.24±1.13
10.6± 0.6 **
HW 8.8± 0.1 ** 8.8± 0.1
0.488± 0.011 ** 11.85± 1.23 ** 11.84± 1.05
10.2± 0.5 *
“Apparent” stand for measured values;; “Corrected” take into account the contribution of extractives to weight 492
(for EMC) and specific gravity (for E′ /γ). 493
a) EMC relative to 103°C oven-drying. “Apparent” are measured values;; “Corrected” is calculated by taking into 494
account the total extractive content (cumulated % on solid specimens) from 2nd batch of wood (see Hernandez 495
2007). 496
(ns, *, **): differences between each successive extracted state in relation to the previous phase of ttreatment 497
(based on corrected values whenever applicable) in t-test for paired samples; **: significant at α: 0.01, *: α: 0.05, 498
ns: not significant. 499
500
501
502
503
504
505
506
507
508
26
Figure legends 509
Fig. 1. Cutting plan for vibrational and DMA specimens. Variations in length of DMA specimens were due to 510
limitations in raw material. 511
512
Fig. 2. Box plot of specimens specific gravity (γ) for the three batches of wood under study, and for previous 513
data on wood from different origins (Se Golpayegani20). (a, b, c) significantly different groups (one-way 514
ANOVA). 515
516
Fig. 3. Relationship between E′L/γ and tanδL for 4 batches of native mulberry wood (N specimens: see Fig. 2). 517
518
Fig. 4: Comparison of weight loss due to independent and successive extraction in (a) powder, and (b) solid 519
(vibrational) specimens. “Successive” weight losses are relative to the previous step;; “independent” and 520
“successive-cumulated” are relative to native oven-dry weight. 521
522
Fig. 5. Relationship between weight loss (%) and relative change of E′L/γ (%) after (a): independent extractions 523
and (b): successive extractions where changes are relative to initial state of native specimens (i.e. cumulated 524
changes). E′L/γ was corrected for contribution of extractives to γ. 525
526
Fig. 6. Relative changes (%) in tanδL plotted against weight loss (%) for (a) independent and (b) successive 527
extractions. Changes are relative to initial state of native specimens (independent and successive-cumulated). 528
Arrows: order of successive extractions. Values of tanδL in independent extractions are corrected for controls. 529
530

27
Fig. 7. Variations in mechanical properties after extractions measured by DMA at 10 Hz. Values for controls 531
were not deduced from treated ones. 532
533
28
Figures 534
535
Fig. 1. 536
537
29
538
Fig. 2. 539
540
30
541
542
Fig. 3. 543
544
31
545
546
547
Fig. 4. 548
32
549
550
Fig. 5. 551
552
33
553
Fig. 6. 554
555
34
556
557
Fig. 7. 558