EFFECT OF EXTRACTION CONDITIONS ON PROTEIN …umpir.ump.edu.my/id/eprint/9157/1/cd8658.pdf ·...
24
III EFFECT OF EXTRACTION CONDITIONS ON PROTEIN CONCENTRATION DURING EDIBLE BIRD’S NEST ALKALINE HYDROLYSIS NURUL AIN BINTI JUMRI Thesis submitted in partial fulfilment of the requirements for the award of the degree of Bachelor of Chemical Engineering (Biotechnology) Faculty of Chemical & Natural Resources Engineering UNIVERSITI MALAYSIA PAHANG JUNE 2014 ©NURUL AIN BINTI JUMRI (2014)
Transcript of EFFECT OF EXTRACTION CONDITIONS ON PROTEIN …umpir.ump.edu.my/id/eprint/9157/1/cd8658.pdf ·...
III
EFFECT OF EXTRACTION CONDITIONS ON
PROTEIN CONCENTRATION DURING EDIBLE
BIRD’S NEST ALKALINE HYDROLYSIS
NURUL AIN BINTI JUMRI
Thesis submitted in partial fulfilment of the requirements
for the award of the degree of
Bachelor of Chemical Engineering (Biotechnology)
Faculty of Chemical & Natural Resources Engineering
UNIVERSITI MALAYSIA PAHANG
JUNE 2014
©NURUL AIN BINTI JUMRI (2014)
VIII
ABSTRACT
Edible bird’s nest (EBN) is originated from the saliva of swiftlet. There are four species
of swiftlet which are Collocalia fuciphaga, Collocalia germanis, Collocalia maxima
and Collocalia unicolor. Collocalia fuciphaga is the common species which can be
found in Malaysia. EBN consists mainly of amino acids, carbohydrates and mineral
salts but it major ingredients were protein. Protein from EBN can be extracted by water,
acid, alkaline and enzymatic hydrolysis method. This study focused on alkaline
hydrolysis using sodium hydroxide (NaOH) at 50°C. Prior to alkaline hydrolysis, pre-
treatment method (EBN cleaning by soaked with water, feathers removal and fine
plumage from EBN sample) has been carried out. The effect of extraction time, NaOH
concentration and liquid solid ratio (LSR) on protein concentration have been
determined during alkaline hydrolysis. The optimum condition of alkaline hydrolysis
has been identified using response surface methodology (RSM). From the experimental
result, it showed that the maximum protein concentration was at 25 minutes of
extraction time, 30:1 of LSR and 100 g/L NaOH concentration. However, increased in
LSR and NaOH concentration were increased the protein concentration. The optimum
condition of protein concentration was 1.260 g/L during alkaline hydrolysis using RSM
were found at 25 minutes of extraction time, 100g/L NaOH concentration and 30:1 of
LSR. From the ANOVA result, the significant factor was extraction time (p=0.0187)
and was clearly showed that further increased in extraction time (25 minutes) resulted in
decreased in protein concentration due to the degradation of amino acid structure at long
duration of extraction time. The FTIR spectrums of the untreated and treated sample
resulted in the different trend of spectrum. In the treated sample after pre-treatment
process and alkaline hydrolysis, it is showed that N-H and C=O stretching peak is
increased. Besides, it was confirmed that the material was correspond to amides as it
consists of C=O stretch. While, from the analysis using the ICP-MS, amount of
cadmium, arsenic and lead in the sample was 0.002mg/L, 0.00006mg/L and 0.262mg/L
respectively after pre-treatment. It also showed that percentage decreasing of argentums,
cadmium and magnesium is the highest compared to others metal which were 99%,
97.70% and 97.24% respectively. It can be concluded that EBN can be performed as an
alternative source for protein.

IX
ABSTRAK
Sarang burung berasal dari air liur burung walit. Terdapat empat spesies burung iaitu
Collocalia fuciphaga, Collocalia germanis, Collocalia maxima dan Collocalia unicolor.
Collocalia fuciphaga adalah spesies yang biasa didapati di Malaysia. EBN terdiri
daripada asid amino, karbohidrat dan garam mineral tetapi bahan utamanya adalah
protin. Protin dari EBN boleh diekstrak dengan air, asid, alkali dan kaedah enzimatik
hidrolisis. Kajian ini tertumpu kepada hidrolisis alkali menggunakan natrium hidroksida
(NaOH) pada 50°C. Sebelum hidrolisis alkali, kaedah rawatan awal (pembersihan EBN
dengan merendam sampel dengan air, penyingkiran bulu kasar dan bulu halus dari
sampel EBN) telah dijalankan. Kesan masa pengekstrakan, kepekatan NaOH dan nisbah
pepejal cecair (LSR) kepada kepekatan protein telah ditentukan semasa proses hidrolisis
alkali. Keadaan optimum hidrolisis alkali telah dikenal pasti menggunakan balas
metodologi permukaan (RSM). Dari keputusan eksperimen, ia menunjukkan bahawa
kepekatan protein maksimum dicapai pada 25 minit masa pengekstrakan, 30:1 nisbah
pepejal kepada air (LSR) dan 100g/L kepekatan NaOH. Peningkatan dalam LSR dan
kepekatan NaOH telah menyumbang kepada peningkatan kepekatan protein. Keadaan
optimum kepekatan protein adalah 1.260g/L semasa hidrolisis alkali menggunakan
RSM ditemui pada 25 minit masa pengekstrakan, 100g/L kepekatan NaOH dan nisbah
30:1. Dari keputusan ANOVA, faktor penting didapati adalah masa pengekstrakan (p =
0.0187) dan telah jelas menunjukkan bahawa peningkatan terus menerus pada masa
pengekstrakan (25 minit) menyebabkan penurunan kepada kepekatan protein
disebabkan oleh kemusnahan struktur asid amino oleh signal masa pengekstrakan.
Spektrum FTIR sampel yang tidak dirawat dan dirawat menunjukkan trend spektrum
yang berbeza. Dalam sampel yang dirawat selepas proses rawatan awal dan hidrolisis
alkali, ia menunjukkan bahawa N-H dan C=O regangan puncak bertambah. Selain itu, ia
telah mengesahkan bahawa bahan tersebut dikategorikan sebagai amida kerana terdiri
daripada C =O regangan. Selain itu, dari analisis ICP-MS, jumlah kadmium, arsenik dan
plumbum dalam sampel adalah 0.002mg/L, 0.00006mg/L dan 0.262mg/L masing-
masing selepas rawatan awal. Ia juga menunjukkan bahawa peratusan penurunan
argentums, kadmium dan magnesium adalah yang tertinggi berbanding dengan logam
lain yang masing-masing 99%, 97.70% dan 97.24%. Ia boleh membuat kesimpulan
bahawa EBN sesuai digunakan sebagai sumber alternatif untuk protein.
X
TABLE OF CONTENTS
SUPERVISOR’S DECLARATION ............................................................................... IV
STUDENT’S DECLARATION ...................................................................................... V
Dedication ....................................................................................................................... VI
ACKNOWLEDGEMENT ............................................................................................. VII
ABSTRACT ................................................................................................................. VIII
ABSTRAK ...................................................................................................................... IX
TABLE OF CONTENTS ................................................................................................. X
LIST OF FIGURES ....................................................................................................... XII
LIST OF TABLES ....................................................................................................... XIV
LIST OF ABBREVIATIONS ....................................................................................... XV
LIST OF ABBREVIATIONS ...................................................................................... XVI
1 INTRODUCTION .................................................................................................... 1
1.1 Background of the study .................................................................................... 1
1.2 Motivation .......................................................................................................... 3
1.3 Statement of problem ......................................................................................... 4
1.4 Objectives ........................................................................................................... 4
1.5 Scope of this research ......................................................................................... 4
1.6 Rationale and significance ................................................................................. 5
2 LITERATURE REVIEW ......................................................................................... 6
2.1 Edible bird’s nest (Collocalia Fuciphaga) .......................................................... 6
2.2 Types of edible bird’s nest (EBN) ..................................................................... 7
2.3 Nutritional value of edible bird’s nest (EBN) .................................................... 8
2.4 Origin of edible bird’s nest (EBN) ..................................................................... 9
2.5 Contents of edible bird’s nest (EBN) ............................................................... 10
2.6 Market of edible bird’s nest (EBN) .................................................................. 11
2.7 Pre-treatment of edible bird’s nest (EBN) ....................................................... 11
2.8 Swiflet farming in Malaysia ............................................................................. 11
2.9 Protein .............................................................................................................. 14
2.10 Source of protein .......................................................................................... 14
2.11 Amino acid ................................................................................................... 15
2.12 Alkaline hydrolysis concept ......................................................................... 17
2.13 Protein extraction .......................................................................................... 17
2.14 Liquid Solid Ratio (LSR) ............................................................................. 17
2.15 Alkaline hydrolysis of protein extraction ..................................................... 18
2.16 Fourier transform infrared spectroscopy (FTIR) .......................................... 21
2.17 Inductively coupled plasma-mass spectrometer (ICP-MS) .......................... 23
2.18 Heavy metals ................................................................................................ 25
2.19 Scanning electron microscope (SEM) .......................................................... 29
2.20 Scanning electron microscope and its field of application ........................... 30
2.21 Response surface methodology (RSM) ........................................................ 31
3 METHODOLOGY ................................................................................................. 35
3.1 Raw materials ................................................................................................... 35
3.1.1 Edible bird’s nest (EBN) ........................................................................... 35
3.2 Method ............................................................................................................. 35
XI
3.2.1 Characterization of the sample using Fourier Transform Infrared
Spectroscopy (FTIR) ............................................................................................... 35
3.2.2 Inductively coupled plasma- Mass Spectrometry (ICP-MS) ..................... 35
3.2.3 Scanning electron microscope (SEM) ....................................................... 36
3.2.4 Standard protein curve ............................................................................. 36
3.2.5 Pre-treatment of edible bird’s nest ........................................................... 37
3.2.6 Alkaline hydrolysis .................................................................................... 40
3.2.7 Modified Lowry and Folin-Ciocalteu reagent .......................................... 41
3.2.8 Solid liquid separation .............................................................................. 41
3.2.9 Determination concentration of protein ................................................... 42
3.2.10 Response surface methodology (RSM) ..................................................... 45
3.3 Flow Diagram................................................................................................... 47
4 RESULTS AND DISCUSSION ............................................................................. 48
4.1 Experimental results ......................................................................................... 48
4.2 Characterization of sample ............................................................................... 48
4.2.1 Fourier Transform Infrared Spectroscopy (FTIR) ................................... 48
4.2.2 Inductively Coupled Plasma (ICP) ........................................................... 54
4.2.3 Scanning electron microscope (SEM) ....................................................... 58
4.3 One factor at a time .......................................................................................... 62
4.3.1 Effect of extraction time to protein concentration .................................... 62
4.3.2 Effect of NaOH concentration to protein concentration .......................... 63
4.3.3 Effect of LSR to protein concentration ..................................................... 65
4.3.4 Protein concentration versus NaOH concentration ................................. 66
4.3.5 Optimization of the protein concentration ................................................ 71
5 CONCLUSIONS .................................................................................................... 86
5.1 RECOMMENDATIONS ................................................................................. 87
6 APPENDIX ............................................................................................................. 88
7 REFERENCES ..................................................................................................... 100

XII
LIST OF FIGURES Figure 2-1: Collocalia Fuciphaga swiflet ........................................................................ 6
Figure 2-2: House nest of Edible bird’s nest (EBN) ......................................................... 7
Figure 2-3: Cave nest of Edible bird’s nest (EBN) ........................................................... 8
Figure 2-4: Edible bird’s nest (EBN) .............................................................................. 10
Figure 2-5: Structure and classification of twenty amino acids ...................................... 16
Figure 2-6: Fourier Transform Infrared Spectroscopy (FTIR) ....................................... 21
Figure 2-7: Inductively coupled plasma-mass spectrometer (ICP-MS) ......................... 25
Figure 2-8: Schematic ray path for a SEM (Source: Ludwig and Helmut, 2008) .......... 29
Figure 2-9: Scanning electron microscope (SEM) ......................................................... 31
Figure 3-1: The BSA solution for the determination of protein standard curve ............. 36
Figure 3-2: The nests ...................................................................................................... 37
Figure 3-3: Soaking the EBN sample ............................................................................. 38
Figure 3-4: The small feather was removed from the sample ........................................ 38
Figure 3-5: The EBN sample with excessive distilled water before filtration ................ 39
Figure 3-6: The EBN sample after pre-treatment ........................................................... 39
Figure 3-7: The extraction process occurred in the test tube .......................................... 40
Figure 3-8: Incubator shaker used in the extraction process .......................................... 41
Figure 3-9: The BSA solution for the determination of protein standard curve ............. 42
Figure 3-10: Lowry method before analysis of sample .................................................. 43
Figure 3-11: UV-vis spectrophotometer used to analyze sample ................................... 43
Figure 3-12: Samples that need to be analyzed .............................................................. 44
Figure 3-13: Flow diagram of the methodology ............................................................. 47
Figure 4-1: FTIR analysis of untreated sample (powder form) ...................................... 51
Figure 4-2: FTIR analysis of treated sample after pre-treatment process (gel form) ..... 52
Figure 4-3: FTIR analysis of treated sample after alkaline hydrolysis (liquid form) ..... 53
Figure 4-4: Surface morphology of raw edible bird’s nest (100 X) ............................... 58
Figure 4-5: Surface morphology (12 KX) Figure 4-6: Surface morphology (3 KX)
........................................................................................................................................ 58
Figure 4-7: SEM photos of representative raw samples and instant samples. (a) Imperial
EBN sample, (b) feather EBN sample, (c) grass EBN sample, (d) instant EBN sample
(Imperial), (e) instant EBN sample (Feather), (f) fake instant EBN sample (Jelly
fungus), (g) fake instant EBN sample (Agar) and (h) fake instant EBN sample (Pigskin)
........................................................................................................................................ 60
Figure 4-8: SEM of seaweed cross-section in adulterated nest taken by Marcone (2005)
........................................................................................................................................ 61
Figure 4-9: Effect of extraction time to protein concentration ....................................... 63
XIII
Figure 4-10: Effect of NaOH concentration to protein concentration ............................ 64
Figure 4-11: Effect LSR to protein concentration .......................................................... 65
Figure 4-12: Graph of protein concentration versus NaOH concentration (Study on
different time extraction and LSR 70:1) ......................................................................... 66
Figure 4-13: Graph of protein concentration versus NaOH concentration (Study on
different time extraction and LSR 60:1) ......................................................................... 67
Figure 4-14: Graph of protein concentration versus NaOH concentration (Study on
different time extraction and LSR 50:1) ......................................................................... 68
Figure 4-15: Graph of protein concentration versus NaOH concentration (Study on
different time extraction and LSR 40:1) ......................................................................... 69
Figure 4-16: Graph of protein concentration versus NaOH concentration (Study on
different time extraction and LSR 30:1) ......................................................................... 70
Figure 4-17: Effect of NaOH concentration and extraction time on protein concentration
extracted from EBN ........................................................................................................ 74
Figure 4-18: Surface plot for protein extract on EBN of factor A: B ( Time; NaOH
concentration) ................................................................................................................. 75
Figure 4-19: Interaction graph for the response of factor A:B (Time; NaOH
concentration) ................................................................................................................. 76
Figure 4-20: Surface plot for protein extract on EBN of factor A: C ( time ; LSR) ....... 77
Figure 4-21: Interaction graph for the response of factor A: C ( time; LSR ) ................ 78
Figure 4-22: Surface plot for protein extract on EBN of factor B: C ( NaOH
concentration; LSR ) ....................................................................................................... 79
Figure 4-23: Interaction graph for the response of factor B:C ( NaOH concentration;
LSR ) ............................................................................................................................... 80
Figure 4-24: The Normal Plot of Residuals .................................................................... 81
Figure 4-25: Plot of Residuals against predicted response ............................................. 82
Figure 4-26: Plot of Residuals against run response ....................................................... 83
Figure 4-27: Plot of Residuals against time .................................................................... 83
XIV
LIST OF TABLES
Table 2-1: Classification of twenty types of amino acid ................................................ 15
Table 2-2: Alkaline hydrolysis method in extraction of protein in different type of
samples. ........................................................................................................................... 19
Table 2-3: The effect of heavy metals towards human and mammals ........................... 27
Table 3-1: Dilution from the BSA solution (1.0g/L) for the standard curve .................. 37
Table 3-2: Parameter and levels for response surface study ........................................... 45
Table 3-3: Design layout ................................................................................................. 46
Table 4-1: The functional group of unprocessed and processed EBN samples .............. 50
Table 4-2: Concentration of heavy metals contain in the sample ................................... 55
Table 4-3: The ICP-MS analysis of EBN dry and EBN gel sample ............................... 57
Table 4-4: Results of protein concentration (g/L) with varying extraction time (minutes)
........................................................................................................................................ 62
Table 4-5: Results of protein concentration (g/L) with NaOH concentration (g/L) ....... 64
Table 4-6: Analysis of variance Table (partial sum of squares) for response surface
Model .............................................................................................................................. 73
Table 4-7: Confirmation run ........................................................................................... 84

XV
LIST OF ABBREVIATIONS
Ppb parts per billion
Ppm parts per million

XVI
LIST OF ABBREVIATIONS
EBN Edible bird’s nest
FTIR Fourier transform infrared spectroscopy
ICP-MS Inductively coupled plasma-mass spectrometry
LSR Liquid solid ratio
NaCI Sodium chloride
NaOH Sodium hydroxide
RSM Response surface methodology
1
1 INTRODUCTION
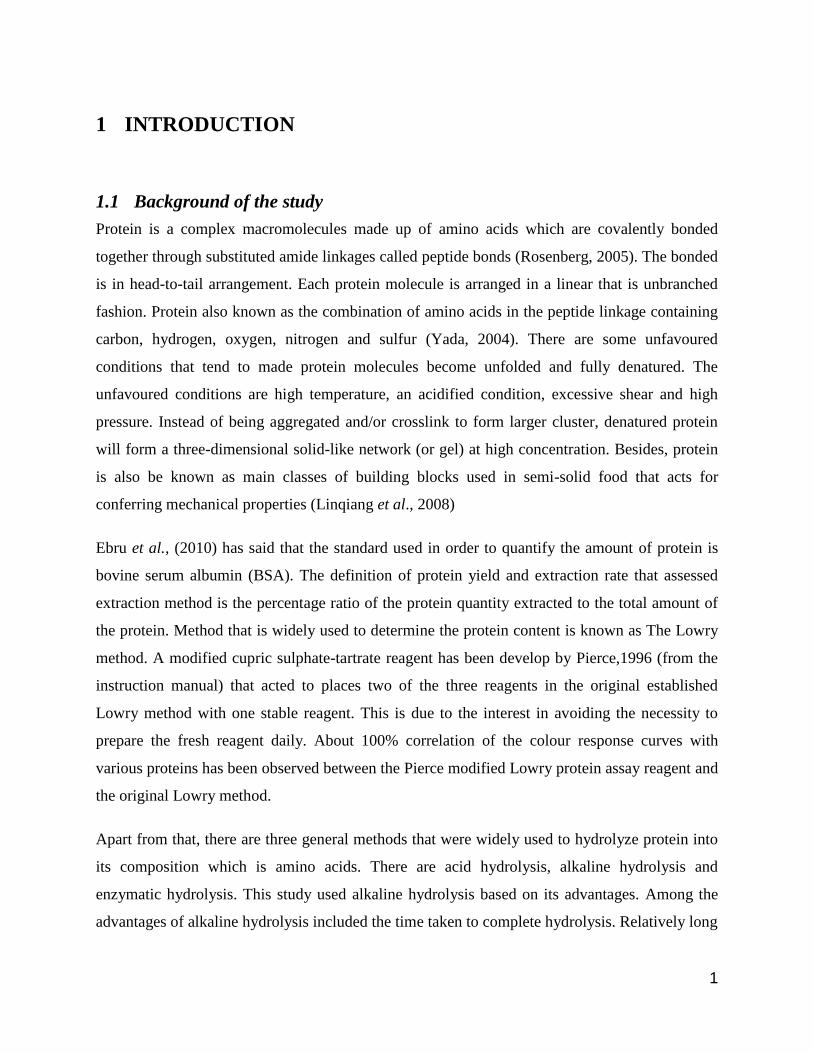
1.1 Background of the study
Protein is a complex macromolecules made up of amino acids which are covalently bonded
together through substituted amide linkages called peptide bonds (Rosenberg, 2005). The bonded
is in head-to-tail arrangement. Each protein molecule is arranged in a linear that is unbranched
fashion. Protein also known as the combination of amino acids in the peptide linkage containing
carbon, hydrogen, oxygen, nitrogen and sulfur (Yada, 2004). There are some unfavoured
conditions that tend to made protein molecules become unfolded and fully denatured. The
unfavoured conditions are high temperature, an acidified condition, excessive shear and high
pressure. Instead of being aggregated and/or crosslink to form larger cluster, denatured protein
will form a three-dimensional solid-like network (or gel) at high concentration. Besides, protein
is also be known as main classes of building blocks used in semi-solid food that acts for
conferring mechanical properties (Linqiang et al., 2008)
Ebru et al., (2010) has said that the standard used in order to quantify the amount of protein is
bovine serum albumin (BSA). The definition of protein yield and extraction rate that assessed
extraction method is the percentage ratio of the protein quantity extracted to the total amount of
the protein. Method that is widely used to determine the protein content is known as The Lowry
method. A modified cupric sulphate-tartrate reagent has been develop by Pierce,1996 (from the
instruction manual) that acted to places two of the three reagents in the original established
Lowry method with one stable reagent. This is due to the interest in avoiding the necessity to
prepare the fresh reagent daily. About 100% correlation of the colour response curves with
various proteins has been observed between the Pierce modified Lowry protein assay reagent and
the original Lowry method.
Apart from that, there are three general methods that were widely used to hydrolyze protein into
its composition which is amino acids. There are acid hydrolysis, alkaline hydrolysis and
enzymatic hydrolysis. This study used alkaline hydrolysis based on its advantages. Among the
advantages of alkaline hydrolysis included the time taken to complete hydrolysis. Relatively long
2
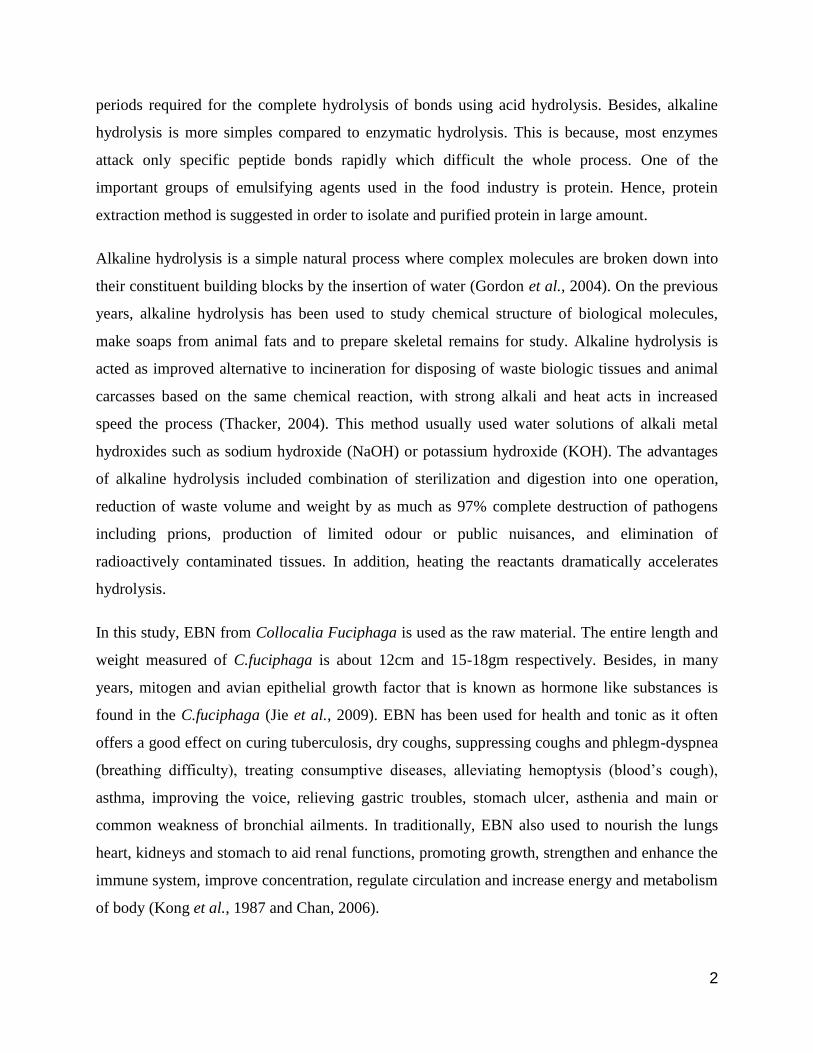
periods required for the complete hydrolysis of bonds using acid hydrolysis. Besides, alkaline
hydrolysis is more simples compared to enzymatic hydrolysis. This is because, most enzymes
attack only specific peptide bonds rapidly which difficult the whole process. One of the
important groups of emulsifying agents used in the food industry is protein. Hence, protein
extraction method is suggested in order to isolate and purified protein in large amount.
Alkaline hydrolysis is a simple natural process where complex molecules are broken down into
their constituent building blocks by the insertion of water (Gordon et al., 2004). On the previous
years, alkaline hydrolysis has been used to study chemical structure of biological molecules,
make soaps from animal fats and to prepare skeletal remains for study. Alkaline hydrolysis is
acted as improved alternative to incineration for disposing of waste biologic tissues and animal
carcasses based on the same chemical reaction, with strong alkali and heat acts in increased
speed the process (Thacker, 2004). This method usually used water solutions of alkali metal
hydroxides such as sodium hydroxide (NaOH) or potassium hydroxide (KOH). The advantages
of alkaline hydrolysis included combination of sterilization and digestion into one operation,
reduction of waste volume and weight by as much as 97% complete destruction of pathogens
including prions, production of limited odour or public nuisances, and elimination of
radioactively contaminated tissues. In addition, heating the reactants dramatically accelerates
hydrolysis.
In this study, EBN from Collocalia Fuciphaga is used as the raw material. The entire length and
weight measured of C.fuciphaga is about 12cm and 15-18gm respectively. Besides, in many
years, mitogen and avian epithelial growth factor that is known as hormone like substances is
found in the C.fuciphaga (Jie et al., 2009). EBN has been used for health and tonic as it often
offers a good effect on curing tuberculosis, dry coughs, suppressing coughs and phlegm-dyspnea
(breathing difficulty), treating consumptive diseases, alleviating hemoptysis (blood’s cough),
asthma, improving the voice, relieving gastric troubles, stomach ulcer, asthenia and main or
common weakness of bronchial ailments. In traditionally, EBN also used to nourish the lungs
heart, kidneys and stomach to aid renal functions, promoting growth, strengthen and enhance the
immune system, improve concentration, regulate circulation and increase energy and metabolism
of body (Kong et al., 1987 and Chan, 2006).

3
Malaysia is currently one of the largest producers of EBN in the world and it publication can be
hypothesized based on the enduring qualitative reasons below that:
1. Consumption of EBN is considered as a status symbol
2. The health giving properties of consuming EBN
3. Strong economic growth rates experienced by Hong Kong, China and Taiwan
4. Potential of EBN as a base mineral to be used in the production of herbal and vitamin
supplement, the international market for EBN will grow at double-digit rates for the next
two decades or so on.
1.2 Motivation
Every property that characterizes a living organism is affected by proteins. There are many
function of protein that made it useful and needed in great amount so that the nutrients from the
food can be obtained by all people who in need. Some of the function of protein are to store and
transport a variety of particles ranging from macromolecules to electron as they guide the flow of
electrons in the vital process of photosynthesis. Protein also acts as hormone, they transmit
information between specific cells and organs in complex organism and in between proteins
control the passage of molecules across the membranes that compartmentalize cells and
organelles. Others than that, protein function in the immune systems of complex organisms to
defend against intruders and control gene expression by binding to specific sequences of nucleic
acids, thereby turning genes on and off (Lauritzen, 1992). One of the most crucial problems of
the world is deficiency of food especially, in protein. About 500 million people suffer from
severe-protein-calorie malnutrition. Furthermore, the increase of human population has caused
serious problem (Lasztity et al., 1983). In order to obtain protein in great amounts, people may
extract protein from any resources including marine life and porcine sources which sometimes
do not suit to be consumed in large amounts by certain people. This is because, protein from
marine life and other animal may contains high fat that will attributed heart diseases and blood
pressure (Hoffman et al., 2004), while protein from porcine sources are not Halal so this protein
cannot be consumed by Muslim because of religious barrier. By then, in order to compete with
protein extracted from animal and marine life, the percentage of protein extracted from EBN
should be optimized. In addition, as there are many disadvantages of protein extraction from
4
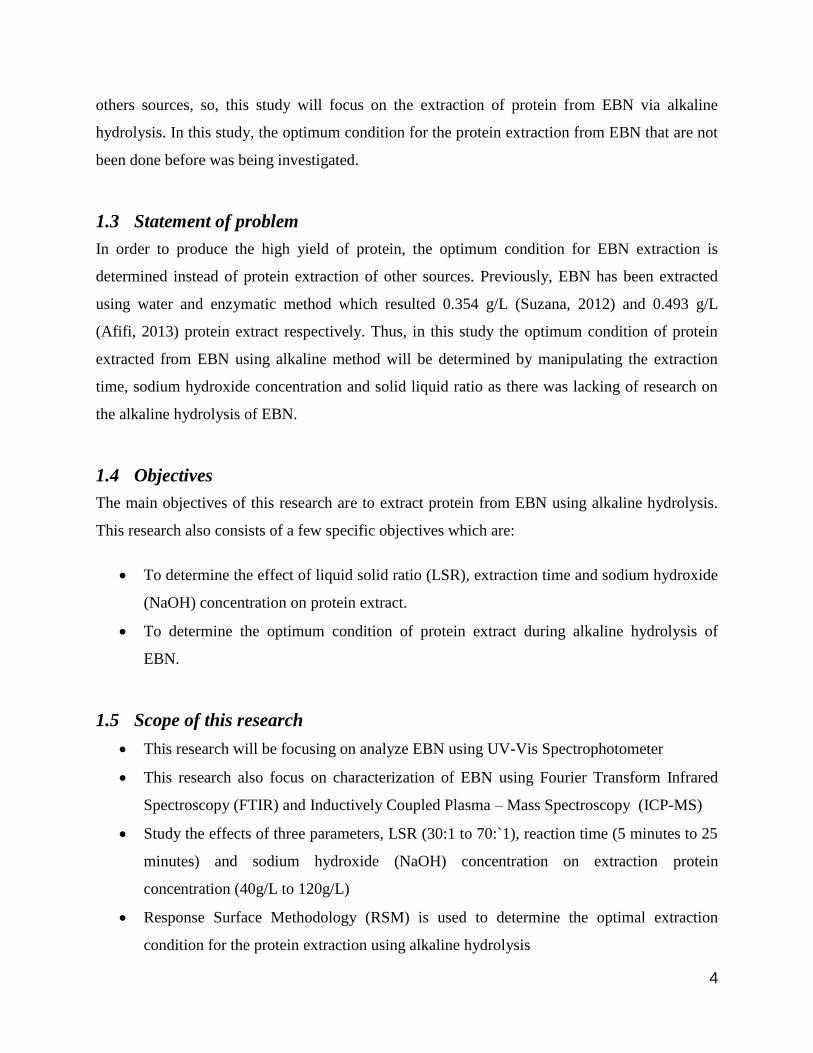
others sources, so, this study will focus on the extraction of protein from EBN via alkaline
hydrolysis. In this study, the optimum condition for the protein extraction from EBN that are not
been done before was being investigated.
1.3 Statement of problem
In order to produce the high yield of protein, the optimum condition for EBN extraction is
determined instead of protein extraction of other sources. Previously, EBN has been extracted
using water and enzymatic method which resulted 0.354 g/L (Suzana, 2012) and 0.493 g/L
(Afifi, 2013) protein extract respectively. Thus, in this study the optimum condition of protein
extracted from EBN using alkaline method will be determined by manipulating the extraction
time, sodium hydroxide concentration and solid liquid ratio as there was lacking of research on
the alkaline hydrolysis of EBN.
1.4 Objectives
The main objectives of this research are to extract protein from EBN using alkaline hydrolysis.
This research also consists of a few specific objectives which are:
To determine the effect of liquid solid ratio (LSR), extraction time and sodium hydroxide
(NaOH) concentration on protein extract.
To determine the optimum condition of protein extract during alkaline hydrolysis of
EBN.
1.5 Scope of this research
This research will be focusing on analyze EBN using UV-Vis Spectrophotometer
This research also focus on characterization of EBN using Fourier Transform Infrared
Spectroscopy (FTIR) and Inductively Coupled Plasma – Mass Spectroscopy (ICP-MS)
Study the effects of three parameters, LSR (30:1 to 70:`1), reaction time (5 minutes to 25
minutes) and sodium hydroxide (NaOH) concentration on extraction protein
concentration (40g/L to 120g/L)
Response Surface Methodology (RSM) is used to determine the optimal extraction
condition for the protein extraction using alkaline hydrolysis
5
1.6 Rationale and significance
Analysis of EBN chemical constituents can be traced back to 1921 (Wang, 1922). It is known
that EBN is mainly composed of proteins. EBN has the properties of carbohydrate besides
protein. As protein are the highest content in the EBN and it has valuable function to people,
hence, the study of the extraction protein from EBN with the optimum condition is conducted so
that the nutrients on the protein in the EBN is preserved as well as produced high amount of
protein extract. However, it is not known yet which method of extraction protein will yield the
large amount of total protein. So, this research is revealed that alkaline hydrolysis produced the
highest protein yield compared to the acid and enzymatic hydrolysis.
6
2 LITERATURE REVIEW
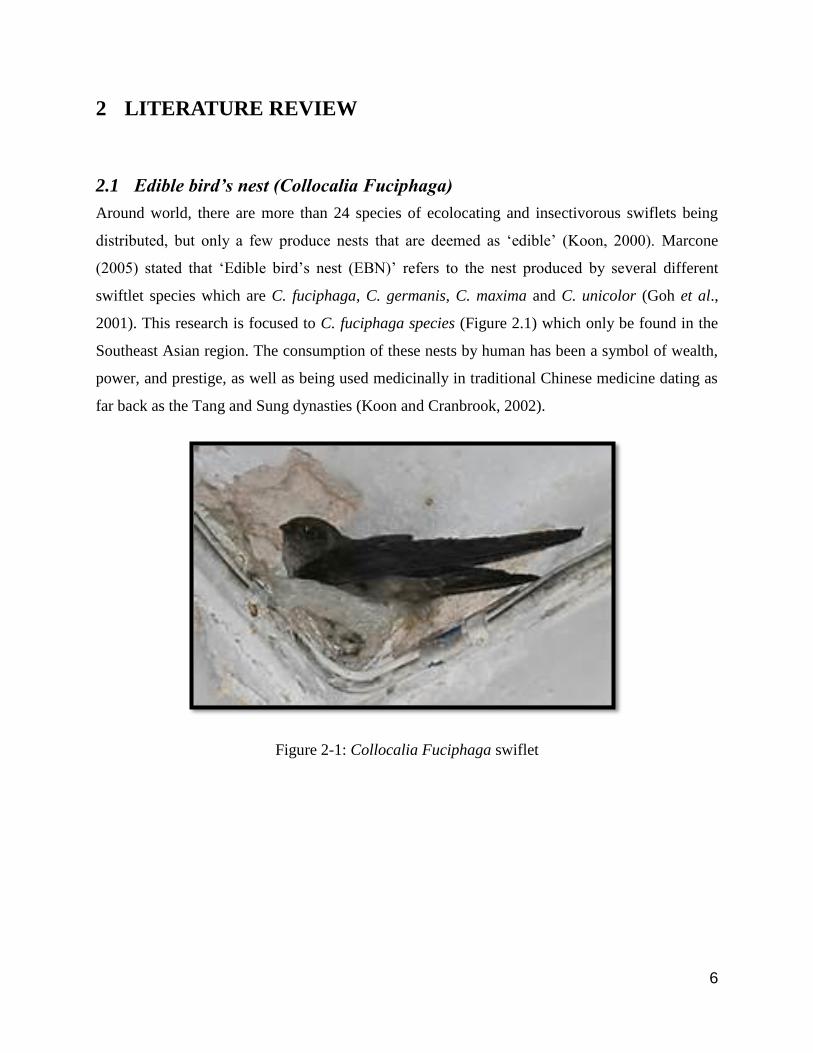
2.1 Edible bird’s nest (Collocalia Fuciphaga)
Around world, there are more than 24 species of ecolocating and insectivorous swiflets being
distributed, but only a few produce nests that are deemed as ‘edible’ (Koon, 2000). Marcone
(2005) stated that ‘Edible bird’s nest (EBN)’ refers to the nest produced by several different
swiftlet species which are C. fuciphaga, C. germanis, C. maxima and C. unicolor (Goh et al.,
2001). This research is focused to C. fuciphaga species (Figure 2.1) which only be found in the
Southeast Asian region. The consumption of these nests by human has been a symbol of wealth,
power, and prestige, as well as being used medicinally in traditional Chinese medicine dating as
far back as the Tang and Sung dynasties (Koon and Cranbrook, 2002).
Figure 2-1: Collocalia Fuciphaga swiflet
7
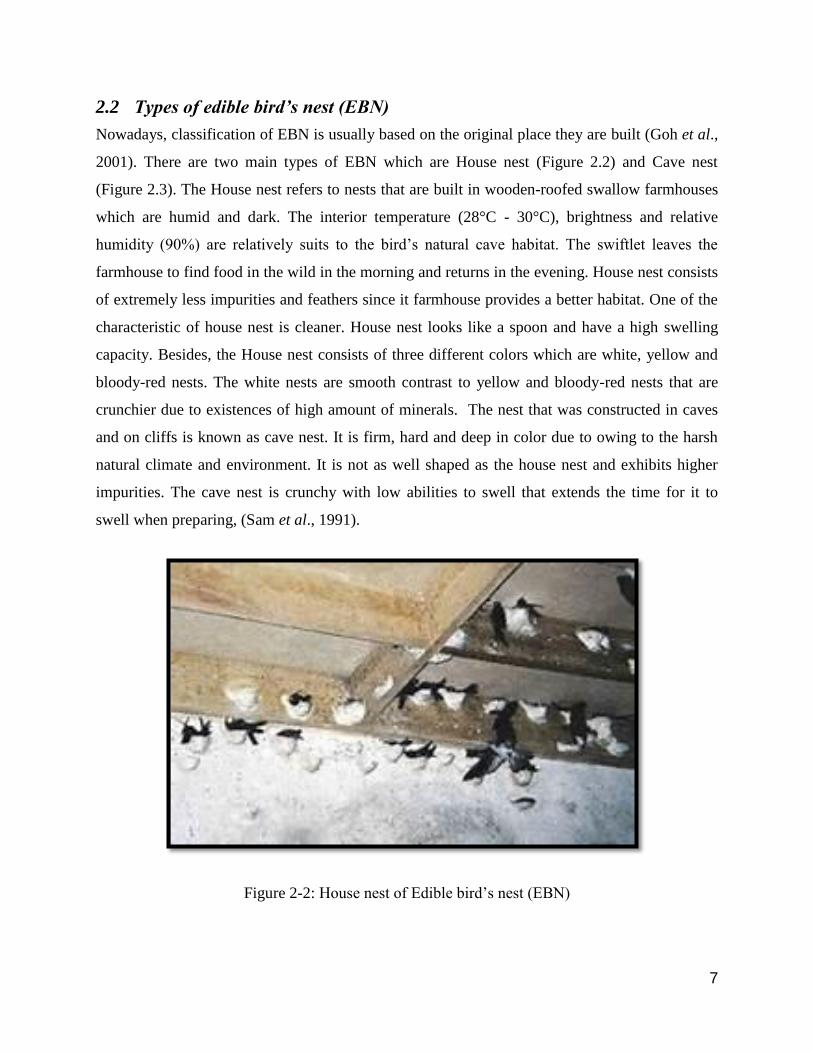
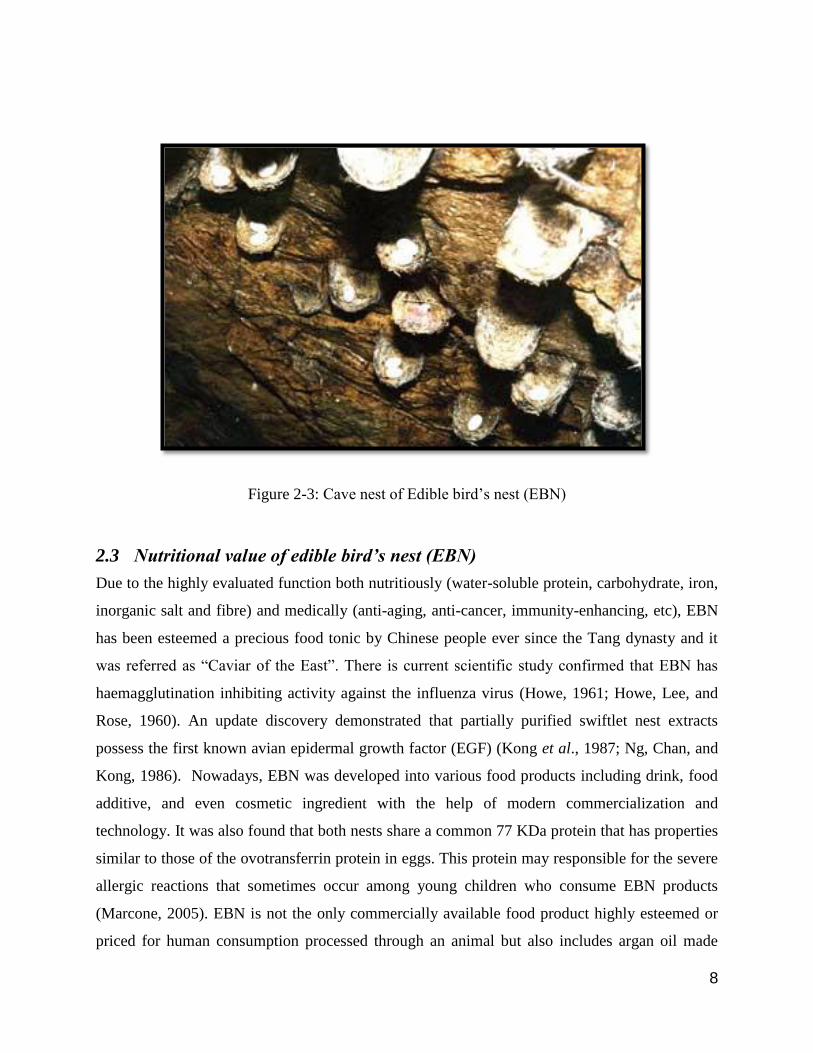
2.2 Types of edible bird’s nest (EBN)
Nowadays, classification of EBN is usually based on the original place they are built (Goh et al.,
2001). There are two main types of EBN which are House nest (Figure 2.2) and Cave nest
(Figure 2.3). The House nest refers to nests that are built in wooden-roofed swallow farmhouses
which are humid and dark. The interior temperature (28°C - 30°C), brightness and relative
humidity (90%) are relatively suits to the bird’s natural cave habitat. The swiftlet leaves the
farmhouse to find food in the wild in the morning and returns in the evening. House nest consists
of extremely less impurities and feathers since it farmhouse provides a better habitat. One of the
characteristic of house nest is cleaner. House nest looks like a spoon and have a high swelling
capacity. Besides, the House nest consists of three different colors which are white, yellow and
bloody-red nests. The white nests are smooth contrast to yellow and bloody-red nests that are
crunchier due to existences of high amount of minerals. The nest that was constructed in caves
and on cliffs is known as cave nest. It is firm, hard and deep in color due to owing to the harsh
natural climate and environment. It is not as well shaped as the house nest and exhibits higher
impurities. The cave nest is crunchy with low abilities to swell that extends the time for it to
swell when preparing, (Sam et al., 1991).
Figure 2-2: House nest of Edible bird’s nest (EBN)
8
Figure 2-3: Cave nest of Edible bird’s nest (EBN)
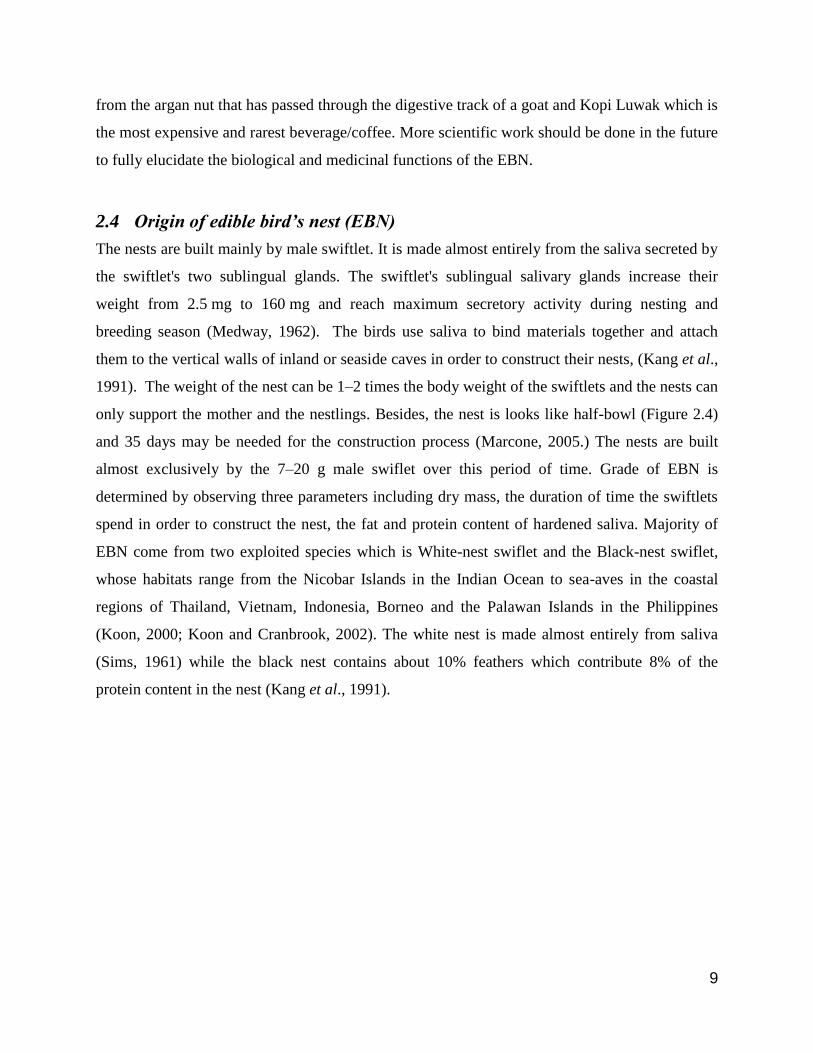
2.3 Nutritional value of edible bird’s nest (EBN)
Due to the highly evaluated function both nutritiously (water-soluble protein, carbohydrate, iron,
inorganic salt and fibre) and medically (anti-aging, anti-cancer, immunity-enhancing, etc), EBN
has been esteemed a precious food tonic by Chinese people ever since the Tang dynasty and it
was referred as “Caviar of the East”. There is current scientific study confirmed that EBN has
haemagglutination inhibiting activity against the influenza virus (Howe, 1961; Howe, Lee, and
Rose, 1960). An update discovery demonstrated that partially purified swiftlet nest extracts
possess the first known avian epidermal growth factor (EGF) (Kong et al., 1987; Ng, Chan, and
Kong, 1986). Nowadays, EBN was developed into various food products including drink, food
additive, and even cosmetic ingredient with the help of modern commercialization and
technology. It was also found that both nests share a common 77 KDa protein that has properties
similar to those of the ovotransferrin protein in eggs. This protein may responsible for the severe
allergic reactions that sometimes occur among young children who consume EBN products
(Marcone, 2005). EBN is not the only commercially available food product highly esteemed or
priced for human consumption processed through an animal but also includes argan oil made
9
from the argan nut that has passed through the digestive track of a goat and Kopi Luwak which is
the most expensive and rarest beverage/coffee. More scientific work should be done in the future
to fully elucidate the biological and medicinal functions of the EBN.
2.4 Origin of edible bird’s nest (EBN)
The nests are built mainly by male swiftlet. It is made almost entirely from the saliva secreted by
the swiftlet's two sublingual glands. The swiftlet's sublingual salivary glands increase their
weight from 2.5 mg to 160 mg and reach maximum secretory activity during nesting and
breeding season (Medway, 1962). The birds use saliva to bind materials together and attach
them to the vertical walls of inland or seaside caves in order to construct their nests, (Kang et al.,
1991). The weight of the nest can be 1–2 times the body weight of the swiftlets and the nests can
only support the mother and the nestlings. Besides, the nest is looks like half-bowl (Figure 2.4)
and 35 days may be needed for the construction process (Marcone, 2005.) The nests are built
almost exclusively by the 7–20 g male swiflet over this period of time. Grade of EBN is
determined by observing three parameters including dry mass, the duration of time the swiftlets
spend in order to construct the nest, the fat and protein content of hardened saliva. Majority of
EBN come from two exploited species which is White-nest swiflet and the Black-nest swiflet,
whose habitats range from the Nicobar Islands in the Indian Ocean to sea-aves in the coastal
regions of Thailand, Vietnam, Indonesia, Borneo and the Palawan Islands in the Philippines
(Koon, 2000; Koon and Cranbrook, 2002). The white nest is made almost entirely from saliva
(Sims, 1961) while the black nest contains about 10% feathers which contribute 8% of the
protein content in the nest (Kang et al., 1991).

10
Figure 2-4: Edible bird’s nest (EBN)
2.5 Contents of edible bird’s nest (EBN)
There are some properties of proteins, peptides, amino acids, and nitrogen in the EBN as for
example, the composition of nitrogen consists in the EBN is about 10.29% (Chen et al.,1996
; Wang, 1921). For two types of nests, the white nest and the red blood nest, there is
compositional properties of lipid (0.14 – 1.28%), ash (2.1%), carbohydrate (25.62 - 27.26%) and
protein (62 – 63%)(Marcone, 2005). It has confirmed that EBN contains a higher percentage of
humin nitrogen and cysteine nitrogen than for pure proteins which may be because of the
carbohydrate radical and fine feathers present in the nest (Wang, 1921). It was known that EBN
rich in protein which are composed of 20 amino acids. EBN contains all the essential amino
acids as the most abundant amino acids in the EBN are serine, threonine, aspartic acid, glutamic
acid, proline, and valine (Kathan and Weeks, 1969). While, the white nest, it is rich in two
aromatic amino acids such as phenylalanine and tyrosine (Marcone, 2005).
11
2.6 Market of edible bird’s nest (EBN)
Hong Kong is world’s largest importer and consumer of the processed nests, while North
America being the second largest market (Goh et al., 2001). 17–20 million nests were estimated
are harvested each year with the total weight approximately about 2 metric tonnes (Goh et al.,
2001). Depending upon grade, the EBN retails for anywhere from $2000.00 (for white nests) to
$10,000.00 (for “red blood” nests) Canadian per kilogram (Koon and Cranbrook, 2002)
2.7 Pre-treatment of edible bird’s nest (EBN)
EBN need to be cleaned right after the collection and the procedure is known as pre-treatment. It
is a long and time-consuming process. First of all, the raw EBN is soaked in water for 6 to 48 h
for them to absorb the water and expand. Then, the removal of the feathers is performed in which
the larger feathers are removed by using tweezers while fine feathers are removed with a
floatation technique using vegetable oil as this procedure is depends on the processors. In order
to produce premium grade nests, the long strands of nest cement are carefully been isolated.
Instead of that, the broken strands are meshed and used to constitute the base of the cleaned
nests. The color of processed nests resembles that of the raw nests. Besides that, the processors
do not normally clean the good quality white nests because it's difficult to restore them to their
original shape after they have been soaked in water and for the information, the process may take
a person 8 h to clean about 10 nests (Koon and Cranbrook, 2002; Leh, 2001).
2.8 Swiflet farming in Malaysia
There are fundamental and long-standing industries in Malaysia such as rubber, palm oil, oil and
gas, timber and financial services, but since 5 years ago, swiflet farming industry being new
development in this country. Such good news, due to the industry’s relatively profitable risk-
return profile followed by a continuously growing demand for EBN by wealthy overseas
countries, the swiftlet farming industry has potential to grow into a multi-million ringgit
industry. In order to produce natural and organic health supplement products for local and
overseas consumption, there is also a discernable world-wide trend pursued by international as
well as home grown pharmaceutical and herbal products companies using EBN as base
materials. As the swiftlet farming industry continues to expand and grow, more and more

12
supplies of EBN sourced from purpose-built farms that are constructed specially to house EBN
swiftlets find their way into the supply chain (Hameed, 2007).
After the Asian Economic Crisis (1997-1998), the swiftlet farming industry in Malaysia has
began to gather momentum. At this time, many businesses, excluding larger business
experienced hard times and a great number of them closed down throughout the country. Over
the last 8 years, the swiftlet farming industry in Malaysia has been growing and before 1998, it
has been estimated that there are 900 plus swiftlet farms throughout the country. There are
number of businessmen, landlords and investors has began to realize that the financial viability
of the swiftlet farming industry in Malaysia right after the first generation of swiftlet farms that
are established after 1998 started to produce commercially harvestable quantities of EBN. By the
end of 2006, the estimation of swiftlet farms throughout the country close to 36,000 units, with
an average annualized growth rate of 35% per year (Hameed, 2007).
Nowadays, the business of swiftlet farming essentially involves the conversion of people-centric
buildings into buildings used to house and protect a certain species of swiftlets that can be found
in the South East Asian region as well as the design and construction of purpose-build buildings
for the purposes of accommodating such swiftlet populations as well. Each and every day, a
continuous vocalization of swiftlet chirps and mating sounds are played using speakers and audio
systems installed within such buildings in order to lure the swiftlets that are flying overhead to
fly into the said buildings to mate and make the buildings their new home. There are almost 99%
of all swiftlet farms in Malaysia are geared towards the production of white edible birds’ nests
(Hameed, 2007).
Mostly, secondary and tertiary townships is often being a choice of major swiflet farming areas
due to the abundance of food source is and pollution levels are at their relative minimum. These
secondary and tertiary townships include Kampong Tebing, Kampong Tasoh, Kampong Banat
Bawah, Jampong Bakan, Kuala Nerang, Pokok Sena, Kampong Tanjung Radin, Kuala Ketil,
Lunas, Kulim, Sungai Petani, Jitra, Bukit Mertajam, Nibong Tebal, Kepala Batas, Cangkat
Kledang, Legong, Jelai, Cangkat Jering, Bruas, Pantai Remis, Lumut, Teluk Intan, Setiawan,
Bagan Serai, Parit Buntar, Selama, Tanjung Malim, Kuala Kubu Bahru, Rawang, Kepong,
Cheras, Slim River, Kulai, Kanpong Bahru Paroi, Alor Gajah, Ayer Pasir, Durian Tunggal,
13
Tangkok, Pagoh, Bukit Pasir, Kampong Machap, Ulu Tiram, Tai Hong Village, Senai, Pontian
Kecil, Jemaluang, Kampong Seri Pantai, Mersing, Kampong Sawah Datuk, Kampong Air Papan,
Kuala Besut, Tok Soboh, Kampong Pinang, Rompin, Pekan, Kuala Terengganu and Pasir Mas
(Hameed, 2007). In this study, the raw material has been taken from Pekan, Pahang Darul
Makmur.
Currently, behind Indonesia (60%) and Thailand (20%), the third largest producer of EBN (7%
of gross supply value) in the world is comes from Malaysia. In 2006, about 90 to 120 of
unprocessed white EBN is able to fetch production level prices of RM$4500 to RM$6000. A
kilogram of processed white EBN is able to fetch retail level prices of RM$15000 to RM$25000
in Hong Kong and China (Hameed, 2007).
Hong Kong (50% of world trade), China (8%), Taiwan (4%) and Macau (3%) has been
categories as the main export markets for EBN with a consumption weight value of
approximately 160 tons for 2006. The total consumption value of EBN was estimated to be in the
range of RM8 billion to RM12 billion. In 2004, Ministry of Housing and Local Government with
the gazzetting of the "Guidelines on Swiftlet Farming" recognized the swiftlet farming industry
in Malaysia as a valid contributor of important foreign exchange currency for the country
(Hameed, 2007).
The Guidelines require registered premises with relevant council that have not been designated
as a Class 1 Heritage Building converted into a swiftlet farm. The Guidelines also require that
certain standards and levels of premises upkeep must be adhered to in areas of noise, health,
pollution, scope of renovation works, building façade rendition and lighting be adhered to before
swiftlet farming licenses can be issued by the relevant council (Hameed, 2007).
A swiftlet farm can yield returns that are competitive with other types of profitable industries if it
been constructed properly. There are many swiftlet farms throughout the country yield 1kg to
10kgs (RM4000 to RM40000) of collected white EBN per month based on perceptive and
cognitive observations. On average, an average yield of around 1kgs to 3kgs (i.e. RM4000 to
RM12000) of collected white EBN per month can be obtained from a 2 storey swiftlet farm that
had been properly converted from a conventional shop-lot or shop-house in Malaysia (Hameed,
2007).

14
2.9 Protein
The bioactive components contains in the EBN (protein) need to be isolated and purified as it
consists of many functions that benefits human being. Protein acts as an essential nutrient for
human body which is not only as an energy source but also as a building agent. Protein is used to
build and maintain body tissues, produce neurotransmitter for brain, produce amino acids and
hormones, maintain immunity system and also maintain acid-base balance in cell fluid. Apart
from that, protein also functioned well in body growth. In addition, protein also plays important
roles in phenomena such as signal transduction, gene expression, metabolism, cellular and
extracellular structures, etc. Denise et al., (2001) revealed that promotion of cell division and
epidermal growth-factor like proteins are capable in the presence of protein. Many proteins are
also useful for therapeutic or diagnostic applications. Besides, any property on which the utility
of food proteins depends on the food ingredients (Cepeda et al., 1998). Many reasons food
proteins are hydrolyzed such as for the improvement of nutritional and functional properties,
texture characteristics to the removal of odour, flavour, and toxic or anti-nutritive components. In
hydrolysis treatments, general proteins had used are casein, whey and soy protein (Periago et al.,
1998). Therefore, it is still necessary to prepare the protein of interest in a pure form without
contaminants that may potentially put a human being’s health at risk. Separation and purification
of proteins constitute a major bottleneck of modern process biotechnology.
2.10 Source of protein
Commercially available protein foods are obtained from a range of animal and plant sources and
are used as functional ingredients (Periago et al., 1998). Due to the increasing costs and limited
supplies of animal proteins, and since vegetable protein is the most abundant source of protein on
the Earth, a number of vegetable proteins have been investigated for possible incorporation into
formulated foods (Achouri et al., 1999; Sathe and Sze-Tao 2000). The examples of vegetables
protein are alfalfa leaf, cottonseed, winged bean, peanut and soya.