EFFECT OF EXPOSURE TIME, BACTERIA CONCENTRATION AND ...umpir.ump.edu.my/9209/1/cd8610.pdf · untuk...
24
EFFECT OF EXPOSURE TIME, BACTERIA CONCENTRATION AND CULTURE AGE OF ESCHERICHIA COLI AND BACILLUS SUBTILIS ON THE GLASS SURFACE NASUHA BINTI IBRAHIM Thesis submitted in partial fulfilment of the requirements for the award of the degree of Bachelor of Chemical Engineering (Biotechnology) Faculty of Chemical & Natural Resources Engineering UNIVERSITI MALAYSIA PAHANG JANUARY 2014 ©NASUHA BINTI IBRAHIM (2014)
Transcript of EFFECT OF EXPOSURE TIME, BACTERIA CONCENTRATION AND ...umpir.ump.edu.my/9209/1/cd8610.pdf · untuk...

EFFECT OF EXPOSURE TIME, BACTERIA
CONCENTRATION AND CULTURE AGE OF ESCHERICHIA
COLI AND BACILLUS SUBTILIS ON THE GLASS SURFACE
NASUHA BINTI IBRAHIM
Thesis submitted in partial fulfilment of the requirements
for the award of the degree of
Bachelor of Chemical Engineering (Biotechnology)
Faculty of Chemical & Natural Resources Engineering
UNIVERSITI MALAYSIA PAHANG
JANUARY 2014
©NASUHA BINTI IBRAHIM (2014)

v
ABSTRACT
This thesis presents the effect of the bacterial adhesion on the glass surface
(hydrophilic surfaces) at different time exposure and bacterial concentration. The ability of
Escherichia coli and Bacillus subtilis to attach to the surfaces depends mainly on the
interaction of hydrophobic domains. However, E. coli and B. subtilis have evolved in
different ways in order to manipulate the hydrophobic effect for their adherence on the
solid surface. On the other hand, the surface properties e.g surface charges are inherently
important and often regulate the mechanism of the bacteria adhesion. Besides that,
adhesions of bacteria were also affected by culture media, exposure time of bacteria on
glass surface, age and bacterial concentration. Both bacteria have different surface
characteristic which also affect adhesion on the glass surface. Both bacteria were
suspended in the phosphate buffer solution (pH 7.1) at different cell concentration (abs).
The solution was suspended into glass container containing glass slide. The glass-bacterial
solution was shake at 100 rpm and 30⁰C in the incubator shaker and sampling were done at
4 h, 8 h, 12 h and 24 h. From the researches that have been done B. subtilis easily adhere on
the glass surface compared to E. coli, with 46.9% reduction in optical density reading
observed at 600nm. Bacillus subtilis was exposed for 24 hour at cell concentration 0.8 abs.
Meanwhile, E. coli result in less adhesion to the glass surface with only 29.8 % reduction in
optical density. Yet, the time of exposure for E. coli was only 12 hour with cell
concentration 1.0 abs.

vi
ABSTRAK
Tesis ini membentangkan kesan lekatan bakteria pada permukaan kaca ( permukaan
hidrofilik ) pada pendedahan masa yang berbeza dan kepekatan bakteria yang berbeza.
Keupayaan Escherichia coli dan Bacillus subtilis untuk melekat pada permukaan
bergantung terutamanya kepada interaksi domain hidrofobik. Walau bagaimanapun , E. coli
dan B. subtilis berinteraksi dengan cara yang berbeza untuk memanipulasi kesan hidrofobik
untuk pelekatan mereka di permukaan pepejal. Sebaliknya, sifat-sifat permukaan seperti caj
permukaan sememangnya penting dan sering mengawal mekanisme lekatan bakteria . Di
samping itu, pelekatan bakteria turut terjejas olehfaktor sekeliling, masa dedahan bakteria
pada permukaan kaca , umur dan kepekatan bakteria. Kedua-dua bakteria tersebut
mempunyai ciri permukaan yang berbeza yang juga mempengaruhi lekatan pada
permukaan kaca. Kedua-dua bakteria dimasukkan dalam penyelesaian penimbal fosfat (pH
7.1) pada kepekatan sel yang berbeza ( abs ). Bakteria yang dicampur dengan Phosphate
buffer solution (PBS) telah dimasukkan ke dalam bekas kaca yang mengandungi kepingan
kaca. Kepingan kaca-bakteria digoncang pada 100 rpm dan 30 ⁰ C dalam penggoncang
inkubator dan pemerhatian pelekatan bakteria pada kepingan kaca dilakukan pada jam ke-4
, ke-8, ke-12 dan ke-24 . Dari kajian yang telah dilakukan B. subtilis lebih mudah melekat
pada permukaan kaca berbanding dengan E. coli, dengan pengurangan 46.9 % dalam
membaca ketumpatan optik diperhatikan pada 600nm . B. subtilis telah didedahkan selama
24 jam di kepekatan sel 0.8 abs. Sementara itu , E. coli kurang lekatan ke permukaan kaca
dengan pengurangan hanya 29.8 % dalam ketumpatan optik. Namun , masa pendedahan
bagi E. coli adalah hanya 12 jam dengan kepekatan sel 1.0 abs.

vii
TABLE OF CONTENT
SUPERVISOR’S DECLARATION ........................................................................................ i
STUDENT’S DECLARATION ............................................................................................. ii
Dedication ............................................................................................................................. iii
ACKNOWLEDGEMENT ..................................................................................................... iv
ABSTRACT ........................................................................................................................... v
ABSTRAK ............................................................................................................................ vi
LIST OF FIGURES ........................................................................................................... ix
LIST OF TABLES ............................................................................................................ ix
LIST OF ABBREVIATION .............................................................................................. x
1 INTRODUCTION ................................................................................................... 1
1.1 Motivation and problem statement 1
1.2 Objective 3
1.3 Scope 3
2 LITERATURE REVIEW ............................................................................................... 4
2.1 Microorganism ........................................................................................................ 4
2.1.1 Escherichia coli 4
2.1.2 Bacillus subtilis 4
2.2 Growth curve ........................................................................................................... 5
2.2.1 Lag Phase 5
2.2.2 Exponential phase 6
2.2.3 Stationary phase 7
2.2.5 Death phase 8
2.3 Mechanism of bacterial adhesion and development ................................................ 8
2.3.1 The conditioning layer 10
2.3.2 Cell–cell communication 10
2.3.3 Population growth 11
2.3.4 Final stages of biofilm development 12
2.4 Microbial Cell Surface Architecture ...................................................................... 12
2.4.1 Gram-positive Bacteria 13
2.4.2 Gram-negative Bacteria 13
2.5 Environmental factors influencing biofilm development ...................................... 14
2.5.1 Effect of temperature 14
2.6 Bacterial adhesion to surfaces ............................................................................... 15
2.6.1 The influence of surface roughness. 15
2.6.2 Specialized attachment structures/surface properties of the cell 16

viii
2.6.3 Electrostatic, Hydrophobic and Bridging Effects of Cell Surface Components
16
2.7 Measurement of microbial growth ............................................................................ 18
2.7.1 Measurement of cell mass 18
2.7.3 Measurement of cell numbers 20
2.8 Bacteria characterization ....................................................................................... 21
2.8.1 The Gram Staining 21
2.8.2 Fundamental Principles of Scanning Electron Microscopy (SEM) 22
2.9 Cells Surface Hydrophobicity/Microbial Adhesion to Solvents (CHS/MATs) ... 23
3 METHODOLOGY ................................................................................................ 24
3.1 Preparation of Culture Medium 24
3.1.1 Preparation of nutrient broth 24
3.1.2 Preparation of nutrient agar 24
3.1.3 Preparation of agar plates 24
3.1.4 Preparation of agar slants 24
3.1.5 Stock culture preparation 24
3.1.6 Working culture (inoculums preparation) 25
3.2 Phosphate Buffer Saline (PBS) preparation 25
3.3 Growth curve and Colony Forming Unit (CFU) preparation 25
3.3.1 Growth curve 25
3.3.2 Colony forming unit (CFU) 26
3.4 Bacteria characterization 26
3.4.1 Determination of bacteria size under light microscope 26
3.4.2 Determination of the cell surface using Scanning Electron Microscope (
SEM) 26
3.5 Cell Surface Hydrophobicity/Microbial Adhesion to Solvent (CSH-MATs) 27
3.6 Bacteria adhesion on glass through the exposure time and cell concentration
27
3.7 Bacteria adhesion on glass through the effect of culture age. 28
4 RESULT AND DISCUSSION .............................................................................. 29
4.1 Bacteria’s Characteristics 29
4.1.1 Gram staining 29
4.1.2 Observation under Scanning Electron Microscope 31
4.1.3 Cells Surface Hydrophobicity/Microbial Adhesion to Solvents (CHS/MATs)
32

ix
4.2 Growth curve of Escherichia coli and Bacillus subtilis 35
4.3 Colony Forming Unit (CFU) 37
4.5 Effect of exposure time and cell concentration on bacteria adhesion 42
4.6 Effect of culture age 46
5 CONCLUSION ......................................................................................................... 48
6 RECOMMENDATION ............................................................................................. 49
7.0 REFERENCES ...................................................................................................... 50
LIST OF FIGURES
Figure 4. 1: (a) B. subtilis at exponential phase; (b) E. coli at exponential phase ; ............. 30
Figure 4. 2: (a) B.subtilis (b) E.coli at exponential phase observed under Scanning Electron
Microscope (SEM) ............................................................................................................... 31
Figure 4. 3: (a) E.coli suspension into dodecane (b) B.subtilis suspension into dodecane at
.............................................................................................................................................. 34
Figure 4. 4: (a) E.coli suspension into ethyl acetate (b) B.subtilis suspension into ethyl
acetate at 66 hour fermentation ............................................................................................ 34
Figure 4. 5: Graph of E. coli and B. subtilis growth at 37oC and 180 rpm for 24 hours. .... 36
Figure 4. 6: Growth curve based on optical density (abs) for B. subtilis and E. coli in 24
hour of fermentation ............................................................................................................. 38
Figure 4. 7: Growth curve based on CFU for B. subtilis and E. coli in 24 hour of
fermentation .......................................................................................................................... 38
LIST OF TABLES
Table 4. 1: Size of bacteria at exponential and death phase .......................................... 30
Table 4. 2: Optical density of bacteria suspension into hydrocarbon .............................. 33
Table 4. 3: Summarized characteristics ...................................................................... 35
Table 4. 4: Colony of B. subtilis count for 24 hour fermentation ................................... 39
Table 4. 5: Colony of E. coli count for 24 hour fermentation ........................................ 39
Table 4. 6 :Adhesion of B.subtilis on glass slide suspended in PBS solution with optical
density 1.0 (abs) ...................................................................................................... 43
Table 4. 7: Adhesion of E.coli on glass slide suspended in PBS solution with optical
density 1.0 (abs) ...................................................................................................... 43

x
Table 4. 8: Adhesion test of E .coli and B. subtilis on glass surface at different cell
concentration. ......................................................................................................... 44
Table 4. 9: Cell adhesion to glass at exponential phase and stationary phase .................. 47
LIST OF ABBREVIATION
E. coli Escherichia coli
B. subtilis Bacillus subtilis
OD Optical Density
Abs Absorbance
PBS Phosphate Buffer solution
T0 Time at 0th
hour
T4 Time at 4th
hour
T8 Time at 8th
hour
T18 Time at 18th
hour
T24 Time at 24th
hour

1
1 INTRODUCTION
1.1 Motivation and problem statement
A fundamental question often asked ‘why do microorganisms stick to a
surface?’ The prime directive of microorganism is to reproduce and to do so they must
assimilate nutrient in sufficient amount to ensure that the process is successful. Almost all
biological processes require an aqueous environment including the transport of nutrient into
the microbial cell. Bacteria adhesion is the initial step of colonization and formation of
biofilm. It causes an accumulated biomass of microorganism and extracellular material on
certain area of the solid surfaces, where it depend on a number of microbiological,
physical, chemical and material-related parameters. The ability to stick onto a surface
would immediately provide several advantages to ensure reproduction in a nutrient limiting
environment. Microbial adhesion is not limited to hard, intimate surfaces, but applicable
even to soft tissues. For instance, human skin intestinal and pulmonary lining and urinary
tract are all colonizable by microorganism which may result in pathologies
Over the past few decades, biofilm formation has been observed in many industrial and
domestic domains. Unfortunately, in most cases the growth of biofilms has been
detrimental, where many industries suffers the ill-effects of biofilm growth which result in
heavy costs in cleaning and maintenance. Industries such as maritime, dairy (Yoo, 2002),
food (Ganesh. 1998), water systems (Bott, 1998), oil (Nemati, 2001), paper (Klahre, 2000),
opticians (Liesegang, 1997), dentistry (Marotta, 2002) and hospitals ( Halabi, 2001) which
often involved billions of dollars for cleaning and maintenance services . Perhaps the
environment where people are exposed to biofilms most frequently is the domestic
environment (Baker, 2000). Product spoilage, reduced production efficiency, corrosion,
unpleasant odours (malodours), unsightliness, infection, pipe blockages and equipment
failure are examples of the detrimental effects of biofilms. For these reasons and the
emergence of restrictive legislation regarding the effects of cleaning agents on the
environment and to user health and safety (Commission Regulation EC No. 1048/ 2005),
2
there is a lot of industrial interest in developing materials and methods which can remove
and actively prevent the formation of biofilms.
In the UK, it is estimated that 9 million cases of intestinal disease every year, much
of which originates at home, where human excreta are the primary source of infection
(Curtis, 2003). Estimates show that for every case of infectious disease reported to the
Communicable Disease Surveillance Centre (CDSC), 136 unreported cases occur in the
community causing considerable morbidity. In the food industry biofilms cause serious
engineering problems such as impeding the flow of heat across a surface, increases in fluid
frictional resistance of surfaces and increases in the corrosion rate of surfaces leading to
energy and production losses. Pathogenic microflora grown on food surfaces and in
processing environments can cross-contaminate and cause post-processing contamination
(Verran, 2000). If the microorganisms from food-contact surfaces are not completely
removed, they can lead to mature biofilm formation and so increase the biotransfer
potential. Examples of the food sectors that pay particular attention to the possibility of
cross-contamination are the milk industry (Chye, 2004) and the slaughter industry.
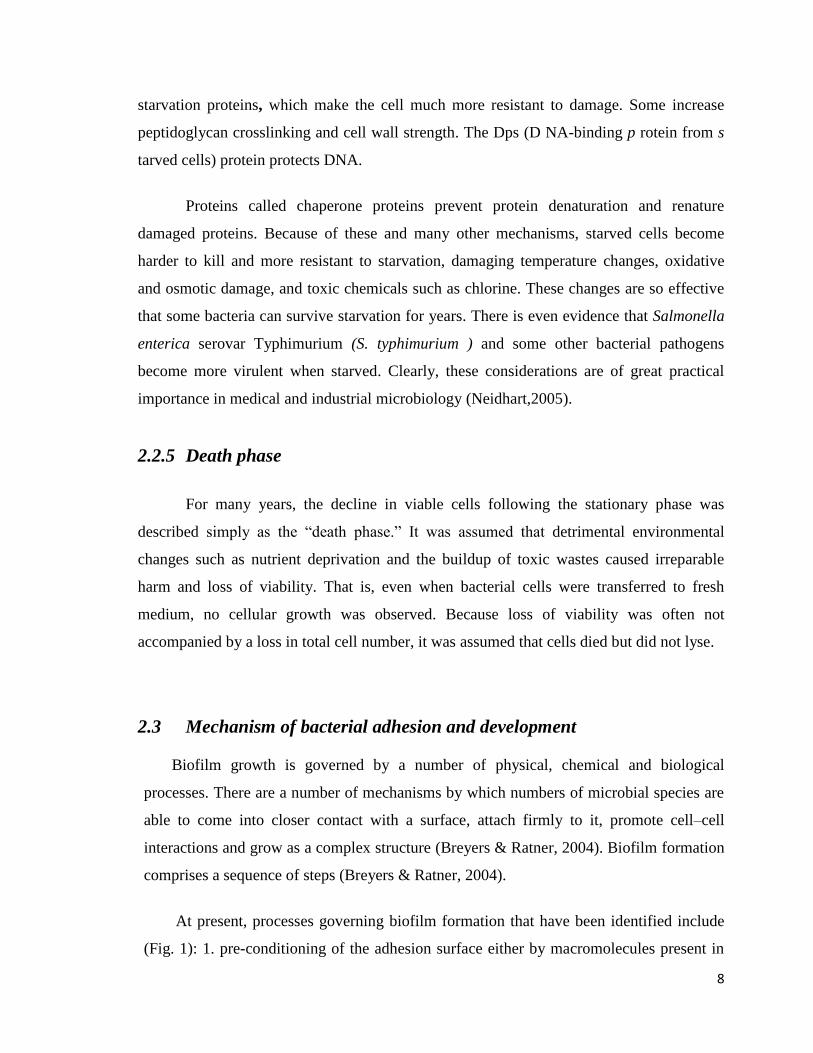
Virulence and pathogenicity of microorganisms is often enhanced when growing as
a biofilm, and new strategies are therefore required to control biofilm formation and
development. Many pathogenic microorganisms reside within biofilms, which biofilms
cause additional problems when designing new anti-microbial agents. Novel strategies are
necessary because of the limitations to these current treatments such as inadequate control
supply, potential for disease transfer and compliance issue. The capability and high
resistance of sessile microorganisms to inhibitors, eradication of biofilm often requires high
concentration of disinfectants or antibiotics, causing severe environmental damages, multi-
resistance emergence and nosocomial infections. Public health concerns, as well the
economic loss associated to biofilm formation raise an urgent need for developing biofilm
resistant systems.
The adhesion of bacteria on the solid surfaces have causes a lot of problems. Indeed
the adhesive characteristics of natural human flora are now considered as a tool for
preventing the adhesion of pathogenic bacteria to avert infection. To eliminate this

3
problem, studies on developing the anti-adhesive surfaces, incorporation of anti bacteria
agent into medical device polymer, mechanical design alternative and produce antibiotic
had bloomed significantly (Geesey, 2001; von Eiff et al., 2002; Vincent, 2003; Lejeune,
2003). The attachment of microorganisms to surfaces and the subsequent biofilm
development are very complex processes, affected by several variables such as surface
roughness, chemical stability, hydrophobicity and surface charge (Donlan, 2002). In
general, attachment will occur most readily on surfaces that are rougher, more
hydrophobic, and coated by surface conditioning films (Martial, & Degraeve, 2008,
Simo˜es, 2008). Properties of the cell surface, particularly the presence of extracellular
appendages, the interactions involved in cell–cell communication and EPS production are
important for biofilm formation and development (Parsek & Greenberg, 2005). An increase
in flow velocity or nutrient concentration may also equate to increased attachment, if these
factors do not exceed critical levels (Simo˜es, Sillankorva, et al., 2007).
1.2 Objective
In order to manipulate the occurrence of bacteria adhesion and biofilm formation, it
is of important to study the factors that contribute to the bacteria adhesion on the solid
surfaces. To study the factors that facilitates the adhesion of bacteria (Escherichia coli and
Bacillus subtilis) on the glass surface (hydrophilic surfaces).
1.3 Scope
The scope have been drawn where bacteria characterization is characterized based
on the types, morphology, size and shape. Besides that, the physical effects on bacteria
adhesion; exposure time (4, 8, 12 and 24), bacterial concentration (0.8, 1.0 and 1.2) abs and
culture age (16 and 66 hour).

4
2 LITERATURE REVIEW
2.1 Microorganism
2.1.1 Escherichia coli
Escherichia coli is a gram negative procaryote, non-spore forming rod. It may or may
not be mobile. (Some rods are flagellated and some are not.) The organism is a facultative
anaerobe and the optimal temperature for growth is at 37oC. The optimum pH for growth is
6.0 to 8.0. However, growth can occur as low as pH 4.3 and as high as pH 9 to 10. E. coli is
prokaryotic and capable of aerobic and anaerobic metabolism. E. coli is a heterotrophic
organism, meaning that it obtains its food from a different source. This source is most
often its host organism. They obtain carbon via biosynthesis of organic molecules that
were ingested by their host. Carbon is very important to E. coli because the bacterial cell
composed almost entirely of carbon molecules bound to other important elements. In
response to changes in the temperature or the osmolarity of the environment, E. coli utilizes
its ability to physically change the diameter of the porins found on the cell membrane. If
there are larger nutrient molecules present, E. coli will enlarge in porin diameter of to allow
the molecule to enter the organism. This also works in reverse in that if there are inhibitory
molecules present, E. coli will decrease the diameter of the porins (Hu Amanda, 2002).
2.1.2 Bacillus subtilis
Bacillus subtilis cells are rod-shaped, gram-positive bacteria that are naturally found in
soil and vegetation. B. subtilis grows best in the mesophilic temperature range where the
optimal temperature is 25 to 35oC (Stephen, 1998). Stress and starvation are common in
this environment; therefore, B. subtilis has evolved a set of strategies that allow survival
under these harsh conditions. For example, is the formation of stress-resistant endospores.
Besides that, the other strategy is the uptake of external DNA, which allows the bacteria to
adapt by recombination. However, these strategies are time-consuming. B. subtilis can also
gain protection more quickly against many stress situations such as acidic, alkaline,

5
osmotic, or oxidative conditions, and heat or ethanol (Bandow, 2002). B. subtilis use their
flagella for a swarming motility. This motility occurs on surfaces, for example on agar
plates, rather than in liquids. B. subtilis are arranged in singles or chains. Cells arranged
next to each other can only swarm together, not individually. These arrangements of cells
are called 'rafts'. In order for B. subtilis to swarm, they need to secrete a slime layer which
includes surfactin, a surface tension-reducing lipopeptide, as one of its components
(Schaechter 2006).
2.2 Growth curve
Binary fission and other cell division processes bring about an increase in the
number of cells in a population. Population growth is studied by analyzing the growth
curve of a microbial culture. When microorganisms are cultivated in liquid medium, they
usually are grown in a batch culture that is, they are incubated in a closed culture vessel
with a single batch of medium. Because no fresh medium is provided during incubation,
nutrient concentrations decline and concentrations of wastes increase. The growth of
microorganisms reproducing by binary fission can be plotted as the logarithm of the
number of viable cells versus the incubation time (Ingraham,2001).
2.2.1 Lag Phase
When microorganisms are introduced into fresh culture medium, usually no
immediate increase in cell number occurs. This period is called the lag phase. However,
cells in the culture are synthesizing new components. A lag phase can be necessary for a
variety of reasons. The cells may be old and depleted of ATP, essential cofactors, and
ribosome; these must be synthesized before growth can begin. The medium may be
different from the one the microorganism was growing in previously. Here new enzymes
would be needed to use different nutrients. Possibly the microorganisms have been injured
and require time to recover. Whatever the causes, eventually the cells begin to replicate
their DNA, increase in mass, and finally divide (Neidhardt, 2005).

6
2.2.2 Exponential phase
During the exponential (log) phase, microorganisms are growing and dividing at the
maximal rate possible given their genetic potential, the nature of the medium, and the
environmental conditions. Their rate of growth is constant during the exponential phase;
that is, they are completing the cell cycle and doubling in number at regular intervals. The
population is most uniform in terms of chemical and physiological properties during this
phase; therefore exponential phase cultures are usually used in biochemical and
physiological studies (Neidhart, 2005).
Exponential (logarithmic) growth is balanced growth. That is, all cellular
constituents are manufactured at constant rates relative to each other. If nutrient levels or
other environmental conditions change, unbalanced growth results. During unbalanced
growth, the rates of synthesis of cell components vary relative to one another until a new
balanced state is reached. Unbalanced growth is readily observed in two types of
experiments: shift-up, where a culture is transferred from a nutritionally poor medium to a
richer one; and shift-down, where a culture is transferred from a rich medium to a poor one.
In a shift-up experiment, there is a lag while the cells first construct new ribosome to
enhance their capacity for protein synthesis. In a shift-down experiment, there is a lag in
growth because cells need time to make the enzymes required for the biosynthesis of
unavailable nutrients. Once the cells are able to grow again, balanced growth is resumed
and the culture enters the exponential phase. These shift-up and shift-down experiments
demonstrate that microbial growth is under precise, coordinated control and responds
quickly to changes in environmental conditions( Maloe,2005).
When microbial growth is limited by the low concentration of a required nutrient,
the final net growth or yield of cells increases with the initial amount of the limiting
nutrient present. The rate of growth also increases with nutrient concentration but in a
hyperbolic manner much like that seen with many enzymes. The shape of the curve seems
to reflect the rate of nutrient uptake by microbial transport proteins. At sufficiently high
nutrient levels, the transport systems are saturated, and the growth rate does not rise further
with increasing nutrient concentration (Maloe, 2005).

7
2.2.3 Stationary phase
In a closed system such as a batch culture, population growth eventually ceases and
the growth curve becomes horizontal. This stationary phase usually is attained by bacteria
at a population level of around 109 cells per ml. Other microorganisms normally do not
reach such high population densities. For instance, protist cultures often have maximum
concentrations of about 106 cells per ml. Final population size depends on nutrient
availability and other factors, as well as the type of microorganism being cultured. In the
stationary phase, the total number of viable microorganisms remains constant. This may
result from a balance between cell division and cell death, or the population may simply
cease to divide but remain metabolically active (Ingraham,2005).
Microbial populations enter the stationary phase for several reasons. One obvious
factor is nutrient limitation; if an essential nutrient is severely depleted, population growth
will slow. Aerobic organisms often are limited by O2 availability. Oxygen is not very
soluble and may be depleted so quickly that only the surface of a culture will have an O2
concentration adequate for growth. The cells beneath the surface will not be able to grow
unless the culture is shaken or aerated in another way. Population growth also may cease
due to the accumulation of toxic waste products. This factor seems to limit the growth of
many anaerobic cultures (cultures growing in the absence of O2). For example, streptococci
can produce so much lactic acid and other organic acids from sugar fermentation that their
medium becomes acidic and growth is inhibited. Finally, some evidence exists that growth
may cease when a critical population level is reached. Thus entrance into the stationary
phase may result from several factors operating in concert (Neidhart,2005).
As we have seen, bacteria in a batch culture may enter stationary phase in response
to starvation. This probably occurs often in nature because many environments have low
nutrient levels. Procaryotes have evolved a number of strategies to survive starvation.
Some bacteria respond with obvious morphological changes such as endospore formation,
but many only decrease somewhat in overall size. This is often accompanied by protoplast
shrinkage and nucleoid condensation. The more important changes during starvation are in
gene expression and physiology. Starving bacteria frequently produce a variety of
8
starvation proteins, which make the cell much more resistant to damage. Some increase
peptidoglycan crosslinking and cell wall strength. The Dps (D NA-binding p rotein from s
tarved cells) protein protects DNA.
Proteins called chaperone proteins prevent protein denaturation and renature
damaged proteins. Because of these and many other mechanisms, starved cells become
harder to kill and more resistant to starvation, damaging temperature changes, oxidative
and osmotic damage, and toxic chemicals such as chlorine. These changes are so effective
that some bacteria can survive starvation for years. There is even evidence that Salmonella
enterica serovar Typhimurium (S. typhimurium ) and some other bacterial pathogens
become more virulent when starved. Clearly, these considerations are of great practical
importance in medical and industrial microbiology (Neidhart,2005).
2.2.5 Death phase
For many years, the decline in viable cells following the stationary phase was
described simply as the “death phase.” It was assumed that detrimental environmental
changes such as nutrient deprivation and the buildup of toxic wastes caused irreparable
harm and loss of viability. That is, even when bacterial cells were transferred to fresh
medium, no cellular growth was observed. Because loss of viability was often not
accompanied by a loss in total cell number, it was assumed that cells died but did not lyse.
2.3 Mechanism of bacterial adhesion and development
Biofilm growth is governed by a number of physical, chemical and biological
processes. There are a number of mechanisms by which numbers of microbial species are
able to come into closer contact with a surface, attach firmly to it, promote cell–cell
interactions and grow as a complex structure (Breyers & Ratner, 2004). Biofilm formation
comprises a sequence of steps (Breyers & Ratner, 2004).
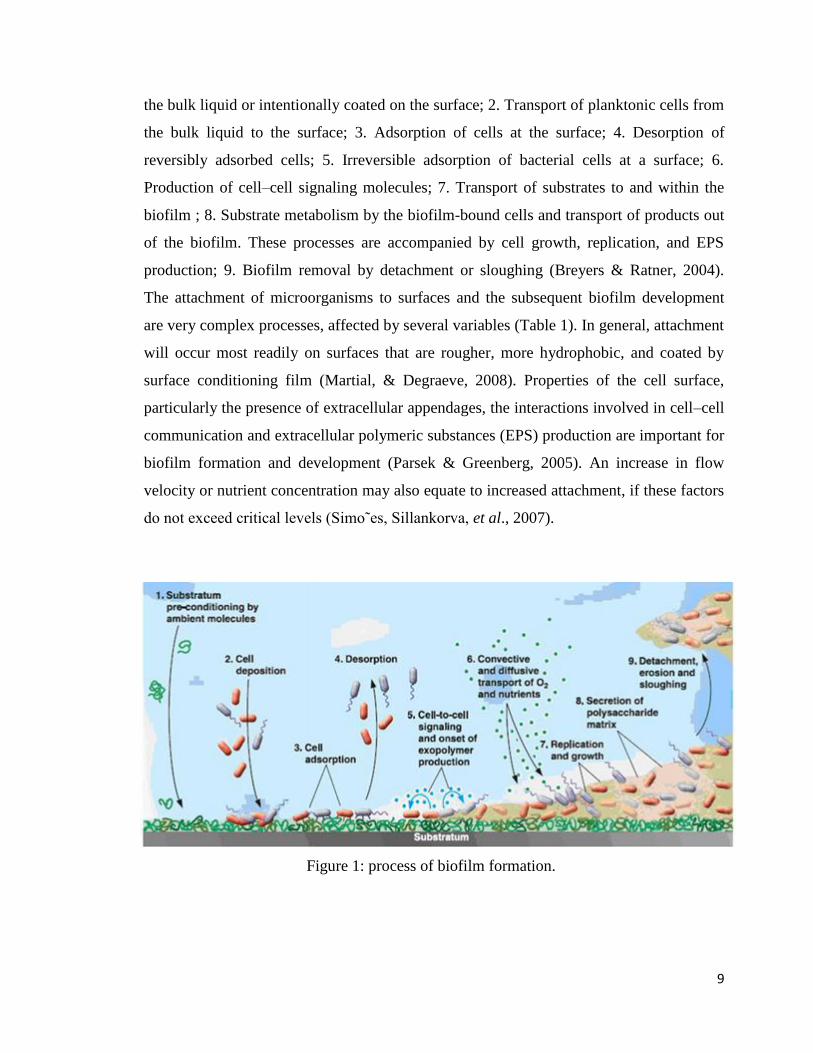
At present, processes governing biofilm formation that have been identified include
(Fig. 1): 1. pre-conditioning of the adhesion surface either by macromolecules present in
9
the bulk liquid or intentionally coated on the surface; 2. Transport of planktonic cells from
the bulk liquid to the surface; 3. Adsorption of cells at the surface; 4. Desorption of
reversibly adsorbed cells; 5. Irreversible adsorption of bacterial cells at a surface; 6.
Production of cell–cell signaling molecules; 7. Transport of substrates to and within the
biofilm ; 8. Substrate metabolism by the biofilm-bound cells and transport of products out
of the biofilm. These processes are accompanied by cell growth, replication, and EPS
production; 9. Biofilm removal by detachment or sloughing (Breyers & Ratner, 2004).
The attachment of microorganisms to surfaces and the subsequent biofilm development
are very complex processes, affected by several variables (Table 1). In general, attachment
will occur most readily on surfaces that are rougher, more hydrophobic, and coated by
surface conditioning film (Martial, & Degraeve, 2008). Properties of the cell surface,
particularly the presence of extracellular appendages, the interactions involved in cell–cell
communication and extracellular polymeric substances (EPS) production are important for
biofilm formation and development (Parsek & Greenberg, 2005). An increase in flow
velocity or nutrient concentration may also equate to increased attachment, if these factors
do not exceed critical levels (Simo˜es, Sillankorva, et al., 2007).
Figure 1: process of biofilm formation.
10
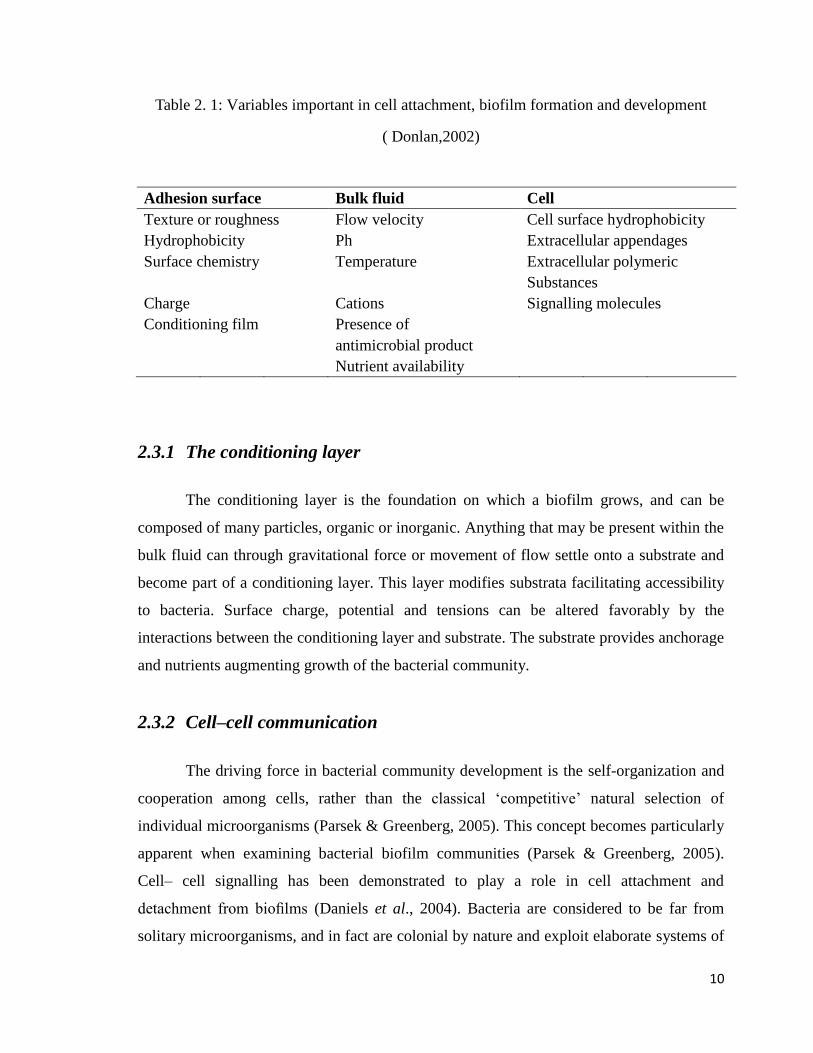
Table 2. 1: Variables important in cell attachment, biofilm formation and development
( Donlan,2002)
Adhesion surface Bulk fluid Cell
Texture or roughness Flow velocity Cell surface hydrophobicity
Hydrophobicity Ph Extracellular appendages
Surface chemistry Temperature Extracellular polymeric
Substances
Charge Cations Signalling molecules
Conditioning film Presence of
antimicrobial product
Nutrient availability
2.3.1 The conditioning layer
The conditioning layer is the foundation on which a biofilm grows, and can be
composed of many particles, organic or inorganic. Anything that may be present within the
bulk fluid can through gravitational force or movement of flow settle onto a substrate and
become part of a conditioning layer. This layer modifies substrata facilitating accessibility
to bacteria. Surface charge, potential and tensions can be altered favorably by the
interactions between the conditioning layer and substrate. The substrate provides anchorage
and nutrients augmenting growth of the bacterial community.
2.3.2 Cell–cell communication
The driving force in bacterial community development is the self-organization and
cooperation among cells, rather than the classical ‘competitive’ natural selection of
individual microorganisms (Parsek & Greenberg, 2005). This concept becomes particularly
apparent when examining bacterial biofilm communities (Parsek & Greenberg, 2005).
Cell– cell signalling has been demonstrated to play a role in cell attachment and
detachment from biofilms (Daniels et al., 2004). Bacteria are considered to be far from
solitary microorganisms, and in fact are colonial by nature and exploit elaborate systems of

11
intercellular interactions and communications to facilitate their adaptation to changing
environments (Fuqua & Greenberg, 2002). The successful adaptation of bacteria to
changing natural conditions is dependent on their ability to sense and respond to the
external environment and modulate gene expression accordingly (Daniels et al., 2004).
Quorum sensing is based on the process of auto induction (Eberhard et al., 1981).
The process of quorum sensing provides a mechanism for self-organization and regulation
of microbial cells (Parsek & Greenberg, 2005). It involves an environmental sensing
system that allows bacteria to monitor and respond to their own population densities. The
bacteria produce a diffusible organic signal, originally called an auto-inducer (AI)
molecule, which accumulates in the surrounding environment during growth (Fuqua &
Greenberg, 2002). Besides that, high cell densities result in high concentrations of signal,
and induce expression of certain genes or physiological changes in neighboring cells
(Parsek & Greenberg, 2005). A response to chemical signals in the process of cell
communication is a concentration dependent process, where a critical threshold
concentration of the signal molecule must be reached before a physiological response is
elicited (Fuqua & Greenberg, 2002). Oligopeptides and N-acylhomoserine lactones (AHL)
are major auto inducer (AI) molecules involved in intra-specific communication in Gram-
positive and Gram-negative bacteria, respectively whereas boronated diester molecules
(AI-2) are involved in inter-specific communication among both Gram-positive and Gram-
negative bacteria (Parsek & Greenberg, 2005). Oligopeptides and N-acylhomoserine
lactones (AHL) are the best characterized molecules (Ryan & Dow, 2008).
2.3.3 Population growth
As the stationary cells divide (binary division), daughter cells spread outward and
upward from the attachment point to form clusters (Hall, 2002). Typically, such
interactions and growth within the developing biofilm form into a mushroom-like structure.
The mushroom structure is believed to allow the passage of nutrients to bacteria deep
within a biofilm. After an initial lag phase, a rapid increase in population is observed, and
cell growing exponential growth phase. This depends on the nature of the environment,
both physically and chemically. The rapid growth occurs at the expense of the surrounding

12
nutrients from the bulk fluid and the substrate. At this stage the physical and chemical
contribution to the initial attachment ends and the biological processes begin to dominate.
Excretion of polysaccharide intercellular adhesion (PIA) polymers and the presence of
divalent cations interact to form stronger bonding between cells (Dunme, 2002).
2.3.4 Final stages of biofilm development
The stationary phase of growth describes a phase where the rate of cell division
equals the rate of cell death. At high cell concentration, a series of cell signaling
mechanisms are employed by the biofilm, and this is collectively termed quorum sensing (
Bassler, 1999). Quorum sensing describes as a process where a number of auto inducers
(chemical and peptide signals in high concentrations, e.g. homoserine lactones) are used to
stimulate genetic expression of both mechanical and enzymatic processors of alginates,
which form a fundamental part of the extracellular matrix. The death phase sees the
breakdown of the biofilm. Enzymes are produced by the community itself which
breakdown polysaccharides holding the biofilm together, actively releasing surface bacteria
for colonisation of fresh substrates.
2.4 Microbial Cell Surface Architecture
Since it is the microbial cell surface that largely determines the adhesion process it
is necessary to describe a typical organization of the cell wall. Generally, a complete cell
envelope possesses a number of functions (strength conferring, shape maintenance,
molecular sieving, etc.) which can be provided by a single structural unit (Gram-positive
bacteria) or by several layers with specialized functions (Gram-negative bacteria).

13
2.4.1 Gram-positive Bacteria
In Gram-positive bacteria, the stress-bearing component of the cell envelope that
supports the internal turgor pressure of the cell is a thick, covalently cross-linked
peptidoglycan-containing layer (Hancock, 1990). Other macromolecules such as
polysaccharides, teichoic acids (secondary cell wall polymers), and proteins covalently
linked to the peptidoglycan, penetrate its complex network. The relation between the
amount of peptidoglycan (at least 40% by weight of the layer) and the total amount of
anionic secondary polymers (remainder of the layer) with the outermost chains projecting
into the surrounding fluid is generally maintained. So, the cell wall of Gram-positive
bacteria is thought to be a covalently linked heteropolymeric structure overlaying and
protecting the cytoplasmic membrane (Loeb, 1985). However, associated non-covalently
with this structure are chemical components that represent extracellular products of the cell
(glycocalyx). These are amphiphiles (lipoteichoic acids) that may retain an association with
the cell membrane, wall-associated assemblies of glycoprotein forming regularly structured
surface arrays (S-arrays) or capsules (‘slime layers ’) composed of an extracellular
polysaccharide fibrous material.
2.4.2 Gram-negative Bacteria
While the cell wall of Gram-positive bacteria consist primarily of the relatively
uniform single peptidoglycan-based layer, the cell wall of Gram-negative bacteria is
multilayered and structurally and chemically more complex. Gram-negative bacteria
possess a highly organized asymmetric outer membrane in which a bilayer of phospholipid
(inner leaflet, 20-25%), lipopolysaccharide (oqter leaflet, 30%), and outer membrane
protein (45-50%) constitute a permeability barrier with pores (ionic transmembrane
channels) formed of aggregates of proteins (Hancock, 1991). So, the outer face of the outer
membrane in the so-called smooth form (lipopolysaccharide consisting of a hydrophobic
lipid component, a core polysaccharide, and 0-antigenicall y specific polysaccharide side
chains) is hydrophilic. Interestingly, ‘rough’ mutants (lacking the core as well as the 0-
polysaccharide portion of the lipopolysaccharide) are more hydrophobic and much more
sensitive to hydrophobic molecules. Moreover, in Gram-negative bacteria, between the

14
outer cell membrane and the inner cytoplasmic membrane, there is a periplasm space filled
with a macromolecular gel made up of a thin peptidoglycan layer in which periplasmic
proteins and other molecules (lipoproteins) are distributed( Marshal,1985). Also, Gram-
negative bacteria produce a wide variety of glycocalyces (glycoprotein S-arrays and
polysaccharide capsules) closely associated with the cell surface.
2.5 Environmental factors influencing biofilm development
2.5.1 Effect of temperature
The optimum temperature for a microorganism is associated with an increase in
nutrient intake resulting in a rapid formation of biofilm (Stepanovic, 2003). Nutrient
metabolism is directly associated and dependent on the presence of enzymes. So it may be
fair to say that the formation of a biofilm is dependent on the presence and reaction rates of
enzymes, which control the development of many physiological and biochemical systems
of bacteria. Temperature is correlated with the reaction rate of enzymes and the
development of the cells. Optimum temperatures result in the healthy growth of the
bacterial populations. Conversely, a temperature away from the optimum reduces bacterial
growth. This is due to a reduction in enzyme to reaction rates. In addition, environmental
temperature affects the physical properties of the compounds within and surrounding the
cells. Fletcher (2001) reported the effect of temperature on attachment of stationary phase
cells. Shown that a decrease in temperature reduced the adhesion of bacteria on the
substrate. It is believed that the effect was due to a decrease in the bacterial surface
polymer at lower temperatures as well as effects such as reduced surface area.
However, Herald and Zottola (1988) observed that the presence of bacterial surface
appendages was dependent on temperature. At 35 oC cells were shown to have a single
flagellum whilst at 21 oC they had two to three flagella and at 10
oC, cells exhibited on
flagella. This may suggest that the initial interaction between the bacteria and substrate
may increase with a lowering of temperature, increasing the likelihood of adhesion.
Perhaps the more uniform properties of polysaccharides at lower temperatures increase the
possibility of biofilm adhesion, because of many microbial polysaccharides undergo
15
transition from an ordered state at lower temperatures and in the presence of ions, to a
disordered state at elevated temperature under low ionic environments.
2.6 Bacterial adhesion to surfaces
2.6.1 The influence of surface roughness.
Since the report in 1940 for Heukelekian (1940), has been known that the surface
characteristics are an important factor for the bacterial adhesion and development. Until
today this is central research area for the control of bacterial biofilm related disease. The
adhesion of bacteria to a surface depends on a number of microbiological, physical,
chemical, and material-related parameters, on surface topography has been widely
produced as a parameter influencing bacterial adhesion (Flint, 1997). Contact with a solid
surface induces the expression of a bacterial enzyme, which catalyzes the formation of exo-
polysaccharides that promote colonization and protection. Thus, the modification of
surfaces can be done to reduce attachment surfaces to limit the adhesion of microorganism
e.g. electropolishing of stainless-steel. Several parameters or measures have been used to
characterize the material surface based on two-dimensional characteristics such as the Ra
(roughness average), Rt (is the maximum peak to valley height in the sample length), and
Rz values (the average maximum profiler height) (Chiffre, 1990).
Amongst the most widely used is the surface roughness Ra value (which is the
arithmetical mean deviation of the profile) and an Ra value of 0.8 µm or less has been
recommended for dairies and, in general, for food contact surfaces. Although widely used,
the Ra value will typically not characterize features of the surface such as soft or sharp
topography or the presence of scratches or porosities During recent years, scanning electron
microscopy (SEM) and atomic force microscopy (AFM) have been used to give a three-
dimensional visualization of the surface topography including AFM determination of three-
dimensional topographical parameters in the nanometer range (Stout, 1993).

16
2.6.2 Specialized attachment structures/surface properties of the cell
Cell surface hydrophobicity and the presence of extracellular filamentous
appendages may influence the rate and the extent of microbial attachment. The
hydrophobicity of the cell surface is important in adhesion because hydrophobic
interactions tend to increase with an increasing non-polar nature of one or both surfaces
involved, for example the microbial cell and the adhesion surface (Donlan, 2002).
According to Drenkard and Ausubel (2002), the ability of bacteria to attach to each other
and to surfaces depends in part on the interaction of hydrophobic domains. On the other
hand bacteria and other microorganism have evolved many different ways to use the
hydrophobic effect in order to adhere to surface (Doyle, 2002). Surface charges are
inherently important for bacteria adhesion to the surface. In addition, bacteria may be
affected by culture media, nutrients and age, the surface charge would also dependent on
those parameters. Since it is the microbial cell surface that largely determines the adhesion
process it is necessary to describe typical organization of the cell wall.
2.6.3 Electrostatic, Hydrophobic and Bridging Effects of Cell Surface
Components
The reversible initial stage results from complex physicochemical interactions
among the cell, the surface and the liquid phase (Kim and Frank, 1994). These interactions
are caused by the surface charge (Hogt et al., 1985; Dickson and Koohamaraie, 1989), the
hydrophobicity (Dahlback et al., 1981; Van Loosdrecht et al., 1987) and electron acceptor
and electron donor (Van Oss, 1993) of interacting surfaces. The role of electron-
donor/electron acceptor, i.e. Lewis acid-base proper- ties, in the interaction between two
materials has been widely studied (Van Oss and Visser, 1992). Their importance in polar
aqueous media has been underlined and reviewed by Van Oss (1993). Several studies
(Boulangé-Petermann et al., 1993; Van Oss, 1993) have reported that the electron-
donor/electron acceptor plays a crucial role in the microbial adhesion phenomenon. It
should be noted that the energy of these interaction may be twice as much as that produced
17
by the Lifshitz-van der Waals interactions (LW) or electrostatic interactions (EL) usually
described in the DLVO theory (Van Oss, 1996).
In 1996, Bellon-Fontaine et al. developed a new method-namely M.A.T.S
(Microbial adhesion to solvents), to determine the electron donor/electron acceptor
microbial cell properties. It was based upon the comparison between microbial cell affinity
to a monopolar solvent and a polar solvent with the same LW surface tension component.
This technique appears to be more useful than contact angle method (Van Oss et al., 1988),
which requires specific and elaborate equipment. Microbial cell surface hydrophobicity is
recognized as one of the determinant factors in microbial adhesion to surface (Van
Loosdrecht et al., 1987). These properties are often evaluated by hydrophobic interaction
chromatography, contact angle method, aqueous phase partitioning poly-ethyleneglycol/
dextran (PEG/DEX) and microbial adhesion to hydrocarbon (M.A.T.H). The latter
technique is generally performed using p-xylene, hexadecane, octane and toluene. So, it
can be a useful method to measure the cell surface hydrophobicity.
The cell surface physicochemical properties can be modified depending on surface
cell structures (Ljunjh and Wadstrom, 1984; El Ghmari et al., 2002) or environmental
factors such as temperature, medium composition, ionic strength and pH. Many workers
have described the effects of these environmental parameters on hydrophobicity and charge
(Beck et al., 1988; Herben et al., 1990; Van Der Mei et al., 1993; Latrache et al., 1994;
Braindet et al., 1999a; Latrache et al., 2000). Literature data (Rouxhet and Mozes, 1990)
reported that the hydrophobicity and charge were insufficient to explain the adhesion
phenomenon. So the involvement of electron donor/electron acceptor properties could also
be important in explaining this phenomenon (Van Oss et al., 1988). Despite the fact that
the electron donor/electron acceptor properties play an important role in adhesion
phenomenon, limited data concerning the effects of environmental parameters on these
properties have been published (Braindet et al., 1999a; 1999b)