Effect of Cultivar and Type on Pepper Yield and Weight
47
Western Kentucky University TopSCHOLAR® Masters eses & Specialist Projects Graduate School Spring 2018 Effect of Cultivar and Type on Pepper Yield and Weight Elizabeth 'Egan' Blessinger Western Kentucky University, [email protected] Follow this and additional works at: hps://digitalcommons.wku.edu/theses Part of the Agricultural Science Commons , Horticulture Commons , and the Plant Breeding and Genetics Commons is esis is brought to you for free and open access by TopSCHOLAR®. It has been accepted for inclusion in Masters eses & Specialist Projects by an authorized administrator of TopSCHOLAR®. For more information, please contact [email protected]. Recommended Citation Blessinger, Elizabeth 'Egan', "Effect of Cultivar and Type on Pepper Yield and Weight" (2018). Masters eses & Specialist Projects. Paper 2304. hps://digitalcommons.wku.edu/theses/2304
Transcript of Effect of Cultivar and Type on Pepper Yield and Weight

Western Kentucky UniversityTopSCHOLAR®
Masters Theses & Specialist Projects Graduate School
Spring 2018
Effect of Cultivar and Type on Pepper Yield andWeightElizabeth 'Egan' BlessingerWestern Kentucky University, [email protected]
Follow this and additional works at: https://digitalcommons.wku.edu/theses
Part of the Agricultural Science Commons, Horticulture Commons, and the Plant Breeding andGenetics Commons
This Thesis is brought to you for free and open access by TopSCHOLAR®. It has been accepted for inclusion in Masters Theses & Specialist Projects byan authorized administrator of TopSCHOLAR®. For more information, please contact [email protected].
Recommended CitationBlessinger, Elizabeth 'Egan', "Effect of Cultivar and Type on Pepper Yield and Weight" (2018). Masters Theses & Specialist Projects.Paper 2304.https://digitalcommons.wku.edu/theses/2304

EFFECT OF CULTIVAR AND TYPE
ON PEPPER YIELD AND WEIGHT
A Thesis
Presented to
The Faculty of the Department of Agriculture
Western Kentucky University
Bowling Green, Kentucky
In Partial Fulfillment
Of the Requirements for the Degree
Master of Science
By
Elizabeth ‘Egan’ Blessinger
May 2018


iii
Acknowledgements
First and foremost, I would like to thank God for leading me to WKU and
blessing me with this opportunity. My parents and siblings for always pushing me in my
educational goals and having faith in my abilities. My husband, Adam, for all of the
encouragement and support. Without him, I would have lost my sanity.
I would like to thank Mr. Roger Dennis, for taking me under his wing throughout
my tenure at WKU and teaching me everything I know about horticulture. Dr. Elmer
Gray, for the many, many hours spent in the field harvesting, collecting data, and all of
the advice throughout this journey. Dr. Todd Willian, for his guidance and good sense of
humor over the past several years. Dr. Hunter Galloway, for the time spent running and
analyzing data. I would not have been able to complete this without each of you.
I would also like to thank Ball Horticulture for supporting this project and making
data collection and evaluation possible.

iv
Table of Contents
I. Introduction………………………………….………………………...…..1
II. Review of Literature…………………………………….……………...…2
III. Materials and Methods……………………………….…………………..10
IV. Results and Discussion…………………………………………………..14
V. Conclusion……………………………………………………………….29
Literature Cited…………………………………………………………………..30
v
List of Figures
Figure 1. Plug trays…………………………………………………………………...….34
Figure 2. Plants after transplanting ….......………………………………………………35
Figure 3. Plot……………………………………………………………………………..36
Figure 4. Cultivar 20……………………………………………………………………..37

vi
List of Tables
Table 1. Plot Diagram of Experiment……………………………………………12
Table 2. Least Square Means for Pepper Group A………………………………16
Table 3. Least Square Means for Pepper Group B………………………………18
Table 4. Least Square Means for Pepper Group C………………………………20
Table 5. Least Square Means for Pepper Group D………………………………22
Table 6. Least Square Means for Pepper Group E………………………………24
Table 7. Least Square Means for Pepper Group F………………………………26
Table 8. Least Square Means for Pepper Group G………………………………28
Table 9. List of Cultivars………………………………………………………...38

vii
EFFECT OF CULTIVAR AND TYPE
ON PEPPER YIELD AND WEIGHT
Elizabeth ‘Egan’ Blessinger May 2018 38 Pages
Directed by: Roger Dennis, Elmer Gray, and Todd Willian
Department of Agriculture Western Kentucky University
Peppers (Capsicum) are a valuable commodity throughout the world. They
provide food, coloring additives, vitamins, and ornamental aesthetics. Peppers can be
grown in many different areas of the world and their success is based on variety selection.
Breeding cultivars for superior performance is critical to success. Recent consumer desire
for less chemical use throughout the growing process has resulted in new cultivar
developments.
The objective of this research was to investigate how cultivar and type affect the
yield and weight of field grown peppers. This study provides valuable information for
growers in determining which cultivars are suitable for production in Kentucky.
The research was conducted at the Western Kentucky University Agriculture
Research and Education Complex in Bowling Green, Kentucky in 2016. Plants were
provided by Ball Horticultural and Pan American Seed, Elburn, Illinois. The
experimental design was a random design, with a 12 plant experimental unit consisting of
four three plant rows. Thirty-six cultivars were divided into groups based on the type of
pepper produced. Harvest occurred approximately every 7 days and were grouped into 3
periods.
Data were obtained on yield, weight, and mean weight. Individual group selection
is determined by the producers and their goals for production. There were wide
differences in the types of peppers, including size, shape, and color. When comparing all

viii
groups, two of the thirty six cultivars, Cultivar 23 (Tapered) and Cultivar 34 (Chili)
performed best for both yield and mean weight.

1
I. Introduction
Peppers (Capsicum) are a major commodity throughout the world. Their uses
include flavoring in food manufacturing, coloring in cosmetics, supplying heat to
medicines through capsaicin, and as fresh market foods. Some cultivars are grown as
ornamental plants and may be added to fresh bouquets in the floral industry. Dried
powders from Capsicum have been used to brighten colors of flamingos and koi fish in
zoo settings (Bosland and Votava, 2012).
For reasons including adaptability to various climates and versatility in culinary
use, peppers have been cultivated throughout the world. After centuries of cultivation for
specific traits, the United States National Plant Germplasm System currently lists more
than 5,000 species of Capsicum (Bosland and Votava, 2012). Several species of peppers
are commonly grown in the United States, the largest being Capsicum annum L., which
includes bell, certain chiles, and jalapeno; C. chinense L. which includes habanero; and
C. baccatum L. which includes chile peppers such as ‘Aji’ and ‘Lemon Drop’ (McMahon
et al., 2007).
Recent interest in more organic production methods has led to the need for new
plant varieties with greater resistance to drought, insects, and diseases. For Kentucky
producers, pepper cultivars need to be able to withstand and perform well in its variable
climate. The objective of the present study was to determine which types of peppers and
specific cultivars are most adapted to South Central, Kentucky growing conditions.

2
II. Review of Literature
Pepper Production Methods
Peppers are members of the Solanaceae family and are primarily grown as
summer annuals in the Northern Hemisphere. The warm, moderately wet, and humid
summers of South Central Kentucky are ideal for Capsicum production. Peppers are
grown in various areas across Kentucky both in open fields and in high tunnels.
Generally, peppers are started in seeding mixtures in a greenhouse environment and after
approximately 7 weeks, when significant root development has occurred, plants are
transplanted to the field, high tunnel, or container (Jones et al., 2000).
Peppers are typically grown in a greenhouse, high tunnel, or open field. Contrary
to operations in the United States, throughout the world peppers are produced largely in a
greenhouse environment. In 2002, greenhouse pepper production in the US were
estimated to be 50 hectares (Jovicich et al., 2005).
Greenhouse production allows the grower to have control over production factors:
temperature, humidity, irrigation, fertilization, wind, and day length (Bosland and
Votava, 2012). Greenhouse grown crops have lower evapotranspiration rates; therefore
they have higher water use efficiency than field produced plants (Fernandez et al., 1998).
Production sites are generally located near highly populated areas to lessen the cost of
transportation and utilities. The Netherlands is the world leader in greenhouse pepper
production, exporting 10% of the country’s 163,293 metric tons of bell peppers to the
United States in 1995 (Bosland and Votava, 2012).
High tunnel production allows growers to control certain aspects of production at
a significantly lower cost than greenhouse systems. Production in these structures can

3
increase the growing season up to 4 weeks in the spring and 8 weeks in the fall (Wells &
Loy, 1993). Research has shown that high tunnel production of peppers resulted in 50%
greater yields compared to standard field production (Waterer, 2003).
Peppers are classified into two major groups: bell and chile. These groups can be
subdivided, categorizing the peppers into different types. These types are based on size,
shape, length, heat, and use.
Growth Requirements
Pepper plants begin growth by producing a terminal stem. After 9 to 11 true
leaves are present this stem produces flowers. Several branches are produced from the
axils of the highest leaves. Each of these branches forms two leaves and ends in a flower.
This process repeats until the mature plant is formed (Dorland and Went, 1947). Plants
are ready for installment in the field when 4 to 6 true leaves are present and significant
roots are established (UMass, 2013). Transplanting to the field should be delayed until
the likelihood of frost has passed, which will usually be about April 15th in South
Central, Kentucky.
Peppers thrive when nightly temperatures are between 15˚ and 24˚ C and soil
temperatures reach 15˚ C (Orzolek et al., 2010). Higher yields result when daily air
temperatures range between 18°C and 32°C during fruit set (Bosland and Votava, 2012).
Day time temperature between 18°C and 29°C is ideal for pepper production, while night
time temperature should not fall below 15°C. Although peppers require warm
temperatures to produce, abortion of buds can result from temperatures above 35°C
(Hemphill, 2010).

4
Deep, well drained, sandy loam soil is ideal for Capsicum production (Bosland
and Votava, 2012). A pH range from 6.5 and 6.8 produces the highest yields (UMass,
2013). Soil testing for nitrogen and nitrate levels can be beneficial to pepper production.
High levels of nitrogen can result in excessive foliage, which can be detrimental to fruit
production, because much of the plant energy will go towards the foliage rather than fruit.
In the absence of soil test results, pre-plant application of 5-10-10 at the rate of 1.4 kg per
9.3 m2 should be applied (Dufault and Doubrava, 2003).
Field selection is critical for optimum pepper production. A well-drained upland
soil is highly recommended, soils that hold excessive moisture or are near waterways
increase the threat of disease (Jones et al., 2000). Peppers should not be planted following
a crop of tobacco or other members of the Solanaceae family to aid in disease prevention.
Consideration should also be given to pesticides that have been used in previous years.
Ideal crops to follow or rotate with peppers include: wheat, soybeans, cabbage, sweet
corn, cantaloupes, or cucumbers (Jones et al., 2000).
Nutrient requirements vary with plant developmental stage. Starting with
transplanting, a recommended nutrient solution consists of (ppm): Nitrogen- 70,
Phosphorus- 50, Potassium- 119, Calcium- 110, Magnesium- 40, and Sulfur- 55. When
plants reach maturity the recommendations are: Nitrogen- 160, Phosphorus- 50,
Potassium- 200, Calcium- 190, Magnesium- 48, and Sulphur- 65. (Jovivich et al., 2003).
After significant fruit set, fertilization with a complete fertilizer is recommended.
Supplying available nutrients will improve yield, quality, and will benefit growers
financially (Dufault and Doubrava, 2003).

5
Although drought resistant cultivars exist, irrigation is usually essential for
optimum yields. Adequate water is crucial at flowering and fruit set; a deficit at either
stage can result in aborted flowers and/or fruit. Frequency and amount of water needed
depends on the composition of soil, temperature, humidity, wind, and sunlight. Peppers
should receive 2.5 - 5.1 cm of water a day during the growing season (Zandstra et al.,
1985). The fibrous root system of pepper is relatively shallow, and absorbs water from
the top 30 cm of soil. Irrigation rate and frequency can be determined by assessing the
moisture level at the root zone, by hand, or with a moisture meter. (Bosland and Votava,
2012).
Utilizing drip irrigation has led to an increase in the yield of peppers (ITRC,
1996). Drip irrigation allows for water and nutrients to be applied directly to the crop at
root level, thus increasing quality and yield. Pepper water requirement varies based upon
temperature and humidity, lower irrigation amounts with longer frequency resulted in
significantly reduced yields (Sezen et al., 2007).
Research has shown that optimum plant spacing varies with plant type. Plants
should be spaced 45 - 60 cm apart within rows that are 76 - 101 cm apart (Zandstra et al.,
1985). Distances between and within rows have significant influences on yields. It has
been determined that plants grown in very narrow spacing produce the highest fruit yields
per hectare but the lowest yield per plant. Despite the lower per plant yield, density of
plants makes up for the loss of yield per plant (Bosland and Votava, 2012). Fruit weight
and yield increased as plant placing increased from 15 - 60 cm (Decoteau and Graham,
1994). Jovivich et al. (2004), reported that as plant population increased, weight and
number of pepper fruit increased.
6
Cultivar Selection
Cultivar selection is a major decision for pepper growers. With so many varieties
available, knowing the intended market and characteristics desired by consumers is vital.
Growers prefer varieties that produce high yields, have resistance to diseases, have a
uniform harvest maturity, and longevity of production. Fruit size, shape, color, flavor,
and capsaicin levels are all critical characteristics (Kaiser and Ernst, 2014).
Pest Problems
Kentucky pepper production often encounters insect pest problems with aphids
(Aphid spp.), beet armyworms (Spodoptera exigua), and European corn borers (Ostrinia
nubilalis) being the most common. Beet armyworm is the most prominent of these pests
due to its wide host range and resistance to most insecticides. A mature female moth can
lay over 600 eggs in a 7-day period. Eggs take only 2-3 days to hatch into larvae which
immediately begin feeding on both foliage and fruits. The entire life cycle is completed in
about one month and the results can be devastating (Bessin, 2003). Although beet
armyworms are resistant to many insecticides, when treated at a juvenile stage, control is
possible. Treating before larvae reach 1.3 cm in length is highly recommended. Lambda-
cyhalothrin, chlorpyrifos, and malathion are a few of the most effective chemical controls
for beet armyworms. Hyposoter exiguae, a parasitic wasp, is an important biological
control. One female wasp can eliminate 100 host caterpillars per day (Capinera, 2017).
The European corn borer not only leaves fruit that it has directly injured
unmarketable, but also can cause fruit to ripen prematurely or quickly rot on the vine.
The mature female moth will lay 15 to 30 eggs at a time on the underside of leaves.

7
Depending upon conditions, 3 to 7 days after these eggs are laid the larvae hatch and
tunnel into the plant to overwinter.
Common insecticides used to control European corn borers are acephate, zeta-
cypermethrin, and methoxyfenozide. Chemical control with these products does not kill
the eggs or larvae once they have tunneled in to the plant. (Youngman and Day, 2009).
Biological controls for this pest control eggs and larvae. Trichogramma ostrinia, is a
wasp that parasitizes eggs. Using this biological control at a release rate of
220,395/hectare when moths were first noticed resulted in 0% European corn borer
damage to a Connecticut crop (Hazzard et al., 2012).
Aphids are very common pests in greenhouse pepper production. They reside on
the underside of leaves and feed on plant juices. Adult females have the ability to give
birth to live offspring, as many as 12 per day, which results in rapid reproduction. Small
populations of aphids do not cause harm but because of their reproductive capacity these
populations increase rapidly. Large populations cause chlorosis and stunted shoot growth.
Aphids excrete a sugary material, called honeydew, allowing sooty mold to grow
(Boucher, 2012).
Management of aphids is most successful with biological controls. The most
commonly utilized natural predator of aphid is Hippodamia convergens or lady beetle.
Release rates vary depending on the infestation. A significant infestation should exist
before lady beetles are used, as one lady beetle will eat 50+ aphids a day. When adequate
food is not available the beetles will leave (Flint, 2014). Crops should be scouted weekly
to detect signs of pest activity. Proper dose and application method are very important
when treating for all pests.
8
Disease Problems
Several plant pathogens also infect Kentucky pepper crops. Bacterial leaf spot
(Xanthomonas), pepper virus complex, and anthracnose (Colletotrichum) are the most
common pathogens affecting Kentucky pepper production. Bacterial leaf spot is
considered the most serious of these pathogens, costing producers thousands of dollars
annually. This pathogen prefers wet, warm conditions and is spread through the soil by
water splashing, wind, and mechanical movement. Selecting resistant cultivars and
implementing crop rotations are the most effective forms of prevention (Jones et al.,
2000).
Pepper virus complex includes several viral diseases affecting peppers in
Kentucky including; tobacco mosaic, tobacco etch, and cucumber mosaic. These
diseases, when transmitted early in the growing period will severely stunt the plant,
deform leaves and produce irregular fruits. Prevention is key with pepper virus complex;
utilizing resistant cultivars, controlling weeds- especially of those in the Solanaceae
family, and crop rotation can help with prevention (Jones et al., 2000).
Anthracnose is caused by the fungus Colletotrichum, and can affect all parts of
the pepper plant during any stage of growth. Damaged fruit are the biggest problem
resulting from infection because they are unmarketable. Wet, sunken lesions cover the
fruit and rotting proceeds. Symptoms worsen when conditions are wet, transmitting
spores through rain splash and mechanical movement, i.e. people, tools, and pests.
Pathogen free seeds, weed control, and removal of infected plant debris are recommended
control procedures. Resistant varieties exist for chili peppers but not for bell peppers
(Roberts et al., 2015).

9
Market Trends
China continues to be the largest producer of bell and chili peppers worldwide,
followed by Mexico and Indonesia. The United States ranked sixth in the world in 2007,
producing 855,870 metric tons (Fereira, 2008).
Currently, seed companies distribute several hundred varieties of both sweet and
hot peppers (Orzolek et al., 2010). In 2015, the United States produced 17,725 hectares of
bell peppers with a value of $732,699,000 and 7,325 hectares of chili peppers with a
value of $135,743,000 (USDA, 2016). Most peppers harvested in the United States are
sold as fresh produce, resulting in several market outlets. These include wholesale
markets, cooperatives, local retailers, roadside stands, farmers markets, or pick your own
operations.
In 2013, bell peppers ranked as the eighth largest fresh market vegetable in terms
of production area in Kentucky with 66 hectares being grown. The majority of Kentucky
peppers are grown by smaller local operators. There are two large wholesale operators in
the state, located in Pulaski County and Scott County. (Saha and Hanks, 2014).
This research was directed toward an evaluation of a number of diverse pepper
cultivars in Southern Kentucky. Date of harvest, total yields, weights, and numbers of
harvests were examined to determine which cultivars are most suitable.

10
III. Materials and Methods
Thirty-six cultivars of peppers from C. annum, C. chinense, and C. baccatum
were provided by Ball Horticultural and Pan American Seed, Elburn, Illinois. Basic
information including type (hot, bell, snack) color (green, red, yellow, striped), and size
(mini, snack) was provided (Table 9). Cultivars were classified into 7 groups (a, b, c, d, e,
f, & g) based on the type of fruit. Numbers of cultivar within types were: (a) bell pepper
(9), (b) snack peppers (5), (c) mini bell (4), (d) tapered (6), (e) jalapeno (4), (f) chili (6),
and (g) habanero (2).
Research was conducted at Western Kentucky University Agriculture Research
and Education Complex (AREC) in Bowling Green, Kentucky. Seedlings were sown
March 22, 2016, by Ball Horticultural and Pan American Seed, Elburn, Illinois. Plants
were received in plug trays from Ball Horticultural and Pan American Seed, Elburn,
Illinois on April 20th, 2016(Fig. 1). Plugs were transplanted to 1020 tray cell pack inserts
and grown in a temperature and humidity controlled greenhouse for 41 days (Fig. 2). The
average temperature of the greenhouse ranged from 21° - 24° C during the day and 15° -
18° C at night. Data were collected at four intervals (-42, -35, -23 and -7 d) to determine
plant count, height, and vigor score over the 41 day period. On days -7 and -6 (May 25th
and 26th), a liquid fertilizer (20-20-20) was applied at 1:200 ppm to all plants while in the
greenhouse. Study day 0 was defined as the day in which plants were transplanted to the
field.
Plot Preparation
The field plot area was prepared by applying a 1% v/v glyphosate and glufosinate
mixture with a backpack sprayer to burn down all present vegetation. Subsequently the
plot area was tilled two separate times to a depth of 12.7 centimeters. Final plot

11
preparation was performed by manually removing all remaining plant material and raking
the soil to remove tillage ridges. Plot spacing was measured and marked by flags for each
cultivar.
Twelve plants from each of the thirty-six cultivars were transplanted to the field
on day 0 (May 31st). Two of the thirty-six varieties did not have twelve plants, other
varieties were used as fillers to complete the block of twelve and thus equalize plant
spacing. Yields or other data were not recorded for any of the filler plants. On day 0, a
side dress fertilizer application of 19-19-19 was applied near the base of each plant at a
rate of 5.7g per 140 cm 3 - plant row. Plants were individually hand watered until the soil
appeared saturated every other day for a two-week period following transplanting. Black
plastic mulch was laid around each plant and covered with organic leaf mulch to help
with weed control (Fig. 3).
Harvest
Fruit harvest began on day 59 of the trial. Mature fruit was harvested
approximately every seven days (study days 59, 66, 73, 80, 87, 94, 101, 108, 115, 129,
143, and 145). As the season progressed the ripening process slowed, therefore periods
between harvests became longer. At the last harvest (study day 145), all fruits that had
the potential of ripening were harvested. Fruit maturity was determined based on color
(red, gold, and green) and size; these parameters varied for each pepper cultivar. Data
were collected on total number and weight of pepper fruits produced for each cultivar
row. Mean pepper weight was calculated by dividing the total weight produced for each
row by the number of pepper produced in the row. Weights were taken using a AND
scale, model number 7G-15KA with a precision of .000; recorded originally in pounds
and later converted to grams.

12
Study Design and Statistical Analysis
Due to the limited numbers of available pepper plants, a one-way random design
was followed. The experimental unit included 12 plants consisting of four three plant
rows. Cultivars 1-30 were spaced 46 cm apart, while 31-36 were spaced 61 cm apart as
recommended by Ball Seed. Rows were spaced 60 cm apart. Each row served as a
sampling unit resulting in four within replications. Cultivars were grouped by pepper
type. (Table 1).
Gravel Road
Cultivar 36
Group F
Cultivar 30
Group C
Cultivar 24
Group D
Cultivar 18
Group E
Cultivar 12
Group A
Cultivar 6
Group A
Cultivar 35
Group F
Cultivar 29
Group C
Cultivar 23
Group D
Cultivar 17
Group E
Cultivar 11
Group A
Cultivar 5
Group A
Cultivar 34
Group F
Cultivar 28
Group G
Cultivar 22
Group D
Cultivar 16
Group E
Cultivar 10
Group A
Cultivar 4
Group A
Cultivar 33
Group F
Cultivar 27
Group G
Cultivar 21
Group D
Cultivar 15
Group C
Cultivar 9
Group A
Cultivar 3
Group A
Cultivar 32
Group F
Cultivar 26
Group D
Cultivar 20
Group C
Cultivar 14
Group C
Cultivar 8
Group B
Cultivar 2
Group B
Cultivar 31
Group F
Cultivar 25
Group E
Cultivar 19
Group B
Cultivar 13
Group C
Cultivar 7
Group A
Cultivar 1
Group B
Table 1. Plot Diagram of Experiment

13
Harvest data were combined into three harvest periods (harvest period 1 included
harvest at days 57, 64, 71, and 78; harvest period 2 included harvest at days 85, 92, 99,
and 106; and harvest period 3 included harvest at days 113, 127, 134, and 141) for
analysis. Additionally, all harvest periods were combined into total harvest. The effects
of cultivar on weight of peppers produced, mean pepper weight, and number of peppers
produced were evaluated in a one-way ANOVA design using the GLIMIXXED
procedure in SAS (9.4). To satisfy assumptions of ANOVA and meet normality a square
root transformation of the data was conducted. The fixed effect of cultivar and random
effect of replication were included in the model. Treatment means were calculated using
the LSMEANS option and separated with the PDIFF option using a Tukey adjustment.
Significance was considered at alpha < 0.05.

14
IV. Results & Discussion
Pepper yields by counts and weights are presented by cultivar groups (A through
G) and harvests periods (1 through 3) in Tables 2 through 8.
Group A (Bell Type, Table 2)
Data for pepper Type A is reported in Table 2. Cultivars 6 and 10 only produced
peppers in 1 of the 4 replications. Harvest period 1, Cultivar 11 had a greater pepper
count and more total weight as compared with cultivars 6, 7, and 10. Cultivar 3 and 4 had
mean weights almost 20 times greater than cultivar 6. The reduced individual pepper
weight for cultivar 6 is due to only one replication producing peppers.
Harvest period 2, cultivar 11 produced the greatest count (67 peppers) among all
cultivars followed by cultivar 12 (28 peppers) with no other cultivars differing from one
another (cultivar 3 = 9 peppers, cultivar 4 = 9 peppers, cultivar 5 = 12 peppers,
cultivar 6 = 9 peppers, cultivar 7 = 9 peppers, cultivar 9 = 6 peppers, and cultivar 10 = 7
peppers). Cultivar 5 had a greater total weight as compared with cultivars 7, 9, 10, 11,
and 12 but did not differ from cultivars 3, 4, and 6. Cultivars 3, 4, 5, 6, and 9 had a mean
weight approximately 10 times greater than cultivar 11.
Harvest period 3, Cultivar 11 produced the greatest count of peppers among all
cultivars; however, cultivar 11 produced the smallest individual weight per pepper
compared with all other cultivars. Total weights did not differ among cultivars. The lack
of differences in total weight for the harvest period indicated that cultivar 11 produced a
great enough count to offset the reduced individual pepper weight.

15
When all harvests were totaled, cultivar 11 produced the greatest count among all
cultivars. Cultivar 5 produced a total weight of almost 3 times as much as cultivar 10
(4787.4 g and 1603 g, respectively). Cultivar 5 had a greater individual pepper weight
(145.2 g/pepper) as compared with cultivar 11 (22.9 g/pepper) and cultivar 12
(47.0 g/pepper), but did not differ from cultivar 3 (133.5 g/pepper), cultivar 4
(138.4 g/pepper), cultivar 6 (124.3 g/pepper), or cultivar 9 (129.3 g/pepper). Cultivars 11
and 12 were not classified as a mini bell type; however, the individual pepper weights of
cultivar 11 and 12 more closely resemble the individual pepper weights of pepper type C.
Romero et al., (2001) reported a mean weight of 159 g/pepper over a two week
period in Jackson Springs, North Carolina. The reported mean weight is similar to all
harvest individual pepper weights of cultivars 3, 4, 5, 6, and 9; however the reported
mean weight is less than the individual pepper weights for cultivars 3, 4, and 5 in harvest
periods 1 and 2.

16
Tab
le 2. L
east Sq
uare Means fo
r Pep
per G
roup
A1 (B
ell)
Harv
est Perio
dC
ultivar
SE
MP
- value
34
56
79
10
11
12
Harv
est Perio
d 1
Weeks 1
to 4
Co
unt3
c3
c4
c1
c3
c2
c0
c3
4a
13
b1
.74
<0
.01
Weight (g)
65
7ab
56
0ab
82
1ab
10
6c
38
2b
c4
23
ab
c0
c9
26
a6
77
ab
10
0<
0.0
1
LS
Mean W
eight (g/pep
per)
21
2.3
a2
00
.7a
19
6.8
a1
0.9
cd
14
4.5
ab
17
2.0
a0
d2
2.9
cd
50
.1b
c1
8.6
7<
0.0
1
Harv
est Perio
d 2
Weeks 5
to 8
Co
unt9
c9
c1
2 c
9c
9 c
6 c
7 c
67
a2
8b
2.5
3<
0.0
1
Weight (g)
19
86
ab
21
35
ab
28
58
a2
07
6ab
12
59
b1
16
8b
10
03
b1
53
4.1
b1
55
0.1
b2
27
<0
.01
LS
Mean W
eight (g/pep
per)
22
0.7
a2
39
.5a
23
7.2
a2
25
.5a
14
1.4
b2
06
.4 a
14
9.4
b2
2.9
d5
5.6
c1
0.2
1<
0.0
1
Harv
est Perio
d 3
Weeks 9
to 1
2
Co
unt1
6b
c1
5c
16
bc
16
bc
11
c1
1 c
11
c5
1a
30
b4
.44
<0
.01
Weight (g)
14
11
13
52
13
53
13
64
94
31
14
46
95
91
91
09
53
28
0.4
3
LS
Mean W
eight (g/pep
per)
82
.4ab
82
.3ab
79
.7ab
79
.0 a
b8
3.0
a9
3.8
a6
1.3
b2
0.6
d3
8.6
c4
.16
<0
.01
To
tal of all H
arvest
Co
unt2
7c
26
c3
1 c
26
c2
2 c
19
c1
8c
15
0a
70
b6
.31
<0
.01
Weight (g)
38
46
ab
38
54
ab
47
87
.4a
33
92
ab
24
18
bc
25
99
bc
16
03
c3
17
5ab
c3
13
2ab
c4
68
<0
.01
LS
Mean W
eight (g/pep
per)
13
3.5
a1
38
.4a
14
5.2
a1
24
.3 a
b1
05
.9 b
c1
29
.3 a
b8
8.1
c2
2.9
e4
7.0
d5
.65
<0
.01
1Data w
ere analyzed using a sq
uare roo
t of (x +
1) transfo
rmatio
n due to
failure of no
rmality.
ab
cd
eLeast m
eans within a ro
w w
ith different sup
erscripts d
iffer (P <
0.0
5).

17
Group B (Snack Type, Table 3)
Data for pepper Type B are reported in Table 3. Harvest period 1, no differences
existed among cultivars for either count or total weight. Cultivar 1 had 15.3 g/pepper
greater mean weight as compared with cultivar 19.
Harvest period 2, cultivar 2 produced at least 30 more peppers than any other
cultivar. Total weight did not differ among cultivars. Cultivar 1 had a greater weight as
compared with cultivar 2 but was not different than cultivar 8 or 19. The data indicates
that for harvest period 2, cultivar 2 produced more peppers but had lower mean weight as
compared with all other cultivars.
Harvest period 3, there was no difference in pepper count among cultivars.
Cultivar 1 produced almost 900 g more total weight as compared with all the other
cultivars, cultivar 1 (2050 g), cultivar 2 (869 g), cultivar 8 (1163 g), and cultivar
19 (1097 g). Cultivar 1 produced greatest mean pepper weight as compared with all other
cultivars for harvest period 3.
Total pepper counts did not differ among cultivars for all harvest periods.
Cultivar 1 had greater mean weight as compared with cultivar 2. Cultivar 1 produced
1777 g more weight as compared with cultivar 2. The greater total weight of cultivar 1
compared to cultivar 2 is due to the increased mean pepper weight since no differences
existed for total pepper count.

18
Tab
le 3. L
east Sq
uare Means fo
r Pep
per T
ype B
1 (Snack T
ype)
12
81
9
Harv
est Perio
d 1
Co
unt2
02
63
42
25
.11
0.2
6
Weight (g)
14
33
81
51
18
21
23
62
72
0.4
9
LS
Mean W
eight (g/pep
per)
77
.3a
34
.7c
40
.3b
c6
2.0
ab
8.6
1<
0.0
1
Harv
est Perio
d 2
Co
unt2
4b
57
a2
7ab
25
b7
.04
0.0
3
Weight (g)
16
35
17
63
12
72
14
37
29
80
.51
LS
Mean W
eight (g/pep
per)
56
.7a
27
.1b
42
.0ab
49
.1ab
6.0
70
.03
Harv
est Perio
d 3
Co
unt4
42
93
56
27
.05
0.0
5
Weight (g)
20
50
a8
69
b1
16
3b
10
97
b2
15
<0
.01
LS
Mean W
eight (g/pep
per)
43
.0a
26
.5b
29
.0b
31
.1b
2.0
2<
0.0
1
Co
unt8
81
13
96
10
98
.85
0.2
7
Weight (g)
53
48
a3
57
1b
37
97
ab
49
63
ab
52
50
.02
LS
Mean W
eight (g/pep
per)
56
.2a
29
.5c
36
.3b
c4
2.7
b3
.68
<0
.01
ab
cLeast m
eans within a ro
w w
ith different sup
erscripts d
iffer (P <
0.0
5).
Harv
est Perio
dC
ultivar
SE
MP
- value
Weeks 1
to 4
Weeks 5
to 8
Weeks 9
to 1
2
To
tal of all H
arvest
1Data w
ere analyzed using a sq
uare roo
t of (x +
1) transfo
rmatio
n due to
failure of no
rmality.

19
Group C (Mini Bell Type, Table 4)
Data for pepper Type C are presented in Table 4. Harvest period 1, Cultivar 13
produced the greatest pepper count as compared with all cultivars. Cultivar 20 did not
produce during harvest period 1. Total weight did not differ among the cultivar that
produced peppers during harvest period 1 (cultivars 13, 14, 15, 29, and 30). Cultivars 29
and 30 had a mean weight over 2 times greater than cultivar 13.
Harvest period 2, cultivar 20 produced at least 16 more peppers as compared with
cultivar 15 and cultivar 14, but was not different than cultivars 13, 29, or 30. Total weight
did not differ among cultivars for harvest period 2. Cultivar 13 and cultivar 20 had
smaller mean pepper weights as compared with cultivar 14.
Harvest period 3, cultivar 20 produced more peppers as compared with cultivar
14, 29, and 30, but was not different from cultivar 13 and 15. Cultivar 15 produced
approximately 3 times more total weight as compared with cultivar 14, but was not
different from cultivars 13, 20, and 29. Cultivar 20 had a reduced mean weight as
compared with cultivars 14, 15, and 29 but did not differ from cultivars 13 and 30.
Total harvest period, cultivar 20 produced approximately 4 times more peppers
than cultivar 14 (86 and 22 peppers, respectively). Total weight produced did not differ
among cultivars for total of all harvest. Cultivars 14, 15, and 29 had the greater mean
weights as compared with cultivars 13 and 20. The consistently reduced mean pepper
weight of cultivar 20 is possibly due to the cultivar being sterile (Figure 4), not producing
seeds could possibly lower the weight of individual peppers.

20
13
14
15
20
29
30
Harv
est Perio
d 1
Co
unt1
1a
3b
3b
0c
3b
2b
c0
.98
<0
.01
Weight (g)
80
0a
44
1ab
28
6ab
0b
49
3a
43
6 a
b1
20
<0
.01
LS
Mean W
eight (g/pep
per)
71
.6b
12
3.1
ab
11
0ab
0c
16
4.6
a1
88
.3a
21
.40
<0
.01
Harv
est Perio
d 2
Co
unt1
6ab
6b
10
b2
6a
12
ab
13
ab
2.9
2<
0.0
1
Weight (g)
14
15
10
96
15
49
17
69
17
43
19
35
32
70
.56
LS
Mean W
eight (g/pep
per)
84
.3c
17
7.0
a1
51
.4ab
69
.1c
14
1.9
b1
53
.3ab
6.2
9<
0.0
1
Harv
est Perio
d 3
Co
unt3
8ab
12
c3
3ab
59
a2
2b
c2
8b
c6
.65
<0
.01
Weight (g)
14
15
ab
77
4b
23
47
a1
71
6ab
14
81
ab
12
09
b2
70
<0
.01
LS
Mean W
eight (g/pep
per)
36
.4b
69
.0a
68
.7a
27
.1b
67
.9a
43
.9b
6.5
9<
0.0
1
Co
unt6
7ab
22
d4
6b
c8
6a
38
cd
43
bcd
6.9
1<
0.0
1
Weight (g)
34
50
21
46
39
86
33
19
35
47
33
81
51
30
.08
LS
Mean W
eight (g/pep
per)
57
.2b
c1
09
.9a
93
.8a
43
.1c
10
3.1
a8
6.9
ab
8.0
8<
0.0
1
ab
cdL
east means w
ithin a row
with d
ifferent superscrip
ts differ (P
< 0
.05
).
Tab
le 4. L
east Sq
uare Means fo
r Pep
per G
roup
C1 ( M
ini Bell T
ype)
Harv
est Perio
dC
ultivar
SE
MP
- value
Weeks 1
to 4
Weeks 5
to 8
Weeks 9
to 1
2
To
tal of all H
arvest
1Data w
ere analyzed using a sq
uare roo
t of (x +
1) transfo
rmatio
n due to
failure of no
rmality.

21
Group D (Tapered Type, Table 5)
Data for pepper Type D are presented in Table 5. Cultivar 26 produced at least 9
fewer peppers for harvest period 1 than all other cultivars. However, cultivars 23 and 26
did not differ in total weight. Cultivar 21 produced 17 more peppers than 26, but cultivars
21 and 26 did not differ in mean weight (43.1 g/pepper and 51.5 g/pepper, respectively).
This was not expected since 21 produced the greatest number of peppers and 26 produced
the least.
Harvest period 2, cultivar 23 yielded at least 50 more peppers than all other
cultivars. Cultivar 23 produced approximately 2.4 times more total weight than cultivar
22, but cultivar 23 was not different than any other cultivar. Cultivar 21 and 26 had the
greatest mean weight as compared with all others.
Count and total weight did not differ among cultivars for harvest period 3;
however, cultivar 21 and 26 had a greater mean weight than all other cultivars. Cultivars
21 and 26 constantly, did not differ but had greater mean peppers weights than all other
cultivars at all harvest periods.
Cultivar 22 and 23 produced more peppers than cultivar 26; however, cultivars 22
and 23 produced smaller peppers than any other cultivar for total harvest periods. Total
weight did not differ among cultivars. Cultivars 21 and 26 had at least 8.8 g/pepper mean
weight greater than all other cultivars.

22
21
22
23
24
26
Harv
est Perio
d 1
Count
18 a
18 a
10
a11
a1
b2.7
7<
0.0
1
Weight (g)
821
a472
b201
cd
378
bc
44
d72.0
0<
0.0
1
LS
Mean W
eight (g/pep
per)
43.1
ba
25.7
c20.5
c34.1
b51.5
a1.7
8<
0.0
1
Harv
est Perio
d 2
Count
15
b25
b79
a29
b23
b8.4
7<
0.0
1
Weight (g)
690
ab
622
b1520
a907
ab
977
ab
195.0
00.0
4
LS
Mean W
eight (g/pep
per)
43.6
a25.0
bc
19.6
c29.8
b42.0
a2.0
7<
0.0
1
Harv
est Perio
d 3
Count
62
73
74
39
39
12.2
10.0
5
Weight (g)
1436
1044
1041
608
892
274.0
00.1
5
LS
Mean W
eight (g/pep
per)
23.0
a13.8
b14.2
b16.1
b23.5
a1.3
0<
0.0
1
Count
97
bc
116
ab
163
a79
bc
61
c17.3
2<
0.0
1
Weight (g)
3084
2258
2858
2002
2029
346
0.0
8
LS
Mean W
eight (g/pep
per)
31.4
a19.0
c17.4
c24.6
b32.0
a1.1
5<
0.0
1
ab
cdL
east means w
ithin a row
with d
ifferent superscrip
ts differ (P
< 0
.05).
Tab
le 5. L
east Square M
eans for P
epper G
roup
D1 (T
apered
Typ
e)
Harv
est Perio
dC
ultivar
SE
MP
- value
Weeks 1
to 4
Weeks 5
to 8
Weeks 9
to 1
2
Total o
f all Harv
est
1Data w
ere analyzed using a sq
uare root o
f (x + 1
) transform
ation d
ue to failure o
f norm
ality.

23
Group E (Jalapeno Type, Table 6)
Data for pepper Type E are presented in Table 6. Harvest period 1, cultivar 17 and
18 yielded at least 31 more peppers than cultivar 25. Cultivar 18 produced 1,000g more
total weight than cultivars 16 and 25. However, cultivar 18 and 25 did not differ in mean
pepper weight (28.9 g/pepper and 27.1 g/pepper, respectively).
Counts did not differ among cultivars for harvest period 2. Cultivar 18 yielded
637g more total weight and had a mean pepper weight of 3.3 g/pepper greater than
cultivar 17.
Harvest period 3, there were no differences for total weight yielded among
cultivars. Cultivar 18 had a mean pepper weight at least 2.5 g/pepper greater than all
other cultivars. Cultivar 25 produced 50 more peppers than cultivar 17; however, cultivar
17 had a greater mean weight as compared with cultivar 25.
There were no differences among pepper counts for total harvest period. Cultivar
18 yielded at least 1,804g more total weight than either cultivar 17 or 25. Cultivar 18 had
the greatest total weight due to the mean weight being at least 3.3 g/pepper greater than
all other cultivars.

24
16
17
18
25
Harv
est P
erio
d 1
Co
un
t74
ab93
a100
a62
b7.0
9<
0.0
1
Weig
ht (g
)1866
b2314
ab2892
a1679
b174
<0.0
1
LS
Mean
Weig
ht (g
/pep
per)25.3
bc
24.8
c28.9
a27.1
ab0.6
6<
0.0
1
Harv
est P
erio
d 2
Co
un
t44
41
60
56
5.9
90.1
2
Weig
ht (g
)989
ab925
b1562
a1092
ab144
0.0
4
LS
Mean
Weig
ht (g
/pep
per)22
.3b
22.5
b25.8
a19.5
c0.5
<0.0
1
Harv
est P
erio
d 3
Co
un
t134
ab99
b115
ab149
a9.4
20.0
2
Weig
ht (g
)2467
1829
2401
2223
198
0.1
5
LS
Mean
Weig
ht (g
/pep
per)19
.1b
19.1
b21.6
a15.6
c0.7
6<
0.0
1
Co
un
t252
233
274
266
15.1
0.2
9
Weig
ht (g
)5336
ab5069
b6873
a4995
b353
0.0
1
LS
Mean
Weig
ht (g
/pep
per)21
.3b
21.8
b25.1
a18.9
c0.4
3<
0.0
1
abcL
east m
ean
s w
ithin
a ro
w w
ith d
iffere
nt s
up
ers
crip
ts d
iffer (P
< 0
.05).
Tab
le 6
. Least S
qu
are
Mean
s fo
r Pep
per T
yp
e E
1 (Ja
lap
en
o T
yp
e)
Harv
est P
erio
dC
ultiv
ar
SE
MP
- valu
e
Weeks 1
to 4
Weeks 5
to 8
Weeks 9
to 1
2
To
tal o
f all h
arv
ests
1Data
were
an
aly
zed
usin
g a
sq
uare
roo
t of (x +
1) tra
nsfo
rmatio
n d
ue to
failu
re o
f no
rmality
.

25
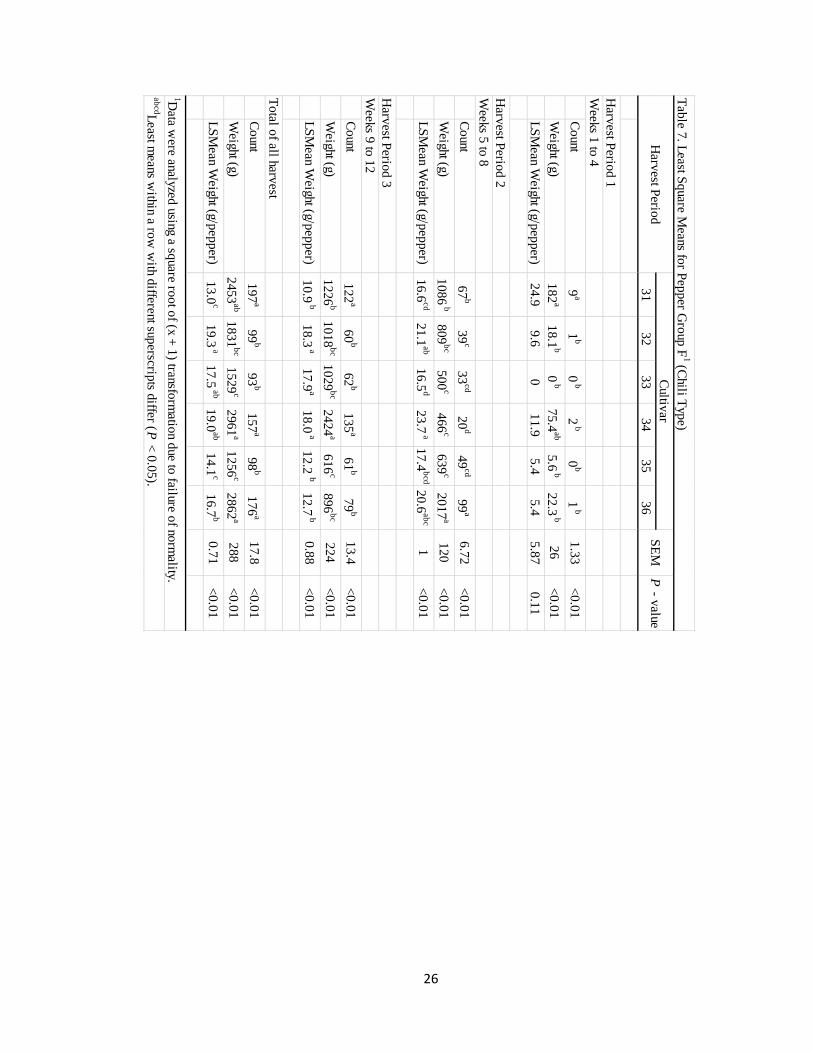
Group F (Chili Type, Table 7)
Data for pepper Type F are presented in Table 7. Harvest period 1, cultivar 31 had
a greater pepper count as compared with all other cultivars. Cultivars 31 and 34 did not
differ in weight (182 g and 75.4 g, respectively); however, cultivar 31 was greater than all
other cultivars. Mean weight did not differ among cultivars in harvest period 1. The
differences reported are possibly due to cultivar 31 producing peppers in all 4
replications; whereas, other cultivars had 2 or more replications that did not produce any
peppers.
Cultivar 36 had the greatest count and weight as compared with all other cultivars
in harvest period 2. Cultivar 36 had a mean pepper weight greater than cultivar 33 but
was not different when compared with any other cultivar.
Harvest period 3, cultivars 31 and 34 yielded at minimum 43 more peppers than
any other cultivar. However, cultivar 34 yielded 1,198g more total weight as compared
with cultivar 31. This is due to cultivar 34 having a 7.1 g/pepper greater mean weight as
compared with cultivar 31.
Cultivars 31, 34, and 36 had greater counts as compared to all other cultivars for
total harvest periods. Cultivars 31, 34, and 36 did not differ in total weight produced;
however, cultivar 34 and 36 had a greater mean weight as compared with cultivar 31.
26
31
32
33
34
35
36
Harv
est Perio
d 1
Co
unt9
a1
b0
b2
b0
b1
b1
.33
<0
.01
Weight (g)
18
2a
18
.1b
0 b
75
.4ab
5.6
b2
2.3
b2
6<
0.0
1
LS
Mean W
eight (g/pep
per)
24
.99
.60
11
.95
.45
.45
.87
0.1
1
Harv
est Perio
d 2
Co
unt6
7b
39
c3
3cd
20
d4
9cd
99
a6
.72
<0
.01
Weight (g)
10
86
b8
09
bc
50
0c
46
6c
63
9c
20
17
a1
20
<0
.01
LS
Mean W
eight (g/pep
per)
16
.6cd
21
.1ab
16
.5d
23
.7 a
17
.4b
cd
20
.6ab
c1
<0
.01
Harv
est Perio
d 3
Co
unt1
22
a6
0b
62
b1
35
a6
1b
79
b1
3.4
<0
.01
Weight (g)
12
26
b1
01
8b
c1
02
9b
c2
42
4a
61
6c
89
6b
c2
24
<0
.01
LS
Mean W
eight (g/pep
per)
10
.9 b
18
.3 a
17
.9a
18
.0 a
12
.2 b
12
.7 b
0.8
8<
0.0
1
Co
unt1
97
a9
9b
93
b1
57
a9
8b
17
6a
17
.8<
0.0
1
Weight (g)
24
53
ab
18
31
bc
15
29
c2
96
1a
12
56
c2
86
2a
28
8<
0.0
1
LS
Mean W
eight (g/pep
per)
13
.0c
19
.3 a
17
.5 a
b1
9.0
ab
14
.1c
16
.7b
0.7
1<
0.0
1
ab
cdL
east means w
ithin a row
with d
ifferent superscrip
ts differ (P
< 0
.05
).
Tab
le 7. L
east Sq
uare Means fo
r Pep
per G
roup
F1 (C
hili Typ
e)
Harv
est Perio
dC
ultivar
SE
MP
- value
Weeks 1
to 4
Weeks 5
to 8
Weeks 9
to 1
2
To
tal of all harv
est
1Data w
ere analyzed using a sq
uare roo
t of (x +
1) transfo
rmatio
n due to
failure of no
rmality.

27
Group G (Habanero Type, Table 8)
Data for pepper Type G are presented in Table 8. Harvest period 1 cultivar 28
produced more peppers than cultivar 27 (17 peppers and 4 peppers, respectively). Mean
pepper weights did not differ between cultivars 27 and 28 (15.7 g/pepper and 18.6
g/pepper, respectively). Therefore, a difference in total yield between cultivars 27 and 28
was expected for period one.
Harvest period 2, count and weight did not differ between cultivars 27 and 28;
however, cultivar 28 had a greater mean weight as compared with cultivar 27
(15.4g/pepper and 11.5g/pepper, respectively). The mean weight difference was not great
enough to cause a difference in total weight.
Harvest period 3, there was no difference among count, total weight, or mean
weight between cultivar 27 and 28.
Total of all harvest periods, count and weight did not differ between cultivars 27
and 28; however, cultivar 28 had a greater mean weight as compared with cultivar 27
(13.7g/pepper and 10.9g/pepper, respectively).
Manju and Sreelathakumary (2002) reported a mean weight of 5.02 g ± 0.15 SEM
for habanero peppers grown in Kerala, India for peppers over 4 harvest periods. The
reported pepper weight is approximately half the mean weight of habanero peppers (type
G) produced in this study.

28
27
28
Harv
est Perio
d 1
Count
4b
17
a1.4
5<
0.0
1
Weight (g)
82.4
b310
a13.6
0<
0.0
1
LS
Mean W
eight (g/pep
per)
15.7
18.6
1.0
60.1
2
Harv
est Perio
d 2
Count
197
159
20.0
50.2
6
Weight (g)
2261
2457
265.0
00.6
2
LS
Mean W
eight (g/pep
per)
11.5
b15.4
a0.1
8<
0.0
1
Harv
est Perio
d 3
Count
83
90
5.4
60.3
8
Weight (g)
725
852
80.0
00.3
1
LS
Mean W
eight (g/pep
per)
8.7
9.4
0.5
60.4
2
Count
286
268
16.3
10.4
8
Weight (g)
3073
3629
259.1
00.1
9
LS
Mean W
eight (g/pep
per)
10.9
b13.7
a0.3
2<
0.0
1
abL
east means w
ithin a row
with d
ifferent superscrip
ts differ (P
< 0
.05).
Tab
le 8. L
east Square M
eans for P
epper G
roup
G1 (H
abanero
Typ
e)
Harv
est Perio
dC
ultivar
SE
MP
- value
Weeks 1
to 4
Weeks 5
to 8
Weeks 9
to 1
2
Total o
f all harvests
1Data w
ere analyzed using a sq
uare root o
f (x + 1
) transform
ation d
ue to failure o
f norm
ality.
29
V. Conclusion
In this study the focus was on yield, weight, and mean weights of 36 different
cultivars of peppers when grown in South Central Kentucky. Although each group of
peppers differs in shape, size, and weight we can compare them based on yield.
Group G (Habanero Type) produced the highest yield out of all of the groups. There were
significant differences in fruit size, appearance, and maturity, in terms of color, across the
groups analyzed. The most successful cultivar is determined by the producer or consumer
based on desired characteristics.
For producers seeking a larger pepper for fresh market production cultivars:
5 (Bell), 1 (Snack), 15 (Mini bell), 21 (Tapered), 18 (Jalapeno), 34 (Chili), and
28 (Habanero) would be ideal. If a higher yield is desired than cultivars: 11 (Bell),
2 (Snack), 20 (Mini bell), 23 (Tapered), 18 (Jalapeno), 31 (Chili), and 27 (Habanero)
ranked highest (Tables 2-8).

30
Literature Cited
Bessin, R. (2003). Common Insects Attacking Peppers. University of Kentucky
Cooperative Extension. ENTFACT-301
Bosland, P., and E. Votava (2012). Peppers Vegetable and Spice Capsicums (2nd ed.).
Boucher, J. (2012) Pepper IPM: Aphids.
http://ipm.uconn.edu/documents/raw2/Pepper%20IPM%20Aphids/Pepper%20IP
M%20Aphids.php?aid=59
Capinera, J. (2017). Featured Creatures: Beet armyworm. Publication number: EENY-
105. http://entnemdept.ufl.edu/creatures/veg/leaf/beet_armyworm.htm
Decoteau, D. and H. Graham (1994). "Plant spatial arrangement affects growth, yield,
and pod distribution of cayenne peppers." HortScience 29(3): 149-151.
Dorland, R. and F. W. Went (1947). "Plant Growth Under Controlled Conditions, VIII.
Growth and Fruiting of the Chili Pepper." American Journal of Botany 34(8):
393-401.
Dufault, R., and N. Doubrava (April 2003). Pepper. Clemson University Cooperative
Extension.
Fereira, J. (2008, November). U.S. Bell and Chile Pepper Statistics. Retrieved February,
2017, from
http://usda.mannlib.cornell.edu/MannUsda/viewDocumentInfo.do?documentID=1
659
Fernandez, M. D., M. Gallardo, S. Bonachela, F. Orgaz, R. Thompson, and E. Fereres
(1998). "Water use and production of a greenhouse pepper crop under optimum

31
and limited water supply." Journal of horticulture science and biotechnology.
80(1): 87-96
Flint, M. (2014) Lady Bugs need special care to control aphids in the garden.
https://ucanr.edu/blogs/blogcore/postdetail.cfm?postnum=13933
Hazzard, R., Dowling, Z., and B. Dicklow (2012) Peppers: Biological control of
European corn borer, and increasing incidence of anthracnose.
http://ag.umass.edu/vegetable/outreach-project/peppers-biological-control-of-
european-corn-borer-increasing-incidence-of
Hemphill, D. (2010, February). "Fresh Market Vegetable Production, Peppers." from
http://horticulture.oregonstate.edu/content/peppers-0.
ITRC. (1996). Row crop drip irrigation on peppers study – High Rise Farms. ITRC
Report No. R 96-001
Jones, T., R. Bessin, J. Strang, B. Rowell, and D. Spalding (2000). Kentucky Pepper
Integrated Crop Management. (IPM-13) Cooperative Extension Service.
Jovicich, E., D. Cantliffe, S. Sargent, L. Osborne (2003). "Production of greenhouse-
grown peppers in florida." HS979
Jovicich, E., D. Cantliffe, P. Stoffella (2004). "Fruit yield and quality of greenhouse-
grown bell peppers as influenced by density, container, and trellis system."
HortTechnology 14(4): 507-513
Jovicich, E., D. Cantliffe, J. VanSickle, P. Stoffella (2005). “Greenhouse-grown colored
peppers: a profitable alternative for vegetable production in florida.”
HortTechnology 15(2) 355-369

32
Kaiser, C., and M. Ernst (2014). Hot Peppers and Specialty Sweet Peppers. University of
Kentucky Cooperative Extension. Center for Crop Diversification Crop Profile
(CCD-CP-101).
Manju, P. R. and I. Sreelathakumary (2002). "Genetic variability, heritability and genetic
advance in hot chilli (capsicum chinense jacq.).” Journal of Tropical Agriculture 40: 4-6.
Massachusetts, University of (2013). Growing peppers in the home garden.
McMahon, M., A. Kofranek, and V. Rubatzky (2007). Hartmann's Plant Science:
Growth, Development, and Utilization of Cultivated Plants (4th ed.). Columbus,
Ohio: Pearson Prentice Hall.
Orzolek, M., L. Kime, S. Bogash, J. Harper, and R. Harsh (2010). Agricultural
Alternatives: Pepper Production. University Park, PA: Publications Distribution
Center, The Pennsylvania State University.
Roberts, P., K. Pernezny, and T. Kucharek (2015). Anthracnose on pepper in Florida. PP-
178. http://edis.ifas.ufl.edu/pdffiles/PP/PP10400.pdf
Romero, A., C. Kousik, D. Ritchie (2001). "Resistance to bacterial spot in bell pepper
induced by acibenzolar-s-methyl." The American Phytopathological Society 85(2): 189-
194.
Saha, S. K., and L. Hank (2014). Midwest Vegetable Trial Report: Kentucky Bell Pepper
Variety Trial.
Sezen, S., A. Yazar, and S. Eker Effect of drip irrigation regimes on yield and quality of
field grown bell pepper. In: Water saving in Mediterranean agriculture and future
research needs [Vol. 1]. Bari: CIHEAM, 2007. p.261-276

33
United States Department of Agriculture. (2016, April 29). Retrieved February, 2017,
from https://www.nass.usda.gov/Statistics_by_Subject/result.php?CA81FA26-
B918-3AB2-8396-7A3B2C04E0C4§or=CROPS&group=VEGETABLES&comm
=PEPPERS
Waterer, D. (2003). Yields and economics of high tunnels for production of warm-season
vegetable crops. HortTechnology 13(2): 339-343.
Wells, O. and B. Loy (1993). "Rowcovers and high tunnels enhance crop production in
the northeastern united states." HortTechnology 3(1): 92-95.
Youngman, R. and E. Day (2009) VCE Publication: European corn borer. 444-232
Zandstra, B., C. Stephens, and E. Grafius (1985). Peppers: Commercial Vegetable
Recommendations (E1815).
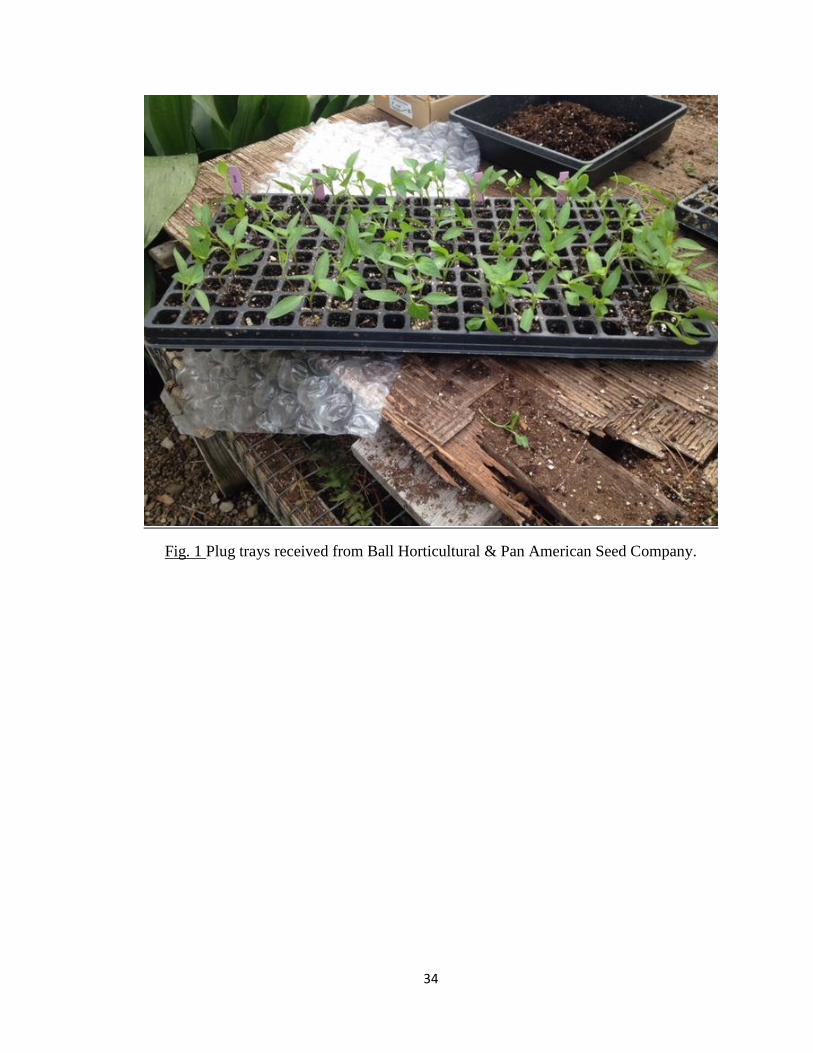
34
Fig. 1 Plug trays received from Ball Horticultural & Pan American Seed Company.

35
Fig. 2 Plants after transplanting in greenhouse at WKU AREC.

36
Fig. 3 View of plot at WKU AREC.

37
Fig. 4 Cultivar 20 note the lack of seeds produced.

38
Cultivar Ball # Type Prefix/Name
1 5485 B Cute Stuff Red
2 5484 B Cupid
3 5483 A SBGR
4 5482 A SBGR
5 5481 A Paladin
6 5480 A Intruder
7 5479 A Better Belle II
8 5487 B SBGR
9 5488 A Summer Sweet
10 5489 A SBGY-a
11 5490 A Eros
12 5491 A SBGY
13 5493 C Carmen
14 5494 C Sweet Delilah
15 5495 C STGY
16 5504 E La Bomba II
17 5505 E HTGR
18 5506 E HTGR
19 5486 B SBGR
20 5498 C STGR
21 5499 D STTGR
22 5500 D STCS
23 5497 D Sweetie Mix
24 5501 D STTGC
25 5503 E Centella
26 5502 D STTGC
27 5513 G Helios
28 5514 G CH
29 5492 C Cortes
30 5496 C STGR
31 5510 F BH
32 5511 F BS
33 5509 F BH
34 5512 F BS
35 5507 F Aji Crystal
36 5508 F BH
Table 9. Cultivars utilized in the experiment.