EFFECT OF CREDIT MANAGEMENT PRACTICES ON FINANCIAL ...
95
EFFECT OF CREDIT MANAGEMENT PRACTICES ON FINANCIAL PERFORMANCE OF SAVINGS AND CREDIT CO-OPERATIVE SOCIETIES IN KISUMU COUNTY BY MAUREEN A. OLWENY A RESEARCH PROJECT SUBMITTED IN PARTIAL FULFILMENT OF THE REQUIREMENTS FOR THE DEGREE OF MASTER OF SCIENCE IN FINANCE DEPARTMENT OF FINANCE AND ACCOUNTS MASENO UNIVERSITY © 2019
Transcript of EFFECT OF CREDIT MANAGEMENT PRACTICES ON FINANCIAL ...

EFFECT OF CREDIT MANAGEMENT PRACTICES ON FINANCIAL
PERFORMANCE OF SAVINGS AND CREDIT CO-OPERATIVE SOCIETIES IN
KISUMU COUNTY
BY
MAUREEN A. OLWENY
A RESEARCH PROJECT SUBMITTED IN PARTIAL FULFILMENT OF THE
REQUIREMENTS FOR THE DEGREE OF MASTER OF
SCIENCE IN FINANCE
DEPARTMENT OF FINANCE AND ACCOUNTS
MASENO UNIVERSITY
© 2019

ii
DECLARATION
This research project is my original work and has not been presented for an award in any
University.
Maureen A. Olweny Sign…………………….. Date…………………
MSC/BE/00067/017
Supervisor
This research project has been submitted for examination with my approval as the University
Supervisor
Dr. Benjamin Ombok (PhD) Sign……………….. Date……………
Lecturer, Department of Finance and Accounting
School of Business and Economics
Maseno University

iii
ACKNOWLEDMENT
I am grateful to almighty God for leading me through to the end of this project, my deepest
appreciation to my supervisor Dr. Ombok who worked tirelessly to ensure I made it to this
end, I extend my gratitude to Dr. Mulee , my classmates and my Parents who were a source
of motivation throughout this journey.

iv
DEDICATION
This Research Project is dedicated to my Family for their prayers and support all the way.
v
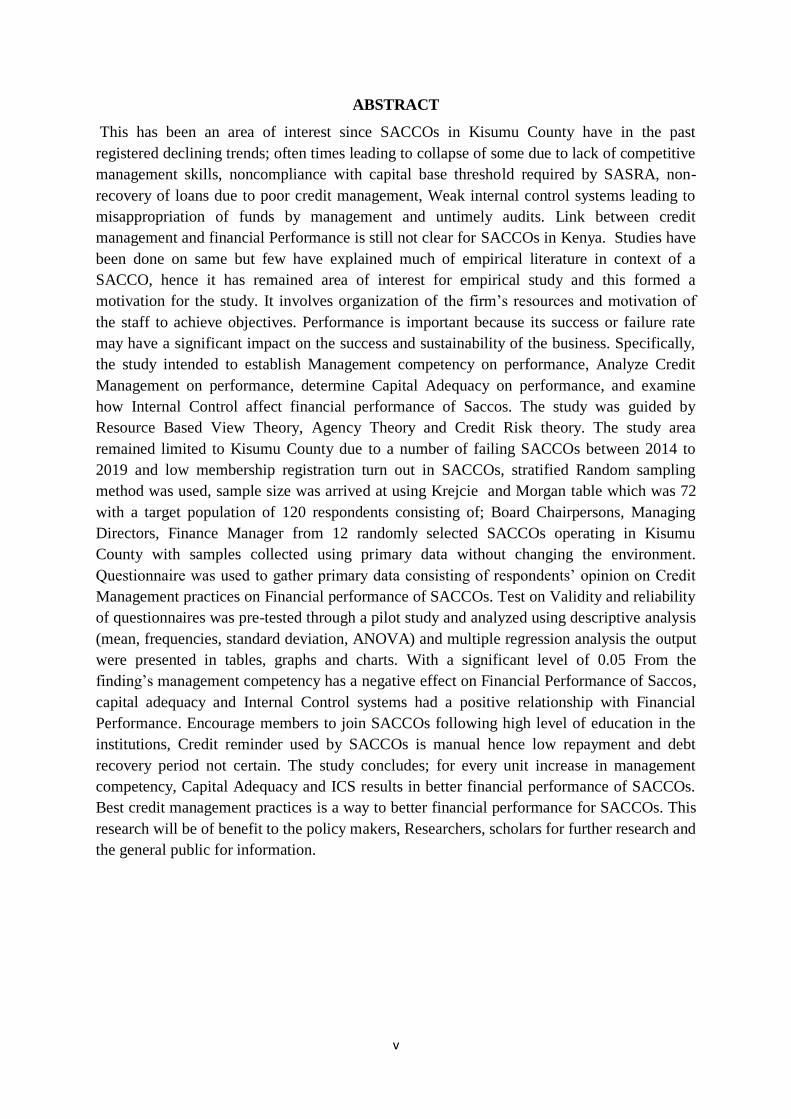
ABSTRACT
This has been an area of interest since SACCOs in Kisumu County have in the past
registered declining trends; often times leading to collapse of some due to lack of competitive
management skills, noncompliance with capital base threshold required by SASRA, non-
recovery of loans due to poor credit management, Weak internal control systems leading to
misappropriation of funds by management and untimely audits. Link between credit
management and financial Performance is still not clear for SACCOs in Kenya. Studies have
been done on same but few have explained much of empirical literature in context of a
SACCO, hence it has remained area of interest for empirical study and this formed a
motivation for the study. It involves organization of the firm‟s resources and motivation of
the staff to achieve objectives. Performance is important because its success or failure rate
may have a significant impact on the success and sustainability of the business. Specifically,
the study intended to establish Management competency on performance, Analyze Credit
Management on performance, determine Capital Adequacy on performance, and examine
how Internal Control affect financial performance of Saccos. The study was guided by
Resource Based View Theory, Agency Theory and Credit Risk theory. The study area
remained limited to Kisumu County due to a number of failing SACCOs between 2014 to
2019 and low membership registration turn out in SACCOs, stratified Random sampling
method was used, sample size was arrived at using Krejcie and Morgan table which was 72
with a target population of 120 respondents consisting of; Board Chairpersons, Managing
Directors, Finance Manager from 12 randomly selected SACCOs operating in Kisumu
County with samples collected using primary data without changing the environment.
Questionnaire was used to gather primary data consisting of respondents‟ opinion on Credit
Management practices on Financial performance of SACCOs. Test on Validity and reliability
of questionnaires was pre-tested through a pilot study and analyzed using descriptive analysis
(mean, frequencies, standard deviation, ANOVA) and multiple regression analysis the output
were presented in tables, graphs and charts. With a significant level of 0.05 From the
finding‟s management competency has a negative effect on Financial Performance of Saccos,
capital adequacy and Internal Control systems had a positive relationship with Financial
Performance. Encourage members to join SACCOs following high level of education in the
institutions, Credit reminder used by SACCOs is manual hence low repayment and debt
recovery period not certain. The study concludes; for every unit increase in management
competency, Capital Adequacy and ICS results in better financial performance of SACCOs.
Best credit management practices is a way to better financial performance for SACCOs. This
research will be of benefit to the policy makers, Researchers, scholars for further research and
the general public for information.

vi
TABLE OF CONTENTS
TITLE PAGE…………………………………………………………………………………..i
DECLARATION .................................................................................................................................. ii
ACKNOWLEDMENT ........................................................................................................................ iii
DEDICATION ..................................................................................................................................... iv
ABSTRACT ......................................................................................................................................... v
TABLE OF CONTENTS ..................................................................................................................... vi
ABBREVIATIONS AND ACRONYMS ............................................................................................ ix
LIST OF TABLES ................................................................................................................................ x
LIST OF FIGURES ............................................................................................................................ xii
CHAPTER ONE: INTRODUCTION .......................................................................................... 1
1.1 Background of the Study................................................................................................................. 1
1.2 Statement of the Problem ................................................................................................................ 6
1.3 General Objective of the Study ....................................................................................................... 7
1.4 Specific Objective ........................................................................................................................... 7
1.5 Research Hypothesis ....................................................................................................................... 7
1.6 Significance of the Study ................................................................................................................ 7
1.7 Conceptual Framework ................................................................................................................... 8
Figure 1.1: Conceptual Framework ....................................................................................................... 8
CHAPTER TWO: LITERATURE REVIEW ............................................................................. 9
2.1 Introduction..................................................................................................................................... 9
2.2 Theoretical Literature Review ......................................................................................................... 9
2.2.1 Resource Based View Theory ...................................................................................................... 9
2.2.2 Agency Theory .......................................................................................................................... 10
2.2.3 Credit Risk Theory ..................................................................................................................... 12
2.3 Criticism of the Theories............................................................................................................... 13
2.4 Empirical Review ......................................................................................................................... 14
2.5 Determinants of Financial Performance ........................................................................................ 15
2.5.1 Management Competency and Financial Performance .............................................................. 16
2.5.2 Credit Management and Financial Performance ........................................................................ 19
2.5.3 Capital Adequacy and Performance ........................................................................................... 21
2.5.4 Internal Control Systems and Audit on Financial Performance.................................................. 21
2.5.5 Government Regulation Policy (SASRA) .................................................................................. 22
2.6 Knowledge Gap ............................................................................................................................ 23

vii
CHAPTER THREE: RESEARCH DESIGN AND METHODOLOGY..................................... 24
3.1 Introduction................................................................................................................................... 24
3.2 Research Design ........................................................................................................................... 24
3.3 Study Area .................................................................................................................................... 24
3.4 Target Population .......................................................................................................................... 24
3.5 Sample Size and Sampling Procedure ........................................................................................... 25
3.6 Data Collections Instruments ........................................................................................................ 26
3.6.1 Data collection and Procedure.................................................................................................... 26
3.6.2 Reliability of the Instruments ..................................................................................................... 27
3.6.3 Validity of Instruments .............................................................................................................. 27
3.6.4 Data Analysis ............................................................................................................................. 27
3.7 Data Presentation .......................................................................................................................... 28
3.8 Ethical Considerations .................................................................................................................. 28
CHAPTER FOUR: DATA ANALYSIS, RESULTS AND DISCUSSION .................................. 29
4.1 Introduction................................................................................................................................... 29
4.2 Descriptive Results Analysis......................................................................................................... 29
4.2.1 Management Competency .......................................................................................................... 32
4.2.2 Credit Criteria ............................................................................................................................ 34
4.2.2.1 Credit Reminder Duration ....................................................................................................... 39
4.2.2.2 Recuperating Loans................................................................................................................. 40
4.2.2.3 Borrowing Limit ..................................................................................................................... 44
4.2.3 Capital Adequacy ....................................................................................................................... 46
4.2.4 Internal Control Systems and Audit ........................................................................................... 49
4.2.7 Impact of SASRA on Ownership ............................................................................................... 51
4.3 Summary and interpretation of the Findings ................................................................................. 65
4.3.1 Management competency........................................................................................................... 65
4.3.2 Capital Adequacy ....................................................................................................................... 66
4.3.3 Internal control systems and audit .............................................................................................. 66
4.3.4 SASRA regulations .................................................................................................................... 66
CHAPTER FIVE: SUMMARY, CONCLUSION AND RECOMMENDATIONS ..................... 67
5.1 Introduction................................................................................................................................... 67
5.2 Summary of Findings and Interpretations ..................................................................................... 67
viii
5.3 Conclusion .................................................................................................................................... 68
5.4 Limitations of the Study ................................................................................................................ 68
5.5 Recommendations and Further Research ...................................................................................... 68
REFERENCES ......................................................................................................................... 70
APPENDICES .......................................................................................................................... 75

ix
ABBREVIATIONS AND ACRONYMS
CAMEL - Capital Adequacy, Asset quality, Management Efficiency,
Earnings Quality, Liquidity Position
GDP - Gross Domestic Product
ICA - International Co-operative Alliance
KUSCCO - Kenya Union of SACCOs & Credit Co-operative Limited
MFI - Micro Finance Institutions
RBV - Resource Based View
SACCOs - Savings and Credit Cooperative Societies
SASRA - Sacco Societies Regulatory Authority
SMEs - Small and Medium Enterprises
VRIN - Valuable, Rare, Inimitable, Non-substitutable
ICS - Internal Control System
KALEIDOSCOPIC - Constant Changes

x
LIST OF TABLES
Table 3.1: Target Population....................................................................................................25
Table 3.2: Sample Size ............................................................................................................26
Table 4.1: Position/rank ...........................................................................................................29
Table 4.2: Gender.....................................................................................................................30
Table 4.3: Age ..........................................................................................................................30
Table 4.4: Number of years worked ........................................................................................31
Table 4.5: Level of Education ..................................................................................................31
Table 4.6: Influence of revenue growth ...................................................................................32
Table 4.7: Encourage more members to join ...........................................................................33
Table 4.8: Improve decision making .......................................................................................33
Table 4.9: Has little impact ......................................................................................................34
Table 4.10: Income ..................................................................................................................34
Table 4.11: Character, reputation and credit History ...............................................................35
Table 4.12: Existing personal debt...........................................................................................35
Table 4.13: Employment history..............................................................................................36
Table 4.14: Potential for long term credit ................................................................................37
Table 4.15: Ability to repay the loan .......................................................................................37
Table 4.16: Credit Reminder....................................................................................................38
Table 4.17: After 1 to 3 months ...............................................................................................39
Table 4.18: After 3 to 6 months ...............................................................................................39
Table 4.19: After 6 to 9 months ...............................................................................................40
Table 4.20: Follow up guarantor to pay ...................................................................................40
Table 4.21: Claim with insurance ............................................................................................41
Table 4.22: Sue member by court ............................................................................................41
Table 4.23: Public auction of private property ........................................................................42
Table 4.24: Member to pay loan without interest ....................................................................43
Table 4.25: Three times savings ..............................................................................................44
Table 4.26: Six times savings ..................................................................................................44
Table 4.27: Minimum of three times savings ..........................................................................45
Table 4.28: Minimum of six times savings ..............................................................................45
Table 4.29: Ability to pay ........................................................................................................46
Table 4.30: Separating members Deposit from Capital ...........................................................46
Table 4.31: Defining and calculation of rations.......................................................................47

xi
Table 4.32: Reduced member payout ......................................................................................47
Table 4.33: Restricted avenues for investment ........................................................................48
Table 4.34: Reduced Lending capacity ....................................................................................48
Table 4.35: Up to date accounting policies and procedure manuals ........................................49
Table 4.36: Are personnel policies maintained and distributed ...............................................49
Table 4.37: Is an Internal Audit manual in use ........................................................................50
Table 4.38: Is the ICS cost effective for the SACCO ..............................................................50
Table 4.39: Implementing ICS is a full proof of efficiency .....................................................51
Table 4.40: Ownership .............................................................................................................51
Table 4.41: Governance ...........................................................................................................52
Table 4.42: Accountability.......................................................................................................53
Table 4.43: Management Efficiency ........................................................................................53
Table 4.44: SASRA Role .........................................................................................................54
Table 4.45: Government support .............................................................................................54
Table 4.46: It influences customer's confidence and trust .......................................................55
Table 4.47: Attracts investors to save with the SACCO ..........................................................56
Table 4.48: It provides staff job security .................................................................................56
Table 4.49: It ensures healthy returns to the shareholders .......................................................57
Table 4.50: Indicator of sustainability .....................................................................................57
Table 4.60 Correlation of Credit management practice and management Competency .........58
Table 4.61 Correlation of Credit management practice and Financial Performance ...............60
Table 4.62 Correlation of Credit management practice and capital Adequacy .......................62
Table 4.63 Correlation of Credit management practice and ICS .............................................64

xii
LIST OF FIGURES
Figure 1.1: Conceptual Framework ...........................................................................................8
Figure 4.1: Influence of Revenue Growth ...............................................................................32
Figure 4.2: Employment History .............................................................................................36
Figure 4.3: Credit Reminder ....................................................................................................38
Figure 4.4: Sue Member by Court ...........................................................................................42
Figure 4.5: Member to pay Loan without interest ...................................................................43
Figure 4.6: Ownership .............................................................................................................52
Figure 4.7: Government Support .............................................................................................55
Figure 4.8: Indicator of Sustainability .....................................................................................58

1
CHAPTER ONE
INTRODUCTION
1.1 Background of the Study
The Cooperative societies are autonomous association of persons united voluntarily to meet
their common economic and social needs through jointly owned and democratically
controlled enterprises, which are organized and operated under the principles of cooperatives
(ICA, 2005). In 1942 Ivan Emalianoff, a respected cooperative scholar remarked that the
diversity of cooperatives is kaleidoscopic and their variability is literally infinite, as
consequence of this diversity no universally accepted definition of cooperatives exist
(Kimberly & Robert 2003). A cooperative society is a group of individuals who have
specific common needs. It is an economic enterprise, the purpose of which is to improve the
economic status of owners or members. Most cooperative societies offer their products to
their members and others do not serve non-member.
The traditional form of co-operative development involved working together on farms,
hunting and gathering. All people have basic needs of food, shelter, security and belonging.
People would invite neighbors to come and give a hand. Also people did not have money and
resources, which enables individuals to employ people or machinery to do work for them. In
any community co-operative usually exists in the form of associations of people who come
together as a group driven by their social and economic needs in order to cope with their
problems and improve their conditions of living MOCD (2006).
The general objective of SACCOs is to promote the economic interests and general welfare
of its members. Co-operatives were formed with an intention of helping individuals meet
their financial goals, equality, democratic rights and togetherness between members with
same goals. According to Bibby and Shaw (2005) Co-operative members believe in the
ethical values of honesty, openness, social responsibility, and caring for others. ICA (2005)
defines cooperatives as community institutions voluntarily and autonomously established and
managed by the communities, and also give services for the local communities. As Clement
(2012) asserts, SACCOs have the ability and opportunity to reach clients in areas that are
unattractive to banks, such as rural or poor areas. This has made the SACCOs to be more
attractive to customers, thus deeply

2
entrenching themselves in the financial sectors of many countries (Munyiri. 2006). In Kenya,
co-operatives movement were started in 1908 and membership was limited to white colonial
settlers. The first co-operative was established at Lumbwa in Kipkelion area in Kericho
County. In 1944 colonial officers allowed Africans to form and join cooperatives (Gamba and
Komo, 2012). Today, SACCOs have mobilized over Kshs.200 billion in savings, accounting
for over 30% to National Domestic Saving (Co-operative Bank of Kenya, 2010).
SACCOs have continued to play a very important role in the economy by providing
employment to the youth and enhancing economic activities in the rural areas by improving
the living standards of the people. The phenomenon of fast growth of SACCOs in Kenya in
the last two decades is as a result of provision of credit for a wide range of purposes and on a
relatively affordable terms and conditions. Credit suits different categories of borrowers
including the disadvantaged groups especially women (Alila and Obado, 1990). Today co-
operatives particularly SACCOs are integral part of the government economic strategy
focusing on creating income generating opportunities especially in rural areas by providing
cheap loans to start up small businesses hence poverty alleviation. Kenya has been a success
as far as the Co-operative Movement is concerned. It is estimated that there are currently over
10,800 registered Cooperative Societies in Kenya with a membership of about 6 million. Out
of this, 46% are Agricultural, 38% Financial-based that is SACCOS and, 16% are others
(EAL Mumanyi 2014). 63% of the Kenyan population depends on the Co-operative related
activities for their livelihood with over 250,000 benefiting through direct employment
(Mudibo, 2005).
Financial Performance is the end result of organizations departments‟ activities and strategic
objectives (Jensen, 2001). Al-Hussein (2009) defines performance as the level to which
monetary goals has been attained. Financial Performance on the other hand is defined as
measure of how well an organization utilizes its resources to generate income and maximize
profits. Financial Performance is the central element for any profit based organization. It‟s
the procedure of assessing the outcome of a firm policy and activity in financial language.
Therefore, financial performance is how well a company uses its resources to earn revenues;
this is done over time and may be used in comparison to same organizations within a similar
industry or to compare different sectors. Financial performance is used in various analyses,
trade creditors are able to know the liquidity of

3
the firm, Bond holders are able to predict future profitability of the firm through cash flow
analysis, the management will show better performance with improved internal controls in
place. Factors affecting financial performance of a firm include; funding which relies on how
much is available for operations through owner equity, credit borrowing from financial
institutions at a cost, Tools used in financial performance include; accounting techniques e.g.
Earnings before Interest and Tax, Ratio Analysis, Credit risk e.g. Equity to Debt Ratio used
to measure the vulnerability of a company, Size of the Firm, Working Capital. Generally, if
an organization is able to meet its objective by maximizing shareholder wealth and is a going
concern, in that it is able to meet its obligation as and when they fall due is a positive sure
way of the financial performance position of an organization.
The performance of firms can be affected by internal and external factors DT-SACCOs that
are required to maintain an external borrowing to total assets ratio of not more than 25%, as
observed the overall aggregate external borrowing ratio stayed with the statutory maximum
of not more than 25%, by registering a continuous improvement reflected a reduction to
4.83% in 2017 from 5.04% in 2016. This proves that more and more DT-SACCOs are
slowly moving away from external borrowing in the funding of their asset portfolio.
However, the gains made on this front were literally wiped way by the increase in aggregate
cost of borrowing from 4.13% in 2016 to 4.70% in 2017. Total Assets of deposit taking
SACCOs increased by 12.4% to 497.32 Billion in 2017 according to data from Economic
survey. While internal factors are individual characteristics which affect the financial
institution's performance, macroeconomic factors are external to the institutions (Al-Tamimi,
2010).
Management competency, Johnson, George, Ndiwalana, Freddie (2014) on a study of
managerial competency on financial performance of SACCOs in Busoga concluded that
improvement in the managerial competency of the SACCOS is associated with improvement
in their financial performance. Particularly, it implies that an improvement in the skills and
knowledge of the Managers for these SACCOS is associated with an improvement in their
profitability and portfolio quality. Similarly, a decline in the skills and knowledge of the
managers is associated with a decline in the profitability and portfolio quality of these
SACCOS. Izak, (2008) states that the competitive advantage of a bank is dependent on its
capability to handle credit valuably that is embedded in the

4
lending design. He asserts that SACCOs today in Kenya are facing stiff competition from
other financial institutions which are offering affordable, reliable and efficient services to
their customers.
The secret to outperforming competitors has thus become increasingly dependent on the
levels of performance delivered by an organization‟s employees. Whereas one of the
environmental influences to a business normally arises from competition Pearce and
Robinson (2005), states that companies need to come up with strategies that gives them a
competitive advantage over the others in the market that they operate in. Furthermore, the
demands and needs of the environment are constantly evolving and management is about
adjusting the company according to the needs and demands of the environment. On the other
hand, Thompson and Strickland (2007) argue that a company has sustainable competitive
advantage whenever it has an edge over its rivals in securing customers and defending against
competitive forces. From the foregoing, SACCOs should constantly review their
product/service strategies in order to remain relevant and competitive in the financial
industry, based on the fact that customer preferences keep changing which also affect the
demand of a given offering. While competitive skills can be achieved through skills and
knowledge by managers, this is not practically put in place by SACCOs as they employ
managers who are not having enough skills and knowledge on management to perform.
Credit management are methods and strategies adopted by a firm to ensure that they
maintain an optimal level of credit and its effective management (Brealey and Myers, 2003).
The core function of every SACCOs is provision of credit facilities. The credit management
function facilitates efficient management and administration of SACCOs loan portfolio in
order to ensure equitable distribution of funds and to encourage members to take loans. The
general aim of credit management is to reduce the possibility of potential losses with regard
to issued loans. Loans are provided according to strict criteria, those criteria must cover
information about the client, loan purpose, repayment source and collateral. According to
Njanike (2009) the main activity of bank is not deposit mobilization and giving credit but
effective credit risk management that reduces the risk of customer default. Kifle (2011) in
his study explains that SACCOs sustainability requires that they cover all transaction costs
(loan losses, financial costs, and administrative costs) with return on equity and
consequently function without

5
subsidies. Gisemba (2010) researched on the relationship between risk management
practices and financial profitability of SACCOs found out that the SACCOs adopted various
approaches in screening and analyzing risk before awarding credit to client to minimize loan
loss. Nelson (2012) defines credit management a practice used by organizations to manage
the sales they make on credit. Therefore, for SACCOs to perform better they need to
improve their profitability, credit may be overstated as a constraint because SACCOs tend
not to view their own management weaknesses as limiting their ability to use the borrowed
credit effectively and hence investing in risky models that take longer duration of time to
recover from its members hence loan recovery is still a major problem.
Capital Adequacy Capital has always been used as a measure of financial stability for
SACCOs this encourages members to deposit more knowing that their savings are safe.
Capital adequacy is the amount of capital that is deemed sufficient for an organization to
survive in a foreseeable future in order to survive some major risks; operational risk, market
risk, interest rate risk.
According to (Jane, Barus, Dr. Muturi, Dr. koima, 2009) SACCOs should shift their
concentration from increasing capital level to credit risk management this will result in
improvement in the financial performance of SACCOs. Deposit taking SACCOs are
supposed to maintain a core capital to asset ratio of 10% which 11 SACCOs failed to meet,
this shows an increase in non-compliance from 6 SACCOs in 2016 to 11 in 2017 (SASRA
2018). According to (Diamond, 2000) sufficient capital level reduces chances of distress.
Capital Asset ratio is deemed accurate to measure the capability of banks to curb losses
incurred in the face of crisis (Dang, 2011). Regulation requires SACCOs to have a minimum
capital base of 10million and members not less than 30, but due to inadequate capital base by
SACCOs has led to SASRA denying many licenses and informing the public not to invest in
these SACCOs e.g. Urithi SACCO that has been investing on real property investment yet
has no enough capital to sustain these investments prompting members to withdraw their
membership and hence turn to Banks for Loans.
Internal controls and Audit SACCOs should have an independent internal system for
assessment of the credit risk management process. This function is necessary in order to
independently enable the board determine whether the risk management process is

6
working effectively (SASRA, 2015); it further asserts that ICS audit should be conducted on
a periodic basis and ideally not less than once a year. The audits should also identify
weaknesses in the credit risk management process e.g. misappropriating member deposits by
presenting figures with what is actually reported in the books and any deficiencies in the
policies and procedures. Internal control systems are intended primarily to enhance the
reliability of financial performance, either directly or indirectly by increasing accountability
among information providers in an organization (Jensen, 2003). (T. Chepngeno, 2017) The
study established that to implement good internal audit independent managers need to be
concerned about good interrelationship between internal audit independent and financial
performance and therefore need to continuously updating themselves with the changing times
and technology. Management should design internal controls to ensure efficiency and
effectiveness, reliability of financial reporting as well as compliance with laws and
regulations. This can be achieved by periodic performance review and evaluation of the
adequacy and effectiveness of the controls designed by the internal auditor department,
Policies, procedures, and mechanisms should be put in place to ensure directives of the
management are properly carried out (Ndungu, 2013). Despite efficient ICS and audit in
place SACCOs still face issues of Cybercrimes, losing money or data to unethical system
hackers because of lack of proper security system in place which cooperatives are still not
well prepared to confront, rogue officials misappropriating member deposits and this cannot
be achieved due weak internal controls systems in place and Audit that are not carried out
timely. Audits should identify weaknesses in the credit management process and any
deficiencies in the policies and procedures, this should be done periodically and not less than
a year to ensure efficiency and adherence to accounting policies are met.
1.2 Statement of the Problem
Credit management practices and financial performance of SACCOs in Kenya have not been
clear and conclusive. Various researches carried out mostly have dwelt on financial
performance and not attributing same to credit management whereas it is the core of many
SACCOs. While competitive skills can be achieved through continuous training of managers,
this is not practically put in place by SACCOs as they employ managers who are not having
enough skills and knowledge on management for SACCOs to perform better. Efficient credit
management is required for SACCOs to be profitable even though credit may be overstated
as a constraint because SACCOs tend not to view their own

7
management weaknesses as limiting their ability to use the borrowed credit effectively and
hence investing in risky models that take longer duration of time to recover from its members
hence loan recovery is still a major problem. The government regulatory body SASRA has
maintained that Deposit taking SACCOs are supposed to maintain a core capital to asset ratio
of 10% which 11 SACCOs failed to meet in the year 2017, this shows an increase in non-
compliance from 6 SACCOs in 2016 to 11 in 2017 this has led to SASRA denying many
SACCOs licenses to operate. Despite efficient ICS and audit in place SACCOs still face
issues of Cybercrimes, losing money or data to unethical system hackers because of lack of
proper security system in place which cooperatives are still not well prepared to confront,
rogue officials misappropriating member deposits and this cannot be achieved due weak
internal controls systems in place and Audit that are not carried out timely.
1.3 General Objective of the Study
The main objective of the study is to determine the credit management practices that
influence financial performance of SACCOs in Kisumu County, Kenya.
1.4 Specific Objective
1. To determine the extent to which management competency influence financial
performance of SACCOs
2. To analyze how capital Adequacy influence financial performance of SACCOs
3. To determine the extent to which internal control system & Audit influence financial
performance of SACCOs
1.5 Research Hypothesis
1. Management competency does not influence financial performance of SACCOs
2. Capital adequacy does not influence financial performance of SACCOs
3. Internal control systems and audit does not influence financial performance of
SACCOs
1.6 Significance of the Study
The research would establish the credit management practices that influence performance of
SACCOs in Kenya. The findings of this study will benefit the policy makers who include
SASRA and other regulatory bodies that manage SACCOs in Kenya. This will

8
provide information on the appropriate techniques in Management competency, Credit
management, maintaining good capital base, to be adopted in decision and policy making.
Stakeholders of SACCOs in Kenya will also have the opportunity to monitor their
investments in the SACCO and this will avoid risky investment of funds which could lead to
failure of SACCOs.
This study would be of value to researchers and scholars, as it forms a basis for further
research. The researchers may use this study as a basis for discussions on SACCOs business
in Kenya and the factors that influence their performance. The research findings will provide
information to people on how to create an asset that helps them to have a guarantee and
collateral for future loan access and by encouraging and promoting ideas on how to develop
thrift culture within the members as well as the community by teaching wise use of their
money and efficient management of their limited resources by employing trained and well
conversant managers to manage their deposits.
1.7 Conceptual Framework
A conceptual framework is a systematic representation between the relationship of variables
and congregative map. It consists of the independent and dependent variables.
Figure 1.1: Conceptual Framework
Source; Researcher 2019
Financial
Performance of SACCOs
Revenue Growth
& Efficiency
Credit Management
Management
Competency
Capital Adequacy
Internal Control
Systems & Audit
Independent variables Dependent variables

9
CHAPTER TWO
LITERATURE REVIEW
2.1 Introduction
This chapter discusses issues that address each subsection derived directly from research
questions of the study. Recent research studies and findings relating to the issues this study
addresses will also be highlighted. This chapter is organized in the following sections;
theoretical literature review, empirical literature review and the conceptual framework.
2.2 Theoretical Literature Review
This paragraph gives a brief overview of the theories on which this study will be built. Over
the years, the theories of organization performance have evolved from simplest models to
complex modeling techniques. Many organizations, regardless of their size and management
systems have pursued performance excellence by applying different strategies based on
theories that are suitable to their performance. These theories include the following:
2.2.1 Resource Based View Theory
Resources can be defined as economic or productive factor required to accomplish an
activity, or as means to undertake an enterprise and achieve desired outcome. Kay (1999)
defines resources as inputs into a firm‟s production process, such as capital, equipment, and
the skills of individual employees, patents, finance, and talented managers. Resources can
either be tangible or intangible in nature; tangible assets are physical thing such as, Land,
buildings, machinery, equipment and capital. Physical resources can easily be bought in the
market so they confer little advantage to the companies in the long run because rivals can
soon acquire the identical assets. On the other hand, intangible assets are everything else that
has no physical presence but can still be owned by the company.
Brand reputation, trademarks, intellectual property are all intangible assets. Unlike physical
resources, brand reputation is built over a long time and is something that other companies
cannot buy from the market. Intangible resources usually stay within a company and are the
main source of sustainable competitive advantage.
The Resource-Based framework shows that the foundation of a firm‟s competitive advantage
comes from its internally generated resources rather than from the external environment. This
view forecasts that definite types of resources possessed and controlled by organizations have
10
the stimulus to generate competitive advantage and superior firm performance. The resource-
based theory views firms with above average internal control systems and structures as being
profitable not because they engage in strategic projects that may discourage entry and
increase prices above long run costs, but because they have markedly lower costs, and high
quality product performance is offered (Mutunga, Minja and Gachanja 2014). The theory
clarifies that for the organization to attain Sustained Competitive Advantage it must acquire
and control prized, infrequent, unique, and non-substitutable resources and capabilities, in
addition organizations must plan on how to improve their ICS and Audits.
Capability and resources must have value, uncommon, matchless, and with no close
substitutes to generate sustainability of competitive advantage. The theory appraises and
categorizes a firm‟s strategic advantages centered on examining its individual mixture of
assets, skills, capabilities, and intangibles of an organization (Mutunga, Minja and Gachanja
2014) The fundamental premise of the theory is that organizations proper management in
having a good corporate governance is one of the elements in evaluating firm‟s performance
and sustainability. Each organization develops proficiencies from these resources, and when
advanced especially well, this becomes the source of the firm‟s competitive advantages and
through intervening effect of innovation, the resources influence implementation. The theory
further explains that firms need to grow and diversify; capital is used to establish strategies to
improve overall efficiency.
2.2.2 Agency Theory
Agency theory is a management and economic theory that attempts to explain relationships
and self-interest in business organizations. It describes the relationship between the principal
such as shareholders and agents such as company‟s executive. It explains how best to
organize relationships in which one party (principal) determines the work and which another
party (agent) performs or makes decisions on behalf of the principal (Jensen and Meckling
1976).Agency theory is the study of the agency relationship and the issues that arise from
this, particularly the dilemma that the principal and agent, while nominally work toward the
same goal, may not always share the same interests. The literature on agency theory largely
focuses on methods and systems and their consequences that arise to try to align the interests
of the principal and agent.
Haule (2011) noted that in SACCOs setting, members elect board of directors to manage it on
their behalf. Given this fact, it follows that there exists a Principal agent relationship within

11
SACCOs. According to Guevas and Fischer (2006) in SACCOs, the main problem of
Principal agent relationship could involve conflicts of interest among them. These conflicts
are likely to impact more negatively in when the SACCOs are very large because these
provide more opportunities for agents to maximize their own interests Yegon et al., (2004).
Agency costs usually refer to the conflicts between shareholders and their company's
managers. A shareholder wants the manager to make decisions which will increase the share
value. Managers, instead, would prefer to expand the business and increase their salaries,
which may not necessarily increase share value. Wheelen and Hunger (2002) argues that
problems arise in corporations because agents (top management) are not willing to bear
responsibility for their decisions unless they own a substantial amount of stock in the
corporation. Parker (2002) also argues that managers will not act to maximize returns to
shareholders unless appropriate governance structures are implemented to safeguard the
interests of shareholders. The theory suggests that a firm‟s top management should have a
significant ownership of the firm in order to secure a positive relationship between
governance and the amount of stock owned by the top management (Mallin, 2004).
Like Mitnick, Jensen and Meckling (2011) identify monitoring the agent's actions as a source
of agency cost, but they also identify at least two other sources: bonding costs borne by the
agent (such as, foregoing certain non-pecuniary benefits, etc.), and the wealth loss borne by
the principal when the agent's actions do not maximize his welfare. Agency theory by Jensen
and Meckling (1976) predicts that higher levels of managerial ownership should result,
holding other things constant, in increased firm performance as higher ownership levels help
to mitigate the inherent conflict of interest between managers and owners.
The underlying assumption of agency theory is based on the economic model of man interest
(Rodriguez and Mejia 2012). This model assumes that individuals will seek to
optimize their own utility. In the principal-agent relationship, an agent is hired to maximize
the principal‟s utility. However, agency theory assumes agents will instead behave
opportunistically because they too are self-serving. Therefore, the principal enacts
mechanisms to minimize losses to their own utility (Wiseman et al., 2012).

12
2.2.3 Credit Risk Theory
In banking terminology, credit refers to the loans and advances made by the bank to its
customers or borrowers. Bank credit is a credit by which a person who has given the required
security to a bank has liberty to draw to a certain extent agreed upon. It is an arrangement for
deferred payment of a loan or purchase. Risk means the exposure to a chance of loss or
damage. Risk is the element of uncertainty or possibility of loss that exist in any business
transaction. (Basel Committee on Banking Supervision, 2000) defines credit risk is the
likelihood that a borrower or counter party will be unsuccessful to meet its obligation in
accordance with agreed terms and conditions.
According to Clifford (2014) one of the major risks that banks faces is from borrowers who
default on their obligations to the bank. The financial crisis of 2008-2009 underscores the
need to pay close attention to the level of credit risk that, at that time, drove a number of
banks with household names such as Countrywide Financial and Washington Mutual out of
existence, largely due to excessive amounts of mortgage credit risk on their balance sheets. In
order to control the bad debt rate and credit risk, every bank has the credit policies. Normally,
those policies will include risk identification, risk measurement, risk grading techniques, risk
control techniques and other document about legal issues (Bangladesh Bank report 2005).
A credit default represents the financial failure of an entity (a person or a company). A theory
of credit default should therefore represent a systematic understanding of the causes which
directly lead to the effects which are associated with credit defaults. Such a theory is required
to provide direct causal connections between macroeconomic causes of changing financial
environment and their microeconomic effects on changing personal or corporate financial
conditions, leading to possible credit defaults.
Credit management serves as an excellent way for a business to remain financially stable.
The process of credit management begins with accurately assessing the credit worthiness
of the customer base. It also calls for determining the total credit line that will be extended to
a given customer for example gathering data on the potential customer‟s current financial
condition including current credit score and the ratio between income and outstanding
financial obligation. Competent credit management seeks to not only protect the vendor from
possible losses, but also protect the customer from creating more debt obligations that cannot
be settled in a timely manner.

13
2.3 Criticism of the Theories
As far as the above discussed theories try to explain factors that influence performance of
financial organization in this context (SACCOs), there is a set of knowledge gaps that they
fail to give satisfactory information.
According to Priem and Butler (2001) the theory misses managerial implications or
operational validity. The resource-based view explains that managers have to develop and
obtain strategic resources that meet the criteria valuable, rareness, non-imitable and non-
substitution (VRIN criteria) and how an appropriate organization can be developed.
However, the resource-based view does not explain how managers can do this (Connor,
2002). Priem and Butler (2001) criticize the theory of having infinite regress; the resource-
based view entails infinite regress. Firms which have a capability which they can put in
practice best can be overtaken by a firm that can develop that capability better than firm who
is best in practice (Collins, 1994). Miller (2003) argues that the resources a firm needs to
generate a sustained competitive advantage are precisely those resources that are hard to
acquire in the first place. In one sense, Miller's argument is that only firms that already
possess VRIN resources can acquire and apply additional resources, otherwise competitors
would acquire them with equal ease.
According to Barney (1991) sustained competitive advantage is not achievable. Currently,
firms are in a dynamic environment where innovation and changing is needed to stay ahead
of the competition. According to the resource-based view, a sustained competitive advantage
can be reached if resources are meeting the VRIN criteria. However, in this constant
changing environment, the competitive advantages will be temporary. Aguilera et al., (2008)
challenged agency perspective and termed it as a closed system. They propose an
organizational sociology approach to comparative corporate governance to better capture the
patterned variation that results from interdependencies between firms and their environment.
Their open system perspective view corporate governance in terms of effectiveness in
achieving their goals.
Agency theory has also been criticized by several scholars. Professor Brudney (1985) argues
against the analysis that claims that private bargaining or contract sufficiently restraints
management misbehavior acknowledging instead on the importance of institutions. He argues
that, scattered stockholders lack the requisite information and institutional mechanisms either

14
to bargain over the terms of management‟s employment, or to monitor and control
management‟s activities. The markets for managers and for securities do not effectively
implement investor constraints on management. Outside directors are insufficiently
independent from management to serve as agents for stock-holders in selecting or controlling
management, and too many factors, and possibly information imperfections, which affect the
price of stock for it to serve as mechanism for effective investor impact upon managerial
performance.
In section 2.2.3 above, credit risk theory is discussed in depth. From the discussion it is
evident that credit management is one of the pillars of success in performance of any
organization especially financial institution. However, it is also clear that the theory employs
use of complex mathematical models that needs people with strong mathematical background
and analysis skills to compute and implement the theory into the organization.
2.4 Empirical Review
Mante (2002) asserted that very low deposits and high default rates have plunged some rural
banks into serious liquidity problems, culminating in the erosion of customer confidence in
these rural banks/ Micro Finance Institutions (MFIs). He indicated further that a combination
of poor lending practices and ineffective monitoring of credit facilities extended to customers
has contributed to high loan delinquency in some MFI. The performance of MFIs is highly
affected by savings portfolio because it ensures liquidity. Consistent with Cull, et al., (2007)
MFIs should therefore broaden their services toward offering more deposits. This is
important as it would also broaden the lending capacity of MFIs hence contributing towards
better performance.
Rosenberg (2009) stated that the poor are generally excluded from the financial services
sector of the economy, so MFIs have emerged to address this market failure. By addressing
this gap in the market in a financially sustainable manner, an MFI can become part of the
formal financial system of a country and so can access capital markets to fund their lending
portfolios, allowing them to dramatically increase the number of poor people they can reach
(Otero, 1999). Efficiency and productivity ratios are used to determine how well MFIs
streamline their credit operations. He also noted that MFIs need to employ a combination of
performance indicators such as profitability, operating efficiency and portfolio quality
indicators to measure their overall performance.

15
According to Silikhe (2008), credit risk management in MFIs in Kenya found out that despite
the fact that they have put in place strict measures to credit risk management, normal loan
recovery is still a challenge to majority of the institutions. This explains the reasons why most
financial institutions are either not growing or about to close down. Bird in hand theory
proposes that a relationship exists between firm value and dividend pay-out. It states that
dividends are less risky than capital gains since they are more certain. Investors would
therefore prefer dividends to capital gains (Amidu, 2006).
Dash and Das (2010) analyzed the banking sector of India using CAMELS model the
analysis was performed for a sample of fifty-eight banks operating in India, of which twenty-
nine were public sector banks, and twenty-nine were private sector/foreign banks. The study
covered the financial years 2003-04, 2004-05, 2005-06, 2006-07, and 2007-08. The data for
the study consisted of financial variables and financial ratios based on the CAMELS
framework. The results show that private banks / foreign banks are better than the public
sector banks thus these two factors are in order to improve the performance of private banks
/ foreign-run and accurate profitability. The results of the study suggest that public sector
banks have to adapt quickly to changing market conditions, in order to compete with
private/foreign banks. This is particularly due to the wide difference in their credit policy,
customer service, ease of access and adoption of it services in their banking system. Public
sector banks must improve their credit lending policies so as to improve asset quality and
profitability (Dash and Das, 2010).
2.5 Determinants of Financial Performance
Karagu and Okibo (2014) did a study on factors influencing performance of SACCOs in
Kenya. As a result, the study found that funds misappropriation influences performance of
SACCOs as proof of accountability like receipts, source documents to support transactions
could not be traced to the source, lack of proper authorization from relevant department. The
study concluded that SACCOs need to improve on their internal audit department and other
internal control measures. It also established that investment decisions made by SACCOs
influence their performance. It also emerged from the study that SACCOs need to invest in
prudent projects in order to achieve better returns, SACCOs should introduce more products
in order compete with other organizations such as MFIs. SACCOs movement in Kenya has
faced a number of challenges that need to be addressed in order to enable it to improve on

16
soundness and stability, effectiveness and efficiency, corporate governance, product diversity
and competition as well as integration to formal financial system (KUSCCO, 2010) these
challenges are inherent in the financial world in relation to the co-operative movement.
The performance of firms can be affected by internal and external factors. While internal
factors are individual characteristics which affect the financial institution‟s performance,
macroeconomic factors are external to the institutions (Al-Tamimi, 2010).
Poisat (2006) in his study found that improved business performance hinges not only on
improved processes, technology and products but also equally as much on the contributions
of engaged employees. He also claims that the cornerstones of employee engagement and
engaged work performance can be found in constructs of employee motivation, commitment,
organizational citizenship, self-efficacy and employees‟ emotions. Managers who choose to
do everything hamper their own productivity limit their employee performance and any
contribution they do make as managers is often accompanied by frustration and excessive
personal effort. Hence, there is need to integrate delegation with other managerial functions
to increase employee performance.
The SACCOs management should embrace technology in all operations, especially
information communication technology which widens the coverage of SACCOs information
accessibility and increase marketing strategies, so that they can attract more members.
Further the SACCOs should embrace growth strategies including mobile technology
adoption, branch network expansion, Automated Teller Machines (ATMs), research and
marketing initiatives, adoption of agency banking and rebranding i.e.
including change of SACCO names (Ngugi and Kising‟u, 2017). Amara and Wycliffe (2017)
in explaining performance of Mwalimu National SACCOs concludes that good competition
brings about quality goods and services, innovation and that efficiency in provision of goods
and services and that banks and MFIs continue to compete with cooperative societies for the
same savings from the employees. Further the study concludes that competition is
statistically significant.
2.5.1 Management Competency and Financial Performance
Competent management can be defined as the ability to meet organizational objectives, use
available resources efficiently, maintain high levels of employee performance and
professionalism, and provide excellent service to customers. The most competent framework
17
of management includes all the management functions such as; control, motivation, planning,
staffing and how they are implemented in the company. Research on management
competencies were done to analyze, understand and explain the importance of managerial
competencies in the organizations (Martina, 2012). Though, organizations are applying
several models of competencies during the work, but still need to determine the most
effective model to considerer it the essential for good achievements. According to Noebere
(2000) all studies of business failure points to poor management as the main cause. The
success of a firm is measured by its profitability which depends on the efficiency of its
management.
Ligthelm et al., (2002) stated that financial management is a crucial field within the
environment of the SMEs Small and Medium Enterprises thus present numerous potential
obstacles. Mwakajumilo (2011) also revealed that lack of appropriate and adequate
managerial skills or knowledge with the attendant, lack of strategic plan, business plan,
succession plan, adequate organizational set up, transparency and operational systems
hinders growth of SACCOs.
Waiguru (2010) discussed managerial incompetence's in SACCOs as caused by lack of
strategic planning. She noted that the SACCOs lacked a sense of direction as they had no
clear vision and mission statements. The key aspects for management performance include
mix of management competencies, reviewing and engaging top talent for succession
planning, effective board committees, right level of exposure to senior management,
commitment, dedicating enough time to identifying opportunities, board
evaluation, in depth experience, balance of independence and engagement with the right
level of engagement with management and chairman‟s leadership style.
Sambu and Mudibo (2005) raised concern on the caliber of leaders who run SACCOs. Since
they are voluntary organizations, members can elect anybody they like, who may not
necessarily have the skills to run a SACCO. To address this, they further pointed out That
SACCOs members are required through their by-laws to provide for minimum qualifications
for their managers. Actions of top management influence performance. Members when
electing office bearers, including delegates, should ensure that they elect trust worthy
persons since success and performance depends on the caliber of the officials that they elect,

18
(Mwaura, 2005).
Mochache (2005) observed the importance of training and how it enhances growth and
competitiveness of the SME‟s. Training empowers owners and employers to make better
decisions and provide better quality goods and services. He further noted that the training
duration is influenced by the competency required for the particular trade. Managerial skills
are important in making decisions which are non-routine and strategic in nature. In common
with all business requires specific education and training for those who wish to operate it
(Ouma, 1990).
Moreover, Ssekakubo, Ndiwalana and Lwanga (2014) on their study on managerial
competency of SACCOs in Busoga region Uganda concluded that management competency
is significantly positively associated with their financial performance, all effort should be
made to strengthen it, for example the Board performance, transparency and Board
composition of these SACCOs should strengthen so that the skills and knowledge of the
SACCOs managers are enhanced. The skill and knowledge gaps among managers of the
SACCOs in Busoga region need to be identified this should be followed by the necessary
training and development programs in order to bridge these gaps. This will help to improve
the financial performance of these SACCOs. Skills and knowledge must take top priority in
recruitment of new managers for the SACCOs in Busoga region. An assessment tool should
be developed in line with the skills and knowledge elements (Ssekakubo, Ndiwalana and
Lwanga 2014).
In the same context Kombo, Obonyo and Oloka (2014) from the study of delegation on
Employee Performance in SACCOs established that managers rarely delegate to their juniors
for fear of incompetence and these findings forms a basis for further research in determining
to what extent management should delegate and to evaluate the performance of each
employee with regard to organizational goals and objectives. The study will recommend that
managers should embrace delegation as a management function to foster teamwork among
employees in order for them to exert their efforts towards the overall increased
organizational performance. On satisfaction, this study will also recommend that proper
delegation gives employees satisfaction in their work and hence delegation can act as a
motivational factor among employees.
19
2.5.2 Credit Management and Financial Performance
Credit management are methods and strategies adopted by a firm to ensure that they maintain
an optimal level of credit and its effective management (Myers and Brealey, 2003). The core
function of every SACCO is provision of credit facilities. The credit management function
facilitates efficient management and administration of SACCOs loan portfolio in order to
ensure equitable distribution of funds and to encourage members to take loans. The general
aim of credit management is to reduce the possibility of potential losses with regard to issued
loans. Loans are provided according to strict criteria, those criteria must cover information
about the client, loan purpose, repayment source and collateral. According to Njanike (2009)
the main activity of bank is not deposit mobilization and giving credit but effective credit risk
management that reduces the risk of customer default.
According to Martin (2012) it is of importance that the directors and managers of SACCOs
maintain a register of the business assets both the loans to members, and other tangible asset
like furniture, machines and equipment and buildings to be able to identify the risks facing
their assets. Kifle (2011) in his study explains that SACCOs sustainability requires that they
cover all transaction costs (loan losses, financial costs, and administrative costs) with return
on equity and consequently function without subsidies. The first step in limiting credit risk
involves screening clients to ensure that they have the willingness and ability to repay a loan
MFIs use the 5Cs model of credit to evaluate a customer as a potential borrower (Abedi,
2000). The 5Cs help MFIs to increase loan
performance, as they get to know their customers better. These 5Cs are: character, capacity,
collateral, capital and character.
Gisemba (2010) researched on the relationship between risk management practices and
financial profitability of SACCOs found out that the SACCOs adopted various approaches in
screening and analyzing risk before awarding credit to client to minimize loan loss. This
includes establishing capacity, conditions, use of collateral, borrower screening and use of
risk analysis in attempt to reduce and manage credit risks. He concluded that for SACCOs to
manage credit risks effectively they must minimize loan defaulters, cash loss and ensure the
organization performs better increasing the return on assets. Credit risk is the most expensive
risk in financial institutions and its effect is more significant as compared to other risk as it
directly threatens the solvency of financial institution (Chijoriga, 1997).

20
Kalumuna (2011) further pointed out that the effect of SACCOs to disburse big loans or
small size loans to members which is not corresponding to the economic activities of
members. He indicates that over financing of projects leads to loan defaulting as the debtor
lack corresponding investment to service loans, likewise under financing of projects lead to
failure of the projects to generate intended outcomes and therefore the debtor fails to meet
loan obligations. Obadia (2014) in his study in Mbeya City concluded that SACCOs can give
support to small businesses through the provisions of low interest loans and making follow up
to ensure that members use loans according to their intended purposes, while also at the same
time providing trainings to members on how to conduct well their business. Therefore, it is
recommended that SACCOs loans provided to members should be of lower interest rates.
Credit rationing has been found to influence credit demand. Credit rationing is in form of
costs and conditions for obtaining credit. Lenders determine level of credit on probability of
default (Okurut, 2004). Among SACCO members demand for credit has been attributed to
loanable savings, which act as collateral and willingness of other members to act as
guarantors (Makori, et al. 2013).
Duncan, Njeru, Florence and Tirimba (2015) did a study on the effect of loan repayment on
financial performance of Deposit Taking SACCOs in Mount Kenya Region and concluded
that Loan repayment is the obligation of members to ensure that SACCOs have adequate cash
to meet new member‟s loan obligation. They noted that there were huge
credit risks encountered among different SACCOs, hence the need of the management to
ensure there are improved policies on credit policy and this will reduce liquidity risk and
improve financial performance of the SACCOs. Lack of credit analysis, credit follow-ups as
well as hostile lending are the key factors that contribute to poor performance in loan lending
by SACCO societies in Kenya (Mwaura, 2005). Credit monitoring is a keystone in credit risk
management process. The purpose of credit monitoring is to detect in time possible
worsening of the loan and to react (make changes in loan agreement). The simplest tool
for credit monitoring is to identify early warning signs in time. According to SASRA reports
the loan to deposit ratio for SACCOs is approximated at 108% which means that for every
Ksh. 100 collected in deposits there is a Kshs. 108 lent out to members, while banks is vice
versa making them stable in the market.

21
2.5.3 Capital Adequacy and Performance
Capital adequacy ratio shows the level of capital which is an indicator of how safe and sound
are the banks and depository institutions since capital is buffer for absorbing losses (Abdel,
1996). Basel asserts that capital adequacy is determined by as a percentage of Banks total
capital to risk weighted assets. Theoretically financial performance is influenced by the level
of capital held by a bank. According to (Jane, Barus, Dr. Muturi, Dr. koima, 2009) SACCOs
should shift their concentration from increasing capital level to credit risk management this
will result in improvement in the financial performance if SACCOs According to (Diamond,
2000) sufficient capital level reduces chances of distress. Capital Asset ratio is deemed
accurate to measure the capability of banks to curb losses incurred in the face of crisis (Dang,
2011).
Researchers have been carried out on capital adequacy and this research supports the SASRA
regulation that has set all capital base for SACCOs to be maintained at 10% this ensures their
stability and profitability are at par. With good capital SACCOs can invest in projects that
will earn good profits since members will be saving more since the capital base is stable
hence more deposits. Banks with high capital are profitable and perceived to be the best by
depositors (Agbeja and Olufemi, 2015).
Theoretically financial performance is influenced by level of capital of SACCO and can
diversify into various products to grow their member‟s e.g. buying Plots for members.
According to resource-based theory a firm's competitive advantage evolves from
resources that the organization has like good capital base. In the resource-based theory
model, resources are given the major role of assisting companies in achieving higher
organizational performance and competitive advantage.
2.5.4 Internal Control Systems and Audit on Financial Performance
ICS are the most challenging issues in SACCOs today in Kenya, to ensure SACCOs manage
their ICS to streamline their operations and minimize unnecessary financial costs; risk,
accounting control and administration control this is to ensure compliance and efficiency for
those charged with governance (management) (C.Wangeci, M.Muturi 2017). ICS is important
for especially for members who needs quality report to be assured of the continuity of the
SACCO in a foreseeable future. The problems encountered with SACCOs is that periodic
audit that is to be carried out by SACCOs supervisory committee is never met or is

22
influenced by the management to ensure a clean report is written, the internal auditors do not
give a true picture of what the financial statements are reporting this leads to collapse of
many SACCOs unknown to members the cause of their sudden collapse.
An entity‟s performance is influenced by those charge with governance their actions,
interaction with Internal and external auditors. (ISA UK and Ireland 315) asserts that the
responsibility of the management includes oversight of the design, operations reviewing
process and procedures.
2.5.5 Government Regulation Policy (SASRA)
To safeguard the deposits of and wealth of Kenyans who have invested in SACCOs, the
Government has taken various measures and implemented regulatory policies to ensure the
movement operates according to international best practice. These include the establishment
of SASRA through the SACCO Societies Act 2008, which introduced prudential regulations
covering all deposit-taking SACCOs to enhance transparency and accountability in the fast
growing sub-sector. It is anticipated that the move will also spur economic growth through
mobilization of domestic savings.
Kenya and South Africa are the only countries in Africa with independent regulators and
specific regulations for SACCOs the SACCO Societies Act and Co-operative Banking
Act, respectively. In most countries, central banks regulate and supervise SACCOs, which
denies the societies the flexibility to serve members adequately.
Kenya has the highest proportion, in percentage points, of Gross Domestic Product (GDP)
attributable to cooperatives globally, standing at 45 per cent, followed by New Zealand with
22 per cent. The cooperative movement worldwide has about 800 million members in over
100 countries and is estimated to account for more than 100 million jobs around the world.
Kenya‟s cooperative sector is reputed to be one of the most regulated in Africa and the best in
East Africa. Oyoo (2002) looked at assessment of financial potential of SACCOs prior and
post deregulation where he concluded that SACCOs should look beyond the internal
operations and develop strategies to strengthen their economic survival in the future.

23
2.6 Knowledge Gap
Cooperatives in Kenya have continued to play a very important role in the economy by
providing employment to the youth and enhancing economic activities in the rural areas by
improving the living standards of the people. Although previous studies on performance of
SACCOs have been conducted for instance Karagu and Okibo (2014) did a study on factors
influencing performance of SACCOs in Kenya, and concluded that funds misappropriation
influences performance of SACCOs and that SACCOs need to improve on their internal audit
department and other internal control measures. . Deposit taking SACCOs are supposed to
maintain a core capital to asset ratio of 10% which 11 SACCOs failed to meet, this shows an
increase in non-compliance from 6 SACCOs in 2016 to 11 in 2017 (SASRA 2018), internal
audits are not done periodically, failure of not reviewing procedures and even implementing
the existing ones by the management. Little has been said concerning other specific factors
affecting their financial performance in relation to credit management practices namely;
management competency, credit management, capital adequacy and internal control systems
as majority of the studies on performance of SACCOs have been on credit risk factors
influencing their performance. Hence, this study seeks to bridge the knowledge gap by
specifically discussing the influence of management competency, credit management, capital
adequacy and ICS on performance of SACCOs in Kenya.

24
CHAPTER THREE
RESEARCH DESIGN AND METHODOLOGY
3.1 Introduction
This chapter outlines the methodology that was used in carrying out the study. Aspects
covered include the research design, target population, sample size and sampling procedure,
data collection methods, validity and reliability and data analysis technique and presentation.
3.2 Research Design
Research design is the blue print for the collection, measurement, analysis of data and a plan
to obtain answers to research questions (Cooper and Schindler, 2006). According to Kothari
and Garg (2014) and Kothari (2004) research design is the arrangement of conditions for
collection and analysis of data in a manner that aims to combine relevance to the research
purpose with economy in procedure. Bryman and Bell (2007) further avers that the research
design is a plan or framework for data collection and its analysis which reveals the type of
research. Research design is thus a plan of how the research will be carried out (Waithaka,
2013). A descriptive study provides answers to the questions, who, what, when, where and
sometimes how, (Copper and Schindler, 2003). The researcher thus used descriptive research
design which enabled the study collect comprehensive data on the population under study and
thus providing relevant and specific information. The design used was suitable because the
study dealt with the relationship between the variables and development of generalization that
have collective validity.
3.3 Study Area
This study was carried out in Kisumu County; Kisumu city is the capital city of Kisumu
County, currently Head quaters for Western Kenya. It lies between latitude of -0.10221 and a
longitude of 34.7617111 in the southern hemisphere. Kisumu County is where a number of
SACCOs have failed to meet SASRA threshold on capital base leading to majority being
supervised under the umbrella of the Ministry of Cooperatives within the County.
3.4 Target Population
Target population refers to entire group of individuals or objects to which researchers are
interested in generalizing the conclusions (Kothari and Garg, 2014; Mugenda and
Mugenda, 2003). The target population constituted 120 respondents from 12 randomly
selected SACCOs operating in Kisumu County which have complied with SACCO Societies

25
Regulatory Authority (SASRA) regulations to remain validly registered. The core
respondents were; Board Chairperson, Managing Directors, Finance Managers, Audit
Managers, Internal Audit Officers, and Financial Clerks since they are more familiar with the
subject under study as they are the custodians of corporate financial and management
information.
A population consists of a group that share common characteristics from which units of
analysis are then chosen out of the population for the study Orodho (2005). Target population
refered to entire group of individuals to which researchers were interested in generalizing the
conclusions (Mugenda and Mugenda 2003). The target population in this study was 120 from
SACCOs regulated by SASRA in Kisumu County.
Table 3.1: Target Population
Department Target Population
Board Chairperson 20
Managing directors 20
Finance manager 20
Audit Managers 20
Accountant 20
Financial Clerks 20
Total 120
Source: Researcher (2019)
3.5 Sample Size and Sampling Procedure
A sample must be robust in its design and large enough to provide a reliable representation of
the whole population (Mugenda & Mugenda, 2009). Aspects considered when designing a
sample were the level of accuracy required, cost, and the timing. In a random sample each
unit in the population has a chance of being selected, and this probability can be accurately
determined. Random sampling includes, but is not limited to, simple random sampling,
systematic sampling, and stratified random sampling. Random sampling makes it possible to
produce population estimates from the data obtained from the units included in the sample
(Mugenda & Mugenda, 2009). Thus the researcher will use stratified random sampling
technique. A stratified random sampling involves dividing the entire population into

26
homogeneous groups which are called strata (singular is stratum). Random samples are then
selected from each stratum and have the same chance of being in the sample. At least 30% of
the total population is representative (Borg and Gall, 2003). Thus, the researcher used 72% of
the target population for the sample size which was arrived at using Krejcie and Morgan
Table.
Table 3.2: Sample Size
Respondents Target Population Sample Population = (P*60/100)
Board Chairperson 20 12
Managing directors 20 12
Finance manager 20 12
Audit Managers 20 12
Accountants 20 12
Financial Clerks 20 12
Total 120 72
Source: Researcher (2019)
P=Target Population
3.6 Data Collections Instruments
The researcher used questionnaires as a tool for data collection. A questionnaire is a research
tool that gathers data over a large sample. Questionnaire was the most appropriate research
tool as it allowed the researcher to collect information from a large sample with diverse
background; the findings remained confidential, save time and since they are presented in
paper and there are no opportunities for bias (Kombo et al 2006). Mugenda (2012) argue that
the use of questionnaire ensures that respondents are faced with identical stimulus this
facilitating reliability. The instrument as designed to address issues relating to performance of
SACCOs. The questionnaires were administered personally by the researcher to the
respondents.
3.6.1 Data collection and Procedure
The researcher personally administered the questionnaires to the respondents. The filled in
questionnaires were then collected after the respondents had filled them. Each respondent
received the same set of questions in exactly the same way. In the questionnaire it was be

27
made clear in the introduction the purpose of the research by clarifying the academic purpose
and that the respondents would not experience any negative effects when contributing to
research. Primary data was collected mainly from primary sources. The primary data was
used due to nearness to the truth and ease for control over errors (Copper and Schindler
2003).
3.6.2 Reliability of the Instruments
Before the actual data was collected, the researcher conducted a pilot study among the
respondents who were included in the final study population. The respondents were randomly
selected for the pilot study. The purpose of pilot study was to enable the researcher ascertain
the reliability and validity of instruments and to familiarize with the administration of the
questionnaires during the study. The pilot study enabled the researcher assess the clarity of
the questionnaires and interview schedule items so that, those found to be inadequate or
vague, modified to improve their quality hence increasing reliability.
3.6.3 Validity of Instruments
Wierma (1995) stated that all assessments of validity are subjective opinions based on
judgments of the researcher. The research design aimed at enhancing internal, construct and
external validity. To test the validity of the research instruments, the questionnaires were
prepared and submitted to the supervisor for cross checking and also assess the reliance of
content. The questionnaires were pre-tested through a pilot study which were done a week
earlier before the commencement of the actual study to free the findings from ambiguity.
3.6.4 Data Analysis
Descriptive statistics were used to analyze the quantitative data obtained. The data collected
were edited and coded for accuracy and completeness. Data was analyzed using descriptive
analysis, ANOVA (mean, frequencies, standard deviation) and multiple regression analysis
output will be presented i.e. tables, graphs and charts. Burns and Grove (2007) describe the
purpose of descriptive statistics as providing the opinion of respondents regarding the
phenomenon studies. Descriptive research provides an accurate account of characteristic of a
particular individual, event or group in real life studies.
Multiple linear regression models will be used to determine the relative importance of each of
the four variables.

28
Y= β0+ β1X1+β2X2+ β3X3+ β4X4+ ε
Where
Y = Financial Performance
β0 = constant
β1, β2, β3, β4 = Coefficients to regression model
X1 = Management Competency
X2 = Capital Adequacy
X3 = Internal Control and Audit
ε = Error term
3.7 Data Presentation
The findings were presented in the form of Tables, Charts and Graphs, which also generated
descriptive report in form of percentages, and measure of Central tendency which were
presented in table format.
3.8 Ethical Considerations
To ensure the maintenance of ethical standards, from the beginning to the completion of the
study, the researcher obtained informed consent from the respondents and ensured that all the
respondents participated voluntarily in the study. Privacy and anonymity of the respondents
were maintained throughout the study. Openness and honest disclosure of information
concerning the purpose and the benefits of the research to the respondents were also
maintained.

29
CHAPTER FOUR
DATA ANALYSIS, RESULTS AND DISCUSSION
4.1 Introduction
This section represents the results after analysis discussions of the findings. Results are
analyzed and also interpreted with respect to the main objective of the study that determines
the effect of credit management practices on financial performance of savings and credit co-
operative societies. Data was collected from the population of 70 respondents. The findings
are presented in percentages and frequency distributions, graphs and tables.
4.2 Descriptive Results Analysis
As presented by the researcher, a rating tool scale of 1 to 5 was used, 5 being the highest and
1 the lowest level. Results were rated as follows for most results, 1 = strongly disagree, 2 =
disagree, 3 = neutral, 4 = agree and 5 = strongly disagree.
SECTION A: GENERAL INFORMATION
Table 4.1: Position/rank
Position/ rank Frequency Percent Valid Percent
Cumulative
Percent
Valid Board Chairperson 10 14.3 14.3 14.3
Managing Director 2 2.9 2.9 17.1
Finance Manager 9 12.9 12.9 30.0
Audit Manager 5 7.1 7.1 37.1
Internal Audit Officer 14 20.0 20.0 57.1
Financial Clerks 13 18.6 18.6 75.7
Others 17 24.3 24.3 100.0
Total 70 100.0 100.0
Source: Researcher (2019)
As shown in the table above, the majority of the respondents are holding other positions other
than the above listed at 24%. The other majority are internal audit officers at 20% and
financial clerks with 18%.

30
Table 4.2: Gender
Gender Frequency Percent
Valid
Percent
Cumulative
Percent
Valid Male 28 40.0 50.0 50.0
Female 28 40.0 50.0 100.0
Total 56 80.0 100.0
Missing System 14 20.0
Total 70 100.0
Source: Researcher (2019)
From the results, there was a 40% each for both male and females while 20% of the
respondents didn‟t indicate their gender, 14 of the 70 respondents.
Table 4.3: Age
Age Frequency Percent Valid
Percent
Cumulative
Percent
Valid 20 to 25 8 11.4 12.5 12.5
26 to 30 9 12.9 14.1 26.6
31 to 35 19 27.1 29.7 56.3
36 to 40 12 17.1 18.8 75.0
Above 40
years
16 22.9 25.0 100.0
Total 64 91.4 100.0
Missing System 6 8.6
Total 70 100.0
Source: Researcher (2019)
Respondents above 30 years are the majority, 27% are 31-35 years, 22% are above 40 years
and 17% between 36-40 years. The only missing results from the respondents were 6, that is
8%.

31
Table 4.4: Number of years worked
How many years have you worked or been a member in the company
Frequency Percent Valid Percent
Cumulative
Percent
Valid Less 10 14.3 14.3 14.3
3 to 5 years 17 24.3 24.3 38.6
6 to 7 years 11 15.7 15.7 54.3
8 to 10 years 17 24.3 24.3 78.6
Above 10
years
15 21.4 21.4 100.0
Total 70 100.0 100.0
Source: Researcher (2019)
On the number years worked, majority are over 3 years. 24% of the respondents are both at 3-
5 years and 8-10 years as 21% above 10 years. The least serving employees were at 14% and
15% representing 6-7 years. This shows a 100% response rate from the collected and returned
questionnaires.
Table 4.5: Level of Education
Please indicate your Highest Educational level in the space provided
Frequency Percent Valid Percent
Cumulative
Percent
Valid Master's degree 21 30.0 30.0 30.0
Bachelor's Degree 21 30.0 30.0 60.0
Diploma 18 25.7 25.7 85.7
'O' Level 2 2.9 2.9 88.6
Certificate 8 11.4 11.4 100.0
Total 70 100.0 100.0
Source: Researcher (2019)
There is a lot of skills as shown from the results above. Both Master‟s and Bachelor‟s degrees
share a valid 30% followed by diploma at 25%. „O‟ Level is at 2% and 11% are certificate
level.

32
Effects of Credit Management Practices on Financial Performance OF Savings and
Credit Co-operative Socities
4.2.1 Management Competency
Table 4.6: Influence of revenue growth
Frequency Percent Valid Percent
Cumulative
Percent
Valid Disagree 3 4.3 4.3 4.3
Neutral 13 18.6 18.8 23.2
Agree 27 38.6 39.1 62.3
Strongly agree 26 37.1 37.7 100.0
Total 69 98.6 100.0
Missing System 1 1.4
Total 70 100.0
Source: Researcher (2019)
From the results shown above, 39% being the majority agrees that management competency
affects the performance of their SACCOs as 38% strongly agreeing 0n influence of business
growth. This shows that there is a lot of business growth as only 4% with a frequency of 4 out
of 70 disagreeing.
Figure 4.1: Influence of Revenue Growth

33
Table 4.7: Encourage more members to join
Encourage more members to join
Frequency Percent Valid Percent
Cumulative
Percent
Valid Strongly disagree 2 2.9 3.1 3.1
Neutral 11 15.7 16.9 20.0
Agree 24 34.3 36.9 56.9
Strongly agree 28 40.0 43.1 100.0
Total 65 92.9 100.0
Missing System 5 7.1
Total 70 100.0
Source: Researcher (2019)
A good number also at 40% strongly agree that management competency encourages more
members to join the SACCOs with 34% agreeing. This affects the performance of the
SACCOs in the region as from the results tabulated.
Table 4.8: Improve decision making
Improve decision making
Frequency Percent Valid Percent
Cumulative
Percent
Valid Strongly disagree 2 2.9 3.0 3.0
Disagree 9 12.9 13.6 16.7
Neutral 5 7.1 7.6 24.2
Agree 26 37.1 39.4 63.6
Strongly agree 24 34.3 36.4 100.0
Total 66 94.3 100.0
Missing System 4 5.7
Total 70 100.0
Source: Researcher (2019)
With a competent management team, proper decision making are made as shown in the table
above. Respondents with the majority are at 37% followed by 34% that strongly agree with
only 12% of the respondents not agreeing.

34
Table 4.9: Has little impact
Has little impact
Frequency Percent Valid Percent
Cumulative
Percent
Valid Strongly disagree 34 48.6 51.5 51.5
Disagree 16 22.9 24.2 75.8
Neutral 9 12.9 13.6 89.4
Agree 6 8.6 9.1 98.5
Strongly agree 1 1.4 1.5 100.0
Total 66 94.3 100.0
Missing System 4 5.7
Total 70 100.0
Source: Researcher (2019)
According to the responses collected, management competency has a lot of impact on the
performance of the SACCOs as majority‟s response is at 48% followed by 22%. Following
the previous results of the education level, this practice can be proved by the fact that most
employees are University graduates.
4.2.2 Credit Criteria
Table 4.10: Income
Income
Frequency Percent Valid Percent
Cumulative
Percent
Valid Little extent 3 4.3 4.5 4.5
Moderate 13 18.6 19.7 24.2
Great extent 18 25.7 27.3 51.5
Very great 32 45.7 48.5 100.0
Total 66 94.3 100.0
Missing System 4 5.7
Total 70 100.0
Source: Researcher (2019)
There is a very great extent rate that credit worthiness of a member is determined by the
income one has. A majority response rate is at 45% followed by 25% at great extent.

35
Table 4.11: Character, reputation and credit History
Character, reputation and credit History
Frequency Percent Valid Percent
Cumulative
Percent
Valid No extent 9 12.9 13.4 13.4
Little extent 17 24.3 25.4 38.8
Moderate 14 20.0 20.9 59.7
Great extent 12 17.1 17.9 77.6
Very great 15 21.4 22.4 100.0
Total 67 95.7 100.0
Missing System 3 4.3
Total 70 100.0
Source: Researcher (2019)
Character, reputation and credit history are fairly used to determine the credit worthiness as
compared to the income as shown above. Majority of the respondents show a little extent
results at 24% followed by very great at 21% and frequency of 9 out of 70 showing a no
extent response.
Table 4.12: Existing personal debt
Existing personal debt
Frequency Percent Valid Percent
Cumulative
Percent
Valid No extent 10 14.3 14.9 14.9
Little extent 14 20.0 20.9 35.8
Moderate 4 5.7 6.0 41.8
Great extent 23 32.9 34.3 76.1
Very great 16 22.9 23.9 100.0
Total 67 95.7 100.0
Missing System 3 4.3
Total 70 100.0
Source: Researcher (2019)
The results shows that there is a great extent that existing debt can be used to determine credit
worthiness of a member at 32% followed by 22% of very great extent and 20% at little
extent. Few results show 14% of no extent and 5% on moderate.

36
Table 4.13: Employment history
Employment history
Frequency Percent Valid Percent
Cumulative
Percent
Valid No extent 19 27.1 28.8 28.8
little extent 17 24.3 25.8 54.5
moderate extent 11 15.7 16.7 71.2
great extent 6 8.6 9.1 80.3
very great extent 13 18.6 19.7 100.0
Total 66 94.3 100.0
Missing System 4 5.7
Total 70 100.0
Source: Researcher (2019)
Employment history contribute so little on the determination of credit worthiness as 27% no
extent, 22% little extent and 18% very great extent. Majority agree to the fact that it does not
determine the credit worthiness.
Figure 4.2: Employment History

37
Table 4.14: Potential for long term credit
Potential for long term credit
Frequency Percent Valid Percent
Cumulative
Percent
Valid Little extent 8 11.4 11.9 11.9
Moderate 11 15.7 16.4 28.4
Great extent 35 50.0 52.2 80.6
Very great 13 18.6 19.4 100.0
Total 67 95.7 100.0
Missing System 3 4.3
Total 70 100.0
Source: Researcher (2019)
A member‟s worthiness may be determined by the potential for a long-term credit as shown
above at 50% for great extent and 18% for very great extent. A negative result was at 11% for
little extent.
Table 4.15: Ability to repay the loan
Ability to repay the loan
Frequency Percent Valid Percent
Cumulative
Percent
Valid No extent 6 8.6 8.7 8.7
Little extent 3 4.3 4.3 13.0
Moderate 1 1.4 1.4 14.5
Great extent 23 32.9 33.3 47.8
Very great 36 51.4 52.2 100.0
Total 69 98.6 100.0
Missing System 1 1.4
Total 70 100.0
Source: Researcher (2019)
Assessment of an individual‟s credit worthiness is highly determined by the ability to pay
according to the respondents. 51% responded for very great extent and 32% for great extent.
This shows a high likely chance that if the credit limit or score is low then a loan cannot be
given to a member.

38
Table 4.16: Credit Reminder
Form of credit reminder used by SACCOs
Frequency Percent Valid Percent
Cumulative
Percent
Valid Manual 33 47.1 52.4 52.4
Automated 30 42.9 47.6 100.0
Total 63 90.0 100.0
Missing System 7 10.0
Total 70 100.0
Source: Researcher (2019)
According to the response given, there is a manual credit reminder used by most SACCOs in
the area. A response rate of 47% confirmed the same as 42% was for automatic reminder as
the rest didn‟t indicate any response.
Figure 4.3: Credit Reminder

39
4.2.2.1 Credit Reminder Duration
Table 4.17: After 1 to 3 months
After 1 to 3 months
Frequency Percent Valid Percent
Cumulative
Percent
Valid Not extent 23 32.9 33.3 33.3
Little extent 12 17.1 17.4 50.7
Moderate 6 8.6 8.7 59.4
Great Extent 13 18.6 18.8 78.3
Very great
extent
15 21.4 21.7 100.0
Total 69 98.6 100.0
Missing System 1 1.4
Total 70 100.0
Source: Researcher (2019)
According to the above report, notification to customers on their loans is not sent after 1 to 3
months. 32% of the respondents indicated a no extent level to the credit reminder and 17%
showing little extent. Even though there is a little extent of credit reminder, some SACCOs
do so to a great extent as 21% indicating very great extent level and 18% great extent level.
Table 4.18: After 3 to 6 months
After 3 to 6 months
Frequency Percent Valid Percent
Cumulative
Percent
Valid Not extent 10 14.3 14.9 14.9
Little extent 4 5.7 6.0 20.9
Moderate 31 44.3 46.3 67.2
Great Extent 13 18.6 19.4 86.6
Very great extent 9 12.9 13.4 100.0
Total 67 95.7 100.0
Missing System 3 4.3
Total 70 100.0
Source: Researcher (2019)
Being that form of credit reminder used is manual, after 3-6 months there is moderate
response rate for a reminder as 18% responded to a great extent. The study shows that a
reminder for loan repayments is sent between 3 to 6 months with 44% proving so.

40
Table 4.19: After 6 to 9 months
After 6 to 9 months
Frequency Percent Valid Percent
Cumulative
Percent
Valid Not extent 28 40.0 41.8 41.8
Little extent 4 5.7 6.0 47.8
Moderate 6 8.6 9.0 56.7
Great Extent 14 20.0 20.9 77.6
Very great extent 15 21.4 22.4 100.0
Total 67 95.7 100.0
Missing System 3 4.3
Total 70 100.0
Source: Researcher (2019)
There is a greater percentage of respondents showing that there is no reminder at 6-9 months
at 40%. 20% responded to a great extent and 21% to very great extent.
4.2.2.2 Recuperating Loans
Table 4.20: Follow up guarantor to pay
Follow up guarantor to pay
Frequency Percent Valid Percent
Cumulative
Percent
Valid No extent 3 4.3 4.4 4.4
Little extent 8 11.4 11.8 16.2
Moderate extent 17 24.3 25.0 41.2
Great extent 18 25.7 26.5 67.6
Very great extent 22 31.4 32.4 100.0
Total 68 97.1 100.0
Missing System 2 2.9
Total 70 100.0
Source: Researcher (2019)
When there is an overdue loan, recovery can be done through follow up on guarantor to pay.
This shown above as 31% responded to very great extent, 25% great extent, 24% moderate
and 11% little extent.

41
Table 4.21: Claim with insurance
Claim with insurance
Frequency Percent Valid Percent
Cumulative
Percent
Valid No extent 16 22.9 23.9 23.9
Little extent 17 24.3 25.4 49.3
Moderate extent 12 17.1 17.9 67.2
Great extent 22 31.4 32.8 100.0
Total 67 95.7 100.0
Missing System 3 4.3
Total 70 100.0
Source: Researcher (2019)
Most defaulted loans can also be recovered from the insurances if need be as 31% responded
to great extent but 24% on little extent, 22% no extent followed by 17% on moderate level.
On average, 46% were above average as 4 percent didn‟t give any response.
Table 4.22: Sue member by court
Sue member by court
Frequency Percent Valid Percent
Cumulative
Percent
Valid No extent 33 47.1 49.3 49.3
Little extent 9 12.9 13.4 62.7
Moderate extent 3 4.3 4.5 67.2
Great extent 13 18.6 19.4 86.6
Very great extent 9 12.9 13.4 100.0
Total 67 95.7 100.0
Missing System 3 4.3
Total 70 100.0
Source: Researcher (2019)
There are no chances that a defaulted loan can follow a court process to be recuperated.
Above results show that 47% of the respondents are of no extent and 18% on greater extent.
This shows that very few cases may reach the courts the recovery.

42
Figure 4.4: Sue Member by Court
Table 4.23: Public auction of private property
Public auction of private property
Frequency Percent Valid Percent
Cumulative
Percent
Valid No extent 31 44.3 45.6 45.6
Little extent 23 32.9 33.8 79.4
Moderate extent 7 10.0 10.3 89.7
Great extent 5 7.1 7.4 97.1
Very great extent 2 2.9 2.9 100.0
Total 68 97.1 100.0
Missing System 2 2.9
Total 70 100.0
Source: Researcher (2019)
According to the responses given, there is very little occasion of public auctioning of private
properties in case of default. 44% responded for the same as 32% responding for little extent.

43
Table 4.24: Member to pay loan without interest
Ask member to pay loan without interest
Frequency Percent Valid Percent
Cumulative
Percent
Valid No extent 34 48.6 50.7 50.7
Little extent 5 7.1 7.5 58.2
Moderate extent 19 27.1 28.4 86.6
Great extent 2 2.9 3.0 89.6
Very great extent 7 10.0 10.4 100.0
Total 67 95.7 100.0
Missing System 3 4.3
Total 70 100.0
Source: Researcher (2019)
When recuperating the loans, 48% of the respondents showed that no member can be asked to
pay the loan without interest. Few cases can allow member to pay the loan without interest in
case of default as 27% were on moderate level.
Figure 4.5: Member to pay Loan without interest
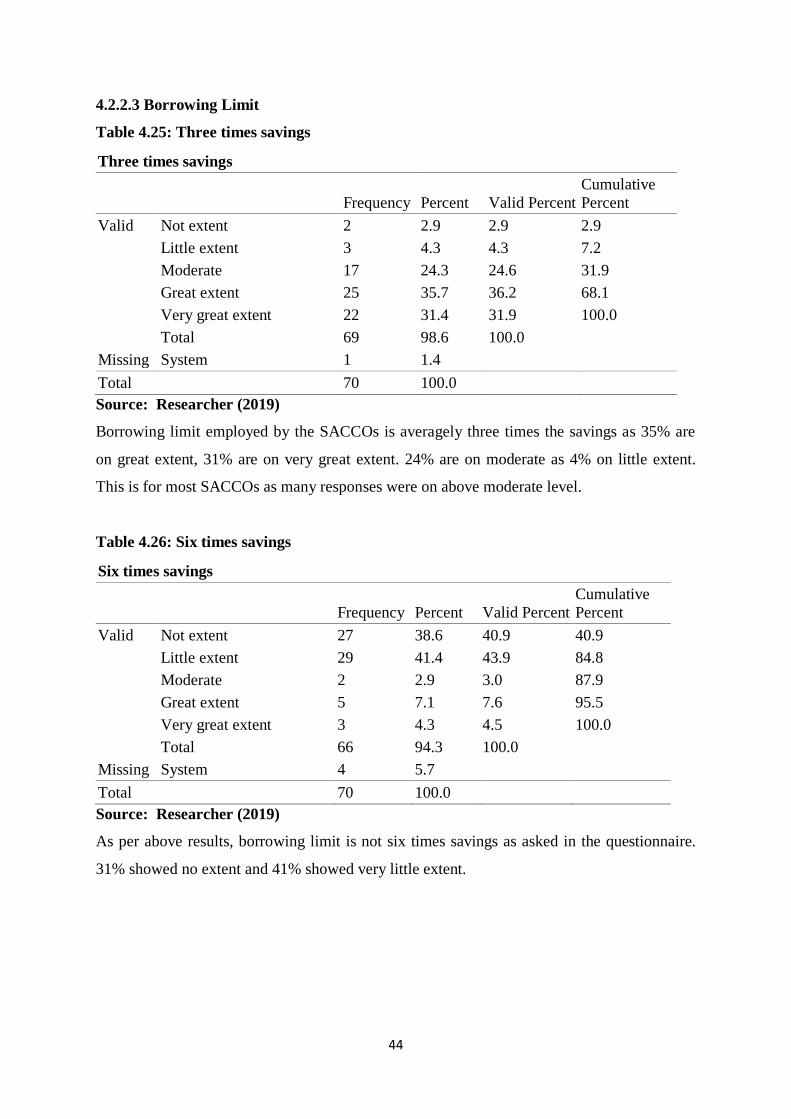
44
4.2.2.3 Borrowing Limit
Table 4.25: Three times savings
Three times savings
Frequency Percent Valid Percent
Cumulative
Percent
Valid Not extent 2 2.9 2.9 2.9
Little extent 3 4.3 4.3 7.2
Moderate 17 24.3 24.6 31.9
Great extent 25 35.7 36.2 68.1
Very great extent 22 31.4 31.9 100.0
Total 69 98.6 100.0
Missing System 1 1.4
Total 70 100.0
Source: Researcher (2019)
Borrowing limit employed by the SACCOs is averagely three times the savings as 35% are
on great extent, 31% are on very great extent. 24% are on moderate as 4% on little extent.
This is for most SACCOs as many responses were on above moderate level.
Table 4.26: Six times savings
Six times savings
Frequency Percent Valid Percent
Cumulative
Percent
Valid Not extent 27 38.6 40.9 40.9
Little extent 29 41.4 43.9 84.8
Moderate 2 2.9 3.0 87.9
Great extent 5 7.1 7.6 95.5
Very great extent 3 4.3 4.5 100.0
Total 66 94.3 100.0
Missing System 4 5.7
Total 70 100.0
Source: Researcher (2019)
As per above results, borrowing limit is not six times savings as asked in the questionnaire.
31% showed no extent and 41% showed very little extent.

45
Table 4.27: Minimum of three times savings
Minimum of three times savings
Frequency Percent Valid Percent
Cumulative
Percent
Valid Not extent 7 10.0 10.6 10.6
Little extent 17 24.3 25.8 36.4
Moderate 20 28.6 30.3 66.7
Great extent 12 17.1 18.2 84.8
Very great extent 10 14.3 15.2 100.0
Total 66 94.3 100.0
Missing System 4 5.7
Total 70 100.0
Source: Researcher (2019)
There is an average count that borrowing limit is pegged to minimum of three times savings
as 28% are on moderate level, 17% on great extent, 14% on very great extent as 24% are on
little extent.
Table 4.28: Minimum of six times savings
Minimum of six times savings
Frequency Percent Valid Percent
Cumulative
Percent
Valid Not extent 44 62.9 68.8 68.8
Little extent 9 12.9 14.1 82.8
Great extent 3 4.3 4.7 87.5
Very great extent 8 11.4 12.5 100.0
Total 64 91.4 100.0
Missing System 6 8.6
Total 70 100.0
Source: Researcher (2019)
As per the previous results, there is also no extent that 62% of the respondents showing that
SACCOs borrow on a minimum of six times savings. Only 11% are on very great extent.

46
Table 4.29: Ability to pay
Ability to pay back Loan
Frequency Percent Valid Percent
Cumulative
Percent
Valid Not extent 13 18.6 19.7 19.7
Little extent 2 2.9 3.0 22.7
Moderate 14 20.0 21.2 43.9
Great extent 7 10.0 10.6 54.5
Very great extent 30 42.9 45.5 100.0
Total 66 94.3 100.0
Missing System 4 5.7
Total 70 100.0
Source: Researcher (2019)
Ability to pay is considered by most SACCOs to very great extent at 42%, 10% at great
extent and 20% at moderate level for borrowing limit.
4.2.3 Capital Adequacy
Table 4.30: Separating members Deposit from Capital
Separating members Deposit from Capital
Frequency Percent Valid Percent
Cumulative
Percent
Valid Not at all 23 32.9 33.8 33.8
Slightly 11 15.7 16.2 50.0
Significantly 10 14.3 14.7 64.7
Greatly 12 17.1 17.6 82.4
Very great 12 17.1 17.6 100.0
Total 68 97.1 100.0
Missing System 2 2.9
Total 70 100.0
Source: Researcher (2019)
In meeting capital requirements, separating members deposit from capital is not used as a
requirement as 32% were on not at all and 15% were on slightly level. On average level, 34%
were above the great level.

47
Table 4.31: Defining and calculation of rations
Defining and calculation of rations
Frequency Percent Valid Percent
Cumulative
Percent
Valid Not at all 11 15.7 15.9 15.9
Slightly 16 22.9 23.2 39.1
Significantly 10 14.3 14.5 53.6
Greatly 22 31.4 31.9 85.5
Very great 10 14.3 14.5 100.0
Total 69 98.6 100.0
Missing System 1 1.4
Total 70 100.0
Source: Researcher (2019)
In meeting capital requirement, defining and calculation of ratios is regarded a challenge to a
great extent as many respondents say so. 31% showed great extent as 14% showed 14%. This
was also supported by 14% who responded for significantly. This was on the above average
level as shown above.
Table 4.32: Reduced member payout
Reduced member payout
Frequency Percent Valid Percent
Cumulative
Percent
Valid Not at all 12 17.1 17.9 17.9
Slightly 8 11.4 11.9 29.9
Significantly 28 40.0 41.8 71.6
Greatly 11 15.7 16.4 88.1
Very great 8 11.4 11.9 100.0
Total 67 95.7 100.0
Missing System 3 4.3
Total 70 100.0
Source: Researcher (2019)
It also evident that a reduced member payout is also a challenge facing capital adequacy to a
significant effect as over 50% were on the above the significant level. The least being slightly
at 11%.

48
Table 4.33: Restricted avenues for investment
Restricted avenues for investment
Frequency Percent Valid Percent
Cumulative
Percent
Valid Not at all 19 27.1 29.7 29.7
Slightly 12 17.1 18.8 48.4
Significantly 13 18.6 20.3 68.8
Greatly 16 22.9 25.0 93.8
Very great 4 5.7 6.3 100.0
Total 64 91.4 100.0
Missing System 6 8.6
Total 70 100.0
Source: Researcher (2019)
Reduced lending capacity is fairly affecting the capital requirement of SACCOs in the region.
Most respondents of the questionnaire were on the above significant level on average at 46%
as 8% didn‟t respond to the questionnaire. 34% responded to not at all and slightly responses
as shown above.
Table 4.34: Reduced Lending capacity
Reduced Lending capacity
Frequency Percent Valid Percent
Cumulative
Percent
Valid Not at all 14 20.0 20.9 20.9
Slightly 6 8.6 9.0 29.9
Significantly 3 4.3 4.5 34.3
Greatly 33 47.1 49.3 83.6
Very great 11 15.7 16.4 100.0
Total 67 95.7 100.0
Missing System 3 4.3
Total 70 100.0
Source: Researcher (2019)
For most of the SACCOs in the area, reduced lending capacity is a major factor in meeting
the capital adequacy. 47% with a frequency of 33 out of 70 responded greatly as 15%
responding to very great. This shows that it is major challenge to them. On average, 28%
responded in contrast to the majority.

49
4.2.4 Internal Control Systems and Audit
Table 4.35: Up to date accounting policies and procedure manuals
Up to date accounting policies and procedure manuals
Frequency Percent Valid Percent
Cumulative
Percent
Valid Not extent 9 12.9 13.4 13.4
Little extent 9 12.9 13.4 26.9
Moderate extent 8 11.4 11.9 38.8
Great extent 20 28.6 29.9 68.7
Very great extent 21 30.0 31.3 100.0
Total 67 95.7 100.0
Missing System 3 4.3
Total 70 100.0
Source: Researcher (2019)
Internal control system and audit as tool of credit management policy affects the growth and
efficiency of SACCOs, as a requirement, up to date accounting policies and procedure
manuals of ICS affects the same to a great extent. This is evident above as 73% of the
respondents are on above the moderate level with only 24% showing no and little extent to
the questionnaire.
Table 4.36: Are personnel policies maintained and distributed
Are personnel policies maintained and distributed
Frequency Percent Valid Percent
Cumulative
Percent
Valid Not extent 15 21.4 22.4 22.4
Little extent 13 18.6 19.4 41.8
Moderate extent 9 12.9 13.4 55.2
Great extent 12 17.1 17.9 73.1
Very great extent 18 25.7 26.9 100.0
Total 67 95.7 100.0
Missing System 3 4.3
Total 70 100.0
Source: Researcher (2019)
25% of the responded said that ICS are personal policies maintained and distributed to a very
great extent while 17% showed great extent. Those with contrasting results were on average
at 40% thus showing a fair distribution.

50
Table 4.37: Is an Internal Audit manual in use
Is an Internal Audit manual in use
Frequency Percent Valid Percent
Cumulative
Percent
Valid Not extent 23 32.9 33.3 33.3
Little extent 12 17.1 17.4 50.7
Moderate 6 8.6 8.7 59.4
Great Extent 13 18.6 18.8 78.3
Very great extent 15 21.4 21.7 100.0
Total 69 98.6 100.0
Missing System 1 1.4
Total 70 100.0
Source: Researcher (2019)
Internal audit manual is fairly used in the SACCOs as half of the respondents showed an
average result of little extent at 50% and 49% on above moderate with only 1% not
responding.
Table 4.38: Is the ICS cost effective for the SACCO
Is the ICS cost effective for the SACCO
Frequency Percent Valid Percent
Cumulative
Percent
Valid Not extent 17 24.3 25.4 25.4
Little extent 6 8.6 9.0 34.3
Moderate extent 14 20.0 20.9 55.2
Great extent 20 28.6 29.9 85.1
Very great extent 10 14.3 14.9 100.0
Total 67 95.7 100.0
Missing System 3 4.3
Total 70 100.0
Source: Researcher (2019)
In terms of cost effectiveness, ICS was voted so much cost effective at 63% by the
respondents as the other 33% were not of the similar opinion. This variation showed that for
proper management of SACCOs, ICS as a credit policy practice is greatly put in use.

51
Table 4.39: Implementing ICS is a full proof of efficiency
Implementing ICS is a full proof of efficiency
Frequency Percent Valid Percent
Cumulative
Percent
Valid Not extent 11 15.7 15.7 15.7
Little extent 13 18.6 18.6 34.3
Moderate extent 18 25.7 25.7 60.0
Great extent 15 21.4 21.4 81.4
Very great extent 13 18.6 18.6 100.0
Total 70 100.0 100.0
Source: Researcher (2019)
Most of the respondents showed that implementation of ICS is a full proof of efficiency in the
SACCOs with an average result of 66% while the other respondents were at 34%.
4.2.7 Impact of SASRA on Ownership
Table 4.40: Ownership
Ownership
Frequency Percent Valid Percent
Cumulative
Percent
Valid No impact 24 34.3 35.8 35.8
Low Impact 14 20.0 20.9 56.7
Moderate Impact 24 34.3 35.8 92.5
High Impact 3 4.3 4.5 97.0
Very High Impact 2 2.9 3.0 100.0
Total 67 95.7 100.0
Missing System 3 4.3
Total 70 100.0
Source: Researcher (2019)
SASRA regulations have no impact on ownership in most SACCOs. This is proven by 34%
responding to impact, 20% low impact and the other responding to moderate and high impact
on the ownership of the SACCOs.

52
Figure 4.6: Ownership
Table 4.41: Governance
Governance
Frequency Percent Valid Percent
Cumulative
Percent
Valid No impact 18 25.7 26.9 26.9
Low Impact 9 12.9 13.4 40.3
Moderate Impact 23 32.9 34.3 74.6
High Impact 7 10.0 10.4 85.1
Very High Impact 10 14.3 14.9 100.0
Total 67 95.7 100.0
Missing System 3 4.3
Total 70 100.0
Source: Researcher (2019)
On governance, the regulations have an impact in the SACCOs as 32% showed moderate
level, 14% very high level and 10% high impact. Since only 25% showing no impact and
12% little impact, governance is really affected by the SASRA regulations.

53
Table 4.42: Accountability
Accountability
Frequency Percent Valid Percent
Cumulative
Percent
Valid No impact 17 24.3 24.3 24.3
Low Impact 10 14.3 14.3 38.6
Moderate Impact 8 11.4 11.4 50.0
High Impact 23 32.9 32.9 82.9
Very High Impact 12 17.1 17.1 100.0
Total 70 100.0 100.0
Source: Researcher (2019)
SASRA regulations affects accountability of SACCOs to great extent with most of the
respondents showed the above moderate level. Majority showed high impact at 32%, 17% on
very high impact and 11% indicated moderate impact results.
Table 4.43: Management Efficiency
Management Efficiency
Frequency Percent Valid Percent
Cumulative
Percent
Valid No impact 13 18.6 19.4 19.4
Low Impact 10 14.3 14.9 34.3
Moderate Impact 6 8.6 9.0 43.3
High Impact 19 27.1 28.4 71.6
Very High Impact 19 27.1 28.4 100.0
Total 67 95.7 100.0
Missing System 3 4.3
Total 70 100.0
Source: Researcher (2019)
Being the only regulation governing SACCOs tested, management efficiency is highly
affected by the regulations as 27% of the respondents showed high impact as the same also
voted for very high impact while 8% were for moderate impact. This shows that it‟s a good
practice for the daily management of the SACCOs in the area.

54
Table 4.44: SASRA Role
SASRA role in helping the institution in the regulations policies can be
termed as
Frequency Percent Valid Percent
Cumulative
Percent
Valid Poor 2 2.9 2.9 2.9
Fair 6 8.6 8.6 11.4
Good 35 50.0 50.0 61.4
Very good 17 24.3 24.3 85.7
Excellent 10 14.3 14.3 100.0
Total 70 100.0 100.0
Source: Researcher (2019)
These regulations of SASRA are of great benefit to the SACCOs as previously discussed.
This is supported by the above fact that the authority‟s role in helping the institution in the
regulation of policies is termed as so good. 50% responded to good, 24% showed very good
and 14% showing excellent results.
Table 4.45: Government support
The Current Government support for SACCOs operations can be
termed as
Frequency Percent Valid Percent
Cumulative
Percent
Valid Poor 8 11.4 11.4 11.4
Fair 29 41.4 41.4 52.9
Good 22 31.4 31.4 84.3
Very good 11 15.7 15.7 100.0
Total 70 100.0 100.0
Source: Researcher (2019)
As a public institution, the government is not supportive to the SACCOs. 41% showed that
the government is fair, 11% showed that the support is poor, 31% showed good support and
15% with very good support.

55
Figure 4.7: Government Support
Table 4.46: It influences customer's confidence and trust
It influences customer's confidence and trust
Frequency Percent Valid Percent
Cumulative
Percent
Valid Disagree 3 4.3 4.5 4.5
Neutral 4 5.7 6.0 10.4
Agree 19 27.1 28.4 38.8
Strongly agree 41 58.6 61.2 100.0
Total 67 95.7 100.0
Missing System 3 4.3
Total 70 100.0
Source: Researcher (2019)
There is a lot of influence to customer‟s confidence and trust based on the performance of the
SACCOs. Majority supported the same with 58% strongly agreeing and 37% agreeing with
the same. This proves a lot to customers as their confidence and trust is greatly influenced.

56
Table 4.47: Attracts investors to save with the SACCO
Attracts investors to save with the SACCO
Frequency Percent Valid Percent
Cumulative
Percent
Valid Strongly disagree 14 20.0 20.9 20.9
Disagree 6 8.6 9.0 29.9
Neutral 2 2.9 3.0 32.8
Agree 25 35.7 37.3 70.1
Strongly agree 20 28.6 29.9 100.0
Total 67 95.7 100.0
Missing System 3 4.3
Total 70 100.0
Source: Researcher (2019)
SACCO performance greatly attracts investors after proving that it has a lot of influence on
the customer‟s trust and confidence. 35% of the respondents agreed to the same as 28%
strongly agreeing. This can attract many members as new members can subscribe to highly
performing SACCOs.
Table 4.48: It provides staff job security
It provides staff job security
Frequency Percent Valid Percent
Cumulative
Percent
Valid Strongly disagree 8 11.4 11.9 11.9
Disagree 6 8.6 9.0 20.9
Neutral 17 24.3 25.4 46.3
Agree 17 24.3 25.4 71.6
Strongly agree 19 27.1 28.4 100.0
Total 67 95.7 100.0
Missing System 3 4.3
Total 70 100.0
Source: Researcher (2019)
Job security does not correlate much with the institution‟s performance. 24% agree to the
same as 27% strongly agreeing and 24% are on neutral level. 11% of the respondents strongly
disagree with this fact as for 8% as well.

57
Table 4.49: It ensures healthy returns to the shareholders
It ensures healthy returns to the shareholders
Frequency Percent Valid Percent
Cumulative
Percent
Valid Strongly disagree 2 2.9 3.0 3.0
Neutral 16 22.9 23.9 26.9
Agree 20 28.6 29.9 56.7
Strongly agree 29 41.4 43.3 100.0
Total 67 95.7 100.0
Missing System 3 4.3
Total 70 100.0
Source: Researcher (2019)
If the SACCOs perform so well then there is high likely chance that the shareholders will
have healthy returns. This is evident in the table above as 41% of the respondents strongly
agree to this fact, 28% are on agreement level and 22% are at neutral level.
Table 4.50: Indicator of sustainability
It provides an indicator of sustainability
Frequency Percent Valid Percent
Cumulative
Percent
Valid Strongly disagree 5 7.1 7.4 7.4
Disagree 4 5.7 5.9 13.2
Neutral 8 11.4 11.8 25.0
Agree 28 40.0 41.2 66.2
Strongly agree 23 32.9 33.8 100.0
Total 68 97.1 100.0
Missing System 2 2.9
Total 70 100.0
Source: Researcher (2019)
Performance of these institutions provides a good indicator of sustainability. 40% of the
respondents attest that it is possible by agreeing as 32% strongly agree. This likely compares
to other variable that good performance provide a healthy return to the shareholders.

58
Figure 4.8: Indicator of Sustainability
Table 4.60 Credit management practice and management Competency
Regression Model Summary
Model R R Square
Adjusted R
Square Std. Error of the Estimate
1 .543a .295 .248 .85521
a. Predictors: (Constant), Has little impact , Encourage more members to join, Influence
Business growth, Improve decision making. From the results the study finds a positive
relationship between management competency and performance, R indicates 0.543 there is a
relationship between credit management and management competency, 29% variation of
Financial performance to Independent Variables. There is same moderate degree of
correlation which is presented by r which is 0.54. adjusted R-Square is 24.8% variation of
changes in independent variables.
ANOVAb
Model
Sum of
Squares df
Mean
Square F
Sig.
1 Regression 18.363 4 4.591 6.277 .000a
Residual 43.883 60 .731
Total 62.246 64
Source: Researcher (2019)
Predictors: (Constant), Has little impact, Encourage more members to join,
Influence Business growth, Improve decision making Significance level of 0.000
this shows the data is ideal for making decisions as the p-value is less than 0.05
level of significance. In view of the table above F Critical 6.2777>2.2431

59
ANOVAb
Model
Sum of
Squares df
Mean
Square F
Sig.
1 Regression 18.363 4 4.591 6.277 .000a
Residual 43.883 60 .731
Total 62.246 64
Source: Researcher (2019)
Predictors: (Constant), Has little impact, Encourage more members to join,
Influence Business growth, Improve decision making Significance level of 0.000
this shows the data is ideal for making decisions as the p-value is less than 0.05
level of significance. In view of the table above F Critical 6.2777>2.2431
b. Dependent Variable: It ensures healthy returns to the shareholders
Correlation Coefficients
Model
Unstandardized
Coefficients
Standardiz
ed
Coefficien
ts
t Sig. B Std. Error Beta
1 (Constant) 5.547 .934
5.942 .000
Influence Business
growth
-.125 .131 -.105 -.957 .343
Encourage more
members to join
.112 .116 .106 .966 .338
Improve decision
making
-.113 .100 -.130 -
1.128
.264
Has little impact -.524 .109 -.555 -
4.789
.000
Source: Researcher (2019)
Y=5.547 - 0.125X1 + 0.112 X2 - 0.113 X3 -0.524 X4
In view of the results in coefficient table above influence on business growth is statistically
significant in explaining financial performance of Saccos as shown by -0.125, this is an
indication that a unit decrease in business growth results in decrease in financial performance
of Saccos. More members joining this has a significant positive relationship with financial
performance of Saccos a unit increase in member joining results in an increase in financial
performance, a decrease in decision making shown by -0.113 will result in a decrease in
financial performance of Saccos, management competency has a positive impact on financial
performance, the statistical significance of the Independent variable management, business
growth, more members joining Sacco and improved decision making has a positive effect on

60
management competency hence accept null hypothesis that management competency
influence performance.
Table 4.61 Credit management practice and Financial Performance
Regression Model Summary
Model R R Square
Adjusted R
Square Std. Error of the Estimate
1 .792a .627 .588 .75860
a. Predictors: (Constant), Ability to repay the loan, Character, reputation and
credit History, Income, Potential for long term credit , Existing personal debt,
Employment history
Source: Researcher (2019)
There is some is same high degree of correlation which is presented by r which is 0.79
which is less than 1. Adjusted R-Square of 0.588 shows credit management practice
significantly influences performance.
ANOVAb
Model Sum of Squares df Mean Square F Sig.
1 Regression 56.069 6 9.345 16.239 .000a
Residual 33.377 58 .575
Total 89.446 64
a.Predictors: (Constant), Ability to repay the loan, Character, reputation and credit
History, Income, Potential for long term credit , Existing personal debt, Employment
history
b. Dependent Variable: It provides an indicator of sustainability
Source: Researcher (2019)
The table shows 0.000 significance level shows the data is ideal for making conclusion on the
population parameter, the P-Value is less than .05, F Calculated 16.239>F Critical 3.64 this
shows credit management influences financial performance of Saccos .

61
Correlation Coefficients a
Model
Unstandardized
Coefficients
Standardized
Coefficients
T Sig. B Std. Error Beta
1 (Constant) 3.243 .642 5.054 .000
Income -.610 .111 -.476 -5.519 .000
Character, reputation
and credit History
-.453 .081 -.523 -5.574 .000
Existing personal debt .315 .074 .375 4.283 .000
Employment history .020 .076 .025 .266 .791
Potential for long term
credit
.493 .118 .355 4.184 .000
Ability to repay the loan .390 .083 .412 4.682 .000
a. Dependent Variable: It provides an indicator of sustainability
Source: Researcher (2019)
Y=3.243 -0.61 X1-0.453 X2+0.315 X3+0.02 X4+0.493 X5+0.39 X6
Reduction in income reduction in income by .61 influence financial performance of Saccos
with a standard error of .111, character reputation negatively contributes to the better
performance of Saccos, personal debts is positively correlated to credit management,
employment history is strongly positively correlated showing 0.02 efficiency, potential of
long-term debt shows .493 this is positively contributing to financial performance, ability to
repay loan is acceptable measure of performance.
Credit management summarized above shows that credit management is a main factor that
contributes positively to the financial performance of Saccos, so accept null hypothesis that
credit management influence performance.

62
Table 4.62 Credit management practice and capital Adequacy
Regression Model Summary
Model R R Square
Adjusted R
Square Std. Error of the Estimate
1 .364a .133 .058 1.47379
a. Predictors: (Constant), Reduced Lending capacity , Defining and calculation of
rations, Separating members Deposit from Capital , Reduced member payout,
Restricted avenues for investment
Source: Researcher (2019)
There is little or same high degree of correlation which is presented by r which is 0.364
Standard Error of 1.47379 shows that there is no relationship between Capital adequacy and
performance. From the results in table 4.62 R indicates 0.364 there is a low relationship
between capital adequacy and financial performance of Saccos. Adjusted R Square shows
5.8% variation of financial performance to independent variables
ANOVAb
Model
Sum of
Squares df Mean Square F Sig.
1 Regression 19.255 5 3.851 1.773 .133a
Residual 125.980 58 2.172
Total 145.234 63
a. Predictors: (Constant), Reduced Lending capacity , Defining and calculation of
rations, Separating members Deposit from Capital , Reduced member payout,
Restricted avenues for investment
b. Dependent Variable: Attracts investors to save with the SACCO,
with the analysis of .133significance level shows the data in not ideal for making
decision as this level of significance is greater than .05
Source: Researcher (2019)

63
Correlation Coefficients a
Model
Unstandardized
Coefficients
Standardized
Coefficients
t Sig. B Std. Error Beta
1 (Constant) 4.640 .842 5.513 .000
Separating members
Deposit from Capital
-.192 .130 -.192 -1.477 .145
Defining and calculation
of rations
-.268 .145 -.231 -1.854 .069
Reduced member
payout
.243 .172 .197 1.412 .163
Restricted avenues for
investment
-.080 .176 -.069 -.454 .652
Reduced Lending
capacity
-.125 .179 -.111 -.697 .489
a. Dependent Variable: Attracts investors to save with the SACCO
Source: Researcher (2019)
Y=3.243 + {-0.192 X1}+{.-0.268 X2}+{0.243 X3}+{-0.08 X4}+{-0.125 X5}
The table above shows coefficient relationship between variables. Separating deposits from
capital has an impact on financial performance of Saccos a decrease in member‟s deposit -
.192 has a negative impact in financial performance. -0.268 is an indication that calculation
of ratios has a negative effect on financial performance of Saccos, reduced member‟s payout
shows a 0.243 this shows a strong relationship with credit management and performance as
reduced dividends increases performance through investment. Restricted avenues for
investment shows -0.08 a unit decrease in investment causes a decrease in financial
performance, reduced lending rate -0.125 this is greater than significant value accept the
alternative reduced lending influence performance. The overall capital adequacy shows a
significant level of 0.00 this shows that capital adequacy strongly influence performance.
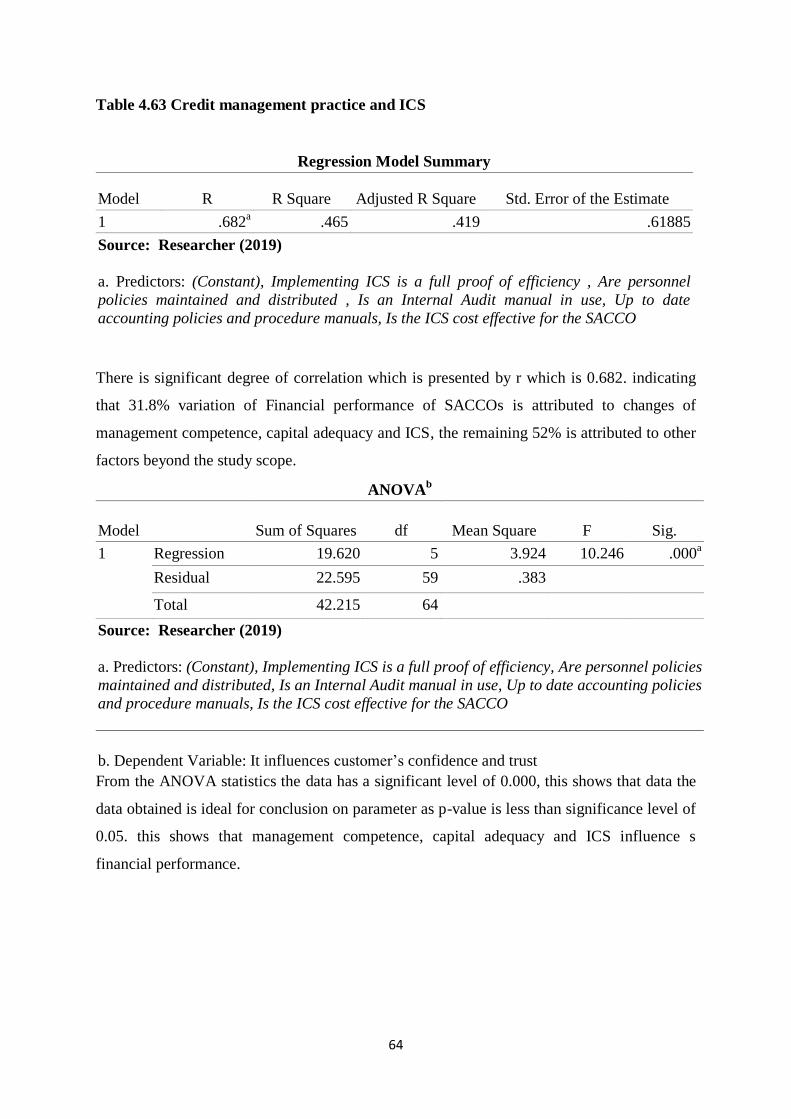
64
Table 4.63 Credit management practice and ICS
Regression Model Summary
Model R R Square Adjusted R Square Std. Error of the Estimate
1 .682a .465 .419 .61885
Source: Researcher (2019)
a. Predictors: (Constant), Implementing ICS is a full proof of efficiency , Are personnel
policies maintained and distributed , Is an Internal Audit manual in use, Up to date
accounting policies and procedure manuals, Is the ICS cost effective for the SACCO
There is significant degree of correlation which is presented by r which is 0.682. indicating
that 31.8% variation of Financial performance of SACCOs is attributed to changes of
management competence, capital adequacy and ICS, the remaining 52% is attributed to other
factors beyond the study scope.
ANOVAb
Model Sum of Squares df Mean Square F Sig.
1 Regression 19.620 5 3.924 10.246 .000a
Residual 22.595 59 .383
Total 42.215 64
Source: Researcher (2019)
a. Predictors: (Constant), Implementing ICS is a full proof of efficiency, Are personnel policies
maintained and distributed, Is an Internal Audit manual in use, Up to date accounting policies
and procedure manuals, Is the ICS cost effective for the SACCO
b. Dependent Variable: It influences customer‟s confidence and trust
From the ANOVA statistics the data has a significant level of 0.000, this shows that data the
data obtained is ideal for conclusion on parameter as p-value is less than significance level of
0.05. this shows that management competence, capital adequacy and ICS influence s
financial performance.

65
Coefficientsa
Model
Unstandardized
Coefficients
Standardized
Coefficients
T Sig. B Std. Error Beta
1 (Constant) 3.776 .434 8.695 .000
Up to date accounting
policies and procedure
manuals
.230 .065 .384 3.553 .001
Are personnel policies
maintained and distributed
-.118 .058 -.220 -2.031 .047
Is an Internal Audit
manual in use
.324 .063 .586 5.139 .000
Is the ICS cost effective
for the SACCO
-.212 .066 -.367 -3.201 .002
Implementing ICS is a full
proof of efficiency
-.026 .070 -.042 -.378 .707
Source: Researcher (2019)
a. Dependent Variable: It influences Customer's confidence and trust
Y=3.776 +0.23 X1-0.118 X2+0.324 X3-0.212 X4-0.26 X5
In view of the results in table above , up todate accounting influence performance 0.23> 0.05
hence accept the alternative it does not influence performance , a decrease in personal policy
which shows -0.118 unit decrease in policies affect financial performance of Saccos
negatively as much funds are invested on training and little used on capital to generate
income, ICS is not cost effective as shown at -0.026 this is less than 0.05 significant level
hence it negatively affect the capital and a major factor contributing to reduced financial
efficiency. Overall we accept the null hypothesis that capital adequacy affects financial
performance of Saccos.
4.3 Summary and Interpretation of the Findings
4.3.1 Management Competency
The study asked a question on what extent management competency influences the
performance of the SACCO and from the findings, majority of the respondents said that it
does so by improved business growth. The study also found out that it has a lot of impact on
the financial performance. As credit management practice, it encourages more members to
join the SACCOs since no member would like to invest with a poorly performing institution.
Following a high level of education in the institutions, proper decision-making is being made
by the management making them perform well in the region.

66
4.3.2 Capital Adequacy
The researcher asked a question that, what action is taken by your SACCO to recuperate
loans of the members. Respondents showed that in the debt recovery process, guarantors are
followed to pay the loans as 48% of the respondents showed that no member can be asked to
pay the loan without interest. Few cases can allow member to pay the loan without interest in
case of default. According to the responses given, there is very little occasion of public
auctioning of private properties. An increase in loan recovery usually increases financial
performance of the SACCOs.
4.3.3 Internal control systems and audit
Since most respondents show that internal control system has been implemented and has
brought a lot of efficiency in daily duties of the institution, the internal audit manual is fairly
used. It is said to be so cost effective to the management. This affects the growth and
efficiency of SACCOs following up to date accounting policies and procedure manuals.
4.3.4 SASRA regulations
The study findings establish that SASRA regulations have no impact on ownership in most
SACCOs even though it has a great impact on daily management of daily duties. The rules
only affect their governance which affects the financial performance of the SACCOs in
Kisumu County. An increase in governance as a measure of credit management practice
increases financial performance of the SACCOs. On matters accountability, there is a show
that SASRA regulations affect the performance of the institutions as provided by the findings

67
CHAPTER FIVE
SUMMARY, CONCLUSION AND RECOMMENDATIONS
5.1 Introduction
This chapter discusses the summary of findings, conclusions, research recommendations,
limitations of the study and further suggestions for research.
5.2 Summary of Findings and Interpretations
The study examined the effect of credit management practices on financial performance of
savings and credit co-operative societies in Kisumu County. From the study, the SACCOs in
the region has embraced a number of credit management practices tools and techniques to
improve on their performance in the market. A valid percentage of 52% was given by the
respondents for the manual credit reminder tool for non-performing loans for most SACCOs.
This means that there is no computerized system to monitor the loans as 48% use automatic
credit reminder for their clients. This policy also affects the credit criteria used by the
institutions to determine the credit worthiness of a member when it comes to getting a new
loan or top ups.
From the findings, it is observed that for a member to be in good books with higher credit
score during loan assessment, the SACCOs usually employ two main parameters; ability to
repay the loan and income of the member. About 46% of the respondent said income is used
to a very great level while on the other hand ability to repay the loan was at 51% at the same
level. These compare with other parameters like credit history, potential for long term credit,
existing personal loan and employment history.
As a risk mitigating factor, borrowing limit is highly prioritized by the institutions as this can
also help reduce the level of loan defaults. To improve the financial performance of the
SACCOs, debt collection should be put in place help debt book reduction. In doing this, most
of the respondents recorded that a guarantor may be followed up to recuperate the loan. Most
companies also use the limit of three times savings to get the loan and that‟s the minimum
level.
The study also found out that it has a lot of impact on the financial performance. As a credit
management practice, competent management encourages more members to join the

68
SACCOs since no member would like to invest with a poorly performing institution. This is
indicated as 40% for members who can join a competently managed SACCO. Following a
high level of education in the institutions, proper decision making is being made by the
management making them perform well in the region.
5.3 Conclusion
From the findings, it is found out that best credit management practices improve financial
performance of SACCOs. As pointed out earlier on, management competency as parameter is
largely regarded as best practice to attract many investors enabling financial performance. It
also improves a lot of decision making from the management. As evident in the findings that
the most variable responded to strongly at 40% was when asked if management competency
encourage new members to join the SACCOs.
It is also evident that credit risk mitigating factor used by most SACCOs is through follow up
with guarantors. This reduces the chances of writing off the loans in the process of
recuperation. Paying loans without interest was voted the least credit risk mitigating factor
employed by most SACCOs in Kisumu County. In also reducing the chances of default, three
times savings was also greatly employed. As a credit analyst, one can know that a loan is
performing or not. From the findings, credit reminder used by most SACCOs is manual as
many loans may not be followed in a computerized manner which can minimize losses and
maximizes shareholder‟s returns.
5.4 Limitations of the Study
After concluding on the findings above, the study outlines some of the challenges
experienced; responses can‟t be verifiable as it was open to all as some termed it confidential
in giving prompt response as they thought it would expose their savings and loan
information. Another limitation was that there was little time for the respondents who were
not able to complete the questionnaire and submit for collection thus leaving some questions
unanswered.
5.5 Recommendations and Further Research
The study recommends that for a smooth performance and management of SACCOs, proper
debt recovery measures should be developed to reduce the risk of bad debts such as
involvement of debt collection firms for full and final bad debt recovery and skip-tracing of

69
clients who are not in good books with the institutions. It also suggests that for credit
worthiness, credit reference bureau (CRB) agencies should be highly involved apart from the
said mitigating factors for credit appraisal for clients.
From the study, researchers and policy makers can do further research on how external
bodies like the government can contribute to the performance of SACCOs in Kenya. They
can base their findings on specific credit management practices like credit risk governance
and credit monitoring. A lot can be done on credit risk mitigating factors affecting the
performance of the institution, debt recovery and involvement of other agencies being the
main ones. A study can also be done on the credit management practices for various sectors,
banking, hospitality and even manufacturing industries and compared and the best to be
employed by all industries as this study didn‟t defined specifics.

70
REFERENCES
Aguilera, R.V., Cuervo-Cazurra, A. (2004), Codes of good governance worldwide: What is the
trigger? Organization Studies.
Aguilera, Dalton and Jackson (2008). An Organizational Approach to Comparative Corporate.
Governance: Costs, Contingencies, and Complementarities.
Alila and Obado (1990). Co-operative credit: the Kenyan SACCOs in a historical and
development perspective. Working paper no. 474, Nairobi: Institute for Development
Studies, University of Nairobi.
Al-Tamimi (2010). Factors Influencing Performance of the UAE Islamic and Conventional
National Banks (2010). Global Journal of Business Research, Vol. 4, No. 2
Amidu (2006). Determinants of capital structure of banks in Ghana: an empirical approach.
Amidu (2007). Determinants of capital structure of banks in Ghana: an empirical approach,
Baltic Journal of Management, Vol. 2 Issue:
Atrill (2006). Accounting and Finance for Non-specialists. Publisher, Pearson Education, 2006.
ISBN
Bangladesh Bank report (2005). Macroeconomic Performance, Near and Medium Term
Prospects.
Barney (1991). Journal of Management. 1991, Vol.17, No1, 99-120. Firm Resources and
Sustained. Competitive Advantage.
Barney J. (2007). Gaining and Sustaining Competitive Advantage. New Jersey: Prentice Hall
Person.
Basel committee (2000). Principles for the. Management of Credit Risk. Basel Committee on
Banking Supervision. Basel.
Bibby and Shaw (2005). Making a Difference: Co-operative Solutions to Global Poverty
Volume 4 of Co-operative College paper. Author, Milford Bateman.
Borg and Gall (2003). Educational Research: An Introduction, 7th Edition. M. D. Gall,
University of Oregon.
Brudney (1985). Strategic investment decision-making: Complexities, politics and processes.
Journal of Management Studies, 28(4), July: 395-415.
Brudney, V. (1985), corporate governance, agency costs, and the rhetoric of contract. Columbia
Law Review.
Bryman and Bell (2007). Business Research Methods
Burns and Grove (2007). Understanding nursing research building an evidence-
Practice. 4th Edition, Saunders Elsevier, St. Louis.

71
C. W.Mungai, M.Muturi (2017). „„Effects of Financial Performance of SACCOs in Kenya
case study of Kisii county’’ ISSN 2412-0294.
Chijoriga (1997). Application of credit scoring and financial distress prediction models to
commercial banks lending: the case of Tanzania
Clifford Rossi (2014). A Risk Professional's Survival Guide: Applied Best Practices in Risk
Management
Cooper and Schindler (2006). Business Research Methods: 12th Edition.
Co-operative Bank of Kenya (2010). Annual Report & Financial Statements.
Damanpour (1996). Organizational Complexity and Innovation: Developing and Testing
Multiple Contingency Models. Management Science 42(5):693-716.
Dash and Das (2010). Analysis of the Indian Banking Industry.
Duncan, Njeru, Florence and Tirimba (2015). Effect of Cash Management on Financial
Performance of Deposit Taking SACCOs in Mount Kenya Region - published at:
"International Journal of Scientific and Research Publications (IJSRP), Volume 5.
Gamba and Komo (2012). The Role of Lending Design on Sustainable Competitive Advantage
among Deposit Taking SACCO’s in Kenya. Strategic Journal of Business & Change
Management
Gibson (2003). Participation Shifts: Order and Differentiation in Group Conversation. Social
Forces, June 2003, 81(4):1335-1381.
Gisemba (2010). The Relationship between Credit Risk Management Practices and Financial
Performance of SACCOs in Kenya.
Guevas and Fischer (2006). Cooperative Financial Institutions: Issues in Governance,
Regulation, and Supervision. World Bank Working Paper No. 82. Washington, DC:
World Bank.
Gugler (2003). International Journal of Industrial Organization, 2003, vol. 21, issue 5, 625-653.
Gugler, K., Mueller, D.C., Yurtoglu, B.B. (2003). The impact of corporate governance on
investment returns in developed and developing countries. The Economic Journal.
Hafeez and Attiya (2009). “Concept of break even analysis and Bank profitability – a case
study” The Indian Journal of Commerce, Vol. 53, No.182. PP.53-59.
Haule (2011). Jung’s Theory of Personality: A Modern Reappraisal.
Harrison, J. S., O'Neill, H. M., & Hoskisson, R. E. (2000). Acquisition strategy and target
resistance: A theory of countervailing effects of pre-merger bidding and post-merger
integration. In C. Cooper & A. Gregory (Eds.), Advances in mergers and acquisitions.

72
Jensen M, Meckling W (1976). Theory of the Firm: Managerial Behaviour, Agency Costs, and
Ownership Structure. Journal of Financial Economics.
Karagu and Okibo (2014). Financial Factors Influencing Performance of Savings and Credit
Co-Operative Organization in Kenya.
Kay (1999). Caleb Ayiku‟s “A Dance with Success.” Book Review, Kim Journal, (July 2009).
Kibera (1996). “The Role of the Cooperative Movement in Kenya's Socioeconomic
Development.” Journal of Business Administration, University of Dhaka, 1995;
21(1&2):101-114.
Kombo (2006). Understanding Management Research: An Introduction to. Epistemology.
London: Sage Publications.
Kothari (2004). Research Methodology Methods and Techniques. 2nd Edition, New Age
International Publishers, New Delhi.
Kothari and Garg (2014). Research Methodology, Third Edition, New. Age International
Publishers, New Delhi.
Kraaijenbrink (2010). The Resource-Based View: A Review and Assessment of Its Critiques.
Journal of Management 2010 36: 349.
KUSCCO (2003). Kenya Union of Savings and Credit Co-Operative online writing on political
forces and the main change management practices adopted at KUSCCO
Lamberson (1995). "Changes in Working Capital of Small Firms in Relation to Changes in
Economic Activity", American Journal of Business, Vol. 10
Ligthelm (2002). Market research: a guide to planning, methodology and evaluation. 3rd
edition.
Makori (2013). Global Advanced Research Journal of Educational Research and Review 2.
Mallin (2004). Trustees, Institutional Investors and Ultimate Beneficiaries.
Martin (2012). Is the emphasis of capital budgeting theory misplaced? Journal of Business and
Finance Accounting, 2(1).
McCracken (2007). Developing Traditional Supervisors into Leaders; Supervising in the New
Organization, Strategic Leadership Centre, Nairobi.
Miller (2003). The International Co-operative Movement. Manchester Universities Press
<Oxford Road, Manchester M13 9NR, UK.
Mochache (2005). The qualitative and quantitive growth of the cooperative movement in Kenya,
cooperative out of poverty
Mudibo (2005). A Study of Corporate Governance Practices and Challenges By Co-Operative
Societies In Nairobi.

73
Mudibo 2009). Financial Practice as a Determinant of Growth of Savings and Credit Co-
Operative Societies’ Wealth.
Mugenda (2012). Research methods: Quantitative and Qualitative approaches.
Mugenda and Mugenda (2003). Research Methods: Quantitative &Qualitative Approaches.
Nairobi: Acts Press
Mugenda and Mugenda (2009). Research methods: Quantitative and Qualitative approaches.
Munyiri (2006). Financial Practice as a Determinant of Growth of Savings and Credit Co
Operative Societies’ Wealth. International Journal of Business and Social Science Vol. 3
No. 24
Mutunga, Minja and Gachanja (2014). Credit Risk Management Practices On Loan Portfolio Of
Barclays Bank Of Kenya.
Mwakajumilo (2011). The contribution of savings and credit cooperative societies to income
poverty reduction: A case study of Mbozi District, Tanzania.
Myers and Brealey (2003). Principles of Corporate Finance, Richard A. Brealey, ISBN
0072872225, 9780072872224.
Njanike (2009). Impact of Credit Risk Management on Banks Performance: European Journal of
Business and Management
Onchangwa and Memba (2012). The Effect of Lending On the Financial Performance of Savings
and Credit Cooperative Societies in Nairobi County.
Owino (2011). Factors Affecting Performance of Insurance Brokers, a Case Study for Methodist
Insurance Brokers Limited, a research project for the award of an Executive MBA
degree by JKUAT University, Nairobi.
Priem and Butler (2001). Is the Resource-Based "View" a Useful Perspective for Strategic
Management Research. Journal Article
Rodriguez and Mejia (2012). Strategic management: formulation, implementation, and control.
Ross and Barry M. Mitnick (2013). Co-operative Management, A philosophy for Business, New
Harmony Press, UK.
Sarker, M. 2005. CAMELS and banks performance evaluation: the way forward, Working Paper
Series, retrieved from SSRN: http://ssrn.abstract=11 on 13th August 2014.
Shejero (2016). A Situation-based Decision-Making Process, The ICFAI Journal of
Organization Behaviour, July, Vol.IV, No. 3, 19-25.
Ssekakubo, Ndiwalana and Lwanga (2014). Managerial Competency and the Financial
Performance of Savings, Credit and Cooperative Societies in Uganda.

74
Waiguru (2010). Co-operating out of Poverty, The renaissance of the African Co-operative
Movement, ILO Co-op-Africa.
Waithaka (2013). Principles for Corporate Governance in Kenya and Sample Code of Best
Practice for Corporate Governance, Nairobi, Kenya.
Wheelen and Hunger (2002). Strategic Management and Business Policy.
Wierma (1995). Investigating aspects of the capital budgeting process used in the evaluation of
investment.
Yegon (2004). Strategy Paper on the Role of Co-operatives in Promoting Poverty Reduction.
Young (2008) “Profitability of public sector Banks” A decomposition model, July, 55-81.
Wiseman (2012). “Banking for Development in India” Southern Economic, April, Vol. 15
(8):12-13.
Kimberly.A.Z & Robert.C (2003.) “Co-operative principle & practices in the 21st Century”
E.W Extensions.

75
APPENDICES
Appendix I: Letter of Transmittal
Maureen Ajwang Olweny
Kisumu, Kenya.
Dear Respondent,
I am a student of Maseno University pursuing a Degree in Master of Science in Finance. I am
conducting academic research on the Effect of Credit Management Practices on Financial
performance of SACCO‟s in Kisumu County. I am writing to invite you to participate in the
research by filling in the questionnaire.
Your participation is entirely voluntary and the questionnaire is completely anonymous. I
wish to assure you that the information you will provide will be treated with utmost
confidentiality. Your ability to answer all the questions comprehensively and to the best of
your knowledge will be highly appreciated.
I look forward to your support.
Thank you.
Yours Sincerely,
Maureen Olweny

76
Appendix II: Questionnaire
Instructions
This questionnaire is designed to collect information on effects of credit management
practices on financial performance of savings and credit co-operative societies. The
information obtained will only be used for academic purposes and shall be treated in utmost
confidence. You are requested to complete this questionnaire as honestly and objectively as
possible. Please tick in the appropriate box and also fill in the blank spaces provided for those
questions where elaborate answers are required.
SECTION A: General information
1. Position/Rank
Board Chairperson ( ) Audit Manager ( )
Managing Director ( ) Internal Audit Officer ( )
Finance Manager ( ) Financial Clerks ( )
Other (Specify)…………………………
2. Gender
Male ( ) Female ( )
20-25 years ( ) 26-30 years ( )
31-35 years ( ) 36-40 years ( )
Above 40years ( )
3. How many years have you worked or been a member in the Company?
Less than 3years ( )
3-5 Years ( )
6-7 Years ( )
8-10 Years ( )
Above 10 Years ( )
4. Please indicate your Highest Educational level in the space provided
Master‟s degree ( ) Bachelor‟s Degree ( )
Diploma ( ) Certificate ( )
„O‟ Level ( ) Primary ( )

77
SECTION B: Factors influencing Credit Management performance of savings and
credit co-operative societies
5. To what extent do you agree that management competency influence performance of your
SACCO? Use a scale of 1 – 5 where: 5 strongly agree, 4 agree, 3 neutral, 2 disagree and 1
strongly disagree.
Management competency 1 2 3 4 5
Influences Business growth
Encourages more members to join
Improves decision making
Has little impact
6. On a scale of 1 to 5 please rate the criteria used by SACCOs to determine credit
worthiness of a member? Rate your answer on a Scale of 1 – 5 where 5 very great extent,
4 great extent, 3 moderate extent, 2 little extent and 1 no extent.
Credit Criteria 1 2 3 4 5
Income
Character, reputation and credit history
Existing personal debt
Employment history
Potential for long term credit
Ability to repay the loan
7. What is the form of credit reminder used by your SACCOs?
a) Manual ( )
b) Automated ( )
8. What is the credit reminder duration used by your SACCO to remind members on
their credit? Use a scale of 1-5; where 5 very great extent, 4 great extent, 3 moderate
extend, 2 little extent and 1 not extent
Credit Reminder Duration 1 2 3 4 5
After 1-3 months
After 3-6 months

78
After 6-9 months
9. What is the action taken by your SACCO to recuperate loans of the members? Use a
scale of 1-5; where 5 very great extent, 4 great extent, 3 moderate extend, 2 little extent
and 1 not extent
Recuperating Loans 1 2 3 4 5
Follow-up guarantor to pay
Claim with insurance
Sue member by court
Public auction of private property
Ask member to pay loan without interest
10. What is the condition on the borrowing limit employed by your SACCO? Use a scale of
1-5; where 5 very great extent, 4 great extent, 3 moderate extend, 2 little extent and 1 not
extent
Borrowing Limit 1 2 3 4 5
Three times savings
Six times savings
Minimum of three times savings
Minimum of six times savings
Ability to pay
11. To what extent do SACCOs face the outlined challenges in meeting capital requirements?
Rate your answer on a Scale of 1 – 5 where 5. very great extent, 4. greatly, 3.
Significantly, 2. Slightly and 1. not at all.
Capital Adequacy 1 2 3 4 5
Separating members Deposit from Capital
Defining and calculation of ratios
Reduced member payouts
Restricted avenues for investment
Reduced Lending capacity

79
12. To what extent can you rate the below statements as contributing to growth and
efficiency of SACCOs in Kenya? Use a scale of 1-5 where; 5 very great extent, 4 great
extent, 3 moderate extend, 2 little extent and 1 not extent
Internal Control Systems and Audit 1 2 3 4 5
Up to date accounting policies and procedure manuals
Are personnel policies maintained and distributed
Is an Internal Audit manual in use
Is the ICS cost effective for the SACCO
Implementing ICS is a full proof of efficiency
13. To what extend has SASRA regulations have an impact on the following in your SACCO
(Tick the appropriate degree of influence) [1] No impact [2] Low Impact [3] Moderate
Impact [4] High Impact [5] Very High Impact
Impact on: 1 2 3 4 5
Ownership
Governance
Accountability
Management Efficiency
14. SASRA role in helping the institution in the regulations policies can be termed as (tick)
[1] Poor [2] Fair [3] good [4] Very good [5] Excellent
1 2 3 4 5
15. The Current Government support for SACCOs operations can be termed as (tick) [1] Poor
[2] Fair [3] good [4] Very good [5] Excellent
1 2 3 4 5
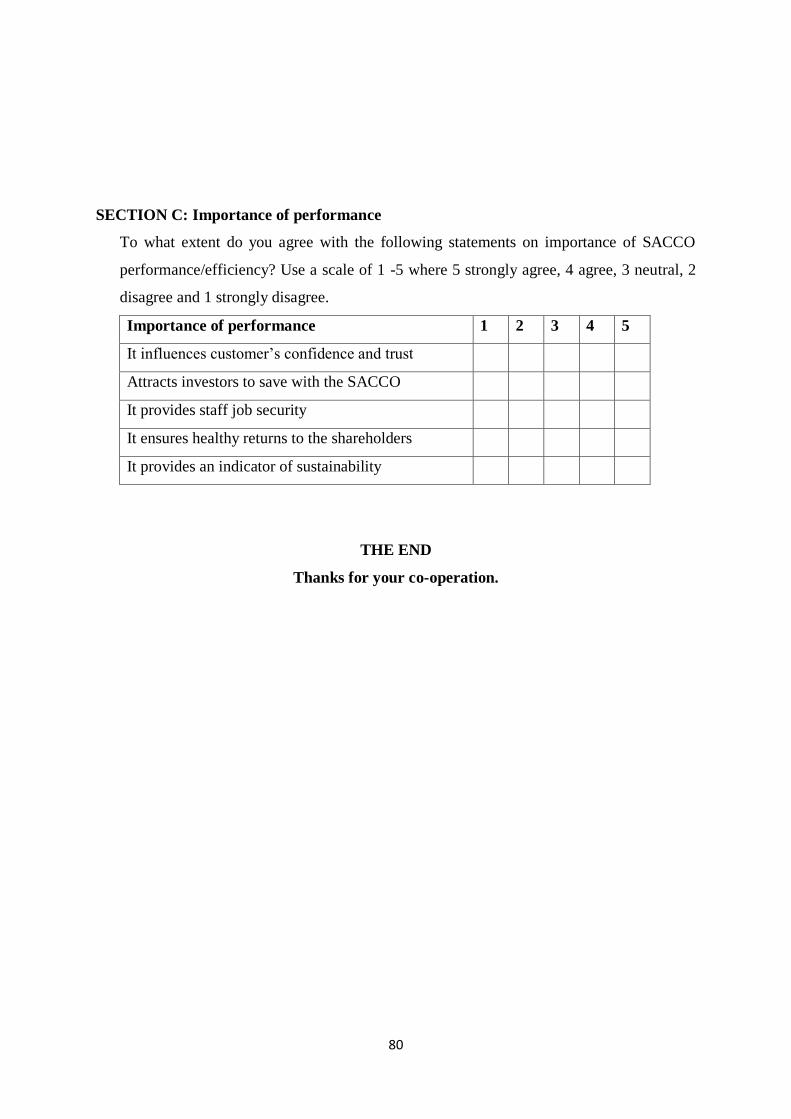
80
SECTION C: Importance of performance
To what extent do you agree with the following statements on importance of SACCO
performance/efficiency? Use a scale of 1 -5 where 5 strongly agree, 4 agree, 3 neutral, 2
disagree and 1 strongly disagree.
Importance of performance 1 2 3 4 5
It influences customer‟s confidence and trust
Attracts investors to save with the SACCO
It provides staff job security
It ensures healthy returns to the shareholders
It provides an indicator of sustainability
THE END
Thanks for your co-operation.
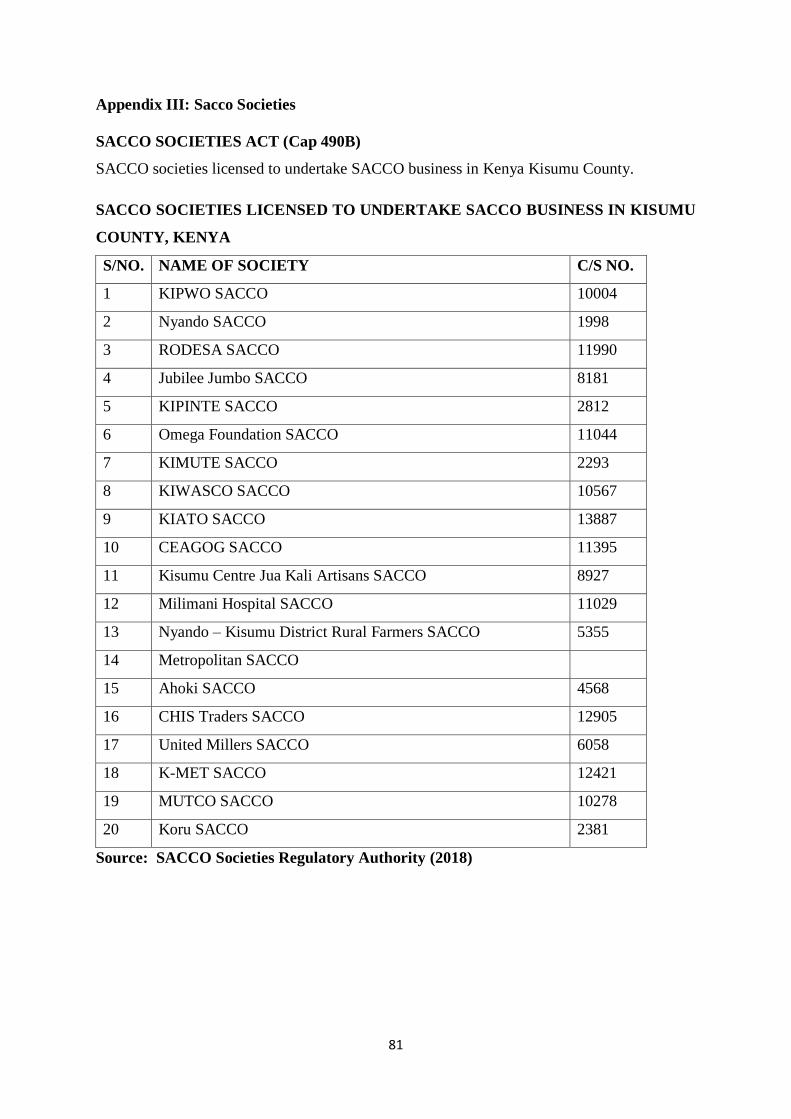
81
Appendix III: Sacco Societies
SACCO SOCIETIES ACT (Cap 490B)
SACCO societies licensed to undertake SACCO business in Kenya Kisumu County.
SACCO SOCIETIES LICENSED TO UNDERTAKE SACCO BUSINESS IN KISUMU
COUNTY, KENYA
S/NO. NAME OF SOCIETY C/S NO.
1 KIPWO SACCO 10004
2 Nyando SACCO 1998
3 RODESA SACCO 11990
4 Jubilee Jumbo SACCO 8181
5 KIPINTE SACCO 2812
6 Omega Foundation SACCO 11044
7 KIMUTE SACCO 2293
8 KIWASCO SACCO 10567
9 KIATO SACCO 13887
10 CEAGOG SACCO 11395
11 Kisumu Centre Jua Kali Artisans SACCO 8927
12 Milimani Hospital SACCO 11029
13 Nyando – Kisumu District Rural Farmers SACCO 5355
14 Metropolitan SACCO
15 Ahoki SACCO 4568
16 CHIS Traders SACCO 12905
17 United Millers SACCO 6058
18 K-MET SACCO 12421
19 MUTCO SACCO 10278
20 Koru SACCO 2381
Source: SACCO Societies Regulatory Authority (2018)

82
Appendix IV: Research Plan
Activity April 2019 May 2019 June 2019 September
2019
Proposal writing
Presentation
Data Collection
Data Analysis
Report Writing
Report Submission

83
Appendix V: Budget
Item Quantity Cost (Kshs) Total (Kshs)
1. Stationery 1 5000 9820
2. Airtime (monthly) 4 1500 4500
3. Transport 1 10,000 10,000
4. Internet Bundles (monthly) 4 3000 12000
TOTAL 36,320