Effect of Corrosion on Shear Behavior of Reinforced...
12
771 ACI Structural Journal/November-December 2015 ACI STRUCTURAL JOURNAL TECHNICAL PAPER The objective of this study was to evaluate the effect of corrosion level on shear behavior of engineered cementitious composite (ECC) beams. Reinforced normal concrete (R-NC) specimens with compressive strength equal to the ECC specimens were also used for control purposes. Ten reinforced concrete beams (five ECC and five NC) with dimensions of 150 x 220 x 1400 mm (5.91 x 8.66 x 55.12 in.) were manufactured for the study. Using accel- erated corrosion through the application of a constant current of 1 ampere, four levels of corrosion were established at 5%, 10%, 15%, and 20% of mass loss of the reinforcing bars. To ensure the highest probability of shear failure mode, all beams were tested under a four-point loading system with a shear span-effective depth ratio of 2.5. General structural behavior, strength, stiffness, failure mode, and energy absorption capacities of ECC and R-NC beams subjected to different corrosion levels were evaluated and compared. Experimental results showed a high correlation between calculated mass loss and measured mass loss in reinforcing bars due to accelerated corrosion. Compared to NC, ECC beams exhib- ited significantly higher strength, stiffness, and energy absorption capacity, along with superior performance in terms of the restric- tion of damage caused due to corrosion. The increase in corro- sion level negatively influenced the structural behavior of the ECC beams tested. Keywords: corrosion; engineered cementitious composites (ECCs); normal concrete; reinforced concrete beam; shear. INTRODUCTION Engineered cementitious composite (ECC) is a relatively new type of concrete that appeals to the construction industry for a number of reasons. When properly designed and used, it is an economical and environmentally friendly alternative to normal concrete, with practical ease of use in construction sites. It is a ductile, fiber-reinforced, cementitious composite designed to achieve high damage tolerance under severe loading and superior durability characteristics under normal service conditions. 1-10 ECC strain-hardens after cracking, similar to a ductile metal, and demonstrates a strain capacity 300 to 500 times greater than normal concrete. Even at large imposed deformations, crack widths are restricted to levels below 100 μm (0.004 in.). The intrinsically tight crack width of ECC has been shown to be an important parameter for the high durability of structures. Shear behavior of normal concrete has been studied for more than 100 years. However, there has not been a unified, rational approach for predicting the shear strength of reinforced concrete (RC) beams. Shear behavior depends on many parameters, including shear span-depth ratio, section shape, type of structural element, and applied loading. The approaches accepted by current codes in calculating shear strengths for a particular beam section can vary by factors of more than 2. On the other hand, the flexural strengths predicted by these codes are unlikely to vary by more than 10%. 11 Unlike pure flexure, experiments cannot be performed on reinforced concrete beams subjected to pure shear. In the common four-point loading test for concrete beams, the zone between the two point loads is under pure flexure, while the shear span of the beam, located between the support and applied load, is under the influence of constant shear and linearly varying moments. Therefore, it is not easy to predict shear behavior in general because the responses vary from section to section along the shear span. 12 One of the main mechanisms contributing to the early deterioration and reduced service life of concrete struc- tures is the corrosion of steel reinforcing bars. Recent life cycle analysis 10 indicated that substantial material resource consumption, primary energy usage, and CO 2 emissions occur during the service life of bridge infrastructure systems due to repeated maintenance activities. Globally, rehabil- itation plans for concrete structures are affected by corro- sion costs, which add up to billions of dollars every year. 13 Although the mechanism of corrosion is well-known, the deterioration between reinforcing bar and concrete caused by corrosion needs further clarification, and the influence of corrosion on structural response and residual structural capacity of the corroded elements requires further study. In the literature, a number of studies exist in which several properties, including corrosion behavior of ECC mixtures, are evaluated. Sahmaran et al. 13 focused on the performance of ECC beams subjected to accelerated corrosion using an electrochemical test method in which a constant potential was used to induce different levels of corrosion into the reinforced ECC mortars. After the induction of different corrosion levels, cracks, residual flexural load capacity, and mass loss of the reinforcing bars embedded in the specimens were determined. As a result of this study, it was concluded that due to its high tensile strain capacity and microcracking behavior, ECC significantly prolongs the corrosion prop- agation period while enhancing the ability to maintain the load-carrying capacity of the beams being tested. In a different study by Maalej et al., 14 the performance of ECC Title No. 112-S63 Effect of Corrosion on Shear Behavior of Reinforced Engineered Cementitious Composite Beams by M. Sahmaran, O. Anil, M. Lachemi, G. Yildirim, A. F. Ashour, and F. Acar ACI Structural Journal, V. 112, No. 6, November-December 2015. MS No. S-2014-.R107,R2 doi: 10.14359/51687749, received November 18, 2014, and reviewed under Institute publication policies. Copyright © 2015, American Concrete Institute. All rights reserved, including the making of copies unless permission is obtained from the copyright proprietors. Pertinent discussion including author’s closure, if any, will be published ten months from this journal’s date if the discussion is received within four months of the paper’s print publication.
Transcript of Effect of Corrosion on Shear Behavior of Reinforced...
771ACI Structural Journal/November-December 2015
ACI STRUCTURAL JOURNAL TECHNICAL PAPER
The objective of this study was to evaluate the effect of corrosion level on shear behavior of engineered cementitious composite (ECC) beams. Reinforced normal concrete (R-NC) specimens with compressive strength equal to the ECC specimens were also used for control purposes. Ten reinforced concrete beams (five ECC and five NC) with dimensions of 150 x 220 x 1400 mm (5.91 x 8.66 x 55.12 in.) were manufactured for the study. Using accel-erated corrosion through the application of a constant current of 1 ampere, four levels of corrosion were established at 5%, 10%, 15%, and 20% of mass loss of the reinforcing bars. To ensure the highest probability of shear failure mode, all beams were tested under a four-point loading system with a shear span-effective depth ratio of 2.5. General structural behavior, strength, stiffness, failure mode, and energy absorption capacities of ECC and R-NC beams subjected to different corrosion levels were evaluated and compared. Experimental results showed a high correlation between calculated mass loss and measured mass loss in reinforcing bars due to accelerated corrosion. Compared to NC, ECC beams exhib-ited significantly higher strength, stiffness, and energy absorption capacity, along with superior performance in terms of the restric-tion of damage caused due to corrosion. The increase in corro-sion level negatively influenced the structural behavior of the ECC beams tested.
Keywords: corrosion; engineered cementitious composites (ECCs); normal concrete; reinforced concrete beam; shear.
INTRODUCTIONEngineered cementitious composite (ECC) is a relatively
new type of concrete that appeals to the construction industry for a number of reasons. When properly designed and used, it is an economical and environmentally friendly alternative to normal concrete, with practical ease of use in construction sites. It is a ductile, fiber-reinforced, cementitious composite designed to achieve high damage tolerance under severe loading and superior durability characteristics under normal service conditions.1-10 ECC strain-hardens after cracking, similar to a ductile metal, and demonstrates a strain capacity 300 to 500 times greater than normal concrete. Even at large imposed deformations, crack widths are restricted to levels below 100 μm (0.004 in.). The intrinsically tight crack width of ECC has been shown to be an important parameter for the high durability of structures.
Shear behavior of normal concrete has been studied for more than 100 years. However, there has not been a unified, rational approach for predicting the shear strength of reinforced concrete (RC) beams. Shear behavior depends on many parameters, including shear span-depth ratio, section shape, type of structural element, and applied loading. The
approaches accepted by current codes in calculating shear strengths for a particular beam section can vary by factors of more than 2. On the other hand, the flexural strengths predicted by these codes are unlikely to vary by more than 10%.11 Unlike pure flexure, experiments cannot be performed on reinforced concrete beams subjected to pure shear. In the common four-point loading test for concrete beams, the zone between the two point loads is under pure flexure, while the shear span of the beam, located between the support and applied load, is under the influence of constant shear and linearly varying moments. Therefore, it is not easy to predict shear behavior in general because the responses vary from section to section along the shear span.12
One of the main mechanisms contributing to the early deterioration and reduced service life of concrete struc-tures is the corrosion of steel reinforcing bars. Recent life cycle analysis10 indicated that substantial material resource consumption, primary energy usage, and CO2 emissions occur during the service life of bridge infrastructure systems due to repeated maintenance activities. Globally, rehabil-itation plans for concrete structures are affected by corro-sion costs, which add up to billions of dollars every year.13 Although the mechanism of corrosion is well-known, the deterioration between reinforcing bar and concrete caused by corrosion needs further clarification, and the influence of corrosion on structural response and residual structural capacity of the corroded elements requires further study.
In the literature, a number of studies exist in which several properties, including corrosion behavior of ECC mixtures, are evaluated. Sahmaran et al.13 focused on the performance of ECC beams subjected to accelerated corrosion using an electrochemical test method in which a constant potential was used to induce different levels of corrosion into the reinforced ECC mortars. After the induction of different corrosion levels, cracks, residual flexural load capacity, and mass loss of the reinforcing bars embedded in the specimens were determined. As a result of this study, it was concluded that due to its high tensile strain capacity and microcracking behavior, ECC significantly prolongs the corrosion prop-agation period while enhancing the ability to maintain the load-carrying capacity of the beams being tested. In a different study by Maalej et al.,14 the performance of ECC
Title No. 112-S63
Effect of Corrosion on Shear Behavior of Reinforced Engineered Cementitious Composite Beamsby M. Sahmaran, O. Anil, M. Lachemi, G. Yildirim, A. F. Ashour, and F. Acar
ACI Structural Journal, V. 112, No. 6, November-December 2015.MS No. S-2014-.R107,R2 doi: 10.14359/51687749, received November 18, 2014,
and reviewed under Institute publication policies. Copyright © 2015, American Concrete Institute. All rights reserved, including the making of copies unless permission is obtained from the copyright proprietors. Pertinent discussion including author’s closure, if any, will be published ten months from this journal’s date if the discussion is received within four months of the paper’s print publication.
772 ACI Structural Journal/November-December 2015
reinforced with hybrid fibers was investigated in a number of potential structural applications. The reviewed applica-tions included the use of hybrid fiber-ECC for designing impact- and blast-resistant protective panels, strengthening of unreinforced masonry (URM) walls, strengthening of RC beams, and enhancing corrosion durability of RC beams. The review demonstrated that hybrid fiber-ECC can signifi-cantly enhance the performance of structures made of these materials. Sahmaran et al.15 also investigated chloride ion permeability, which is a decisive property for corrosion in microcracked ECC specimens containing different supple-mentary cementitious materials (SCMs). In the same study, self-healing of microcracks introduced after the application of pre-loading was also investigated in cases where speci-mens were exposed to different environmental conditions. It was reported that, depending on the type of SCM used in ECC mixtures, even the failed specimens could exhibit low and/or very low chloride ion permeability according to ASTM C1202,16 after exposure to a certain period of envi-ronmental conditioning. This behavior of ECC specimens was found to be related to the ease of self-healability of micron-size cracks in improving permeability characteris-tics. As explained previously, ECC proves itself worthy in terms of several durability characteristics, including corro-sion resistance. Although information related to the material properties of ECC mixtures is widely available in literature, studies that evaluate large-scale structural elements, espe-cially in cases where structural behavior and certain mechan-ical properties are considered in the presence of reinforcing bar corrosion, have rarely been encountered. To account for the related knowledge gap, an experimental study was planned to investigate shear behavior of reinforced ECC and NC beams subjected to different corrosion levels. Shear behavior of both types of beams was evaluated by comparing shear strain γxy, strain in the x-direction εx, and strain in y- direction εy when different corrosion levels were introduced to the specimens. The effects of the different levels of corro-sion on the failure modes and cracking patterns of reinforced beams were also investigated, and a comparison was made between the strength, stiffness, energy absorption capacity, and failure modes of reinforced beams using ECC and NC.
RESEARCH SIGNIFICANCEThe corrosion of steel reinforcement in aging structures
is one of the main problems facing the civil engineering community. While the durability characteristics of small-scale ECC specimens under accelerated corrosion condi-tions are well-known, the influence of reinforcing bar corro-sion on structural behavior and mechanical properties of large-scale structural elements incorporating ECC is not. This study aims to further the knowledge and information required for this key issue.
EXPERIMENTAL PROGRAMMaterials, mixture proportions, and basic mechanical properties
To investigate the influence of different corrosion levels on shear behavior of reinforced ECC and NC beams, ECC and NC mixtures of similar compressive strengths were
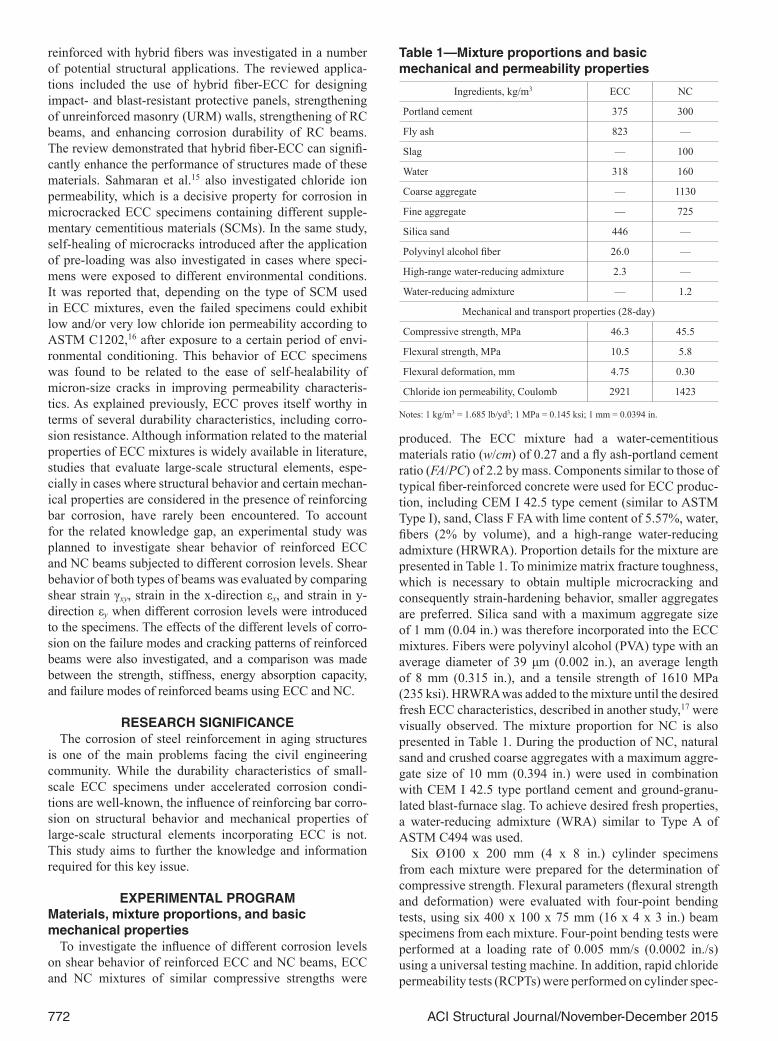
produced. The ECC mixture had a water-cementitious materials ratio (w/cm) of 0.27 and a fly ash-portland cement ratio (FA/PC) of 2.2 by mass. Components similar to those of typical fiber-reinforced concrete were used for ECC produc-tion, including CEM I 42.5 type cement (similar to ASTM Type I), sand, Class F FA with lime content of 5.57%, water, fibers (2% by volume), and a high-range water-reducing admixture (HRWRA). Proportion details for the mixture are presented in Table 1. To minimize matrix fracture toughness, which is necessary to obtain multiple microcracking and consequently strain-hardening behavior, smaller aggregates are preferred. Silica sand with a maximum aggregate size of 1 mm (0.04 in.) was therefore incorporated into the ECC mixtures. Fibers were polyvinyl alcohol (PVA) type with an average diameter of 39 μm (0.002 in.), an average length of 8 mm (0.315 in.), and a tensile strength of 1610 MPa (235 ksi). HRWRA was added to the mixture until the desired fresh ECC characteristics, described in another study,17 were visually observed. The mixture proportion for NC is also presented in Table 1. During the production of NC, natural sand and crushed coarse aggregates with a maximum aggre-gate size of 10 mm (0.394 in.) were used in combination with CEM I 42.5 type portland cement and ground-granu-lated blast-furnace slag. To achieve desired fresh properties, a water-reducing admixture (WRA) similar to Type A of ASTM C494 was used.
Six Ø100 x 200 mm (4 x 8 in.) cylinder specimens from each mixture were prepared for the determination of compressive strength. Flexural parameters (flexural strength and deformation) were evaluated with four-point bending tests, using six 400 x 100 x 75 mm (16 x 4 x 3 in.) beam specimens from each mixture. Four-point bending tests were performed at a loading rate of 0.005 mm/s (0.0002 in./s) using a universal testing machine. In addition, rapid chloride permeability tests (RCPTs) were performed on cylinder spec-
Table 1—Mixture proportions and basic mechanical and permeability properties
Ingredients, kg/m3 ECC NC
Portland cement 375 300
Fly ash 823 —
Slag — 100
Water 318 160
Coarse aggregate — 1130
Fine aggregate — 725
Silica sand 446 —
Polyvinyl alcohol fiber 26.0 —
High-range water-reducing admixture 2.3 —
Water-reducing admixture — 1.2
Mechanical and transport properties (28-day)
Compressive strength, MPa 46.3 45.5
Flexural strength, MPa 10.5 5.8
Flexural deformation, mm 4.75 0.30
Chloride ion permeability, Coulomb 2921 1423
Notes: 1 kg/m3 = 1.685 lb/yd3; 1 MPa = 0.145 ksi; 1 mm = 0.0394 in.

773ACI Structural Journal/November-December 2015
imens measuring Ø100 x 50 mm (4 x 2 in.) cut from Ø100 x 200 mm (4 x 8 in.) cylinders. After 24 hours in the molds, all specimens were moved into plastic bags at 95 ± 5% RH, 23 ± 2°C (73.4°F) to be cured until the age of 28 days. Basic mechanical and permeability properties of ECC and NC mixtures are tabulated in Table 1. Typical bending test results are displayed in Fig. 1 as flexural stress-deflection diagrams for ECC and NC mixtures at the age of 28 days. As seen from Table 1, compressive strength test results at 28 days were similar for ECC and NC mixtures, with values of 46.3 and 45.5 MPa (6.78 and 6.66 ksi), respectively. Even though the NC and ECC exhibited similar compressive strengths, the ECC showed a substantially higher ultimate flexural strength than the NC prisms (10.5 and 5.8 MPa [1.52 and 0.84 ksi] for ECC and NC, respectively). Ultimate deflection capacities, which reflect the material ductility of ECC and NC mixtures, were 4.75 and 0.30 mm (0.187 and 0.0118 in.), respectively. As seen from Fig. 1, the NC mixture was a brittle material with sudden fracture failure, but ECC samples had a significantly higher deformation capability. Chloride ion permeability test results, which can play a decisive role in reinforcement corrosion, are also presented in Table 1. As can be seen from the table, average 28-day RCPT results of ECC specimens (2921 Coulombs) were more than two times those obtained from NC specimens (1423 Coulombs). The higher ECC results were attributed to the higher FA/PC
and to inadequate curing time, which was not sufficient for substantially increased amounts of Class F fly ash particles to be hydrated enough to attain lower chloride ion permea-bility results. It is to be noted that the highest 28-day RCPT result obtained for ECC specimens was in the moderate chlo-ride ion permeability range, according to ASTM C1202.16
During the implementation of typical four-point bending tests to obtain flexural stress-deflection behavior of the spec-imens, not only the midspan beam deflection results, but also support settlement results, were measured. Therefore, graphs in Fig. 1 were drawn by excluding the support settle-ment results (if there is any) from midspan beam deflection results. The lower initial stiffnesses of ECC than NC beams shown in Fig. 1 can be attributed to the lack of coarse aggre-gate and the significantly lower aggregate content of ECC mixtures (refer to Table 1).
The study included 10 reinforced beams, five incorpo-rating ECC and five NC. The shear span-depth ratio (a/d) was set at 2.5 for all beams, where a is the distance from the concentrated load to the reaction, and d is the distance from the center of the tensile flexural reinforcing bars to the top of the reinforced concrete beam. Geometry and details of steel reinforcements are shown in Fig. 2.
Corrosion acceleration and mass loss measurements
To identify different levels of corrosion, mass losses recorded from reinforcing steel were used. Apart from two reference specimens from each mixture, the testing of beams subjected to accelerated corrosion was done in two steps. In the first step, reinforced specimens were kept in the accel-erated corrosion test setup until they reached the predeter-mined corrosion levels. In the second step, all of the beams were tested under monotonous four-point flexure loading until failure to evaluate structural performance under the influence of shear forces.
Saline water with a concentration of 5% NaCl, along with a cathode and power supply to provide electrical current, is normally used as an accelerated corrosion technique in the laboratory. In this technique, reinforcing steel bars embedded inside concrete should act as anodes in the corrosion cells.18 According to ASTM C876-91,19 the half-cell potential test is designed to estimate the expected level of corrosion activity
Fig. 1—Typical flexural stress-deflection graphs of ECC and NC mixtures after 28 days. (Note: 1 MPa = 0.145 ksi; 1 mm = 0.0394 in.)
Fig. 2—Reinforcement details of specimens. (Note: 1 mm = 0.0394 in.)
774 ACI Structural Journal/November-December 2015
in uncoated reinforcing steel bars embedded in concrete. The mass loss resulting from corrosion can be predicted by using Eq. (1), which is reproduced from Faraday’s law.
MassLoss t i Mz FHypothetical =⋅ ⋅
⋅ (1)
where MassLossHypothetical is the difference between the original mass of the metal at the anode and the mass after corrosion, g; t is time, s; i is current, amp; M is the atomic weight of iron (55.847 g/mol); z is ion charge (Meta valency, assumed 2 for Fe → Fe2+ + 2e–); and F is Faraday’s constant (96,487 amp·s).
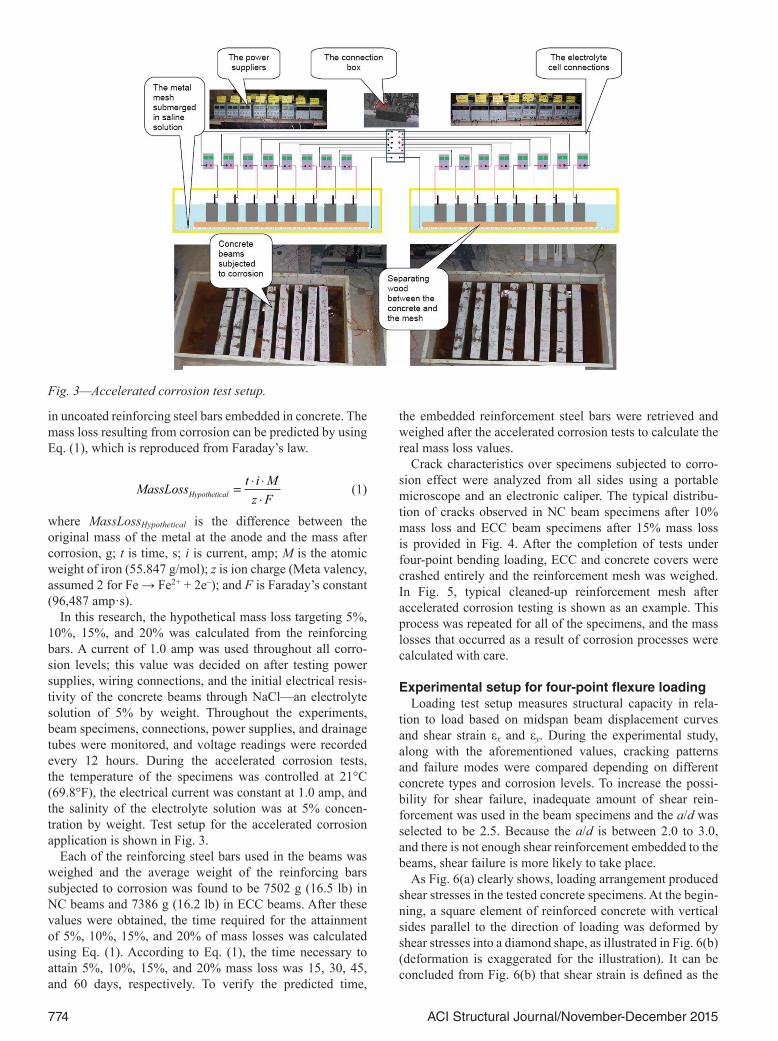
In this research, the hypothetical mass loss targeting 5%, 10%, 15%, and 20% was calculated from the reinforcing bars. A current of 1.0 amp was used throughout all corro-sion levels; this value was decided on after testing power supplies, wiring connections, and the initial electrical resis-tivity of the concrete beams through NaCl—an electrolyte solution of 5% by weight. Throughout the experiments, beam specimens, connections, power supplies, and drainage tubes were monitored, and voltage readings were recorded every 12 hours. During the accelerated corrosion tests, the temperature of the specimens was controlled at 21°C (69.8°F), the electrical current was constant at 1.0 amp, and the salinity of the electrolyte solution was at 5% concen-tration by weight. Test setup for the accelerated corrosion application is shown in Fig. 3.
Each of the reinforcing steel bars used in the beams was weighed and the average weight of the reinforcing bars subjected to corrosion was found to be 7502 g (16.5 lb) in NC beams and 7386 g (16.2 lb) in ECC beams. After these values were obtained, the time required for the attainment of 5%, 10%, 15%, and 20% of mass losses was calculated using Eq. (1). According to Eq. (1), the time necessary to attain 5%, 10%, 15%, and 20% mass loss was 15, 30, 45, and 60 days, respectively. To verify the predicted time,
the embedded reinforcement steel bars were retrieved and weighed after the accelerated corrosion tests to calculate the real mass loss values.
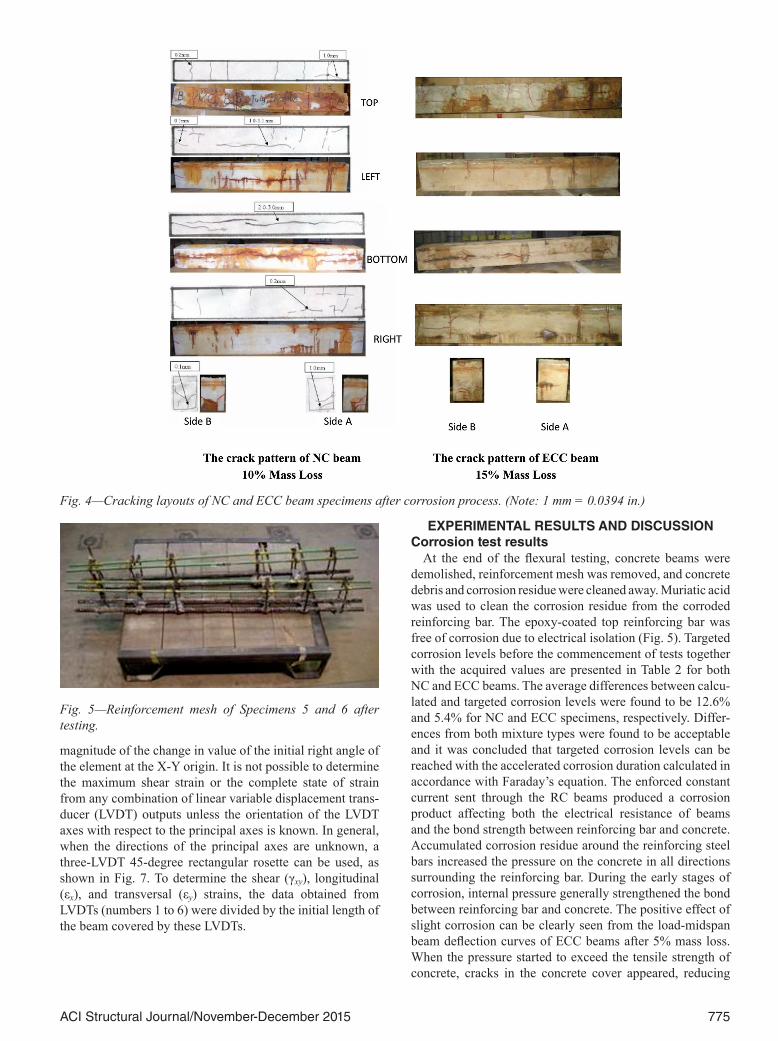
Crack characteristics over specimens subjected to corro-sion effect were analyzed from all sides using a portable microscope and an electronic caliper. The typical distribu-tion of cracks observed in NC beam specimens after 10% mass loss and ECC beam specimens after 15% mass loss is provided in Fig. 4. After the completion of tests under four-point bending loading, ECC and concrete covers were crashed entirely and the reinforcement mesh was weighed. In Fig. 5, typical cleaned-up reinforcement mesh after accelerated corrosion testing is shown as an example. This process was repeated for all of the specimens, and the mass losses that occurred as a result of corrosion processes were calculated with care.
Experimental setup for four-point flexure loadingLoading test setup measures structural capacity in rela-
tion to load based on midspan beam displacement curves and shear strain εx and εy. During the experimental study, along with the aforementioned values, cracking patterns and failure modes were compared depending on different concrete types and corrosion levels. To increase the possi-bility for shear failure, inadequate amount of shear rein-forcement was used in the beam specimens and the a/d was selected to be 2.5. Because the a/d is between 2.0 to 3.0, and there is not enough shear reinforcement embedded to the beams, shear failure is more likely to take place.
As Fig. 6(a) clearly shows, loading arrangement produced shear stresses in the tested concrete specimens. At the begin-ning, a square element of reinforced concrete with vertical sides parallel to the direction of loading was deformed by shear stresses into a diamond shape, as illustrated in Fig. 6(b) (deformation is exaggerated for the illustration). It can be concluded from Fig. 6(b) that shear strain is defined as the
Fig. 3—Accelerated corrosion test setup.
775ACI Structural Journal/November-December 2015
magnitude of the change in value of the initial right angle of the element at the X-Y origin. It is not possible to determine the maximum shear strain or the complete state of strain from any combination of linear variable displacement trans-ducer (LVDT) outputs unless the orientation of the LVDT axes with respect to the principal axes is known. In general, when the directions of the principal axes are unknown, a three-LVDT 45-degree rectangular rosette can be used, as shown in Fig. 7. To determine the shear (γxy), longitudinal (εx), and transversal (εy) strains, the data obtained from LVDTs (numbers 1 to 6) were divided by the initial length of the beam covered by these LVDTs.
EXPERIMENTAL RESULTS AND DISCUSSIONCorrosion test results
At the end of the flexural testing, concrete beams were demolished, reinforcement mesh was removed, and concrete debris and corrosion residue were cleaned away. Muriatic acid was used to clean the corrosion residue from the corroded reinforcing bar. The epoxy-coated top reinforcing bar was free of corrosion due to electrical isolation (Fig. 5). Targeted corrosion levels before the commencement of tests together with the acquired values are presented in Table 2 for both NC and ECC beams. The average differences between calcu-lated and targeted corrosion levels were found to be 12.6% and 5.4% for NC and ECC specimens, respectively. Differ-ences from both mixture types were found to be acceptable and it was concluded that targeted corrosion levels can be reached with the accelerated corrosion duration calculated in accordance with Faraday’s equation. The enforced constant current sent through the RC beams produced a corrosion product affecting both the electrical resistance of beams and the bond strength between reinforcing bar and concrete. Accumulated corrosion residue around the reinforcing steel bars increased the pressure on the concrete in all directions surrounding the reinforcing bar. During the early stages of corrosion, internal pressure generally strengthened the bond between reinforcing bar and concrete. The positive effect of slight corrosion can be clearly seen from the load-midspan beam deflection curves of ECC beams after 5% mass loss. When the pressure started to exceed the tensile strength of concrete, cracks in the concrete cover appeared, reducing
Fig. 4—Cracking layouts of NC and ECC beam specimens after corrosion process. (Note: 1 mm = 0.0394 in.)
Fig. 5—Reinforcement mesh of Specimens 5 and 6 after testing.

776 ACI Structural Journal/November-December 2015
the electrical resistance of RC beams due to direct elec-trical contact through the cracks. The daily voltage readings showed that average electrical resistance was reduced as corrosion proceeded. Fluctuation in the electrical resistance is related to the cracks in the concrete cover, which leads to a wider path between the reinforcing bar and saline solution, resulting in decreased resistance, or to narrower paths that make direct contact more difficult and increase the beam resistance value. Relatively large drops in the electrical resistance value of the beams can be attributed to the devel-opment of very wide cracks or to the spalling of some pieces from the concrete cover. Sudden drops in the beam resistance were observed with increased corrosion levels or in the weak spots of concrete cover at early stages. According to Ohm’s law, the resistance of a concrete beam is determined by the amount of current that passes through it for a given electrical
potential difference (voltage) across the beam. For a constant current of 1 amp, the daily voltage readings showed higher initial resistance in NC beams (21.7 – 27.1 V.) compared to ECC beams (10.3 – 14.3 V.). It can therefore be suggested that the results are in line with the rapid chloride permea-bility test results and initial resistivity is a reasonable factor for the evaluation of concrete’s resistance.
As an indicator of the corrosion process, cracks started to be observed over the surface of beam specimens and crack widths and numbers increased as time passed. As the subse-quent outcome of advanced corrosion, spalling is generally observed in normal concrete, especially at the places near the edges of specimens, where reinforcement is congested (Fig. 8). Transverse cracks originated from the stirrups, while longitudinal cracks were generated from the flexural reinforcing bars. Electrical isolation of the epoxy-coated top reinforcing bars in each beam left the top parts of both the NC and ECC beams free of any longitudinal cracks. The pattern of cracks that originated due to corrosion exhib-ited a high correlation with the shapes of corroded welded wire reinforcement. In Fig. 4, the distribution of corrosion- induced cracks is shown for the two selected specimens. As seen from the figure, the cracking pattern was significantly
Fig. 6—Measurement technique of shear and normal strain.
Fig. 7—Instrumentation of specimens. (Note: Dimensions in mm; 1 mm = 0.0394 in.)
Table 2—Comparison of hypothetical and real mass loss due to corrosion
Spec-imenNo.
Level of corrosion
Concrete type/beam
number
Real mass loss
Hypothetical mass loss
Differ-ences, %
1Zero
NC/B1 — — —
2 ECC/B1 — — —
35%
NC/B3 5.79 5 15.8
4 ECC/B3 5.61 5 12.2
510%
NC/B10 9.60 10 4.2
6 ECC/B4 10.39 10 3.9
715%
NC/B4 14.62 15 2.6
8 ECC/B5 15.56 15 3.7
920%
NC/B8 20.41 20 2.1
10 ECC/B6 20.39 20 2.0

777ACI Structural Journal/November-December 2015
different for ECC and NC. The crack width of NC specimens increased with corrosion exposure time. Average crack widths observed as a result of corrosion processes were 0.48 mm (0.019 in.), 0.96 mm (0.038 in.), 4.92 mm (0.194 in.) in the case of 5%, 10% and 15% of mass losses for NC beams, respec-tively. These were typical corrosion-induced cracks caused by circumferential tensile stresses due to the expansive corro-sion products. The exponential increase in crack width with the linear increase in mass losses for NC beams influenced structural load-carrying capacity and failure modes, which are discussed in detail in the next section. In the case of 20% of mass loss, spalling was observed for both NC beams (Fig. 8). On the other hand, multiple microcracks with widths less than 0.2 mm (0.0079 in.) were observed on the faces of the ECC beams. The number of microcracks on the surfaces of ECC specimens increased as corrosion progressed, which could be attributed to the strain hardening and multiple-cracking behaviors of ECC compared to that of NC.
Test results of NC and ECC beamsGeneral behavior and failure modes—After inducing
different degrees of accelerated corrosion, the corroded beams were tested under a four-point flexure test setup (as shown in Fig. 7) to determine their residual load-deflection curves and flexural properties. After the completion of tests, load-midspan beam displacement curves were plotted by taking different corrosion levels into consideration (Fig. 9). Test results are summarized in Table 3, and crack distributions of beam specimens after flexural tests are shown in Fig. 10.
In the case of the NC/B1 beam specimen, flexure cracks were observed in the maximum moment region at the begin-ning of the test, and diagonal shear cracks were observed near shear spans as loading was increased. Tensile region- reinforcements of reference Beam Specimen NC/B1 yielded at 152.1 kN (34.2 kip) total load level and, as a conse-quence of the widening of shear cracks observed near the shear spans, the beam suddenly failed at 9.44 mm (0.37 in.) midspan deflection level after it showed a small amount of further deflection, as presented in Fig. 9(a).
In the case of the reference beam specimen incorporating ECC (ECC/B1), yielding of reinforcement was observed at 220.0 kN (49.5 kip) loading level and deflection of 8.53 mm (0.34 in.). The higher yield load of ECC/B1 showed a higher tensile stress contribution by ECC than in NC/B1. After the ECC/B1 beam specimen showed a maximum load-carrying capacity of 226.1 kN (50.8 kip), it continued to carry addi-tional load until 50.25 mm (1.98 in.) deflection value. At this level of deflection and at a load of 199.0 kN (44.7 kip), failure occurred due to the crushing of concrete in the maximum moment region. When the failure modes of the NC/B3 and ECC/B3 beam specimens that were subjected to 5% mass loss were evaluated, it was observed that tensile region- reinforcements of both beams had reached their tensile yielding points. Moreover, an increase in the load-car-rying capacity of the NC/B3 beam was observed, which was related to the increased bond between concrete and reinforcements that is the result of increased internal pres-sure occurring in tensile and shear reinforcing bars after the corrosion process. Although the increments occurred in
the NC/B3 beam, the ECC/B3 beam exhibited similar load- deflection behavior to the ECC/B1 reference beam that was not subjected to corrosion, with no change observed in load-carrying capacity values. The NC/B3 beam specimen showed sudden shear failure at 200.6 kN (45.1 kip) loading and 13.36 mm (0.53 in.) deflection level due to sudden widening of the shear crack that occurred in the right shear span. The ECC/B3 beam specimen exhibited ductile behavior under flexure loading and failed at 191.9 kN (43.1 kip) loading and 55.1 mm (2.17 in.) deflection level as a result of the crushing of the concrete material itself in the compres-sion zone. When the load-deflection graphs of the NC/B10 and ECC/B4 beam specimens subjected to 10% mass loss are assessed, it can be observed that the tensile region-rein-forcements of both beams had reached their tensile yielding points. The NC/B10 beam specimen showed similar load-deflection behavior to the NC/B1 reference specimen, and failed suddenly right after the yielding of tensile-region reinforcements at 162.2 kN (34.5 kip) loading and 7.25 mm (0.29 in.) deflection level due to excessive widening of shear cracks in the left span. Tensile region-reinforcements of the ECC/B4 beam yielded at 199.8 kN (44.9 kip) loading and 7.91 mm (0.31 in.) deflection level. After the beam reached 212.8 kN (47.8 kip) maximum load-carrying capacity, it failed at 175.1 kN (39.4 kip) loading and 30.14 mm (1.19 in.) deflec-tion level due to crushing of concrete in the compression zone.
When the load-deflection graphs of the NC/B4 and ECC/B5 beam specimens subjected to 15% mass loss are assessed, it can be observed that both beams failed in a
Fig. 8—NC and ECC specimens after 20% mass loss.

778 ACI Structural Journal/November-December 2015
brittle manner before the tensile-region reinforcements reached their yielding points. NC/B4 showed sudden and brittle behavior without any ductile deformation at 73.7 kN (16.6 kip) loading level due to excessive widening of shear cracks in the left shear span. The same failure behavior was observed in the ECC/B5 beam, but failed at a much higher loading level of 175.0 kN (39.3 kip) due to further opening of shear crack in the right shear span.
The NC/B8 and ECC/B6 beam specimens subjected to 20% mass loss showed brittle shear failure before tensile- region reinforcements of the specimens reached their yield strength. In the case of the NC/B8 specimen, along with the shear cracks in the right shear span, a wide bond crack formed parallel to the tensile-region reinforcements and continued throughout the entire beam. This crack negatively affected the bond between main tensile-region reinforce-
ment and the concrete material, causing sudden and brittle failure of the beam with no ductile behavior. Internal pres-sure due to the corrosion of main tensile region-reinforce-ment caused separation of concrete and reinforcing bar at very low loading levels in this area. The NC/B8 beam spec-imen failed without exhibiting any ductile behavior at the loading level of 62.3 kN (14 kip). Sudden and brittle failure was also observed at 190.1 kN (42.7 kip) loading level in the ECC/B6 beam, due to the widening of shear cracks that occurred in the left shear span.
Failure modes of the beam specimens varied depending on the induced corrosion level. Although all of the speci-mens incorporating NC showed shear failure, tensile-region reinforcements of the beams yielded when the corrosion levels were 5% and 10%. When the corrosion level was increased to 20% for the same specimens, bond degradation
Fig. 9—Load-midspan beam displacement graphs of specimens. (Note: 1 kN = 0.225 kip; 1 mm = 0.0394 in.)

779ACI Structural Journal/November-December 2015
of reinforcements was observed along with the shear failure. In ECC beams subjected to 5% and 10% corrosion, ductile flexural behavior was monitored. However, when the level of corrosion was increased to 15% and 20%, both NC and ECC beams showed shear failure.
Strength and stiffness—Maximum load-carrying capac-ities of the beams were compared and evaluated, taking different concrete types and corrosion levels into consid-eration. Generally speaking, the average load-carrying capacity of ECC beams was 58% higher than that of the NC beams. The difference in load-carrying capacity between
reference ECC and NC beams was 49%. In the case of spec-imens exposed to 5% corrosion, the difference decreased to 13%. As the level of corrosion was increased, the differences in load-carrying capacity became more evident. When the maximum load-carrying capacities of ECC beams subjected to 10%, 15%, and 20% corrosion levels were compared with the corresponding NC beams, the ECC beams results were 31%, 138%, and 205% higher than those of the NC beams for the given corrosion levels, respectively. Corrosion was less influential on the load-carrying capacity of ECC beams compared to NC beams. Tensile-region reinforcements in
Table 3—Overall results of beam specimens after four-point bending tests
Specimen No.Level of corrosion
Concrete type/beam number
Ultimate load, kN
Flexure crack load, kN
Shear crack load, kN
Initial stiffness, kN/mm
Energy absorption capacity, kN·mm Ratio*, %
1Zero
NC/B1 152.1 50 80 35.65 1035 6
2 ECC/B1 226.1 90 145 27.03 9277 8
35%
NC/B3 200.6 30 130 35.37 2230 4
4 ECC/B3 227.0 80 135 31.12 9995 1
510%
NC/B10 162.2 20 70 38.79 1382 33
6 ECC/B4 212.8 75 125 30.89 5072 12
715%
NC/B4 73.7 50 70 31.16 681 29
8 ECC/B5 175.0 65 110 41.14 1973 26
920%
NC/B8 62.3 10 40 28.44 534 31
10 ECC/B6 190.1 60 100 36.33 2754 24
*Ratio of shear displacement to midspan displacement.
Notes: 1 kN = 0.225 kip; 1 kN/mm = 5.71 kip/in.; 1 kN·mm = 0.009 kip·in.
Fig. 10—Cracking patterns of beam specimens after four-point flexural test.
780 ACI Structural Journal/November-December 2015
the reference ECC beam showed yielding at the same level as the reinforcements in ECC beams exposed to 5% and 10% corrosion, and all of the specimens showed ductile flexural behavior thereafter. Tensile-region reinforcements of NC beams exposed to 0% (reference), 5%, and 10% corrosion levels reached the yielding point but were followed by brittle shear failure due to the enlargement of shear cracks.
The initial stiffness values of the beams were determined by calculating the slope of the line that connects the origin to the point where the first change in slope was observed in the load-midspan deflection curve. When the calculated initial stiffness values are evaluated, it can be seen that NC beams possess higher initial stiffness values than that of ECC beams at corrosion levels of 0%, 5%, and 10% so that the results were higher by 32%, 14%, and 26%, respectively. The higher initial stiffness value of NC beams, which indi-cates higher rigidity of the material, could be attributed to the significantly high amount of coarse aggregate in the produc-tion of NC mixtures compared with ECC mixtures. Because of micromechanical design constraints, only limited amount of microsilica sand is used in ECC production. However, at 15% and 20% corrosion, the stiffness values of NC beams were 32% and 28% lower than those of ECC beams, respec-tively. While the increment of corrosion caused NC beams to show reduced initial stiffness results, it did not result in important changes in the stiffness results of ECC beams. As a matter of fact, with the increments in corrosion levels, initial stiffness values of ECC beams increased as well. For example, initial stiffness results of ECC beams subjected to 0%, 5%, and 10% of corrosion levels were found to be 30% less than those exposed to 15% and 20% of corrosion on average. These results, therefore, suggest that increased corrosion levels have a more adverse effect on the initial stiffness results of NC beams than ECC beams, leading to rapid reductions in the initial stiffness of NC beams.
Energy absorption capacity—Energy absorption capac-ities of the specimens were calculated as the area under load-midspan beam deflection curves (shown in Fig. 9), and the results are tabulated in Table 3. The average energy absorption capacity of NC beams was 1172 kN·mm (10.4 kip·in.), while the capacity of ECC was nearly five times greater, with an energy absorption value reaching 5814 kN·mm (51.5 kip·in.). This is mainly related to the high deformability and ductility exhibited by ECC beams. Because ECC beams showed ductile behavior and failed at the compression zone, their absorption capacitiy was higher than NC beams, which generally exhibited sudden and brittle failure.
As the level of corrosion applied to the beam specimens was increased, the difference in the energy absorption capacity results became less pronounced, and the maximum difference monitored was in the reference specimens. The reference ECC/B1 beam absorbed nine times more energy than the reference NC/B1 beam. For corrosion levels of 5%, 10%, 15%, and 20%, the energy absorption capacity of ECC beams was 4.5, 3.7, 2.9, and 5.2 times that of NC beams, respectively. As the corrosion levels increased, the differ-ence between the energy absorption capacity results of ECC
and NC beams showed decreasing trend. For instance, when the corrosion level reached to 20% level, while there was no reduction in the load-carrying capacity of ECC beams, there was a significant decrement for NC beams. Therefore, the difference between the energy absorption capacities of ECC and NC beams increased at 20% of corrosion level. This finding therefore suggests that, even in the cases where high levels of corrosion were experienced, ECC-beams preserve their load-carrying and energy-absorption capacities.
Shear displacement—Shear displacement values presented in Table 3 were calculated by simply recording the percent share of shear displacements in overall displacement measurements until failure. In other words, percent values given in Table 3 are assumed to be the ratio of vertical shear displacement values arising from diagonal shear cracks to total midspan displacement measurements recorded from the specimens at failure. For the calculation of shear displace-ment values, rosettes composed of three different LVDTs were placed over left and right shear spans of the beams. Through the use of shear crack measurements recorded by 45-degree angled LVDTs, vertical displacement compo-nents formed due to these cracks were calculated and the ratio between calculated vertical displacements to midspan beam displacements was evaluated. Shear displacement values of the beams were calculated by taking the average of results obtained from LVDTs placed over the right and left shear spans. Details of the LVDTs are shown in Fig. 7. The approach used for this calculation is shown in Fig. 11 together with strain geometry. According to the approach presented in Fig. 11, Eq. (2), (3), (4), and (5) below were used for the calculation of vertical shear displacement, which was the three LVDT measurements recorded from left and right shear spans. Some examples of the calculated load-vertical shear displacement curves were provided in Fig. 12. For each beam specimen, vertical shear displace-ment values were calculated by averaging the vertical shear displacement results obtained from left and right shear spans. The ratios between calculated shear-to-midspan displacements for all the beams tested are presented in the last column of Table 3. The overall average shear displace-ment ratio values calculated for NC and ECC beams were 20.6% and 14.2%, respectively. Therefore, the overall shear displacement results of the NC beams were 45% higher than in ECC beams, on average. This finding therefore implies that shear displacement of specimens incorporating NC was significantly higher than in specimens incorporating ECC. This result also corresponds well with the failure modes of the specimens, because NC beams failed due to the exces-sive widening of shear cracks.
αθ
=
=
′ − ′
′ + ′arctan arctan
sin( )yx
l l
l la
a
1 2
1 2
2
22
1 2
1 2
−′ − ′′ + ′
cos( )arctan tan(
θθ
l ll l
))
arctan arctan
=′ − ′′ + ′
=−
l ll l
hw
1 2
1 2
1ε ε22
1 22 + +
ε ε
hw
(2)

781ACI Structural Journal/November-December 2015
βθ
=
=
′ − ′
′ + ′arctan arctan
cos( )yx
l l
l lc
c
1 2
1 2
2
22
1 2
1 2
−′ − ′′ + ′
sin( )arctan cot(
θθ
l ll l
))
arctan arctan
=′ − ′′ + ′
=−
l ll l
hw
1 2
1 2
1ε ε22
1 22 + +
ε ε
hw
(3)
γxy = α + β (4)
δsh = γxy · h (5)
As seen from Table 3, with the increase in induced corrosion levels, the ratio of shear displacement to midspan displace-ment values increased substantially. For example, while the average shear displacement result was approximately 5% for specimens exposed to a 0% and 5% corrosion level, these values were 23%, 28%, and 28% for specimens exposed to 10%, 15%, and 20% corrosion levels, respectively. As the level of corrosion increased, the difference between shear displacement values in ECC and NC beams decreased. Shear displacement ratio results of NC beams exposed to 5% and 10% corrosion were 4 and 2.75 times the results of the corresponding ECC beams, respectively. However, the difference in shear displacement ratios decreased to 12% and 29% at 15% and 20% corrosion levels, respectively. Experi-mentally calculated shear displacement values of both ECC and NC beams were found to be high. For all the specimens, it was observed that shear displacement values reached up to 17.5% of the displacement obtained from midspan. This was an anticipated outcome because the RC beam speci-mens were designed with inadequate shear strength and high shear failure possibility. Because the main purpose of the present study was to investigate the shear behavior of ECC and NC beams subjected to different corrosion levels, shear displacement values of beams were large. However, shear displacement ratio of ECC beams went down to a 14.2% value, which was believed to be a significant achievement because, as previously explained, the risk of shear failure to take place in the beams is rather high.
CONCLUSIONSIn this experimental study, 10 beam specimens incor-
porating two different concrete types (NC and ECC) with similar compressive strength values were investigated in terms of shear behavior. Accelerated corrosion tests were applied to the beams to achieve 5%, 10%, 15%, and 20% mass loss in the reinforcing steel bars. Data collected from the tests were used to monitor and assess the shear behaviour of NC beams in comparison to ECC beams, along with final structural failure modes. Based on the results and analysis presented in this paper, the following conclusions can be drawn:
1. ECC had significantly higher load-carrying and energy- absorption capacity than NC. With the use of ECC, even reinforced beams with inadequate shear strength values could be upgraded to a level where the structural elements behave in a ductile manner under four-point bending. Moreover, corrosion was significantly less influential on the shear performance of ECC beams in compar-
ison to NC beams. However, as corrosion increased to 15% and 20% levels, load-carrying and energy- absorption capacities of the specimens were negatively influenced and failure modes changed to brittle shear failure.
2. Corrosion was less influential on load-carrying capacity of ECC beams compared to NC beams. The average load-carrying capacity of beams produced with ECC was 58% higher than that of the beams produced with NC. The differences between the load-carrying capacities became more obvious with the increase in corrosion level. When the maximum load-carrying capacities of ECC beams subjected to 10%, 15%, and 20% of corrosion levels are compared with the corresponding NC beams, the results of the ECC beams were 31%, 138%, and 205% higher than those of the NC beams for the given corrosion levels, respectively.
3. It was shown that NC beams possess higher initial stiffness than that of ECC beams at corrosion levels of 0%, 5%, and 10%. For the given corrosion levels, intial stiffness values of NC beams were found to be 32%, 14%, and 26% higher than ECC beams, respectively. However, at 15% and 20% corrosion, the stiffness values of NC beams were 32% and 28% lower than those of ECC beams, respectively. As
Fig. 11—Vertical shear displacement calculation approach for diagonal shear crack.
Fig. 12—Examples of load-calculated vertical shear displacement graphs of specimens. (Note: 1 kN = 0.225 kip; 1 mm = 0.0394 in.)

782 ACI Structural Journal/November-December 2015
the corrosion levels increased, initial stiffness values of ECC beams increased as well. These results, therefore, suggest that increased corrosion levels have a more adverse effect on initial stiffness results of NC beams than ECC beams, which leads to rapid reductions in the values.
4. The average energy absorption capacity of NC beams was 1172 kN·mm (10.4 kip·in.), while that of ECC beams was nearly five times higher, reaching 5814 kN·mm (51.5 kip·in.). Differences in the energy absorption capac-ities of ECC and NC beams became less evident with the increase in induced corrosion levels.
5. Shear displacement results for the NC beams were, on average, 45% higher than these recorded for the ECC beams. This finding implies that shear displacement of specimens incorporating NC was significantly higher than that for spec-imens incorporating ECC. As the corrosion levels applied to the beams were increased, shear displacement results signifi-cantly increased as well. However, the increase in corrosion level caused shear displacement differences between NC and ECC beams to decrease.
AUTHOR BIOSMustafa Sahmaran is an Associate Professor in the Department of Civil Engineering at Gazi University, Ankara, Turkey. His research interests include advanced materials technology and composite materials develop-ment for sustainable infrastructures.
Ozgur Anil is a Professor in the Department of Civil Engineering at Gazi University. His research interests include repair and retrofit of reinforced concrete structures, static and dynamic analysis of structures, and finite element analysis.
Mohamed Lachemi is a Professor in the Department of Civil Engineering at Ryerson University, Toronto, ON, Canada. His research interests include the use of high-performance materials in the built infrastructure.
Gurkan Yildirim is a PhD candidate in the Department of Civil Engi-neering at Gazi University. His research interests include the development of composite materials for sustainable infrastructures.
Ashraf F. Ashour is a Reader in Structural Engineering at the Univer-sity of Bradford, West Yorkshire, UK. He received his BSc and MSc from Mansoura University, Mansoura, Egypt, and his PhD from Cambridge University, Cambridge, UK. His research interests include shear, plasticity, and optimization of reinforced concrete and masonry structures.
Fikri Acar is an Engineer at the Ministry of Environment & Urbanization, Turkey. He received his MSc and PhD from Middle East Technical Univer-sity, Ankara, Turkey.
NOTATIONa = distance between applied shear force and supportd = effective height (distance between upper concrete fiber and
tensile reinforcement)F = Faraday’s constant (96,487 amp·s)h = height of rectanglei = current, ampl1 = length of first diagonal of rectanglel2 = length of second diagonal of rectanglel1′ = length of first diagonal of rectangle after deformationl2′ = length of second diagonal of rectangle after deformationM = atomic weight of iron (55.847 g/mol)t = time, sw = width of rectanglexa = x-coordinate of Point Axb = x-coordinate of Point Bxc = x-coordinate of Point Cya = y-coordinate of Point Ayb = y-coordinate of Point Byc = y-coordinate of Point C
z = ion charge (Meta valency assumed 2 for Fe → Fe2+ + 2e–)α = first component of shear strainβ = second component of shear strainδsh = shear displacementδ1 = displacement in direction of first diagonalδ2 = displacement in direction of second diagonalεx = longitudinal strainεy = transversal strainε1 = strain in direction of first diagonalε2 = strain in direction of second diagonalγxy = shear strainθ = angle between horizontal axis and diagonal of rectangle
REFERENCES1. Li, M., and Li, V. C., “Durability of HES-ECC Repair under Mechan-
ical and Environmental Loading Conditions,” Proceedings of High Performance Fiber Reinforced Cement Composites (HPFRCC5), Mainz, Germany, 2007, pp. 399-408.
2. Lauer, K. R., and Slate, F. O., “Autogenous Healing of Cement Paste,” ACI Journal Proceedings, V. 52, No. 6, June 1956, pp. 1083-1097.
3. Li, V. C., “ECC—Tailored Composites through Micromechanical Modeling,” Fiber Reinforced Concrete: Present and the Future, Canadian Society of Civil Engineers, Montreal, QC, Canada, 1998, pp. 64-97.
4. Li, V. C.; Wang, S.; and Wu, C., “Tensile Strain-Hardening Behavior of PVA-ECC,” ACI Materials Journal, V. 98, No. 6, Nov.-Dec. 2001, pp. 483-492.
5. Li, V. C., “On Engineered Cementitious Composites (ECC)—A Review of the Material and its Applications,” Journal of Advanced Concrete Technology, V. 1, No. 3, 2003, pp. 215-230. doi: 10.3151/jact.1.215
6. Sahmaran, M.; Li, M.; and Li, V. C., “Transport Properties of Engi-neered Cementitious Composites under Chloride Exposure,” ACI Materials Journal, V. 104, No. 6, Nov.-Dec. 2007, pp. 604-611.
7. Li, V. C.; Wu, C.; Wang, S.; Ogawa, A.; and Saito, T., “Interface Tailoring for Strain-Hardening PVA-ECC,” ACI Materials Journal, V. 99, No. 5, Sept.-Oct. 2002, pp. 463-472.
8. Smith, K. M.; Schokker, A. J.; and Tikalsky, P. J., “Performance of Supplementary Cementitious Materials in Concrete Resistivity and Corro-sion Monitoring Evaluations,” ACI Materials Journal, V. 101, No. 5, Sept.-Oct. 2004, pp. 385-390.
9. Li, V. C., and Wang, S., “Flexural Behavior of GFRP Reinforced Engi-neered Cementitious Composite Beams,” ACI Materials Journal, V. 99, No. 1, Jan.-Feb. 2002, pp. 11-21.
10. Keoleian, G. A.; Kendall, A.; Dettling, J. E.; Smith, V. M.; Chan-dler, R.; Lepech, M. D.; and Li, V. C., “Life Cycle Modeling of Concrete Bridge Design: Comparison of Engineered Cementitious Composite Link Slabs and Conventional Steel Expansion Joints,” Journal of Infra-structure Systems, ASCE, V. 11, No. 1, 2005, pp. 51-60. doi: 10.1061/(ASCE)1076-0342(2005)11:1(51)
11. Bentz, E. C.; Vecchio, F. J.; and Collins, M. P., “Simplified Modified Compression Field Theory for Calculating Shear Strength of Reinforced Concrete Elements,” ACI Structural Journal, V. 103, No. 4, July-Aug. 2006, pp. 614-624.
12. Collins, M. P.; Bentz, E. C.; Sherwood, E. G.; and Xie, L., “An Adequate Theory for the Shear Strength of Reinforced Concrete Struc-tures,” Magazine of Concrete Research, V. 60, No. 9, 2008, pp. 635-650. doi: 10.1680/macr.2008.60.9.635
13. Sahmaran, M.; Li, V. C.; and Andrade, C., “Corrosion Resistance Performance of Steel-Reinforced Engineered Cementitious Composite Beams,” ACI Materials Journal, V. 105, No. 3, May-June 2008, pp. 243-250.
14. Maalej, M.; Quek, D. T.; Ahmed, S. F. U.; Zhang, J.; Lin, V. W. J.; and Leong, K. S., “Review of Potential Structural Applications of Hybrid Fiber Engineered Cementitious Composites,” Construction and Building Mate-rials, V. 36, 2012, pp. 216-227. doi: 10.1016/j.conbuildmat.2012.04.010
15. Sahmaran, M.; Yildirim, G.; and Erdem, T. K., “Self-Healing Capa-bility of Cementitious Composites Incorporating Different Supplementary Cementitious Materials,” Cement and Concrete Composites, V. 35, No. 1, 2013, pp. 89-101. doi: 10.1016/j.cemconcomp.2012.08.013
16. ASTM C1202-12, “Standard Test Method for Electrical Indication of Concrete’s Ability to Resist Chloride Ion Penetration,” ASTM Interna-tional, West Conshohocken, PA, 2012, 7 pp.
17. Yang, E.; Şahmaran, M.; Yang, Y.; and Li, V. C., “Rheological Control in the Production of Engineered Cementitious Composites,” ACI Materials Journal, V. 106, No. 4, July-Aug. 2009, pp. 357-366.
18. Von Baeckmann, W.; Schwenk, W.; and Prinz, W., Handbook of Cathodic Corrosion Protection, Gulf Professional Publishing, Houston, TX, 1997, 568 pp.
19. ASTM C876-91(1999), “Standard Test Method for Half-Cell Poten-tials of Uncoated Reinforcing Steel in Concrete,” ASTM International, West Conshohocken, PA, 1999, 6 pp.


![Electrochemical corrosion studies of various metals€¦ · [1]. In a closed electrochemical circuit cur-[7] expressed as:Fundamentals of Electrochemical Corrosion, E. E. Stansbury,](https://static.fdocuments.in/doc/165x107/5f73a612cc40d85fce097206/electrochemical-corrosion-studies-of-various-metals-1-in-a-closed-electrochemical.jpg)