EFFECT OF COOLANT TEMPERATURE ON...
7
4 th International Conference on Mechanical Engineering, December 26-28, 2001, Dhaka, Bangladesh/pp. III 235-241 Section III: Thermal Engineering 235 EFFECT OF COOLANT TEMPERATURE ON PERFORMANCE OF A SI ENGINE Mohammad Mamun* Dr. Md. Ehsan** Department of Mechanical Engineering Bangladesh University of Engineering and Technology Abstract This research work is aimed at investigating the effect of variation of coolant temperature ranging from 45-85°C, thus effecting the heat removal rate, on the performance of an automotive SI engine. The specific aim of this study was to investigate the effect of variation of cooling water temperature as well as the cooling rate on the Pressure-Time (P-t) and Pressure-Volume (P-V) diagrams of the engine cycle, at different speed and load conditions. Performance parameters such as brake specific fuel consumption rate, air-fuel ratio, temperatures of coolant, lubricating oil as well as the engine body and emission analysis of the exhaust gases were also investigated at different engine speed and load conditions. Keywords: P-V diagram, SI engine, Coolant temperature. INTRODUCTION Temperature in the combustion chamber has always been an interesting research area for studying the effect on performance of IC engines. This is related to combustion parameters as well as the heat transfer rate to the cooling water. The coolant water may remove up to one third of the heat generated due to combustion that generally takes place at an optimized coolant temperature. This research work examines the use of in- cylinder measurements for engine control with emphasis on the analysis of cyclic variation of cylinder pressure (P-t) and Indicator Diagram (P-V) with coolant temperature along with other parameters such as Power developed, Brake specific fuel consumption rate, Air flow rate, Air-fuel ratio, Temperatures of intake and exhaust gases, Lubricating oil as well as the engine body and Emission analysis of the exhaust gases. The parameter chosen in this investigation was the temperature of the cooling water of the engine on its way back to the radiator. The coolant water outlet temperature was varied through 45-85°C by adjusting the water flow. So heat losses to the cooling water was rather controlled qualitatively (lower mass flow and higher temperature difference), rather than quantitatively. On the other hand, the elevated water temperature in the water-jacket could have quantitatively influence the combustion process and heat losses to some extent. This investigation may have practical implications when many automotive engines in Bangladesh are run with faulty/inadequate cooling system specially in congested traffic jams in hot summer days. It may also contribute to indicate the causes of emissions from the engine. From technological point of view, this project using high speed computerized data acquisition of the indicator diagram (P-V) was one of the first of its kind in our country and it could open up an enhanced arena for further investigation of the various other parameters related to the engine performance. LITERATURE REVIEW As early as 1951, cylinder pressure was proposed as a feedback signal for use in a closed-loop ignition control scheme [Draper et. al.1951]. It is shown that a specific crank-angle location of peak pressure correlates well with best torque, and can be used for closed loop control of ignition timing [Powell et. al. 1983]. It is proposed to use the combustion phasing angle, defined as the crank angle where apparently 50% of the heat from the combustion process in a cycle has been released, for Maximum Brake Torque (MBT) ignition timing [Klimstra 1985]. Different methods of measurement of peak cylinder pressure are practiced [Jacobson et. al. 1999]. Quantitative analysis of the pressure signal has been proposed for estimation and closed-loop control of air-fuel ratio. Using regression techniques correlated cylinder pressure measurements with AFR, EGR rate, HC, NO x , CO and CO 2 emissions [Wibberley et. al. 1989]. A single-zone combustion model is used to regulate position of an equivalent heat release, which resulted in an indirect control of AFR [Leisenring et. al. 96]. Studies have also been made recently to correlate the estimation of heat release rate with cylinder pressure * Email: [email protected] ** Email: [email protected]
Transcript of EFFECT OF COOLANT TEMPERATURE ON...

4th International Conference on Mechanical Engineering, December 26-28, 2001, Dhaka, Bangladesh/pp. III 235-241
Section III: Thermal Engineering 235
EFFECT OF COOLANT TEMPERATURE ON PERFORMANCE OF A SI ENGINE
Mohammad Mamun*
Dr. Md. Ehsan** Department of Mechanical Engineering
Bangladesh University of Engineering and Technology
Abstract This research work is aimed at investigating the effect of variation of coolant temperature ranging from 45-85°C, thus effecting the heat removal rate, on the performance of an automotive SI engine. The specific aim of this study was to investigate the effect of variation of cooling water temperature as well as the cooling rate on the Pressure-Time (P-t) and Pressure-Volume (P-V) diagrams of the engine cycle, at different speed and load conditions. Performance parameters such as brake specific fuel consumption rate, air-fuel ratio, temperatures of coolant, lubricating oil as well as the engine body and emission analysis of the exhaust gases were also investigated at different engine speed and load conditions. Keywords: P-V diagram, SI engine, Coolant temperature.
INTRODUCTION
Temperature in the combustion chamber has always been an interesting research area for studying the effect on performance of IC engines. This is related to combustion parameters as well as the heat transfer rate to the cooling water. The coolant water may remove up to one third of the heat generated due to combustion that generally takes place at an optimized coolant temperature. This research work examines the use of in-cylinder measurements for engine control with emphasis on the analysis of cyclic variation of cylinder pressure (P-t) and Indicator Diagram (P-V) with coolant temperature along with other parameters such as Power developed, Brake specific fuel consumption rate, Air flow rate, Air-fuel ratio, Temperatures of intake and exhaust gases, Lubricating oil as well as the engine body and Emission analysis of the exhaust gases. The parameter chosen in this investigation was the temperature of the cooling water of the engine on its way back to the radiator. The coolant water outlet temperature was varied through 45-85°C by adjusting the water flow. So heat losses to the cooling water was rather controlled qualitatively (lower mass flow and higher temperature difference), rather than quantitatively. On the other hand, the elevated water temperature in the water-jacket could have quantitatively influence the combustion process and heat losses to some extent. This investigation may have practical implications when many automotive engines in Bangladesh are run
with faulty/inadequate cooling system specially in
congested traffic jams in hot summer days. It may also contribute to indicate the causes of emissions from the engine. From technological point of view, this project using high speed computerized data acquisition of the indicator diagram (P-V) was one of the first of its kind in our country and it could open up an enhanced arena for further investigation of the various other parameters related to the engine performance.
LITERATURE REVIEW
As early as 1951, cylinder pressure was proposed as a feedback signal for use in a closed-loop ignition control scheme [Draper et. al.1951]. It is shown that a specific crank-angle location of peak pressure correlates well with best torque, and can be used for closed loop control of ignition timing [Powell et. al. 1983]. It is proposed to use the combustion phasing angle, defined as the crank angle where apparently 50% of the heat from the combustion process in a cycle has been released, for Maximum Brake Torque (MBT) ignition timing [Klimstra 1985]. Different methods of measurement of peak cylinder pressure are practiced [Jacobson et. al. 1999]. Quantitative analysis of the pressure signal has been proposed for estimation and closed-loop control of air-fuel ratio. Using regression techniques correlated cylinder pressure measurements with AFR, EGR rate, HC, NOx, CO and CO2 emissions [Wibberley et. al. 1989]. A single-zone combustion model is used to regulate position of an equivalent heat release, which resulted in an indirect control of AFR [Leisenring et. al. 96]. Studies have also been made recently to correlate the estimation of heat release rate with cylinder pressure
* Email: [email protected] ** Email: [email protected]

ICME 2001, Dhaka, December 26-28
Section III: Thermal Engineering 236
data using quantitative analysis approach [Tunestal et. al. 1998]. The author demonstrated that relatively computationally intensive tasks can be performed easily on a cycle by cycle basis and the results fed back to an engine controller. They also suggest to investigate the influence of spark timing and air-fuel ratio on these pressure-based parameters, and further, on exhaust composition and temperature, since this is what determines the tailpipe emissions and time to light-off the catalytic converter.
EXPERIMENTAL SETUP
The experimental setup for this project work consisted of the following main features: !"Standard engine test bed with proper
instrumentation for measurement of engine power, speed, flow rate of fuel, water and air, as well as relevant temperatures.
!"A pressure transducer connected to the combustion chamber.
!"A position sensor for tracking the TDC location as a time series, from which the cylinder volume is calculated using piston-cylinder dimensions.
!"Signal conditioning hardware. !"A high-speed data acquisition device for recording
cyclic variation of pressure. !"An apparatus for emission analysis of exhaust gas. The Standard Engine Test Bed was equipped with necessary instrumentation for measurement of engine performance. A typical automotive spark ignition engine (1171 cc, NISSAN, 4-cylinder, 4-stroke, water cooled) was mounted on the tested bed. A water brake dynamometer was coupled with the engine using a universal joint. Dynamometer was equipped with load changing facilities using water flow control and adjusting the impeller angles. A calibrated load cell with digital display was used to measure the torque. A magnetic pick-up transducer with digital display was used for engine speed measurement. Air flow rate was calculated from a depression measured across an orifice in the suction line. Cooling water flow rate was measured using a calibrated flow meter. A graduated measuring flask was used to measure the fuel consumed volumetrically in a time period measured using a stopwatch. Resistance temperature detectors (RTD) were provided to measure the temperatures of - cooling water at engine inlet and outlet, intake air and exhaust gases, lubricating oil and engine body (spark plug seat). Fig. 1 shows a Photograph of the Experimental Setup which includes the Engine Test Bench with control and display panel, Oscilloscope, Signal Conditioning Devices, Computer and Emission Analyzer. Pressure Transducer: An engine cylinder pressure measuring transducer was used for surveying alternative cylinder pressure in succession. The pressure signal was used to generate P-V diagram and the P-t diagram of the cycles. Fig. 2 shows photograph of the pressure transducer.
Fig. 4 CRYPTON 290 four-channel gas analyzer.
Fig. 5 Schematic arrangement of the signal conditioning hardware.
Fig. 1 Photograph of the experimental setup
Fig. 2 Photograph of the pressure transducer
Fig. 3 ADC-11 data acquisition hardware

ICME 2001, Dhaka, December 26-28
Section III: Thermal Engineering 237
The Data Acquisition Hardware (ADC-11) is a parallel port mounted eleven channel data-acquisition hardware (Fig. 3). This device was used for the high speed data-acquisition of the pressure and TDC position sensor. Input voltage range is 0-2.5 volts DC with a maximum resolution of 10 bits and a maximum sampling rate of 15,000 samples per second. Because the input signals from the transducers are analogue ones these need to be digitized before the computer (which only understands digital signals of 1 and 0) can handle them. This requires an analogue to digital signal converter. ADC-11 has a built-in highly compact 10 bit analog to digital converter and noise filtering electronics and it can be connected to the parallel port through common 25 pin D-connector. An Emission Analyzer (CRYPTON 290) was used to measure the proportion of different gas components of the exhaust emissions. Measurements from the emission analyzer showed percentage of Oxygen (O2), Carbon-dioxide (CO2) and Carbon-monoxide (CO); Total Hydrocarbon (HC) in ppm, equivalence ratio of the intake air-fuel mixture and rpm of the engine. The analyzer passes infra-red (IR) light through exhaust samples collected by the built-in pump, for CO2, CO and HC measurements, while a chemical O2 sensor cell is used to determine the proportion of O2. The system is automatically calibrated with respect to atmospheric air and hence does not need any calibration gas frequently. The air-fuel ratio is calculated using a stoichiometric value for the fuel used (14.7 for unleaded petrol/octane and 17.3 for NG). For the measurement of the engine speed an inductive probe was used which sensed the sparking rate reaching the spark plug. All the displayed readings were printed directly to a printer. It should be noted that CRYPTON 290 requires an initial warm-up period of about five minutes. Fig. 4 shows the photograph of the emission analyzer used. Signal Conditioning Hardware: The signal from pressure transducer was in the order of mili-volts and it needed conditioning before it could be recorded by the data-acquisition hardware. Fig. 5 shows the schematic arrangement of the signal conditioning hardware working between the transducers and the data-acquisition hardware mounted on the parallel port of the computer. The signal amplification circuit mainly used operational amplifiers and filter circuits. This unit was equipped with variable gain facility and needed to be supplied with a +15v and –15v regulated DC supply. For protection of the data-acquisition hardware and the computer from any undesirable voltage from the test bench or engine side a voltage limiting circuit using zener-diode was used for both of the intake signals.
EXPERIMENTAL METHODOLOGY (i) Performance study of the engine at a particular
load and speed for the engine parameters mentioned above keeping the cooling water outlet temperature
at 45 °C by coolant flow adjustment through a regulating valve. Performance tests were carried out on standard engine test bench which is equipped with RTD sensors for temperature measurement. A CRYPTON 290 four-channel exhaust gas analyzer (CO2, CO, HC, O2) is used for emission analysis.
(ii) Repeating the test for the same engine load and
speed, for coolant water outlet temperatures of 60, 75 and 85°C respectively, while the inlet water temperature remains the same.
(iii) Repeating this set of tests (with a series of
outlet water temperatures), for different engine load and speed conditions covering the entire working range of the engine. For this, the speed vs. power curve given by the engine manufacturer will be followed.
(iv) Specifically compare the P-t and P-V diagrams
with different coolant temperatures at different engine load and speed conditions. A pressure transducer connected to the combustion chamber, signal-conditioning hardware and a high-speed data acquisition device is used for recording cyclic variation of pressure. A position sensor tracks the TDC location as a time series, from which the cylinder volume is calculated using piston-cylinder dimensions.
EXPERIMENTAL RESULTS
The Engine Performance: The engine was tested at a number of speed and load conditions covering its entire working range. The 1.2 liter, 4-stroke, 4-cylinder, water cooled automotive SI engine had a rating of maximum 30 hp at a speed of 3200 rpm. Fig. 6 shows the variation of standard engine power and torque as measured with increased engine speeds. Tests were carried out at speeds of 1600, 2000, 2400, 2800 and 3200 rpm. BS5514 was used as the derating standard and the results closely resemble the performance curve supplied by the engine manufacturer.
0
5
10
15
20
25
30
1000 1500 2000 2500 3000 3500
Engine Speed (rpm)
Bra
ke P
ower
(hp)
20
30
40
50
60
70
80
Torq
ue (N
-m)
Power (hp)
Torque (N-m)
Fig. 6 Test engine performance at various speeds.

ICME 2001, Dhaka, December 26-28
Section III: Thermal Engineering 238
Variation of Specific Fuel Consumption: The variation in bsfc with engine load for various coolant temperatures are shown in Fig. 7. For all coolant temperatures the brake specific fuel consumption rate improves as the engine runs from part load to full load. As the cooling water outlet temperature is increased from 45°C to 85°C small improvement of bsfc (about 1-2%) was noticed. Small reduction in heat losses to the cooling water mainly is responsible for this change. The small reduction in the fuel consumption rate slightly effects the air-fuel ratio as shown in Fig. 8.
220
225
230
235
240
245
250
255
260
10 15 20 25
Power (hp)
Bsf
c (g
/hp-
h)
At 45 CAt 60 CAt 75 CAt 85 C
Fig. 7 Variation of bsfc at different loads with coolant
temperature
13.413.613.8
1414.214.414.614.8
15
0 5 10 15 20 25 30
Power (hp)
A/F
Rat
io
At 45 CAt 60 CAt 75 CAt 85 C
Fig. 8 : Variation of bsfc at different loads with coolant
temperature. Variations in P-V Diagrams: At the first phase of the data acquisition the motoring cycle of the engine was recorded at about 300 rpm. Although this had no significance in the present study, it was an interesting and useful experience for verifying the results recorded. Fig. 9 shows a typical motoring cycle of the test engine. At each of the tested power levels the P-V diagram showed cyclic variation in the peak pressure level attained almost randomly, but the variation was within ± 10% of the peak value. This is a common features in high speed engines but due to the facts that - the peak pressure is only available in small fraction of the cycle, effects of multiple cylinders and the flywheel; this does not change the average output significantly. Fig. 10 shows cyclic variation of peak pressure values at different speed and load conditions. Pressure fluctuations were observed in the low pressure-levels also (suction and exhaust strokes). Such details as shown in Fig. 11 are only visible when plotted at low pressure scales. These are due to the opening and
closing effect of the intake and the exhaust valves. With the change of coolant temperature no significant change in the P-V diagram was observed. This was true for all load conditions, indicating not much change in the cyclic pressure or work done. Fig. 12 shows the P-t diagram with TDC trigger at 2000 rpm and 28 hp. The cycle time is determined by any three adjacent (consecutive) trigger marks in the diagram. For example, the cycle 2 is represented by the three adjacent trigger marks that represent 60 miliseconds (60 to 120 in the time axis) for the cycle duration. Fig. 13 shows the variation of pressure-volume diagrams for different coolant temperatures with engine running at 2000 rpm producing about 19 horse power. Fig. 14 shows the gradual increment of the P-V diagram area at different speeds with a coolant temperature of 60°C. The P-V diagrams do not appear vastly different due to the torque characteristics of the engine, but the power output varies widely due to the difference of cycle repeating frequency.
02468
1012
0 100 200 300 400
Displacement volume (cc)
Pres
sure
(bar
)
Fig. 9 Typical motoring cycle of an automotive engine
at 315 rpm
05
101520253035
0 50000 100000 150000 200000
Time (microseconds)
Pres
sure
(bar
)
Fig. 10 : Cyclic variations of P-V diagrams, 2800 rpm
and 27 hp
01234567
0 25000 50000 75000 100000
Time (microseconds)
Pres
sure
(bar
)
Fig. 11 Pressure variation during suction and exhaust
strokes, 3200 rpm.

ICME 2001, Dhaka, December 26-28
Section III: Thermal Engineering 239
TDC trigger
Fig. 12 P-t diagram with TDC trigger at 2000 rpm and
19 hp.
-5
0
5
10
15
20
25
30
0 100 200 300 400
Volume (cc)
Pres
sure
(bar
)
At 45 CAt 60 CAt 75 CAt 85 C
Fig. 13 P-V diagrams at different coolant temperatures,
2000 rpm and 19 hp.
P-V Diagram at 1600 rpm and 26 kg load
-5
0
5
1015
20
25
30
35
0 100 200 300 400
Volume (cc)
Pres
sure
(bar
)
P-V Diagram at 2400 rpm and 29 kg load
-5
0
5
1015
20
25
30
35
0 100 200 300 400
Volume (cc)
Pres
sure
(bar
)
P-V Diagram at 2000 rpm and 28 kg load
-5
0
5
10
15
20
25
30
35
0 100 200 300 400
Volume (cc)
Pres
sure
(bar
)
P-V Diagram at 3200 rpm and 26 kg load
-5
0
5
10
15
20
25
30
35
0 100 200 300 400
Volume (cc)
Pres
sure
(bar
)
Fig. 14 P-V diagrams at different load conditions, 60°C.
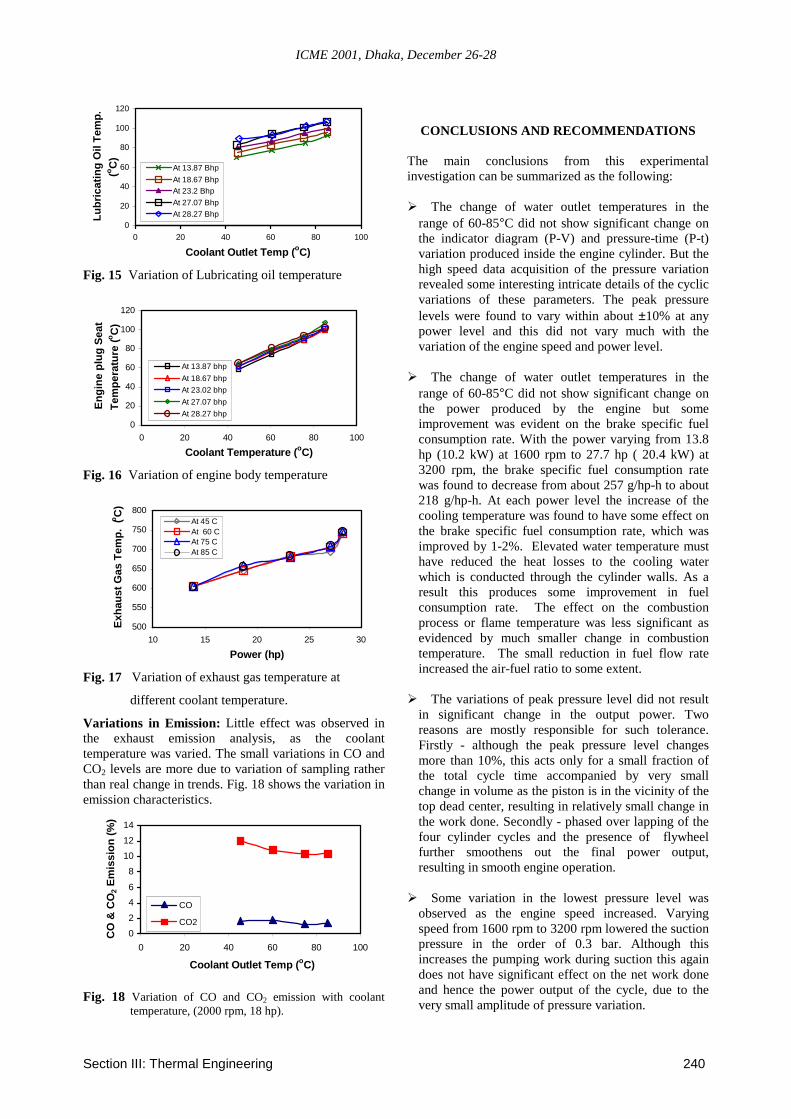
Temperature Variations: As stated before the power output level did not vary much with the variation of coolant temperature, but it had significant effect on the Lubricating oil and engine body temperature. This is
evident in Fig. 15 and Fig. 16. Effect on exhaust gas temperature was minimum as shown in Fig. 17, which indicates that variation of coolant temperature has not effected the combustion process significantly.
-10
0
10
20
30
0 20 40 60 80 100 120 140
Time (miliseconds)
Pres
sure
(bar
)
0
1
TDC
trig
ger
Cycle 1 Cycle 2
ICME 2001, Dhaka, December 26-28
Section III: Thermal Engineering 240
0
20
40
60
80
100
120
0 20 40 60 80 100
Coolant Outlet Temp (oC)
Lubr
icat
ing
Oil
Tem
p.(o C
)
At 13.87 BhpAt 18.67 BhpAt 23.2 BhpAt 27.07 BhpAt 28.27 Bhp
Fig. 15 Variation of Lubricating oil temperature
0
20
40
60
80
100
120
0 20 40 60 80 100
Coolant Temperature (oC)
Engi
ne p
lug
Seat
Tem
pera
ture
(o C)
At 13.87 bhpAt 18.67 bhpAt 23.02 bhpAt 27.07 bhpAt 28.27 bhp
Fig. 16 Variation of engine body temperature
500
550
600
650
700
750
800
10 15 20 25 30
Power (hp)
Exha
ust G
as T
emp.
(o C)
At 45 CAt 60 CAt 75 CAt 85 C
Fig. 17 Variation of exhaust gas temperature at
different coolant temperature.
Variations in Emission: Little effect was observed in the exhaust emission analysis, as the coolant temperature was varied. The small variations in CO and CO2 levels are more due to variation of sampling rather than real change in trends. Fig. 18 shows the variation in emission characteristics.
0246
8101214
0 20 40 60 80 100
Coolant Outlet Temp (oC)
CO
& C
O2 E
mis
sion
(%)
CO
CO2
Fig. 18 Variation of CO and CO2 emission with coolant temperature, (2000 rpm, 18 hp).
CONCLUSIONS AND RECOMMENDATIONS
The main conclusions from this experimental investigation can be summarized as the following: !"The change of water outlet temperatures in the
range of 60-85°C did not show significant change on the indicator diagram (P-V) and pressure-time (P-t) variation produced inside the engine cylinder. But the high speed data acquisition of the pressure variation revealed some interesting intricate details of the cyclic variations of these parameters. The peak pressure levels were found to vary within about ±10% at any power level and this did not vary much with the variation of the engine speed and power level.
!"The change of water outlet temperatures in the
range of 60-85°C did not show significant change on the power produced by the engine but some improvement was evident on the brake specific fuel consumption rate. With the power varying from 13.8 hp (10.2 kW) at 1600 rpm to 27.7 hp ( 20.4 kW) at 3200 rpm, the brake specific fuel consumption rate was found to decrease from about 257 g/hp-h to about 218 g/hp-h. At each power level the increase of the cooling temperature was found to have some effect on the brake specific fuel consumption rate, which was improved by 1-2%. Elevated water temperature must have reduced the heat losses to the cooling water which is conducted through the cylinder walls. As a result this produces some improvement in fuel consumption rate. The effect on the combustion process or flame temperature was less significant as evidenced by much smaller change in combustion temperature. The small reduction in fuel flow rate increased the air-fuel ratio to some extent.
!"The variations of peak pressure level did not result
in significant change in the output power. Two reasons are mostly responsible for such tolerance. Firstly - although the peak pressure level changes more than 10%, this acts only for a small fraction of the total cycle time accompanied by very small change in volume as the piston is in the vicinity of the top dead center, resulting in relatively small change in the work done. Secondly - phased over lapping of the four cylinder cycles and the presence of flywheel further smoothens out the final power output, resulting in smooth engine operation.
!"Some variation in the lowest pressure level was
observed as the engine speed increased. Varying speed from 1600 rpm to 3200 rpm lowered the suction pressure in the order of 0.3 bar. Although this increases the pumping work during suction this again does not have significant effect on the net work done and hence the power output of the cycle, due to the very small amplitude of pressure variation.

ICME 2001, Dhaka, December 26-28
Section III: Thermal Engineering 241
!"The coolant water outlet temperature was varied through 45-85°C by adjusting the water flow. So heat losses to the cooling water was rather controlled qualitatively (lower mass flow and higher temperature difference), rather than quantity. On the other hand the elevated water temperature in the water-jacket could have quantitatively influence the combustion process and heat losses to some extent. Increasing the coolant outlet temperature was limited to 85°C because above this temperature the lubricating oil and engine body temperatures were not stabilizing, making the engine too over heated. Local boiling around the cylinder jacket most probably starts creating vapor locks which restrict further heat transfer to water.
!"The variation in coolant temperature was found to
have significant effect on the lubricating oil temperature and the temperature of the engine body. The effect on the exhaust gas temperatures was relatively much less significant. The exhaust gas temperature varied from 604°C to 745°C within the power range tested. For each power level the variation was less than 10°C with the change of the coolant outlet temperature. So it can be argued that the elevation of the water temperature outside the cylinder has not significantly changed the combustion process.
!"The lubricating oil temperatures varied in a band of
70-93°C at 1600 rpm to 89-107°C at 3200 rpm. The average lubricating oil temperature was found to rise about 20°C for a water temperature rise of 40°C. This is within the working range of the multi-grade viscosity oil used (BP, SAE20W50). So significant change of viscosity and hence frictional losses were not evident. The situation might have more detrimental effect if lubricating oil of single grade were used.
!"Rising water temperature has significant effect on
the temperature of the engine body parts. Variation of a spark plug seat temperature was recorded. At 45°C water outlet temperature the engine body temperature varied from 59-65°C in the power range. This was elevated to about 102-108°C for a water temperature of 85°C. Definitely for the inner parts of the engine the rise in temperature is much more. This may have detrimental effect on the operating life of different metallic and non-metallic engine parts. Probably the effect on engine parts which withstand the highest temperatures (e.g., combustion chamber, exhaust valves etc.) will be less significant as the exhaust temperatures do not change significantly.
!"The exhaust emission characteristics support the
argument of little change in combustion characteristics. There were some variations in CO formation accompanied by small changes in CO2 produced during combustion, as the water temperature
was elevated. The remaining O2 and unburned HC were found to vary correspondingly within a small band. These small variations are more to do with the sampling of gases rather than showing real trend of change. Generally speaking the emission characteristics did not change significantly with the temperature of the coolant water.
!"The inclusion of the effect of spark timing into the
present study could be an important investigation. A signal recorded to identify the exact timing of the spark may reveal more interesting details regarding the cyclic pressure variation.
!"Taking temperatures at more engine locations,
specially inside the cylinder head with sufficiently high frequency response could identify the nature of variation of the combustion temperature as the coolant temperature changes.
REFERENCES Draper C., and Li Y. “Principles of Optimizing Control
Systems and an Application to the Internal Combustion Engine”, ASME publications, 1951.
Jacobson and Marcus, ”Comparative Methods of
Measuring Peak Pressures in Internal Combustion Engines”, Environ Eng. v 12 n 1 1999 Prof. Eng. Publ. Ltd. , p 26-28.
Klimstra, J. ”The Optimum Combustion Phasing Angle
– a Convenient Engine Tuning Criterion”, SAE Paper No. 852090.
Leisenring, K., Samimy B., and Rizzoni, G. “IC Engine
Air/Fuel Ratio Feedback Control during Cold Start”, SAE Paper No. 961022.
Powell, J. D. “Closed Loop Control of Spark Advance
using Cylinder”, Proceedings of the Int. Assn. Of Vehicle Design, Special Publication SP4, pp. 113-125, 1983.
Tunestal P., Wilcutts M., Lee A. T. and Hedrick J. K.
“Calculation of Heat Release Energy from Engine Cylinder Pressure Data”, SAE Spec Publ v 1315, Feb 1998, Proceedings of the SAE International Congress & Exposition, Detroit, MI, p 101-112.
Wibberley, P., and Clark, C. “An Investigation of
Cylinder Pressure as Feedback for Control of Internal Combustion Engines”, SAE Paper No. 890396.