Effect of Climatic Variability on Maize Production in...
12
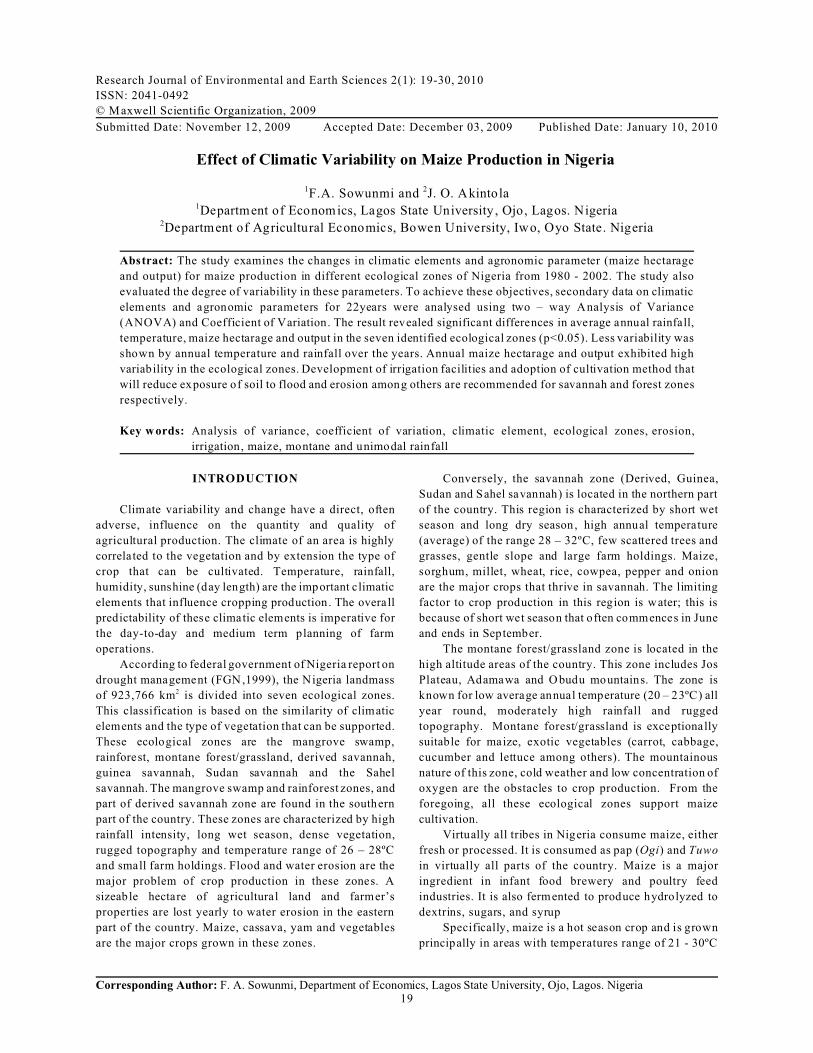
Research Journal of Environmental and Earth Sciences 2(1): 19-30, 2010 ISSN: 2041-0492 © Maxwell Scientific Organization, 2009 Submitted Date: November 12, 2009 Accepted Date: December 03, 2009 Published Date: January 10, 2010 Corresponding Author: F. A. Sowunmi, Department of Economics, Lagos State University, Ojo, Lagos. Nigeria 19 Effect of Climatic Variability on Maize Production in Nigeria 1 F.A. Sowunmi and 2 J. O. Akintola 1 Department of Economics, Lagos State University, Ojo, Lagos. Nigeria 2 Department of Agricultural Economics, Bowen University, Iwo, Oyo State. Nigeria Abstract: The study examines the changes in climatic elements and agronomic parameter (maize hectarage and output) for maize production in different ecological zones of Nigeria from 1980 - 2002. The study also evaluated the degree of variability in these parameters. To achieve these objectives, secondary data on climatic elements and agronomic parameters for 22years were analysed using two – way Analysis of Variance (ANOVA) and Coefficient of Variation. The result revealed significant differences in average annual rainfall, temperature, maize hectarage and output in the seven identified ecological zones (p<0.05). Less variability was shown by annual temperature and rainfall over the years. Annual maize hectarage and output exhibited high variability in the ecological zones. Development of irrigation facilities and adoption of cultivation method that will reduce exposure of soil to flood and erosion among others are recommended for savannah and forest zones respectively. Key words: Analysis of variance, coefficient of variation, climatic element, ecological zones, erosion, irrigation, maize, montane and unimodal rainfall INTRODUCTION Climate variability and change have a direct, often adverse, influence on the quantity and quality of agricultural production. The climate of an area is highly correlated to the vegetation and by extension the type of crop that can be cultivated. Temperature, rainfall, humidity, sunshine (day length) are the important climatic elements that influence cropping production. The overall predictability of these climatic elements is imperative for the day-to-day and medium term planning of farm operations. According to federal government of Nigeria report on drought management (FGN,1999), the Nigeria landmass of 923,766 km 2 is divided into seven ecological zones. This classification is based on the similarity of climatic elements and the type of vegetation that can be supported. These ecological zones are the mangrove swamp, rainforest, montane forest/grassland, derived savannah, guinea savannah, Sudan savannah and the Sahel savannah. The mangrove swamp and rainforest zones, and part of derived savannah zone are found in the southern part of the country. These zones are characterized by high rainfall intensity, long wet season, dense vegetation, rugged topography and temperature range of 26 – 28ºC and small farm holdings. Flood and water erosion are the major problem of crop production in these zones. A sizeable hectare of agricultural land and farmer’s properties are lost yearly to water erosion in the eastern part of the country. Maize, cassava, yam and vegetables are the major crops grown in these zones. Conversely, the savannah zone (Derived, Guinea, Sudan and Sahel savannah) is located in the northern part of the country. This region is characterized by short wet season and long dry season, high annual temperature (average) of the range 28 – 32ºC, few scattered trees and grasses, gentle slope and large farm holdings. Maize, sorghum, millet, wheat, rice, cowpea, pepper and onion are the major crops that thrive in savannah. The limiting factor to crop production in this region is water; this is because of short wet season that often commences in June and ends in September. The montane forest/grassland zone is located in the high altitude areas of the country. This zone includes Jos Plateau, Adamawa and Obudu mountains. The zone is known for low average annual temperature (20 – 23ºC) all year round, moderately high rainfall and rugged topography. Montane forest/grassland is exceptionally suitable for maize, exotic vegetables (carrot, cabbage, cucumber and lettuce among others). The mountainous nature of this zone, cold weather and low concentration of oxygen are the obstacles to crop production. From the foregoing, all these ecological zones support maize cultivation. Virtually all tribes in Nigeria consume maize, either fresh or processed. It is consumed as pap (Ogi ) and Tuwo in virtually all parts of the country. Maize is a major ingredient in infant food brewery and poultry feed industries. It is also fermented to produce hydrolyzed to dextrins, sugars, and syrup Specifically, maize is a hot season crop and is grown principally in areas with temperatures range of 21 - 30ºC
Transcript of Effect of Climatic Variability on Maize Production in...
Research Journal of Environmental and Earth Sciences 2(1): 19-30, 2010
ISSN: 2041-0492
© Maxwell Scientific Organization, 2009
Submitted Date: November 12, 2009 Accepted Date: December 03, 2009 Published Date: January 10, 2010
Corresponding Author: F. A. Sowunmi, Department of Economics, Lagos State University, Ojo, Lagos. Nigeria19
Effect of Climatic Variability on Maize Production in Nigeria
1F.A. Sowunmi and 2J. O. Akintola1Department of Economics, Lagos State University , Ojo, Lagos. Nigeria
2Department of Agricultural Economics, Bowen University, Iwo, Oyo State. Nigeria
Abstract: The study examines the changes in climatic elements and agronomic parameter (maize hectarage
and output) for maize production in different ecological zones of Nigeria from 1980 - 2002. The study also
evaluated the degree of variability in these parameters. To achieve these objectives, secondary data on climatic
elements and agronomic parameters for 22years were analysed using two – way Analysis of Variance
(ANOVA) and Coefficient of Variation. The result revealed significant differences in average annual rainfall,
temperature, maize hectarage and output in the seven identified ecological zones (p<0.05). Less variability was
shown by annual temperature and rainfall over the years. Annual maize hectarage and output exhibited high
variability in the ecological zones. Development of irrigation facilities and adoption of cultivation method that
will reduce exposure of soil to flood and erosion among others are recommended for savannah and forest zones
respectively.
Key words: Analysis of variance, coefficient of variation, climatic element, ecological zones, erosion,
irrigation, maize, montane and unimodal rainfall
INTRODUCTION
Climate variability and change have a direct, often
adverse, influence on the quantity and quality of
agricultural production. The climate of an area is highly
correlated to the vegetation and by extension the type of
crop that can be cultivated. Temperature, rainfall,
humidity, sunshine (day length) are the important climatic
elements that influence cropping production. The overall
predictability of these climatic elements is imperative for
the day-to-day and medium term planning of farm
operations.
According to federal government of Nigeria report on
drought management (FGN ,1999), the Nigeria landmass
of 923,766 km2 is divided into seven ecological zones.
This classification is based on the similarity of climatic
elements and the type of vegetation that can be supported.
These ecological zones are the mangrove swamp,
rainforest, montane forest/grassland, derived savannah,
guinea savannah, Sudan savannah and the Sahel
savannah. The mangrove swamp and rainforest zones, and
part of derived savannah zone are found in the southern
part of the country. These zones are characterized by high
rainfall intensity, long wet season, dense vegetation,
rugged topography and temperature range of 26 – 28ºC
and small farm holdings. Flood and water erosion are the
major problem of crop production in these zones. A
sizeable hectare of agricultural land and farmer’s
properties are lost yearly to water erosion in the eastern
part of the country. Maize, cassava, yam and vegetables
are the major crops grown in these zones.
Conversely, the savannah zone (Derived, Guinea,
Sudan and Sahel savannah) is located in the northern part
of the country. This region is characterized by short wet
season and long dry season, high annual temperature
(average) of the range 28 – 32ºC, few scattered trees and
grasses, gentle slope and large farm holdings. Maize,
sorghum, millet, wheat, rice, cowpea, pepper and onion
are the major crops that thrive in savannah. The limiting
factor to crop production in this region is water; this is
because of short wet season that often commences in June
and ends in September.
The montane forest/grassland zone is located in the
high altitude areas of the country. This zone includes Jos
Plateau, Adamawa and O budu mountains. The zone is
known for low average annual temperature (20 – 23ºC) all
year round, moderately high rainfall and rugged
topography. Montane forest/grassland is exceptionally
suitable for maize, exotic vegetables (carrot, cabbage,
cucumber and lettuce among others). The mountainous
nature of this zone, cold weather and low concentration of
oxygen are the obstacles to crop production. From the
foregoing, all these ecological zones support maize
cultivation.
Virtually all tribes in Nigeria consume maize, either
fresh or processed. It is consumed as pap (Ogi) and Tuwo
in virtually all parts of the country. Maize is a major
ingredient in infant food brewery and poultry feed
industries. It is also fermented to produce hydrolyzed to
dextrins, sugars, and syrup
Specifically, maize is a hot season crop and is grown
principally in areas with temperatures range of 21 - 30ºC

Res. J. Environ. Earth Sci., 2(1): 19-30, 2010
20
Fig. 1: Source: Climate – Nigeria (2005)
(70 - 86 F), though seeds germinate best at a lower
temperature range of 18 - 21ºC (64 - 58 F). Adequate
rainfall or water is very important during germination and
the first month of growth
It is argued that this study is of relevance because it
indicates the differences in climatic elements (average
annual temperature and rainfall) and agronomic factors
required for maize production (maize hectarage and
output) in different ecological zones of Nigeria. Also the
need to establish the degree of variability in the climatic
elements and agronomic data in the different ecological
zones makes the study imperative.
Nigeria Ecological Zones: The total land area of Nigeria
(923,766km2) is divided into seven broad ecological or
land resource zones. The categorization is based on the
similarity of climate and vegetation cover as well as the
type of crops that are adapted to each land area. With the
exception of the montane region, the length of wet season
(days) and temperature increase from the coast to the
hitherland. In this categorization no state of the federation
can boast of one ecological zone. A state may have up to
three ecological zones. All these zones support maize
production. The seven ecological zones are explained
below:
Mangrove Swamp Forest: This zone is characterized by
a bimodal rainfall distribution. The zone has an average
annual temperature and rainfall of 26ºC and 2503mm
respectively. There is hardly a month w ithout rainfall. The
mangrove swamp vegetation is a hydromorphic forest
type characterized by an entangled dense growth of stems
and aerial roots. The most common specie of this
vegetation is the raffia palm. The better drain areas
support maize oil palm trees and big trees like Iroko
(Chlorophora Exceisa). Limiting factors to agricultural
production include waterlogged soil, rugged topography
and leaching as a result of excessive rainfall. A substantial
land area of states such as Lagos, Delta, Rivers, Cross
River, Akwa Ibom and Calabar are within this zone. The
Fig. 1 shows the vegetation map of Nigeria.
Tropical Rainforest: This zone like the mangrove
swamp zone has a bimodal rainfall distribution but with
less intensity. There is a distinct dry and rainy seasons.
The zone has an average annual rainfall and temperature
of 1489mm and 26.5ºC respectively. Tropical rainforest
zone accounts for a great number of plant species. The
lower layer vegetation is most dense with abundance of
herbs, shrubs and some grasses . The top layer accounts
for valuable economic trees such as Mahogany, Iroko,
Obeche among others. The zone has a high density of
human population with agriculture as primary occupation
of the people. The zone is known for the cultivation of
maize, cassava, vegetables, yam, oil palm etc. Problem of
agriculture in the zone are rugged topography and bush
burning which predisposes soil to erosion.
The Montane Forest/Grassland: The montane zone is
located in the high altitude areas of the country like Jos
Plateau, Mandara, Adamawa M ountain and Obudu
Plateau. The zone is characterized by low average annual
temperature (21.5ºC). The average annual rainfall is
1450mm. The montane zone vegetation is covered with
grass at the top and base, while forests cover the slopes,
favoured by moisture-laden wind. The zone has a great
potential for the cultivation of maize, wheat, carrot,
cabbage and other exotic vegetables but the mountainous
nature of the zone prevents commercial farming.
Res. J. Environ. Earth Sci., 2(1): 19-30, 2010
21
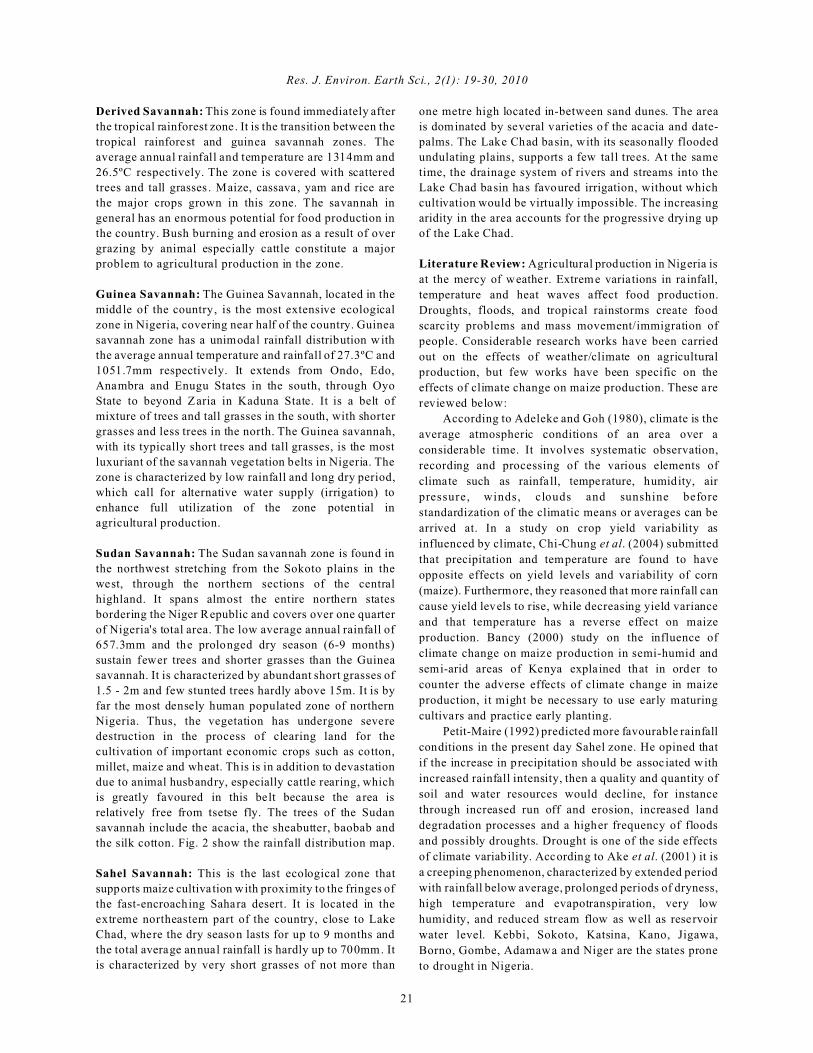
Derived Savannah: This zone is found immediately after
the tropical rainforest zone. It is the transition between the
tropical rainforest and guinea savannah zones. The
average annual rainfall and temperature are 1314mm and
26.5ºC respectively. The zone is covered with scattered
trees and tall grasses . Maize, cassava, yam and rice are
the major crops grown in this zone. The savannah in
general has an enormous potential for food production in
the country. Bush burning and erosion as a result of over
grazing by animal especially cattle constitute a major
problem to agricultural production in the zone.
Guinea Savannah: The Guinea Savannah, located in the
middle of the country, is the most extensive ecological
zone in Nigeria, covering near half of the country. Guinea
savannah zone has a unimodal rainfall distribution w ith
the average annual temperature and rainfall of 27.3ºC and
1051.7mm respectively. It extends from Ondo, Edo,
Anambra and Enugu States in the south, through Oyo
State to beyond Zaria in Kaduna State. It is a belt of
mixture of trees and tall grasses in the south, with shorter
grasses and less trees in the north. The Guinea savannah,
with its typically short trees and tall grasses, is the most
luxuriant of the savannah vegetation belts in Nigeria. The
zone is characterized by low rainfall and long dry period,
which call for alternative water supply (irrigation) to
enhance full utilization of the zone potential in
agricultural production.
Sudan Savannah: The Sudan savannah zone is found in
the northwest stretching from the Sokoto plains in the
west, through the northern sections of the central
highland. It spans almost the entire northern states
bordering the Niger Republic and covers over one quarter
of Nigeria's total area. The low average annual rainfall of
657.3mm and the prolonged dry season (6-9 months)
sustain fewer trees and shorter grasses than the Guinea
savannah. It is characterized by abundant short grasses of
1.5 - 2m and few stunted trees hardly above 15m. It is by
far the most densely human populated zone of northern
Nigeria. Thus, the vegetation has undergone severe
destruction in the process of clearing land for the
cultivation of important economic crops such as cotton,
millet, maize and wheat. This is in addition to devastation
due to animal husbandry, especially cattle rearing, which
is greatly favoured in this belt because the area is
relatively free from tsetse fly. The trees of the Sudan
savannah include the acacia, the sheabutter, baobab and
the silk cotton. Fig. 2 show the rainfall distribution map.
Sahel Savannah: This is the last ecological zone that
supports maize cultivation with proximity to the fringes of
the fast-encroaching Sahara desert. It is located in the
extreme northeastern part of the country, close to Lake
Chad, where the dry season lasts for up to 9 months and
the total average annual rainfall is hardly up to 700mm. It
is characterized by very short grasses of not more than
one metre high located in-between sand dunes. The area
is dominated by several varieties of the acacia and date-
palms. The Lake Chad basin, with its seasonally flooded
undulating plains, supports a few tall trees. At the same
time, the drainage system of rivers and streams into the
Lake Chad basin has favoured irrigation, without which
cultivation would be virtually impossible. The increasing
aridity in the area accounts for the progressive drying up
of the Lake Chad.
Literature Review: Agricultural production in Nigeria is
at the mercy of weather. Extreme variations in ra infall,
temperature and heat waves affect food production.
Droughts, floods, and tropical rainstorms create food
scarcity problems and mass movement/immigration of
people. Considerable research works have been carried
out on the effects of weather/climate on agricultural
production, but few works have been specific on the
effects of climate change on maize production. These are
reviewed below:
According to Adeleke and Goh (1980), climate is the
average atmospheric conditions of an area over a
considerable time. It involves systematic observation,
recording and processing of the various elements of
climate such as rainfall, temperature, humidity, air
pressure, winds, clouds and sunshine before
standardization of the climatic means or averages can be
arrived at. In a study on crop yield variability as
influenced by climate, Chi-Chung et al. (2004) submitted
that precipitation and temperature are found to have
opposite effects on yield levels and variability of corn
(maize). Furthermore, they reasoned that more rainfall can
cause yield levels to rise, while decreasing yield variance
and that temperature has a reverse effect on maize
production. Bancy (2000) study on the influence of
climate change on maize production in semi-humid and
semi-arid areas of Kenya explained that in order to
counter the adverse effects of climate change in maize
production, it might be necessary to use early maturing
cultivars and practice early planting.
Petit-Maire (1992) predicted more favourable rainfall
conditions in the present day Sahel zone. He opined that
if the increase in precipitation should be associated with
increased rainfall intensity, then a quality and quantity of
soil and water resources would decline, for instance
through increased run off and erosion, increased land
degradation processes and a higher frequency of floods
and possibly droughts. Drought is one of the side effects
of climate variability. According to Ake et al. (2001) it is
a creeping phenomenon, characterized by extended period
with rainfall below average, prolonged periods of dryness,
high temperature and evapotranspiration, very low
humidity, and reduced stream flow as well as reservoir
water level. Kebbi, Sokoto, Katsina, Kano, Jigawa,
Borno, Gombe, Adamawa and Niger are the states prone
to drought in Nigeria.

Res. J. Environ. Earth Sci., 2(1): 19-30, 2010
22
Fig. 2: Source: Climate – Nigeria (2005)
Madiyazhagan et al. (2004) carried out a study on water
and high temperature stress effects on maize production
in Australia, they observed that high temperature (greater
than 38º C) compounded by water stress occurring at the
same time decrease kernel set under dry land
environments.
Akintola (2001) in a study on the comparative
analysis of the distribution of rainy days in different
ecological zones observed that the rainy days in the
Southern zone show s relatively less variabilities that those
in the central (middle belt) and the Northern zones.
Likewise, the distribution in the middle belt shows less
variability than those of the Northern zone. He, however,
suggested land irrigation as a solution to water
inadequacies in the north while flood control measures
were advocated for the Southern zone.
WM O/UNEP (1996) report, found out that overall
global warming is expected to add in one way or other to
the difficulties of food production and scarcity. The report
also stated that reduced availability of water resources
would pose one of the greatest problems to agriculture
and food production, especially in the developing
countries. Katz and Brown (1992) believed that climate
variability is likely to increase under global warming both
in absolute and relative terms. Increased intensities of
rainfall and increased rainfall totals in mangrove swamp
and rain forest zones would increase leaching ra tes in well
drained soils with high infiltration rates and would cause
temporary flooding and water saturation hence reduced
organic matter decomposition in many soils in level or
depressional sites. WM O (1996) report revealed that
global rising temperature now estimated to be 0.2º C per
decade or 1ºC by 2040 (Mitchell et al., 1995) with
smallest increase in the tropics (IPCC, 1992) would
diminish the yield of some crops, especially if night
temperatures are increased. The result posited that higher
night temperature might increase dark respiration of
plants, diminishing net biomass production.
FAO (1995) report stated that climate change may
result in shift in the present (agro) ecological zone for
over hundreds of kilometers horizontally, and hundreds of
metres altitudinally with the hazard that some plants,
especially tress and animal species cannot adjust
themselves in time.
Factors other than climate are known to influence
crop yield variability. Anderson et al. (1987) argued that
adoption of common high-yielding vanities, uniform
planting practices, and common timing of field operations
have caused yields of many crops to become more
strongly influenced by weather patterns, especially in
developing countries. In order to maintain equilibrium
between supply of agricultural output and the demand for
food by growing population, farmers through the
assistance of government will have to adjust and adapt
when necessary to the possible changes imposed by
changing climate. The ability to adapt to the effects of
climate change will vary greatly between countries and
regions.
MATERIALS AND METHODS
The study was carried out in Abeokuta, Ogun State,
Nigeria. The research commenced in 2005 and ended in
2007. Secondary data (meteorological and agronomic
data) collected from IITA station at `Ibadan, CBN and
FAO publications were utilized for the study. The
meteorological and agronomic data included average
annual temperature and rainfall as well as the average
Res. J. Environ. Earth Sci., 2(1): 19-30, 2010
23
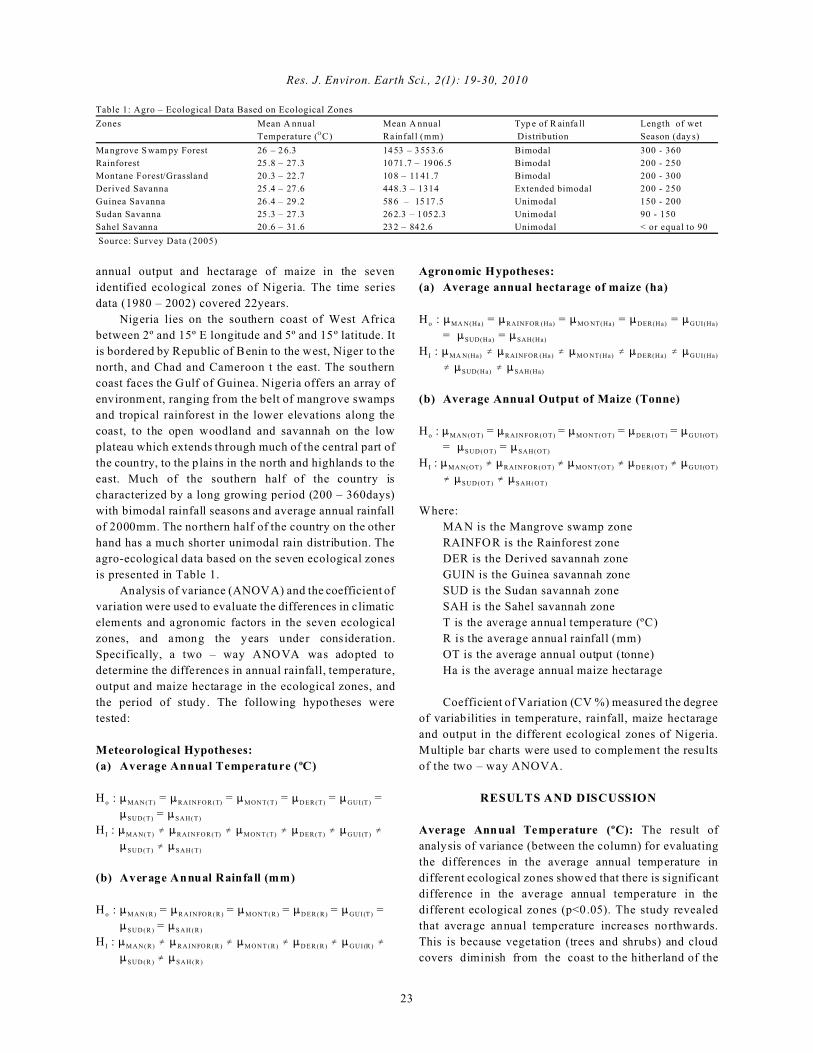
Table 1: Agro – Ecological Data Based on Ecological Zones
Zones Mean A nnual Mean A nnual Typ e of R ainfa ll Length of wet
Temperature (OC) Rainfal l (mm) Distribution Season (day s)
Ma ngrove S wam py Forest 26 – 26.3 1453 – 3553.6 Bimodal 300 - 360
Rainforest 25 .8 – 27 .3 1071 .7 – 1906 .5 Bimodal 200 - 250
Montane Forest/Grassland 20 .3 – 22 .7 108 – 1141 .7 Bimodal 200 - 300
Derived Savanna 25 .4 – 27 .6 448.3 – 1314 Extended bimodal 200 - 250
Guinea Savanna 26 .4 – 29 .2 586 – 1517 .5 Unimodal 150 - 200
Sudan Savanna 25 .3 – 27 .3 262.3 – 1052.3 Unimodal 90 - 150
Sahel Savanna 20 .6 – 31 .6 232 – 842.6 Unimodal < or equal to 90
Source: Survey Data (2005)
annual output and hectarage of maize in the seven
identified ecological zones of Nigeria. The time series
data (1980 – 2002) covered 22years.
Nigeria lies on the southern coast of West Africa
between 2º and 15º E longitude and 5º and 15º latitude. It
is bordered by Republic of Benin to the west, Niger to the
north, and Chad and Cameroon t the east. The southern
coast faces the Gulf of Guinea. Nigeria offers an array of
environment, ranging from the belt of mangrove swamps
and tropical rainforest in the lower elevations along the
coast, to the open woodland and savannah on the low
plateau which extends through much of the central part of
the country, to the plains in the north and highlands to the
east. Much of the southern half of the country is
characterized by a long growing period (200 – 360days)
with bimodal rainfall seasons and average annual rainfall
of 2000mm. The northern half of the country on the other
hand has a much shorter unimodal rain distribution. The
agro-ecological data based on the seven ecological zones
is presented in Table 1.
Analysis of variance (ANOVA) and the coefficient of
variation were used to evaluate the differences in c limatic
elements and agronomic factors in the seven ecological
zones, and among the years under consideration.
Specifically, a two – way ANOVA was adopted to
determine the differences in annual rainfall, temperature,
output and maize hectarage in the ecological zones, and
the period of study. The following hypotheses were
tested:
Meteorological Hypotheses:
(a) Average Annual Temperature (ºC)
Ho : :MAN(T) = :RAINFOR(T) = :MONT(T) = :DER(T) = :GUI(T) =
:SUD(T) = :SAH(T)
H I : :MAN(T) � :RAINFOR(T) � :MONT(T) � :DER(T) � :GUI(T) �
:SUD(T) � :SAH(T)
(b) Average Annual Rainfall (mm)
Ho : :M A N ( R ) = :R A I N FO R ( R ) = :M O N T ( R ) = :D E R ( R ) = :GUI(T) =
:S U D ( R ) = :S A H ( R )
H I : :M A N ( R ) � :R A I N FO R ( R ) � :M O N T ( R ) � :D E R ( R ) � :G U I (R ) �
:S U D ( R ) � :S A H ( R )
Agronomic Hypotheses:
(a) Average annual hectarage of maize (ha)
Ho : :MA N(Ha) = :RAINFOR (Ha) = :MO NT(Ha) = :DER(Ha) = :GUI(Ha)
= :SUD(Ha) = :SAH(Ha)
H I : :MA N(Ha) � :RAINFOR (Ha) � :MO NT(Ha) � :DER(Ha) � :GUI(Ha)
� :SUD(Ha) � :SAH(Ha)
(b) Average Annual Output of Maize (Tonne)
Ho : :MAN(OT) = :RAINFOR(OT) = :MONT(OT) = :DER(OT) = :GUI(OT)
= :SUD(OT) = :SAH(OT)
H I : :MAN(OT) � :RAINFOR(OT) � :MONT(OT) � :DER(OT) � :GUI(OT)
� :SUD(OT) � :SAH(OT)
Where:
MAN is the Mangrove swamp zone
RAINFO R is the Rainforest zone
DER is the Derived savannah zone
GUIN is the Guinea savannah zone
SUD is the Sudan savannah zone
SAH is the Sahel savannah zone
T is the average annual temperature (ºC)
R is the average annual rainfall (mm)
OT is the average annual output (tonne)
Ha is the average annual maize hectarage
Coefficient of Variation (CV %) measured the degree
of variabilities in temperature, rainfall, maize hectarage
and output in the different ecological zones of Nigeria.
Multiple bar charts were used to complement the results
of the two – way ANOVA.
RESULTS AND DISCUSSION
Average Annual Temperature (ºC): The result of
analysis of variance (between the column) for evaluating
the differences in the average annual temperature in
different ecological zones show ed that there is significant
difference in the average annual temperature in the
different ecological zones (p<0.05). The study revealed
that average annual temperature increases northwards.
This is because vegetation (trees and shrubs) and cloud
covers diminish from the coast to the hitherland of the

Res. J. Environ. Earth Sci., 2(1): 19-30, 2010
24
Fig. 3: Distribution of average annual temperature in different ecological zones
country. The study showed that the Mangrove zone has an
average annual temperature range of 26.0 – 26.3ºC, the
range of 20.3 – 22.7ºC and 20.3 – 31.6ºC were recorded
for Montane and Sahel zones respectively (Table 1).
Moreover, the result of ANO VA (among the years)
showed that there is no significant difference (p>0.05) in
the average annual temperature among the years
considered. This means that change in average annual
temperature over the period of study (22years) is not
pronounced (significant). This result is corroborated by
temperature chart in Fig. 3, which shows almost identical
jointed bars for all the ecological zones from 1980 to
2002.
Average Annual Rainfall (mm): The result of analysis
(among ecological zones) showed that there is significant
difference in the average annual rainfall in the different
ecological zones (p<0.05). This finding conforms to the
situation in the seven identified ecological zones. There is
progressive decline in total rainfall and length of wet
season from south to the northern part of the country. The
range of average annual rainfall in Mangrove zone is
1453!3554mm, this reduced to 108!1142mm and
232!842.6mm in Montane forest/grassland zone and
Sahel savannah respectively. The bimodal distribution of
rainfall in Mangrove rainforest and montane zones allow
for the cultivation of maize twice in a year. How ever,
planting of maize takes place once in a year in the
savannahs (Guinea, Sudan and Sahel) because of the
unimodal rainfall distribution of these zones. The length
of wet season (days) is expectedly shorter (90-200 days)
in the savannah compared to Mangrove and Rainforest
zones (200-360 days). Heavy rainfalls accompanied with
thunderstorms are associated with Mangrove and
Rainforest zones. This often leads to flooding and
leaching of farmlands. The resultant effect of this is low
productivity compared to savannah zones.
Furthermore, the result of the analysis (among the
years) revealed that there is significant difference in the
average annual rainfall among the years. Fcal (6.76) is
greater than Ftab (1.79) at 5% level of significance. This
result confirms the happenings across the ecological
zones. In some years rain falls heavily starting early and
stopping late. While in another years, rainfall with low
intensity commences late and stops earlier. The lateness
in rainfall often necessitates special prayers to God by
farmers and concerned citizen for rain to fall most
especially in the Sudan and Sahel savannah zones. In
some cases rituals are performed by farmers to appease
the god of rain. The consequence of late commencement
and early stoppage of rain is sharp drop in maize
production. The rain distribution pattern of Nigeria based
on agroecological zones is shown in the Fig. 4.
Average Annual Hectarage and Output: The result
revealed that there are appreciable variations in the maize
hectarage and the output in the ecological zones (p<0.05).
The Fig. 5 shows that the average maize hectarage is
higher in the savannah zones; all things being equal this
translates to more output. This may be attributed to
progressive reduction in the cost of land preparation for
farming from the coast to the hitherland as well as
favourable government policies (e.g. SAP), which ban the
importation of maize, thus encouraging local production.
Moreover, there is also significant difference in the
average annual maize hectarage and output of maize

Res. J. Environ. Earth Sci., 2(1): 19-30, 2010
25
Fig. 4: Annual rainfall distribution for different ecological zones
Fig. 5: Distribution of maize hectarage in different ecological zones
among the years (1980 - 2002). The Fcals are greater thanF tabs. Fig. 6 shows an appreciable increase in maize outputover the years.
Coefficient of Variation (CV): The coefficient ofvariation result revealed that Rainforest zone has thelowest dispersion of average annual temperature(14.84%); this is followed by Guinea savanna (21.38%)and Mangrove swamp forest (21.49%) respectively(Appendix E). This means that Rainforest zoneexperienced little change in average annual temperaturecompare to other ecological zones for the time period.
Also the Mangrove swamp zone has the smallestvariation (0.81%) of average annual rainfall, the Sudansavanna and Rainforest zones have 1.13 and 1.25%respectively (Fig. 7). This explains why the Mangroveswamp has a small difference in average annual rainfallcompare to other zones over the years.
Generally, the coefficient of variation is very high
(more variability) for maize hectarage and output in all
the ecological zones. The value ranges from 57.4 –
59.48% and 73.13–73.16% for maize hectarage and
ou tpu t respec t ive ly . However , the mon tane
forest/grassland zone has the highest coefficient of
variations results for annual maize hectarage (73.16%)
while both Sudan (59.48%) and Sahel (59.48%)
savannahs recorded the highest coefficient of variation for
annual output. That is more variability is exhibited by
maize output in both Sudan and Sahel savannahs. These
results are expected bearing in mind the ban on
importation of maize as well as other government policies
and strategies aimed at encouraging more Nigerians to
embrace agriculture. The effects are the increases in
maize hectarage and output in the ecological zones over
the years.

Res. J. Environ. Earth Sci., 2(1): 19-30, 2010
26
Fig. 6: Distribution of average annual output of maize in different ecological zones
Fig 7: The Coefficient of variation results in different ecological zones
CONCLUSION AND RECOMMENDATION
Climate change, if it occurs, will definitely affect
crop production. This study revealed that with the
availability of enough water, maize can be grown in most
part of Nigeria all round the year. This is because of the
insignificant variation in average temperature in the 22
years considered for this study. However, variation in
annual temperature is significant in the different
ecological zones. Specifically, a very high temperature is
usually experienced prior to the onset of rainfall,
temperature as high as 32ºC and 39.5ºC in Rainforest and
Sahel savannah zones respectively. Frequent torrential
rainfall with high intensity in the Mangrove, Rainforest
and Montane zones encourage the growth of dense trees,
shrubs and crops. However, this heavy rainfall also
predisposes soil to leaching; while the big trees and
rugged topography make land clearing more difficult and
expensive, hence the subsistence nature of farming in
these zones.
Moreover, savannah (Derived, Guinea and Sudan)
zone is found to be suitable for maize production in terms
of good soil and temperature. The maize hectarage as well
as the output are found to be higher in the savannah than
Res. J. Environ. Earth Sci., 2(1): 19-30, 2010
27
the Mangrove swamp, Rainforest and Montane
forest/grassland zones. In general, the study showed that
there is a progressive increase in the annual maize
hectarage and output of maize in all the seven ecological
zones over the 22years considered. The introduction of
SAP in 1986, which had among its strategies the ban on
importation of maize and scrapping of marketing board as
well as other government economic policies aimed at
encouraging maize production can be attributed to the
increase in maize hectarage and output from late the late
1980’s.
The potential of savanna zones in Nigerian maize
production cannot be overemphasized. The need for the
development of irrigation facilities in these zones in order
to make water available by augmenting the unimodal
rainfall distribution of the zones is imperative. Moreover,
development of short, drought resistant and early
maturing variety of maize especially suitable for this zone
so that the short wet season can be fully utilized.
On the other hand, control of flood, development of
early maturing and disease resistant variety of maize are
important consideration for increase productivity of maize
in the southern zones (Mangrove swamp and rainforest
zones), while early maturing and low temperature
resistant maize varieties is advised for the montane
forest/grassland.
Finally, a quantitative understanding of weather,
climate and other related environmental factors and the
manner in which they affect maize production in the
country would greatly enhance the benefits achievable
through the use of new agricultural food – production
technologies.
Append ices
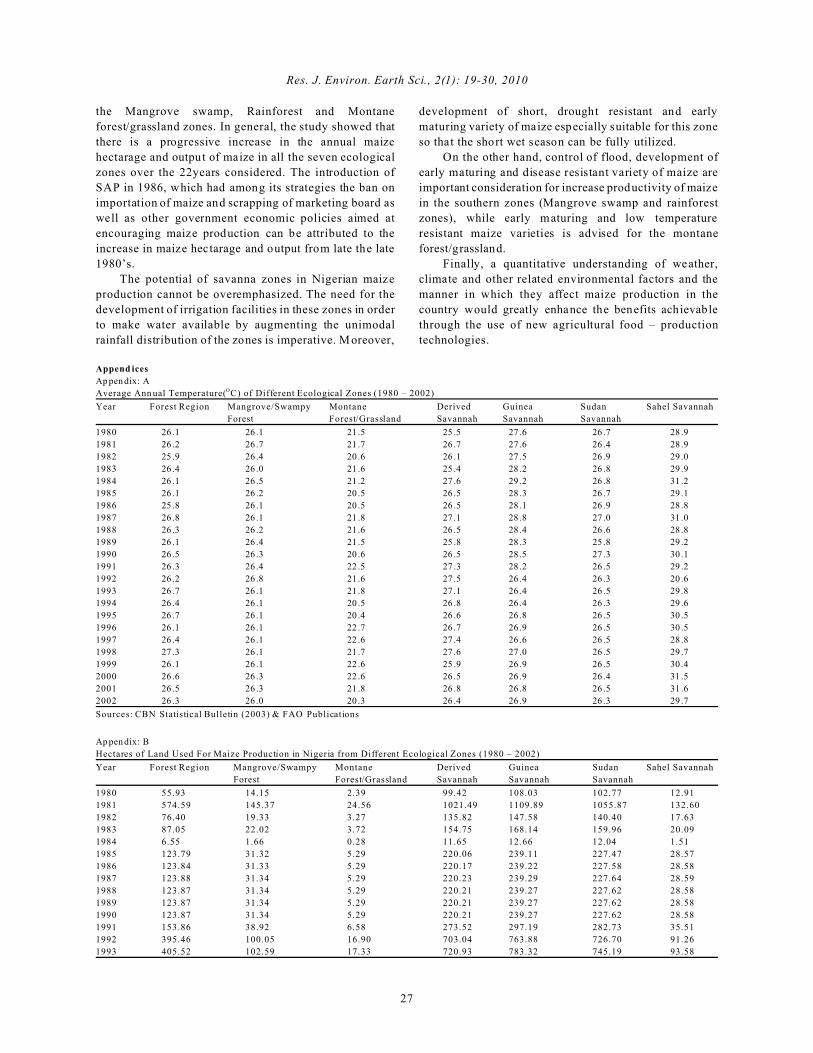
Ap pen dix: A
Average Ann ual Temperature(OC) of Different Ecological Zones (1980 – 2002)
Year Forest Region Mangrove/Swampy Montane Derived Guinea Sudan Sahel Savannah
Forest Forest/Grassland Savannah Savannah Savannah
1980 26 .1 26 .1 21 .5 25 .5 27 .6 26 .7 28 .9
1981 26 .2 26 .7 21 .7 26 .7 27 .6 26 .4 28 .9
1982 25 .9 26 .4 20 .6 26 .1 27 .5 26 .9 29 .0
1983 26 .4 26 .0 21 .6 25 .4 28 .2 26 .8 29 .9
1984 26 .1 26 .5 21 .2 27 .6 29 .2 26 .8 31 .2
1985 26 .1 26 .2 20 .5 26 .5 28 .3 26 .7 29 .1
1986 25 .8 26 .1 20 .5 26 .5 28 .1 26 .9 28 .8
1987 26 .8 26 .1 21 .8 27 .1 28 .8 27 .0 31 .0
1988 26 .3 26 .2 21 .6 26 .5 28 .4 26 .6 28 .8
1989 26 .1 26 .4 21 .5 25 .8 28 .3 25 .8 29 .2
1990 26 .5 26 .3 20 .6 26 .5 28 .5 27 .3 30 .1
1991 26 .3 26 .4 22 .5 27 .3 28 .2 26 .5 29 .2
1992 26 .2 26 .8 21 .6 27 .5 26 .4 26 .3 20 .6
1993 26 .7 26 .1 21 .8 27 .1 26 .4 26 .5 29 .8
1994 26 .4 26 .1 20 .5 26 .8 26 .4 26 .3 29 .6
1995 26 .7 26 .1 20 .4 26 .6 26 .8 26 .5 30 .5
1996 26 .1 26 .1 22 .7 26 .7 26 .9 26 .5 30 .5
1997 26 .4 26 .1 22 .6 27 .4 26 .6 26 .5 28 .8
1998 27 .3 26 .1 21 .7 27 .6 27 .0 26 .5 29 .7
1999 26 .1 26 .1 22 .6 25 .9 26 .9 26 .5 30 .4
2000 26 .6 26 .3 22 .6 26 .5 26 .9 26 .4 31 .5
2001 26 .5 26 .3 21 .8 26 .8 26 .8 26 .5 31 .6
2002 26 .3 26 .0 20 .3 26 .4 26 .9 26 .3 29 .7
Sources: CBN Statistical Bulletin (2003) & FAO Publications
Ap pen dix: B
Hectares of Land Used For Maize Production in Nigeria from Different Ecological Zones (1980 – 2002)
Year Forest Region Mangrove/Swampy Montane Derived Guinea Sudan Sahel Savannah
Forest Forest/Grassland Savannah Savannah Savannah
1980 55.93 14.15 2.39 99.42 108.03 102.77 12.91
1981 574.59 145.37 24.56 1021.49 1109.89 1055.87 132.60
1982 76.40 19.33 3.27 135.82 147.58 140.40 17.63
1983 87.05 22.02 3.72 154.75 168.14 159.96 20.09
1984 6.55 1.66 0.28 11.65 12.66 12.04 1.51
1985 123.79 31.32 5.29 220.06 239.11 227.47 28.57
1986 123.84 31.33 5.29 220.17 239.22 227.58 28.58
1987 123.88 31.34 5.29 220.23 239.29 227.64 28.59
1988 123.87 31.34 5.29 220.21 239.27 227.62 28.58
1989 123.87 31.34 5.29 220.21 239.27 227.62 28.58
1990 123.87 31.34 5.29 220.21 239.27 227.62 28.58
1991 153.86 38.92 6.58 273.52 297.19 282.73 35.51
1992 395.46 100.05 16.90 703.04 763.88 726.70 91.26
1993 405.52 102.59 17.33 720.93 783.32 745.19 93.58
Res. J. Environ. Earth Sci., 2(1): 19-30, 2010
28
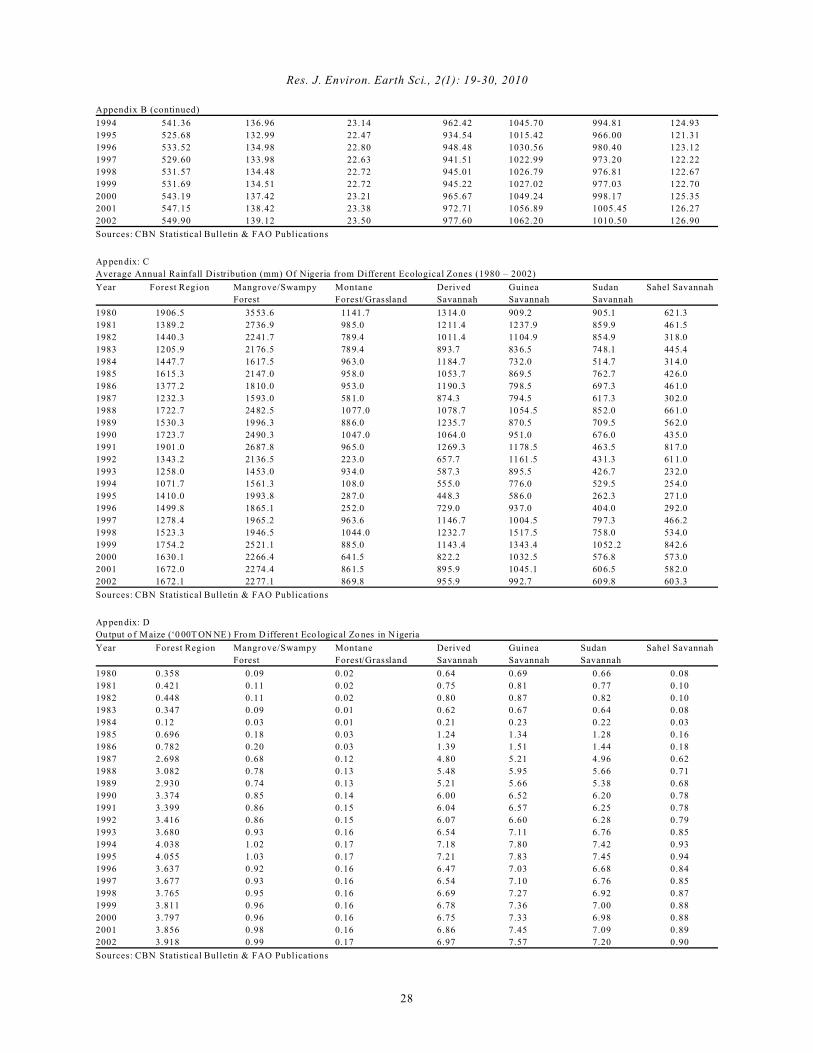
Appendix B (continued)
1994 541.36 136.96 23.14 962.42 1045.70 994.81 124.93
1995 525.68 132.99 22.47 934.54 1015.42 966.00 121.31
1996 533.52 134.98 22.80 948.48 1030.56 980.40 123.12
1997 529.60 133.98 22.63 941.51 1022.99 973.20 122.22
1998 531.57 134.48 22.72 945.01 1026.79 976.81 122.67
1999 531.69 134.51 22.72 945.22 1027.02 977.03 122.70
2000 543.19 137.42 23.21 965.67 1049.24 998.17 125.35
2001 547.15 138.42 23.38 972.71 1056.89 1005.45 126.27
2002 549.90 139.12 23.50 977.60 1062.20 1010.50 126.90
Sources: CBN Statistical Bulletin & FAO Publications
Ap pen dix: C
Average Annual Rainfall Distribution (mm) Of Nigeria from Different Ecological Zones (1980 – 2002)
Year Forest Region Mangrove/Swampy Montane Derived Guinea Sudan Sahel Savannah
Forest Forest/Grassland Savannah Savannah Savannah
1980 1906 .5 3553 .6 1141 .7 1314 .0 909.2 905.1 621.3
1981 1389 .2 2736 .9 985.0 1211 .4 1237 .9 859.9 461.5
1982 1440 .3 2241 .7 789.4 1011 .4 1104 .9 854.9 318.0
1983 1205 .9 2176 .5 789.4 893.7 836.5 748.1 445.4
1984 1447 .7 1617 .5 963.0 1184 .7 732.0 514.7 314.0
1985 1615 .3 2147 .0 958.0 1053 .7 869.5 762.7 426.0
1986 1377 .2 1810 .0 953.0 1190 .3 798.5 697.3 461.0
1987 1232 .3 1593 .0 581.0 874.3 794.5 617.3 302.0
1988 1722 .7 2482 .5 1077 .0 1078 .7 1054 .5 852.0 661.0
1989 1530 .3 1996 .3 886.0 1235 .7 870.5 709.5 562.0
1990 1723 .7 2490 .3 1047 .0 1064 .0 951.0 676.0 435.0
1991 1901 .0 2687 .8 965.0 1269 .3 1178 .5 463.5 817.0
1992 1343 .2 2136 .5 223.0 657.7 1161 .5 431.3 611.0
1993 1258 .0 1453 .0 934.0 587.3 895.5 426.7 232.0
1994 1071 .7 1561 .3 108.0 555.0 776.0 529.5 254.0
1995 1410 .0 1993 .8 287.0 448.3 586.0 262.3 271.0
1996 1499 .8 1865 .1 252.0 729.0 937.0 404.0 292.0
1997 1278 .4 1965 .2 963.6 1146 .7 1004 .5 797.3 466.2
1998 1523 .3 1946 .5 1044 .0 1232 .7 1517 .5 758.0 534.0
1999 1754 .2 2521 .1 885.0 1143 .4 1343 .4 1052 .2 842.6
2000 1630 .1 2266 .4 641.5 822.2 1032 .5 576.8 573.0
2001 1672 .0 2274 .4 861.5 895.9 1045 .1 606.5 582.0
2002 1672 .1 2277 .1 869.8 955.9 992.7 609.8 603.3
Sources: CBN Statistical Bulletin & FAO Publications
Ap pen dix: D
Ou tput o f M aize (‘0 00T ON NE ) From D ifferen t Eco logic al Zo nes in N igeria
Year Forest Region Mangrove/Swampy Montane Derived Guinea Sudan Sahel Savannah
Forest Forest/Grassland Savannah Savannah Savannah
1980 0.358 0.09 0.02 0.64 0.69 0.66 0.08
1981 0.421 0.11 0.02 0.75 0.81 0.77 0.10
1982 0.448 0.11 0.02 0.80 0.87 0.82 0.10
1983 0.347 0.09 0.01 0.62 0.67 0.64 0.08
1984 0.12 0.03 0.01 0.21 0.23 0.22 0.03
1985 0.696 0.18 0.03 1.24 1.34 1.28 0.16
1986 0.782 0.20 0.03 1.39 1.51 1.44 0.18
1987 2.698 0.68 0.12 4.80 5.21 4.96 0.62
1988 3.082 0.78 0.13 5.48 5.95 5.66 0.71
1989 2.930 0.74 0.13 5.21 5.66 5.38 0.68
1990 3.374 0.85 0.14 6.00 6.52 6.20 0.78
1991 3.399 0.86 0.15 6.04 6.57 6.25 0.78
1992 3.416 0.86 0.15 6.07 6.60 6.28 0.79
1993 3.680 0.93 0.16 6.54 7.11 6.76 0.85
1994 4.038 1.02 0.17 7.18 7.80 7.42 0.93
1995 4.055 1.03 0.17 7.21 7.83 7.45 0.94
1996 3.637 0.92 0.16 6.47 7.03 6.68 0.84
1997 3.677 0.93 0.16 6.54 7.10 6.76 0.85
1998 3.765 0.95 0.16 6.69 7.27 6.92 0.87
1999 3.811 0.96 0.16 6.78 7.36 7.00 0.88
2000 3.797 0.96 0.16 6.75 7.33 6.98 0.88
2001 3.856 0.98 0.16 6.86 7.45 7.09 0.89
2002 3.918 0.99 0.17 6.97 7.57 7.20 0.90
Sources: CBN Statistical Bulletin & FAO Publications
Res. J. Environ. Earth Sci., 2(1): 19-30, 2010
29
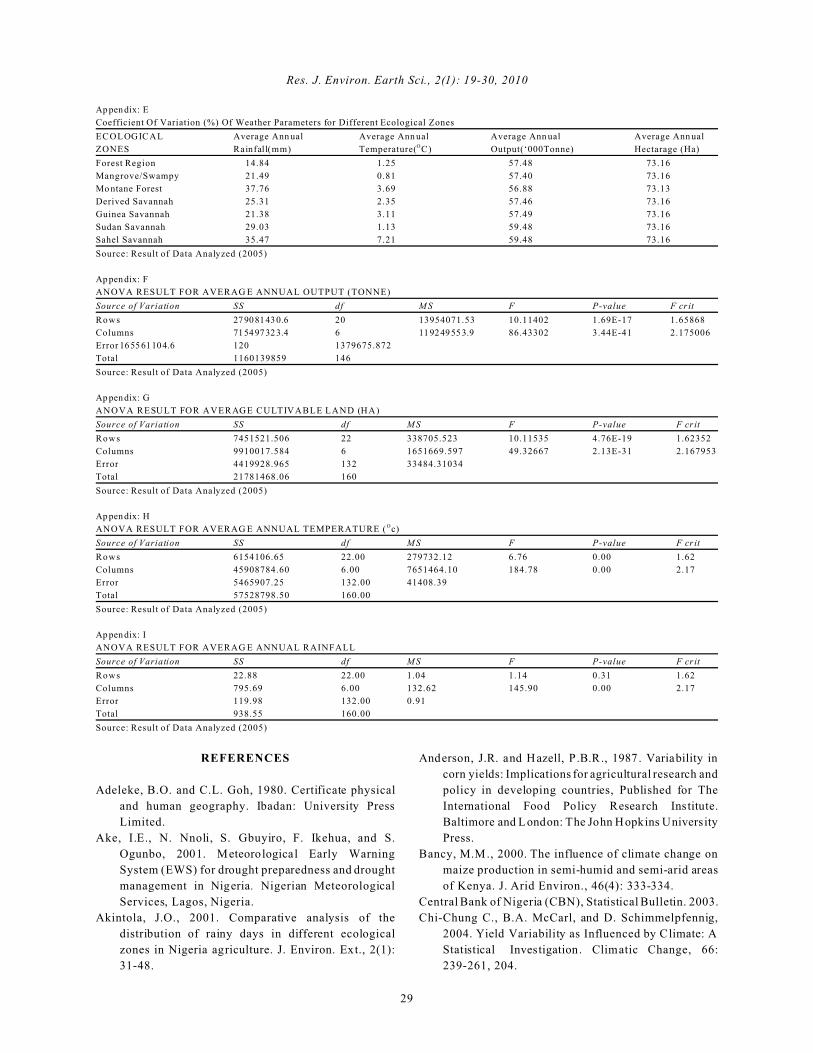
Ap pen dix: E
Coefficient Of Variation (%) Of Weather Parameters for Different Ecological Zones
ECOLOGICAL Average Ann ual Average Ann ual Average Ann ual Average Ann ual
ZONES Rainfal l(mm) Temperature(OC) Output(‘000Tonne) Hectarage (Ha)
Forest Region 14.84 1.25 57.48 73.16
Mangrove/Swampy 21.49 0.81 57.40 73.16
Mo ntane Forest 37.76 3.69 56.88 73.13
Derived Savannah 25.31 2.35 57.46 73.16
Guinea Savannah 21.38 3.11 57.49 73.16
Sudan Savannah 29.03 1.13 59.48 73.16
Sahel Savannah 35.47 7.21 59.48 73.16
Source: Result of Data Analyzed (2005)
Ap pen dix: F
ANOVA RESULT FOR AVERAG E ANNUAL OUTPUT (TONNE)
Source of Variation SS df M S F P-value F cr it
Rows 279081430.6 20 13954071.53 10.11402 1.69E-17 1.65868
Columns 715497323.4 6 119249553.9 86.43302 3.44E-41 2.175006
Error 165561104.6 120 1379675.872
Total 1160139859 146
Source: Result of Data Analyzed (2005)
Ap pen dix: G
ANOVA RESULT FOR AVERAGE CULTIVABLE LAND (HA)
Source of Variation SS df M S F P-value F cr it
Rows 7451521.506 22 338705.523 10.11535 4.76E-19 1.62352
Columns 9910017.584 6 1651669.597 49.32667 2.13E-31 2.167953
Error 4419928.965 132 33484.31034
Total 21781468.06 160
Source: Result of Data Analyzed (2005)
Ap pen dix: H
ANOVA RESULT FOR AVERAG E ANNUAL TEMPERATURE ( Oc)
Source of Variation SS df M S F P-value F cr it
Rows 6154106.65 22.00 279732.12 6.76 0.00 1.62
Columns 45908784.60 6.00 7651464.10 184.78 0.00 2.17
Error 5465907.25 132.00 41408.39
Total 57528798.50 160.00
Source: Result of Data Analyzed (2005)
Ap pen dix: I
ANOVA RESULT FOR AVERAG E ANNUAL RAINFALL
Source of Variation SS df M S F P-value F cr it
Rows 22.88 22.00 1.04 1.14 0.31 1.62
Columns 795.69 6.00 132.62 145.90 0.00 2.17
Error 119.98 132.00 0.91
Total 938.55 160.00
Source: Result of Data Analyzed (2005)
REFERENCES
Adeleke, B.O. and C.L. Goh, 1980. Certificate physical
and human geography. Ibadan: University Press
Limited.
Ake, I.E., N. Nnoli, S. Gbuyiro, F. Ikehua, and S.
Ogunbo, 2001. Meteorological Early Warning
System (EWS) for drought preparedness and drought
management in Nigeria. Nigerian Meteorological
Services, Lagos, Nigeria.
Akintola, J.O., 2001. Comparative analysis of the
distribution of rainy days in different ecological
zones in Nigeria agriculture. J. Environ. Ext., 2(1):
31-48.
Anderson, J.R. and Hazell, P.B.R., 1987. Variability in
corn yields: Implications for agricultural research and
policy in developing countries, Published for The
International Food Policy Research Institute.
Baltimore and London: The John Hopkins University
Press.
Bancy, M.M., 2000. The influence of climate change on
maize production in semi-humid and semi-arid areas
of Kenya. J. Arid Environ., 46(4): 333-334.
Central Bank of Nigeria (CBN), Statistical Bulletin. 2003.
Chi-Chung C., B.A. McCarl, and D. Schimmelpfennig,
2004. Yield Variability as Influenced by Climate: A
Statistical Investigation. Climatic Change, 66:
239-261, 204.
Res. J. Environ. Earth Sci., 2(1): 19-30, 2010
30
Climate–Nigeria, 2005. Available from: http://www.onlinenigeria.com.
FAO, 1995. FAOCLIM 1.2, W orldwide AgroclimaticData. FAO Agrometeorology Working Paper SeriesNo. 11. FAO, ROM E. 1 CD-ROM and 66P.
FAO, 1989. Production Yearbook. Agrostat - PC, The PCVersion Of The Yearbook. 1990, 43(94).
FAO, World Agriculture: Towards, 2010. An FAO Study.N. Alexandratos, editor. UK, and FAO, Rome: JohnWiley, Chichester, 1995, pp: 488.
Federal Government of Nigeria (FGN), 1999. Droughtmanagement in Nigeria: W hat can people do tominimize its impact? Abuja, Nigeria.
IPCC, Climate Change 1992. The Supplementary Reportto the IPCC Scientific Assessment. J.T. Houghton,B.A. Callandar and S.K. Varney, (Eds.). Cambridge:Cambridge University Press.
Katz, R.W. and B.G. Brown, 1992. Extreme events in a
changing climate: variability is more important than
averages. Climatic Change, 21: 289-302.
Madiyazhagan R., C.J. Birch, P.S. Carberry and R.
Micheal, 2004. Water and high temperature stress
effects on maize production. A Paper Presented at
the 4th International Crop Science Congress.
Mitchell, J.F.B., T.C. Johns, J.M. Gregory and F.B. Tett,
1995. Climate response to increasing levels of
greenhouse gases and sulphate aerosols. Nature, 376:
501-504.
Petit-Maire, N., 1992. Lire l'avenir dans les archives
géologiques. La recherché, 23(243): 566-569.
World Meteorological Organization (WM O), 1996.
Climate, weather and agriculture. A paper presented
at World Food Summit – Rome, 13 – 17th November.