Effect of Change in Water Cement Ratio on Wet … · The nominal mixes For the concrete with...
17
International OPEN ACCESS Journal Of Modern Engineering Research (IJMER) | IJMER | ISSN: 2249–6645 | www.ijmer.com | Vol. 5 | Iss. 10 | October 2015 | 43 | Effect of Change in Water Cement Ratio on Wet Density, Dry Density, Workability and Compressive Strength of M-20 Grade Concrete Dr.M.B.Varma 1 1 Assosiate Professor, Applied Mechanics Department I. INTRODUCTION The compressive strength of hardened concrete which is generally considered to be an index of its other properties, depends upon many factors, e.g. quality and quantity of cement, water and aggregates; batching and mixing; placing, compaction and curing. The cost of concrete is made up of the cost of materials, plant and labour. The variations in the cost of materials arise from the fact that the cement is several times costly than the aggregate, thus the aim is to produce as lean a mix as possible. From technical point of view the rich mixes may lead to high shrinkage and cracking in the structural concrete, and to evolution of high heat of hydration in mass concrete which may cause cracking. Nominal Concrete Mixes In the past the specifications for concrete prescribed the proportions of cement, fine and coarse aggregates. These mixes of fixed cement-aggregate ratio which ensures adequate strength are termed nominal mixes. These offer simplicity and under normal circumstances, have a margin of strength above that specified. However, due to the variability of mix ingredients the nominal concrete for a given workability varies widely in strength. The nominal mixes For the concrete with undemanding performance nominal or standard mixes (prescribed in the codes by quantities of dry ingredients per cubic meter and by slump) may be used only for very small jobs, when the 28- day strength of concrete does not exceed 30 N/mm 2 . No control testing is necessary reliance being placed on the masses of the ingredients. II. METHODOLOGY Introduction The water–cement ratio is the ratio of the weight of water to the weight of cement in a concrete mix and has an important influence on the quality of concrete produced. A lower water-cement ratio leads to higher strength and durability, but may make the mix more difficult to place. 1. Water/Cement Ratio The concept of water–cement ratio was developed by Abrams and first published in 1918.Strength of concrete primarily depends upon the strength of cement paste. Strength of cement paste depends upon the dilution of paste or in other words, the strength of paste increases with cement content and decreases with air and water content. In 1918 Abrams presented his classic law in the form: ABSTRACT:- Concrete production is made using design mix and nominal mix on actual construction site. Mostly for houses nominal mix of concrete is popular and used widely. Using Nominal mix (guide lines of IS 456-2000) concrete is being manufactured. For this research work nominal mixes were used. According to guidelines of nominal mix concrete was manufactured in laboratory keeping proportions of all other ingredients constant except water. Number of mixes was prepared in laboratory by changing water cement ratio. Wet density, workability and compressive strength was recorded for all these concrete mixes were produced using change in water cement ratio from 0.5 to 0.6(increment by 0.1 for every mix). Results obtained were presented in this paper for all concrete mixes. Keywords:- compaction factor, compressive strength, density of concrete, slump, water cement ratio
Transcript of Effect of Change in Water Cement Ratio on Wet … · The nominal mixes For the concrete with...

International
OPEN ACCESS Journal
Of Modern Engineering Research (IJMER)
| IJMER | ISSN: 2249–6645 | www.ijmer.com | Vol. 5 | Iss. 10 | October 2015 | 43 |
Effect of Change in Water Cement Ratio on Wet Density,
Dry Density, Workability and Compressive
Strength of M-20 Grade Concrete
Dr.M.B.Varma1
1Assosiate Professor, Applied Mechanics Department
I. INTRODUCTION The compressive strength of hardened concrete which is generally considered to be an index of its other
properties, depends upon many factors, e.g. quality and quantity of cement, water and aggregates; batching and
mixing; placing, compaction and curing. The cost of concrete is made up of the cost of materials, plant and
labour. The variations in the cost of materials arise from the fact that the cement is several times costly than the
aggregate, thus the aim is to produce as lean a mix as possible. From technical point of view the rich mixes may
lead to high shrinkage and cracking in the structural concrete, and to evolution of high heat of hydration in mass
concrete which may cause cracking.
Nominal Concrete Mixes In the past the specifications for concrete prescribed the proportions of cement, fine and coarse
aggregates. These mixes of fixed cement-aggregate ratio which ensures adequate strength are termed nominal
mixes. These offer simplicity and under normal circumstances, have a margin of strength above that specified.
However, due to the variability of mix ingredients the nominal concrete for a given workability varies widely in
strength.
The nominal mixes
For the concrete with undemanding performance nominal or standard mixes (prescribed in the codes by
quantities of dry ingredients per cubic meter and by slump) may be used only for very small jobs, when the 28-
day strength of concrete does not exceed 30 N/mm2. No control testing is necessary reliance being placed on the
masses of the ingredients.
II. METHODOLOGY
Introduction
The water–cement ratio is the ratio of the weight of water to the weight of cement in a concrete mix
and has an important influence on the quality of concrete produced. A lower water-cement ratio leads to higher
strength and durability, but may make the mix more difficult to place.
1. Water/Cement Ratio The concept of water–cement ratio was developed by Abrams and first published in 1918.Strength of
concrete primarily depends upon the strength of cement paste. Strength of cement paste depends upon the
dilution of paste or in other words, the strength of paste increases with cement content and decreases with air
and water content. In 1918 Abrams presented his classic law in the form:
ABSTRACT:- Concrete production is made using design mix and nominal mix on actual construction site. Mostly
for houses nominal mix of concrete is popular and used widely. Using Nominal mix (guide lines of IS 456-2000)
concrete is being manufactured. For this research work nominal mixes were used. According to guidelines of nominal
mix concrete was manufactured in laboratory keeping proportions of all other ingredients constant except water.
Number of mixes was prepared in laboratory by changing water cement ratio. Wet density, workability and compressive
strength was recorded for all these concrete mixes were produced using change in water cement ratio from 0.5 to
0.6(increment by 0.1 for every mix). Results obtained were presented in this paper for all concrete mixes.
Keywords:- compaction factor, compressive strength, density of concrete, slump, water cement ratio

Effect of Change in Water Cement Ratio on Wet Density, Dry Density, Workability and Compress…
| IJMER | ISSN: 2249–6645 | www.ijmer.com | Vol. 5 | Iss. 10 | October 2015 | 44 |
Where х = water/cement ratio by volume (28 days)
The A and B are 14,000 lbs/sq. in. and 7 respectively.
Or
The A and B are 96,460 KN/m2 and 7 respectively. [1]
Abrams water/cement ratio law states that the strength of concrete is only dependent upon
water/cement ratio provided the mix is workable. In the past many theories have been propounded by many
research workers. Some of them held valid for some time and then underwent some changes while others did not
stand the test of time and hence slowly disappeared. But Abrams water/cement ratio law stood the test of time
and is held valid even today as a fundamental truth in concrete-making practices.
Feret formulated in as early as 1897, a general rule defining the strength of the concrete paste and concrete in
terms of volume fractions of the constituents by the equation:
S = strength of concrete, c, e and a are volume of cement, water and air respectively and K = Abraham’s
constant
Comp.
strength
w/c ratio
Figure 1: The Relation between Strength and Water/Cement Ratio of Concrete [1]
Figure No. 2: The Relation between Strength and Water/Cement Ratio [1]
The graph showing the relationship between the strength and water/cement ratio is approximately
hyperbolic in shape. Sometimes it is difficult to interpolate the intermediate value. Relation between cement
water ratio and compressive strength is approximately linear. This linear relationship is more convenient to use

Effect of Change in Water Cement Ratio on Wet Density, Dry Density, Workability and Compress…
| IJMER | ISSN: 2249–6645 | www.ijmer.com | Vol. 5 | Iss. 10 | October 2015 | 45 |
than water/cement ratio curve for interpolation. Figure No. 2 shows the relationship between compressive
strength and cement/water ratio. [1]
Aggregate-Cement Bond Strengths Concrete can be regarded as a chain in which aggregates are the links bonded together by cement paste.
Aggregates generally being much stronger than the paste (gel bond), its strength is not of consequence in normal
strength concrete. The strength of aggregate is of consideration in high strength concrete and light weight
concrete.
If we take a closer look into the structure of the concrete, a third phase comes into consideration i.e.,
inter-face between the pastes and aggregate known as Transition Zone. In the ultimate analysis it is the integrity
of the transition zone that influences the strength of concrete.
In case of shrinkage taking place on account of heat of hydration, the weak gel structure at the transition zone
also suffers a higher degree of shrinkage.
Aggregate characteristics other than strength, such as size, shape, surface texture and grading are
known to affect the strength of concrete. The increase in strength is generally attributed to indirect change in w/c
ratio.
Recent studies have shown that the above characteristics of aggregates have independent
influence on the strength properties of concrete other than through w/c ratio by improving the quality of
transition zone.
III. PRIOR APPROACH Omotola Alawode et.al. [4] Have studied Effects of Water-Cement Ratios on the Compressive Strength
and Workability of Concrete and Lateritic Concrete Mixes. They have studied and reported in their paper the
variations of the compressive strengths of concrete and lateritic concrete mixes with water-cement ratios of
range 0.55 and 0.80, within 7 to 28 days after casting, were experimentally investigated .They have carried out
experiments to find the compressive strengths of both concrete and lateritic concrete mixes. They were found
that compressive strength increase with age but decrease as the water-cement ratio increases. They also
concluded water-cement ratio above 0.65 was observed to have a very significant reduction effect on the
compressive strength of the lateritic concrete mixes. They reported contrast to the performance of the concrete
mixes which shows consistent decrease of compressive strength in water-cement ratio. They also concluded that
from the findings of their research, lateritic concrete is not workable compared to the normal concrete.
Lateritic concrete is any concrete mixes which uses laterite as a substitute for sharp sand in a specific
mix design ratio to give an appropriate strength, appearance and workability using the correct water-cement
ratio. Laterite as an aggregate is cheaper and most common and, therefore, could be considered for possible
usage as a replacement for sharp sand in concrete mixes. Aggregate consists of uncrushed or crushed gravel,
crushed stone or rock, laterite for lateritic concrete, sand or artificially produced inorganic materials.
Kama Rahmanip.P. et.al. [5] in his investigation, concrete cubic sample size of (15×15×15 cm3) were prepared
with different combination of nano-silica samples and variable water and cement ratio. The sample compressive
strength was examined by him at the curing time of 7, 28 and 91 days. The aim of his paper was to investigate
the importance water and cement ratio on compressive strength and abrasion resistant of micro silica in the
concrete.
IV. OUR APPROACH Cement OPC of 43 grade cement was used. Fine aggregate natural Godavari river sand was used.
Coarse aggregate crushed angular 20 mm and 12 mm size were used; potable water was used to production of
cement concrete of grade M20. Material used in following proportion (by weight, and nominal mix provisions
of IS 456-2000)
Proportion used to produce M 20 grade concrete in Laboratory
C:F.A:C.A:W/C RATIO (by weight)
1:1.67:3.31:0.6
Cement =10 Kg
Sand (F.A.) =16.7 Kg
12 mm C.A= 8.30 Kg
20 mm C.A. =24.80 Kg
Effect of Change in Water Cement Ratio on Wet Density, Dry Density, Workability and Compress…
| IJMER | ISSN: 2249–6645 | www.ijmer.com | Vol. 5 | Iss. 10 | October 2015 | 46 |
Water= 6 Ltr
4.2. Properties of Fresh Concrete
Concrete differs from conventional concrete in that its fresh properties are vital in determining whether
or not it can be placed satisfactorily. The various aspects of workability which control its filling ability, its
passing ability and its Segregation resistance all need to be carefully controlled to ensure that its ability to be
placed remains acceptable.
Concrete is primarily strong in compression and in actual construction, the concrete is used in
compression. Higher the compressive strength better is the durability. Bond strength also improves with the
increase in compressive strength and is important in R.C.C. work. Compressive strength also indicates extent of
control exercised during construction. Resistance to abrasion and volume stability improves with the
compressive strength. Test for compressive strength is, therefore, very important in quality control of concrete.
Preparation and conduct of compressive strength is comparatively easy and give more consistent results than
tensile strength or flexure strength. This test for determining compressive strength of concrete has, therefore
attained maximum importance. For acceptance compressive strength of concrete has, therefore attained
maximum importance.
Concrete was produced using nominal mix. Cube Mould of size 15 x 15 x 15 cm was used. Number of
mixes was prepared by changing water cement ratio by 0.1. For each mix, six cubes were cast and kept for water
curing. After water curing of 7 days and 28 days, compressive strength was recorded, after carrying compression
test on cubes.
At the time of production of concrete slum and compaction factor was recorded for measurement of
workability of concrete. Wet weight and dry weight of concrete cube were recorded and from this weight dry
and wet density of concrete were calculated. All the observations regarding 7 days compressive strength, 28
days compressive strength, slump of concrete, compaction factor of concrete, wet and dry weight of concrete
were presented in Table below.
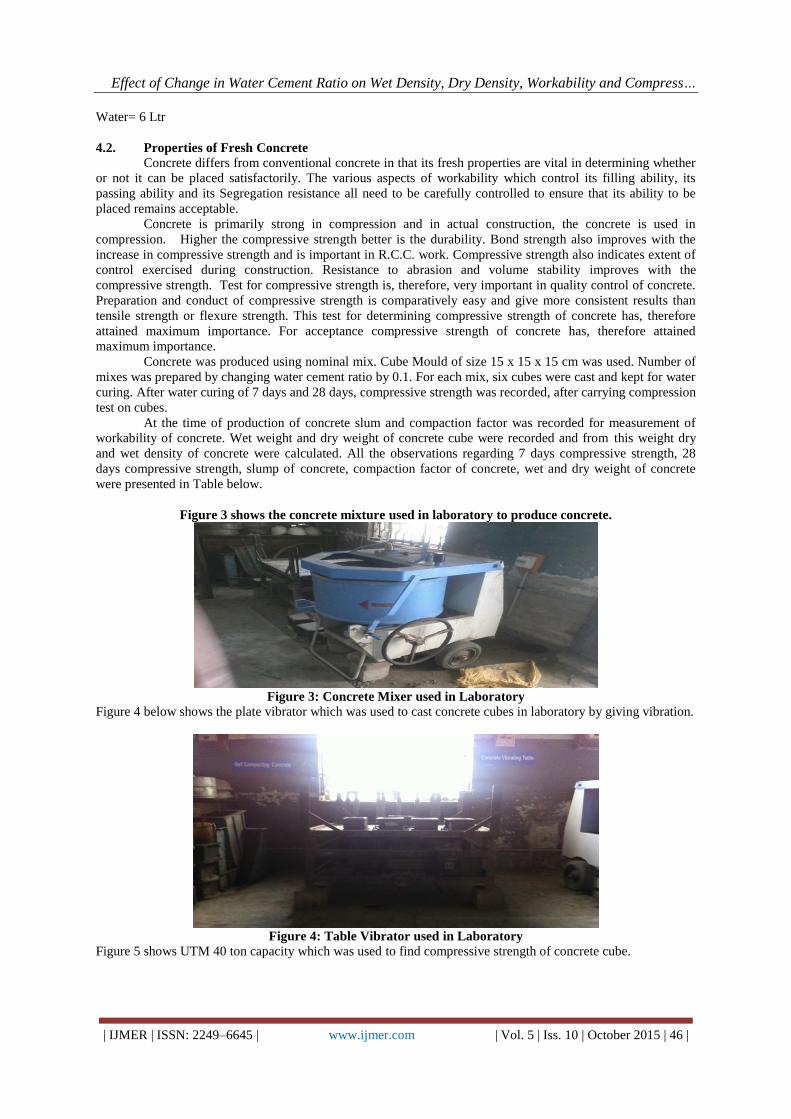
Figure 3 shows the concrete mixture used in laboratory to produce concrete.
Figure 3: Concrete Mixer used in Laboratory
Figure 4 below shows the plate vibrator which was used to cast concrete cubes in laboratory by giving vibration.
Figure 4: Table Vibrator used in Laboratory
Figure 5 shows UTM 40 ton capacity which was used to find compressive strength of concrete cube.

Effect of Change in Water Cement Ratio on Wet Density, Dry Density, Workability and Compress…
| IJMER | ISSN: 2249–6645 | www.ijmer.com | Vol. 5 | Iss. 10 | October 2015 | 47 |
Figure 5: Compression Test on Concrete Cube (UTM Machine)
Concrete was produced in laboratory using above proportion. Empty weight of cube moulds and weight
of mould with concrete was recorded. All results obtained were tabulated below (Table 1); from obtained results
wet density of concrete was calculated
Table 1: Comparison for Various Mixes with Different Water Cement Ratio and
Weight Density of Concrete Empty
Weight of cube mould
Filled Weight
Wet Weight
Wet Density
of concrete
Wet Density
of concrete
Kg Kg Kg Kg/m3 Kg/m3
1 0.6 9.95 18.85 8.9 2637.04 2651.85
9.7 18.6 8.9 2637.04
9.75 18.8 9.05 2681.48
2 0.59 9.95 19.1 9.15 2711.11 2725.92 9.7 18.85 9.15 2711.11
9.75 19.05 9.3 2755.56
3 0.58 10 19.4 9.4 2785.19 2755.55
9.7 18.85 9.15 2711.11
9.8 19.15 9.35 2770.37
4 0.57 10 19.25 9.25 2740.74 2750.62
9.7 19 9.3 2755.56
9.8 19.1 9.3 2755.56
5 0.56 10 19.25 9.25 2740.74 2716.05
9.7 18.7 9 2666.67
9.8 19.05 9.25 2740.74
6 0.55 10 19.15 9.15 2711.11 2750.61
9.7 18.9 9.2 2725.93
9.8 19.3 9.5 2814.81
7 0.54 10 19.1 9.1 2696.30 2720.99
9.7 18.8 9.1 2696.30
9.8 19.15 9.35 2770.37
8 0.53 10 19.45 9.45 2800.00 2775.30
9.7 18.75 9.05 2681.48
9.8 19.4 9.6 2844.44
9 0.52 10 19.6 9.6 2844.44 2785.18
9.7 18.9 9.2 2725.93
9.8 19.2 9.4 2785.19
10
0.51 10 19.4 9.4 2785.19 2785.18
9.7 18.8 9.1 2696.30
9.8 19.5 9.7 2874.07
11
0.50 10 19.5 9.5 2814.81 2804.93
9.7 19.05 9.35 2770.37
9.8 19.35 9.55 2829.63
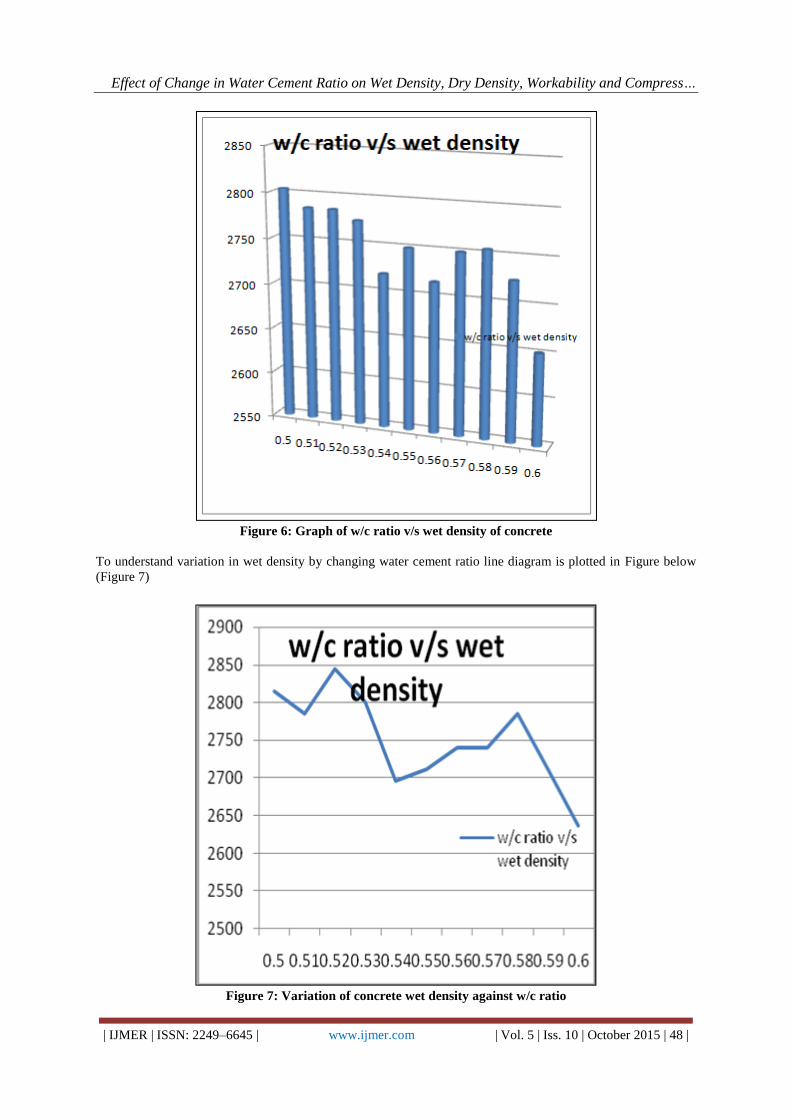
Graph was plotted to show values of wet density of concrete against water cement ratio. (Figure 6)
Effect of Change in Water Cement Ratio on Wet Density, Dry Density, Workability and Compress…
| IJMER | ISSN: 2249–6645 | www.ijmer.com | Vol. 5 | Iss. 10 | October 2015 | 48 |
Figure 6: Graph of w/c ratio v/s wet density of concrete
To understand variation in wet density by changing water cement ratio line diagram is plotted in Figure below
(Figure 7)
Figure 7: Variation of concrete wet density against w/c ratio

Effect of Change in Water Cement Ratio on Wet Density, Dry Density, Workability and Compress…
| IJMER | ISSN: 2249–6645 | www.ijmer.com | Vol. 5 | Iss. 10 | October 2015 | 49 |
Table 2: Comparison for Various Mixes with Different Water Cement Ratio and Dry Density of Concrete Dry
Weight Dry
Density 28 Days Weight
28 Days Dry
Density
28 Days Dry
Density
Kg Kg Kg Kg/m3 Kg/m3
1 0.6 8.65 2562.96 8.65 2562.96 2577
8.65 2562.96 8.65 2562.96
8.8 2607.41 8.8 2607.41
2 0.59 8.75 2592.59 8.85 2622.22 2627
8.75 2592.59 8.95 2651.85
9 2666.67 8.8 2607.41
3 0.58 8.9 2637.04 8.9 2637.04 2651
8.95 2651.85 8.95 2651.85
9 2666.67 9 2666.67
4 0.57 8.85 2622.22 8.85 2622.22 2646
9 2666.67 9 2666.67
8.95 2651.85 8.95 2651.85
5 0.56 9 2666.67 9 2666.67 2656.79
8.95 2651.85 8.95 2651.85
8.95 2651.85 8.95 2651.85
6 0.55 9.05 2681.48 9.05 2681.48 2686
9.05 2681.48 9.05 2681.48
9.1 2696.30 9.1 2696.30
7 0.54 8.85 2622.22 8.85 2622.22 2646
9 2666.67 9 2666.67
8.95 2651.85 8.95 2651.85
8 0.53 9.2 2725.93 9.2 2725.93 2701
9.1 2696.30 9.1 2696.30
9.05 2681.48 9.05 2681.48
9 0.52 9.15 2711.11 9.3 2755.56 2740.74
9.15 2711.11 9.35 2770.37
9 2666.67 9.1 2696.30
10 0.51 9.15 2711.11 9.25 2740.74 2725.92
8.95 2651.85 9.25 2740.74
9.4 2785.19 9.1 2696.30
11 0.50 9.25 2740.74 9.2 2725.93 2725.93
9.4 2785.19 9.1 2696.30
9.2 2725.93 9.3 2755.56
Above Table shows dry density of concrete (28 days).As water cement ratio increases from 0.5 to 0.6 dry
density decreases
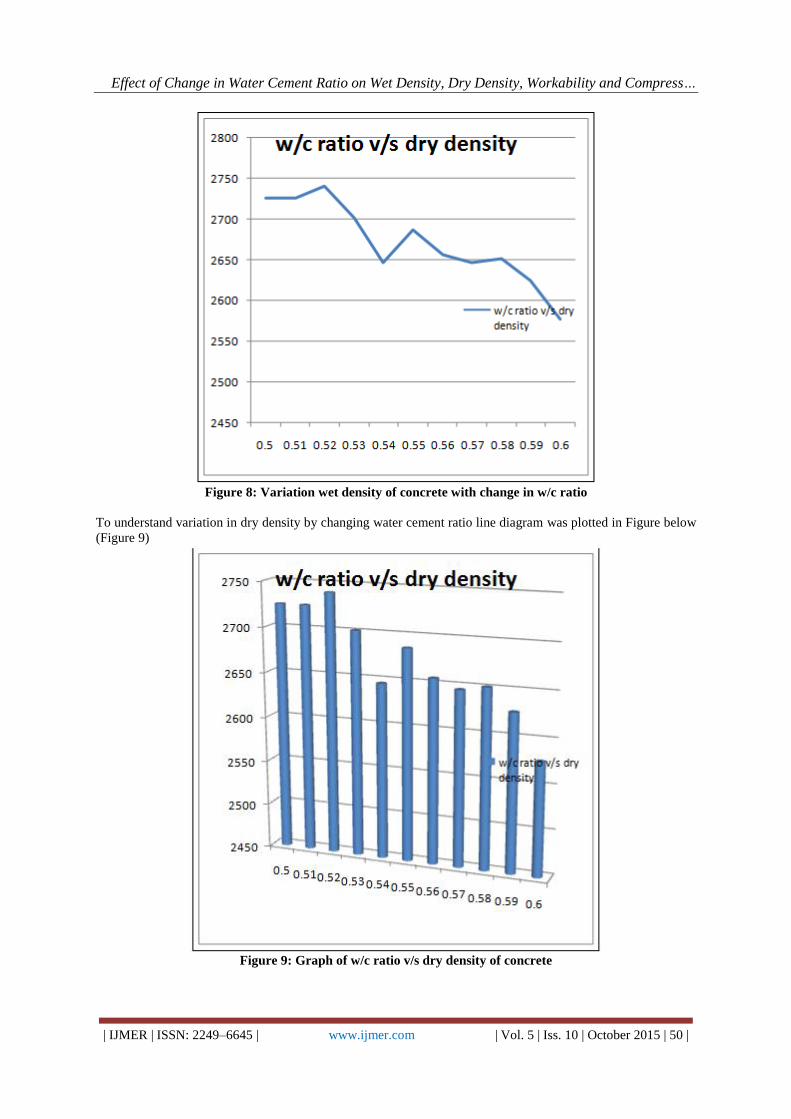
Graph was plotted to show values of dry density of concrete (28 days) against water cement ratio. (Figure 8)
Effect of Change in Water Cement Ratio on Wet Density, Dry Density, Workability and Compress…
| IJMER | ISSN: 2249–6645 | www.ijmer.com | Vol. 5 | Iss. 10 | October 2015 | 50 |
Figure 8: Variation wet density of concrete with change in w/c ratio
To understand variation in dry density by changing water cement ratio line diagram was plotted in Figure below
(Figure 9)
Figure 9: Graph of w/c ratio v/s dry density of concrete
Effect of Change in Water Cement Ratio on Wet Density, Dry Density, Workability and Compress…
| IJMER | ISSN: 2249–6645 | www.ijmer.com | Vol. 5 | Iss. 10 | October 2015 | 51 |
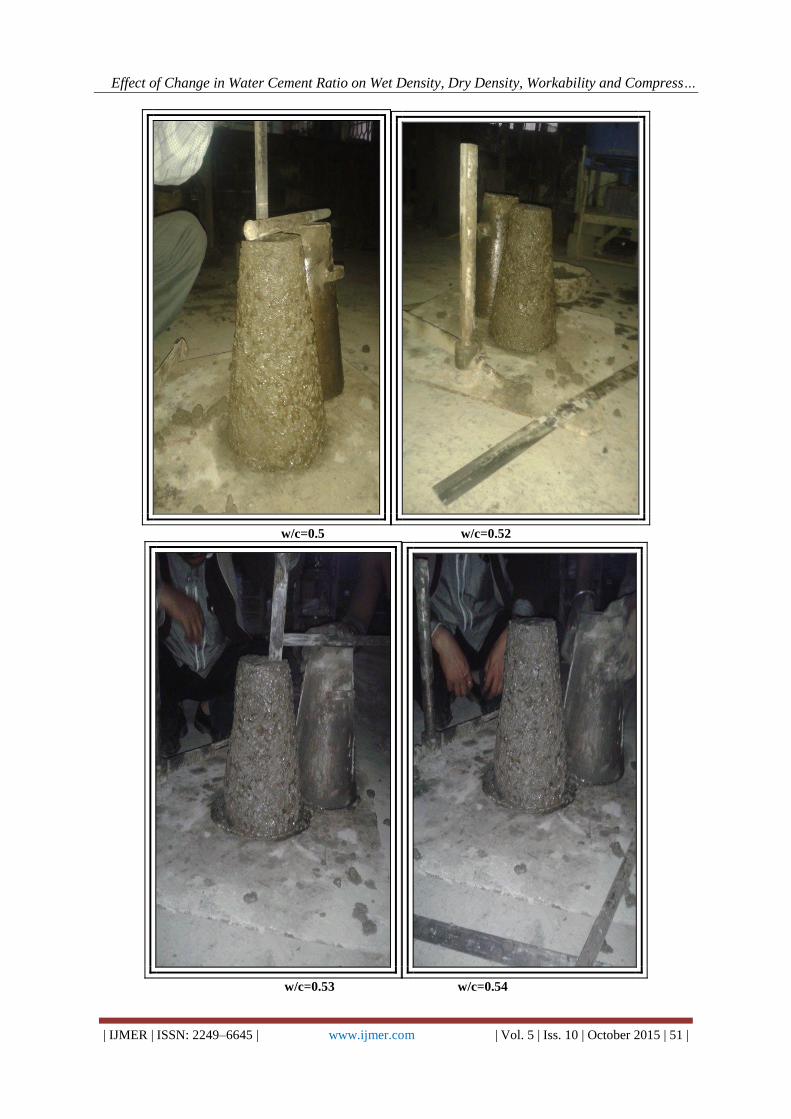
w/c=0.5 w/c=0.52
w/c=0.53 w/c=0.54

Effect of Change in Water Cement Ratio on Wet Density, Dry Density, Workability and Compress…
| IJMER | ISSN: 2249–6645 | www.ijmer.com | Vol. 5 | Iss. 10 | October 2015 | 52 |
w/c=0.55 w/c=0.56
Figure 10: Photo of slump of concrete for different water cement ratio
Workability of concrete produced was measured by slump cone as well as compaction factor results obtained in
laboratory were tabulated below (Table 3)
Table 3: Comparison Different Water Cement Ratio with Slump & Compaction
Factor of Concrete Mixes
mix w/c ratio
Slump mm
Compaction factor
1 0.60 195 0.95
2 0.59 185 0.952
3 0.58 175 0.94
4 0.57 150 0.94
5 0.56 125 0.944
6 0.55 90 0.9438
7 0.54 65 0.93
8 0.53 25 0.92
9 0.52 25 0.92
10 0.51 15 0.88
11 0.50 15 0.91
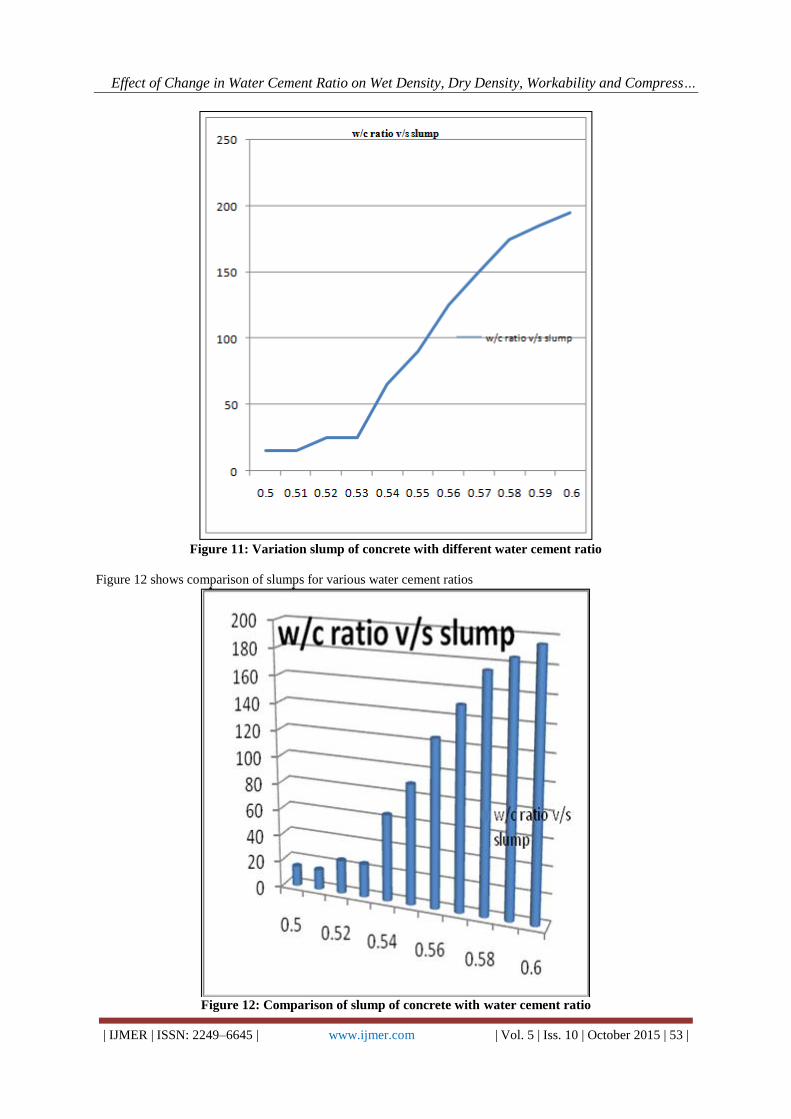
A graph was plotted to show variation in slump with change in water cement ratio below (Figure 11)
Effect of Change in Water Cement Ratio on Wet Density, Dry Density, Workability and Compress…
| IJMER | ISSN: 2249–6645 | www.ijmer.com | Vol. 5 | Iss. 10 | October 2015 | 53 |
Figure 11: Variation slump of concrete with different water cement ratio
Figure 12 shows comparison of slumps for various water cement ratios
Figure 12: Comparison of slump of concrete with water cement ratio
Effect of Change in Water Cement Ratio on Wet Density, Dry Density, Workability and Compress…
| IJMER | ISSN: 2249–6645 | www.ijmer.com | Vol. 5 | Iss. 10 | October 2015 | 54 |
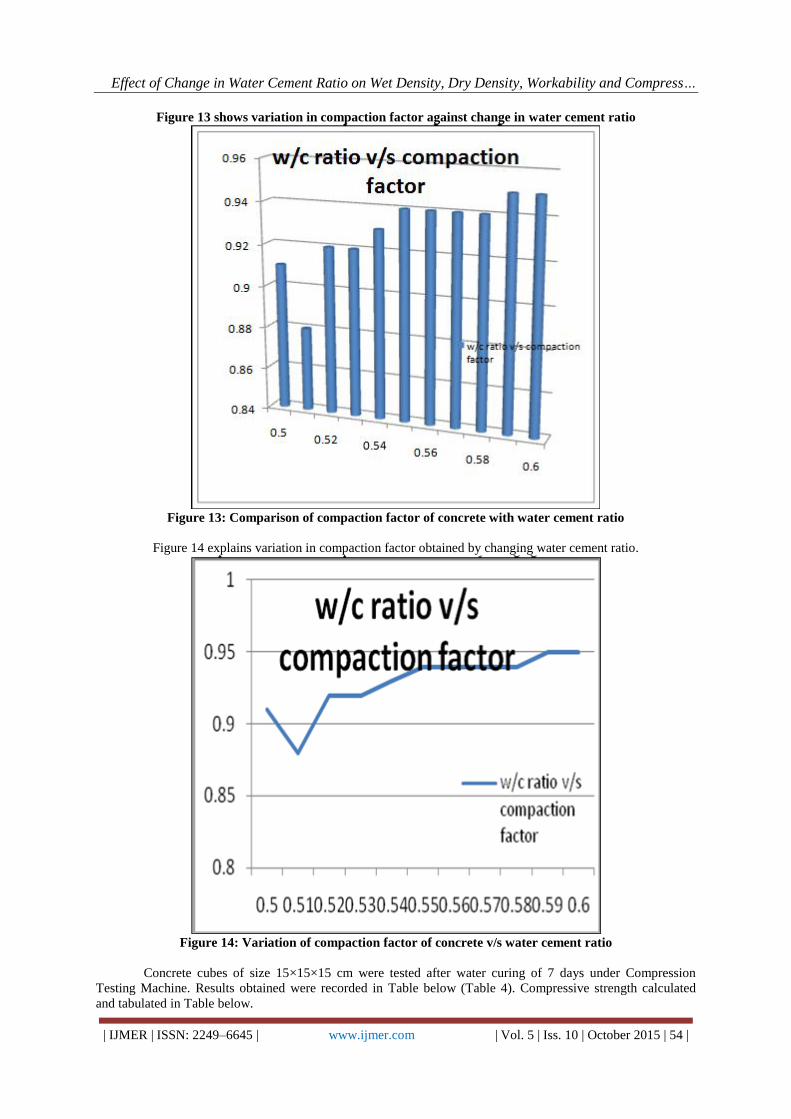
Figure 13 shows variation in compaction factor against change in water cement ratio
Figure 13: Comparison of compaction factor of concrete with water cement ratio
Figure 14 explains variation in compaction factor obtained by changing water cement ratio.
Figure 14: Variation of compaction factor of concrete v/s water cement ratio
Concrete cubes of size 15×15×15 cm were tested after water curing of 7 days under Compression
Testing Machine. Results obtained were recorded in Table below (Table 4). Compressive strength calculated
and tabulated in Table below.

Effect of Change in Water Cement Ratio on Wet Density, Dry Density, Workability and Compress…
| IJMER | ISSN: 2249–6645 | www.ijmer.com | Vol. 5 | Iss. 10 | October 2015 | 55 |
Table 4: Comparison Water Cement Ratio and Compressive Strength (7 Days) of Concrete
7 days
mix w/c
ratio
Load
kN
Comp.
Strength
N/mm2
Av.
Comp.
Strength
N/mm2
1 0.60 210 9.33 10.22
250 11.11
230 10.22
2 0.59 250 11.11 10.37
230 10.22
220 9.78
3 0.58 250 11.11 11.41
270 12.00
250 11.11
4 0.57 320 14.22 12.74
300 13.33
240 10.67
5 0.56 320 14.22 13.11
275 12.22
290 12.89
6 0.55 290 12.89 13.19
310 13.78
290 12.89
7 0.54 300 13.33 13.33
310 13.78
290 12.89
8 0.53 390 17.33 15.56
320 14.22
340 15.11
9 0.52 460 20.44 17.93
390 17.33
360 16.00
10 0.51 370 16.44 18.07
460 20.44
390 17.33
11 0.50 410 18.22 19.85
440 19.56
490 21.78
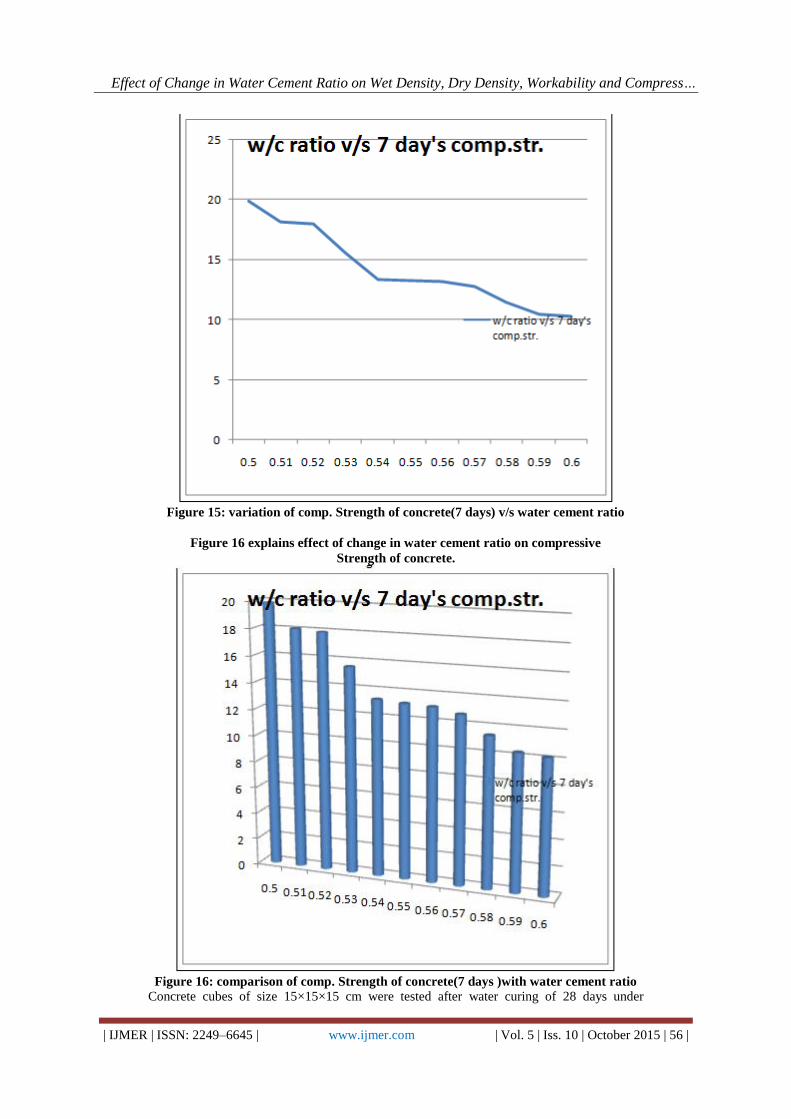
7 days compressive strength was calculated and tabulated in Table 4 above. Obtained value
suggest as water cement ratio increases 7 Days Compressive Strength of concrete decreases
Figure 15 shows variation in 7 days compressive strength with change in water cement ratio.
Effect of Change in Water Cement Ratio on Wet Density, Dry Density, Workability and Compress…
| IJMER | ISSN: 2249–6645 | www.ijmer.com | Vol. 5 | Iss. 10 | October 2015 | 56 |
Figure 15: variation of comp. Strength of concrete(7 days) v/s water cement ratio
Figure 16 explains effect of change in water cement ratio on compressive
Strength of concrete.
Figure 16: comparison of comp. Strength of concrete(7 days )with water cement ratio
Concrete cubes of size 15×15×15 cm were tested after water curing of 28 days under

Effect of Change in Water Cement Ratio on Wet Density, Dry Density, Workability and Compress…
| IJMER | ISSN: 2249–6645 | www.ijmer.com | Vol. 5 | Iss. 10 | October 2015 | 57 |
Compression Testing Machine. Results obtained were recorded in Table below (Table 4).
Compressive strength calculated and tabulated in Table below.
Table 5: Comparison Water Cement Ratio And Compressive Strength (28 Days) of Concrete
28 days
mix w/c
ratio
Load
kN
Comp.
Strength
N/mm2
Av.
Comp.
Strength
N/mm2
1 0.60 450 20 18.22
400 17.78
380 16.89
2 0.59 420 18.67 18.67
410 18.22
430 19.11
3 0.58 470 20.89 20.15
430 19.11
460 20.44
4 0.57 520 23.11 21.19
470 20.89
440 19.56
5 0.56 420 18.67 22.07
550 24.44
520 23.11
6 0.55 540 24.00 22.37
470 20.89
500 22.22
7 0.54 490 21.78 22.96
630 28.00
430 19.11
8 0.53 560 24.89 23.41
470 20.89
550 24.44
9 0.52 670 29.78 29.93
450 20
400 17.78
10 0.51 380 16.89 30.07
420 18.67
410 18.22
11 0.50 430 19.11 31.26
470 20.89
430 19.11
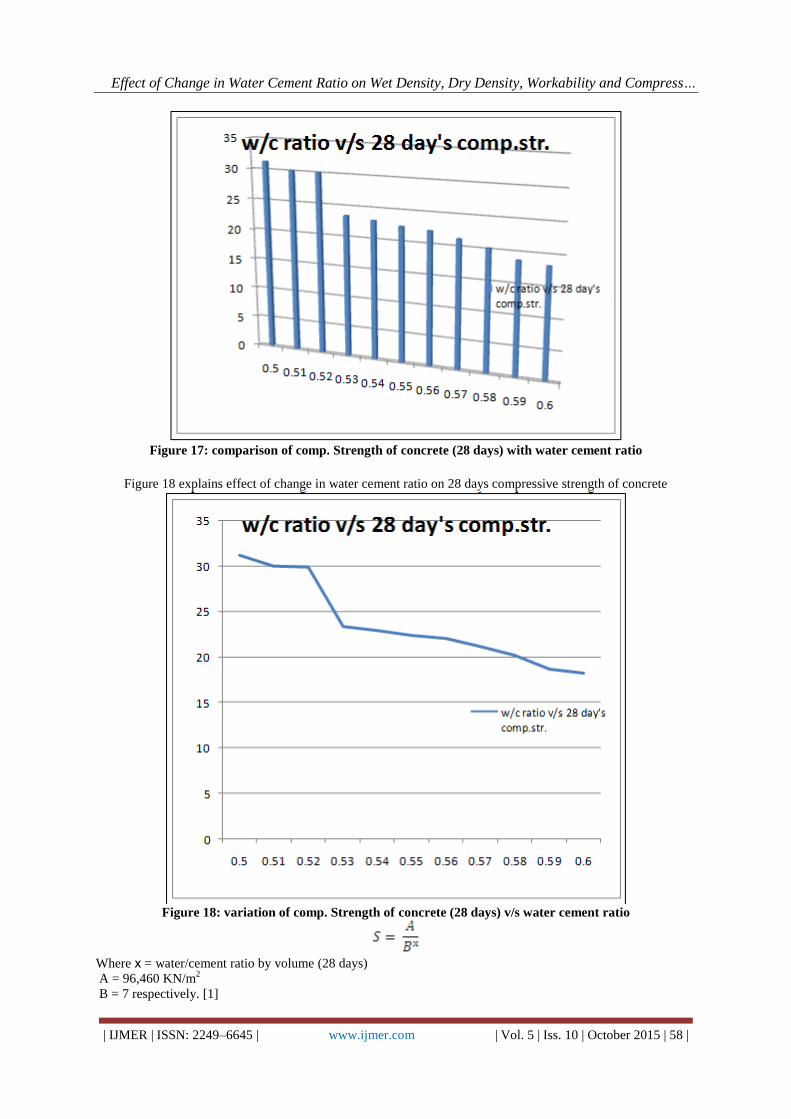
28 days compressive strength was calculated and tabulated in Table 5 above. Obtained value suggest as water
cement ratio increases 28 Days Compressive Strength of concrete decreases
Figure 17 shows variation in 28 days compressive strength with change in water cement ratio.
Effect of Change in Water Cement Ratio on Wet Density, Dry Density, Workability and Compress…
| IJMER | ISSN: 2249–6645 | www.ijmer.com | Vol. 5 | Iss. 10 | October 2015 | 58 |
Figure 17: comparison of comp. Strength of concrete (28 days) with water cement ratio
Figure 18 explains effect of change in water cement ratio on 28 days compressive strength of concrete
Figure 18: variation of comp. Strength of concrete (28 days) v/s water cement ratio
Where х = water/cement ratio by volume (28 days)
A = 96,460 KN/m2
B = 7 respectively. [1]

Effect of Change in Water Cement Ratio on Wet Density, Dry Density, Workability and Compress…
| IJMER | ISSN: 2249–6645 | www.ijmer.com | Vol. 5 | Iss. 10 | October 2015 | 59 |
Table 6: comparison compressive strength (28 days) of concrete by
Abrams formula with actually obtained
w/c ratio
w/c ratio
Comp. Strength
Comp. Strength
%
weight volume MPa MPa variation
(Abrams) (actual)
0.5 0.71 24.03 31.26 30.10
0.51 0.73 23.37 30.07 28.68
0.52 0.74 22.73 29.93 31.69
0.53 0.76 22.10 23.41 5.90
0.54 0.77 21.50 22.96 6.80
0.55 0.79 20.91 22.37 6.99
0.56 0.80 20.34 22.07 8.53
0.57 0.81 19.78 21.19 7.14
0.58 0.83 19.24 20.15 4.75
0.59 0.84 18.71 18.67 -0.21
0.6 0.86 18.20 18.22 0.13
From above Table (Table 6) compressive strength of concrete (28 days) calculated by Abrams formula and
actually obtained for water cement ratio 0.6 to 0.53(0.86 to 0.76 by volume)
V. CONCLUSION From the analysis of the tests carried out, it was revealed that increase in water-cement ratio causes
reduction effect on the compressive strength of concrete mixes. However, the compressive strength of concrete
mixes increases with age.
Water-cement ratio above 0.55 was found to cause a very significant reduction in the compressive
strength of the concrete mixes. This is in contrast to the performance of the concrete mixes which show
consistent decrease of compressive strength with increase in water-cement ratio.
1. Compressive Strength 7 days - Gradually increases
2. Compressive Strength 28 days - Gradually increases
3. Wet Density - Increases
4. Dry Density - Increases
5. Workability of Concrete - Gradually Decrease
6. Compaction Factor - Decrease
7. Water cement ratio is very important factor for manufacturing of concrete as far as compressive
strength of concrete is concerned this study shows as water cement ratio increases compressive strength
decreases. Strict control on the water cement ratio on site is very much required to get good quality concrete.
8. Values of compressive strength of concrete(28 days) obtained by Abram formula are almost
matching(8.53 % variation) for concrete with water cement ratio between 0.53 to 0.60(by weight)
REFERENCES
[1]. M.S. Shetty Text book Concrete Technology, Seventh Revised Edition 2013, Abrams Water Cement Ratio
Studies, page 353.
[2]. IS-456-2000 for Reinforcement Concrete CEMEX USA Technical Bulletin 9.1,2013,p.p. 1-5
[3]. OMOTOLA ALAWODE. Effects of Water-Cement Ratios on the Compressive Strength and Workability of
Concrete and Lateritic Concrete Mixes., et.al. The Pacific Journal of Science and Technology, Volume 12.
Number 2. November,p.p.99-105
[4]. KAMA; RAHMANIP.P. et.al. Effect Of Water Cement Ratio On Compressive Strength And Abrasion Of
Microsilica Concrete, Middle-East Journal of scientific research 12(8),2012,p.p. 1056-1061