Effects of Inulin on Rheological Attributes of Processed Cheese

2
1
2
3
Effect of blends of short and long-chain inulin on the rheological and sensory 4
properties of prebiotic low-fat custards 5
6
A. Tárrega*, A. Rocafull and E. Costell 7
8
Physical and Sensory Properties Laboratory 9
Instituto de Agroquímica y Tecnología de Alimentos, CSIC 10
P.O. Box 73, 46100 Burjassot (Valencia), Spain. 11
12
13
14
15
16
17
* Correspondence to:
Amparo Tarrega
Phone: +34-96-3900022
Fax: +34-96-3636301
e-mail: [email protected]
18
*ManuscriptClick here to view linked References

3
1
Abstract 2
Long-chain inulin (TEX) and short-chain inulin (CLR) combined in different 3
proportions (25:75, 50:50, and 75:25) were added (7.5 g/100g) to low-fat custards 4
and their rheological and sensory properties were studied. The effect of the inulin 5
blends on the rheological properties depended on the presence of lambda 6
carrageenan (0.01g/100g). Slight variations were observed when inulin blends were 7
added to custards without lambda carrageenan whereas in samples with carrageenan, 8
there was an important increase in thixotropy, consistency and elasticity. In both 9
cases (samples with and without carrageenan) the differences perceived by assessors 10
indicated that the blends 50:50 and 25:75 TEX:CLR were those affording greater 11
thickness, sweetness and vanilla flavour intensity to the custards. Addition of inulin 12
blends to low-fat samples did not manage to fully emulate the rheological behaviour 13
of full-fat custard. However, the low-fat sample with the inulin blend 50:50 TEX: 14
CLR added was perceived to have the same creaminess and thickness as the full-fat 15
sample. The use of this blend combined with carrageenan gave thicker, creamier 16
custard, which was preferred over the full-fat custard. 17
18
19
20
21
22
23
Keywords: oligofructose, long chain inulin, carrageenan, custard, rheology, sensory 24
25

4
1. Introduction 1
2
Inulin and oligofructose are non-digestible fructans of interest in human nutrition 3
due to their prebiotic effect, i.e. specific stimulation of growth and/or activity of 4
colonic bacteria that benefit the host, as well as inhibiting the growth of pathogens 5
and harmful microorganisms (Roberfroid, 2007). Native inulin contains molecules 6
of different polymerization degree (from 2 to 60) and commercial products 7
containing only short-chain inulin (oligofructose) (2-7 units) or long-chain inulin 8
(22-25 units) are obtained from native inulin industrially. The prebiotic effects of 9
inulin depend both on the composition of the intestinal flora in each individual and 10
also on the degree of polymerization of fructose-chains (Biedrzycka, & Bielecka, 11
2004; Coudray, Tressol, Gueux, & Rayssiguier, 2003) showed that low-chain 12
fructans act more intensively in the proximal colon and inulin in more distal colonic 13
regions and suggested that the use of mixtures of oligofructose and inulin could 14
prolong effectiveness in the bowel. Stewart, Timm, & Slavin, 2008 studied the in 15
vitro fermentation of inulin samples with different polymerization degrees, 16
confirming that chain length affects fermentability, with short chains fermenting 17
rapidly and long chains fermenting steadily. They also showed that a mixture of 18
long-chain and short-chain inulin produced significantly more short-chain fatty acids 19
(SCFA) and acetate. Accordingly, blends of inulin with different chain length could 20
maximize fermentative and prebiotic characteristics of inulin. 21
Chain length also affects certain properties of inulin and different technological 22
properties and applications correspond to different inulin types. Short-chain inulin or 23
oligofructose is much more soluble and sweeter than native inulin, with a sweetness 24
profile similar to that of sucrose, and a low caloric content (1 2 kcal/g) but with a 25
5
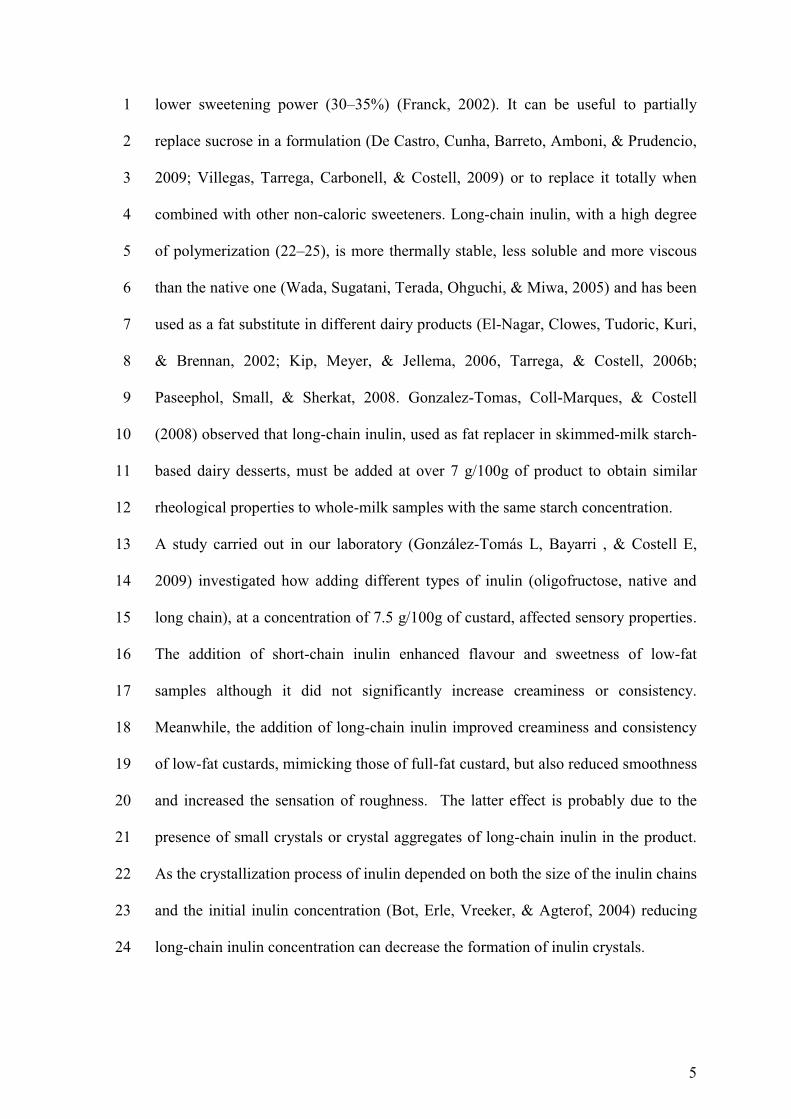
lower sweetening power (30 35%) (Franck, 2002). It can be useful to partially 1
replace sucrose in a formulation (De Castro, Cunha, Barreto, Amboni, & Prudencio, 2
2009; Villegas, Tarrega, Carbonell, & Costell, 2009) or to replace it totally when 3
combined with other non-caloric sweeteners. Long-chain inulin, with a high degree 4
of polymerization (22 25), is more thermally stable, less soluble and more viscous 5
than the native one (Wada, Sugatani, Terada, Ohguchi, & Miwa, 2005) and has been 6
used as a fat substitute in different dairy products (El-Nagar, Clowes, Tudoric, Kuri, 7
& Brennan, 2002; Kip, Meyer, & Jellema, 2006, Tarrega, & Costell, 2006b; 8
Paseephol, Small, & Sherkat, 2008. Gonzalez-Tomas, Coll-Marques, & Costell 9
(2008) observed that long-chain inulin, used as fat replacer in skimmed-milk starch-10
based dairy desserts, must be added at over 7 g/100g of product to obtain similar 11
rheological properties to whole-milk samples with the same starch concentration. 12
A study carried out in our laboratory (González-Tomás L, Bayarri , & Costell E, 13
2009) investigated how adding different types of inulin (oligofructose, native and 14
long chain), at a concentration of 7.5 g/100g of custard, affected sensory properties. 15
The addition of short-chain inulin enhanced flavour and sweetness of low-fat 16
samples although it did not significantly increase creaminess or consistency. 17
Meanwhile, the addition of long-chain inulin improved creaminess and consistency 18
of low-fat custards, mimicking those of full-fat custard, but also reduced smoothness 19
and increased the sensation of roughness. The latter effect is probably due to the 20
presence of small crystals or crystal aggregates of long-chain inulin in the product. 21
As the crystallization process of inulin depended on both the size of the inulin chains 22
and the initial inulin concentration (Bot, Erle, Vreeker, & Agterof, 2004) reducing 23
long-chain inulin concentration can decrease the formation of inulin crystals. 24
6
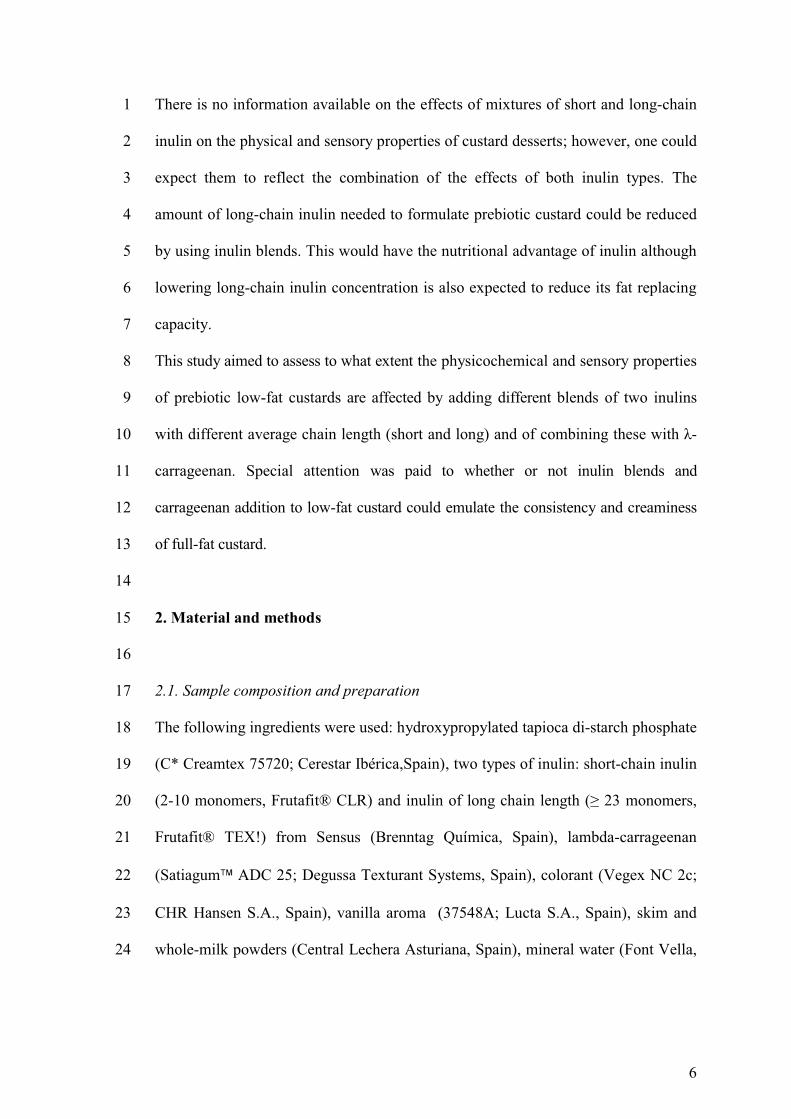
There is no information available on the effects of mixtures of short and long-chain 1
inulin on the physical and sensory properties of custard desserts; however, one could 2
expect them to reflect the combination of the effects of both inulin types. The 3
amount of long-chain inulin needed to formulate prebiotic custard could be reduced 4
by using inulin blends. This would have the nutritional advantage of inulin although 5
lowering long-chain inulin concentration is also expected to reduce its fat replacing 6
capacity. 7
This study aimed to assess to what extent the physicochemical and sensory properties 8
of prebiotic low-fat custards are affected by adding different blends of two inulins 9
with different average chain length (short and long) and of combining these -10
carrageenan. Special attention was paid to whether or not inulin blends and 11
carrageenan addition to low-fat custard could emulate the consistency and creaminess 12
of full-fat custard. 13
14
2. Material and methods 15
16
2.1. Sample composition and preparation 17
The following ingredients were used: hydroxypropylated tapioca di-starch phosphate 18
(C* Creamtex 75720; Cerestar Ibérica,Spain), two types of inulin: short-chain inulin 19
(2-10 monomers, Frutafit® CLR20
Frutafit® TEX!) from Sensus (Brenntag Química, Spain), lambda-carrageenan 21
(Satiagum ADC 25; Degussa Texturant Systems, Spain), colorant (Vegex NC 2c; 22
CHR Hansen S.A., Spain), vanilla aroma (37548A; Lucta S.A., Spain), skim and 23
whole-milk powders (Central Lechera Asturiana, Spain), mineral water (Font Vella, 24

7
Spain) and commercial sucrose. Starch moisture content was determined with a 1
LJ16 moisture analyzer (Mettler Toledo GmbHB, Greifensee, Switzerland). 2
Three blends of long-chain inulin (TEX) and short-chain inulin (CLR) that differed 3
in the TEX:CLR ratio (25:75, 50:50 and 75:25), were added to the samples at a 4
concentration of 7.5 g/100g of custard. Two sets of samples were prepared either 5
with or without lambda carrageenan (0.01 g/100g). All samples included fixed 6
amounts of starch (3.75 g/100g,), skimmed milk (80 g/100g,), sucrose (6 g/100g,), 7
colorant (0.052 g/100g,) and vanilla aroma (0.016 g/100g,). A sample with whole 8
milk and one with skimmed milk were prepared without inulin and without 9
carrageenan as control full-fat and low-fat samples, respectively. Both skim milk 10
(0.14 g fat /100g) and whole milk (3.5 g fat/100g) were prepared 24h in advance by 11
dissolving milk powder (13.5 g/100g) in mineral water and storing under 12
refrigeration (4±1ºC). 13
Samples were prepared in batches of 800g. All ingredients were weighed in a flask 14
and mixed under magnetic stirring for 10 min. The flask was placed in a water bath 15
at 97 1ºC and stirred constantly with a propeller stirrer. After 10 min the product 16
temperature reached 85 1ºC and heating was maintained at this temperature for 15 17
min. After the heating process, the evaporated water was replaced gravimetrically. 18
The sample was cooled in a water bath at 20ºC until it reached temperatures of about 19
40ºC and then the aroma was added. The sample was homogenized, transferred to a 20
closed flask and stored under refrigeration (4 1ºC) for 48 h. 21
2.2. Rheological measurements 22
23
All rheological measurements were carried out in a controlled stress rheometer 24
(RheoStress 1, Karslruhe, Germany), monitored by a Rheowin Projob Manager, 25
8
using a parallel-plates sensor system (6 cm diameter and 1mm gap). During 1
measurements temperature was kept constant at 10 ± 1ºC using a Phoenix P1 2
Circulator device (Thermo Haake). Two batches of each composition were prepared 3
and at least one measurement was performed on each batch. 4
Flow behaviour was measured by recording shear stress values when shearing the 5
samples at linearly increasing shear rates from 1 to 200 s-1 through 60 s and down in 6
reverse sequence for the same time (Tarrega, Duran, & Costell, 2004). To quantify 7
the time dependence of the flow, the thixotropic area was calculated. Data from the 8
ascending flow curve were fitted to the Ostwald-de Waele model ( = K n) where 9
K (Pa.sn) is the consistency index and n is the flow index. These calculations were 10
performed using the Rheowin Pro software (version 2.93, Haake). 11
Viscoelastic properties were measured using small amplitude oscillatory shear tests. 12
First, to determine the linear viscoelastic region, stress sweeps were run at 1 Hz. 13
After that, the frequency sweeps were performed over the range f = 0.01-10 Hz and 14
15
angle (tan ) and the complex viscosity ( *), as a function of frequency, were 16
calculated using the Rheowin Pro software (version 2.93, Haake) (Tarrega, Duran, & 17
Costell, 2005). 18
19
2.3. Sensory evaluation 20
21
All sensory tests were carried out in the morning in a standardised test room (ISO, 22
2007). Samples (30 ml) were served in white plastic cups coded with three digits 23
random numbers. Mineral water was provided for mouth-rinsing. Data acquisition 24
was performed using Compusense Five v.4.6 software (Compusense Inc. Guelph, 25
9
Canada). Sensory tests were carried out by a group of 42-44 assessors, with previous 1
experience on sensory analysis of dairy products, and selected according to their 2
taste sensitivity and their capacity to detect differences in intensities of the 3
considered attributes (ISO, 1993). 4
Ranking tests. Ranking tests (ISO, 2006) were used to study the effects of adding 5
inulin blends, and their combination with carrageenan, on the sensory properties of 6
two different sets of four samples of low-fat dairy desserts. For each set of samples, 7
assessors were asked to rank the four low-fat samples according to thickness, 8
creaminess, sweetness and vanilla flavour intensity and also according to preference. 9
The first set included the three samples containing the different inulin blends (25:75, 10
50:50 and 75:25, TEX:CLR) and the control low-fat sample (without inulin and 11
without carrageenan). The second set included the three samples containing lambda 12
carrageenan (0.01g/100g) and each of the inulin blends (25:75, 50:50 and 75:25, 13
TEX:CLR) and the control low-fat sample (without inulin and without carrageenan). 14
Paired comparison tests. The effect of replacing fat with inulin and carrageenan on 15
sensory characteristics was evaluated by comparing three selected formulations of 16
low-fat dairy dessert with the control full-fat dairy dessert. Paired comparison tests 17
(ISO, 2005) were performed to evaluate the differences in thickness, creaminess, 18
sweetness, vanilla flavour and preference. In order to reduce the possible effect of 19
the serving order, an equal number of assessors received a different sample first for 20
each pair. 21
22
2.4. Data analysis 23
24
10
Two-way analysis of variance (ANOVA) with interaction was performed on the 1
rheological parameters to study the effects of both inulin blend and lambda 2
carrageenan addition. Principal Component Analysis (PCA) was applied to the 3
correlation matrix of the average values of the rheological parameters obtained for 4
low-fat samples and the control full-fat sample. Both analyses were performed using 5
the XLSTAT-Pro Version 2007 (Addinsoft, Paris, France). 6
Friedman Analysis of Variance was applied to the sensory data obtained in the 7
ranking tests, and significance of differences between samples were determined by 8
the Fisher test ( = 0.05), as modified for non-parametric data (Meilgaard, Civille, & 9
Carr, 1999). Paired comparisons tests were considered two-tailed and significant 10
Sensory data analysis was performed using 11
Compusense® five release 4.6 software (Compusense Inc., Guelph, Ontario, 12
Canada). 13
14
3. Results and Discussion 15
16
3.1. Effect of the addition of inulin blends and carrageenan on the rheological 17
properties of low-fat desserts. 18
19
Flow behaviour. Flow curves were obtained for custard samples and all of them 20
exhibited shear thinning and time-dependent flow behaviour which is in accordance 21
with previous studies (Tarrega et al., 2004; Doublier, & Durand, 2008). The flow 22
curves obtained for some of the samples are shown as an example in Figure 1. 23
Differences in the magnitude of the hysteresis loop were observed indicating 24
different degrees of time dependency in the samples flow. To quantify it, thixotropic 25
11
area values were calculated (Table1). The ANOVA showed a significant interaction 1
between both carrageenan and inulin effects (Fint=26.96, p<0.001) indicating that the 2
effect of the different inulin blends on thixotropy depended on the presence of 3
carrageenan. In samples without carrageenan the thixotropic area did not 4
significantly vary when any of the mixtures were added, while for the samples with 5
carrageenan (0.01 g/100g), adding the inulin blends gave rise to an increase in the 6
value of the thixotropic area, which was similar for all three blend types. 7
Experimental data of the upward flow curve were fitted to Ostwald de Waele model 8
(0.973 R2 0.999). The flow of all samples was clearly pseudoplastic, showing 9
flow indices (n) in the range between 0.24 and 0.47 (Table 1). The consistency index 10
value (K) ranged from 6.3 Pa.sn for the low-fat control sample (without carrageenan 11
and without inulin) to 30.1 Pa.sn for the sample with carrageenan and the inulin 12
blend 25:75 TEX:CLR. ANOVA results showed that the inulin-carrageenan 13
interaction was significant for K values (Fint=15.73, p=0.001) and for n values 14
(Fint=13.00, p=0.002). For samples without carrageenan, the increase in consistency 15
and pseudoplasticity depended on the type of inulin blend. The increase in 16
consistency was only significant for the sample with the highest amount of long-17
chain inulin (75:25 TEX:CLR) while pseudoplasticity increased (n values 18
decreased) according the amount of long-chain inulin in the blend (Table 1). For 19
samples with carrageenan, inulin addition caused a significant increase in both 20
consistency and pseudoplasticity values with no differences among the three inulin 21
blends. 22
23
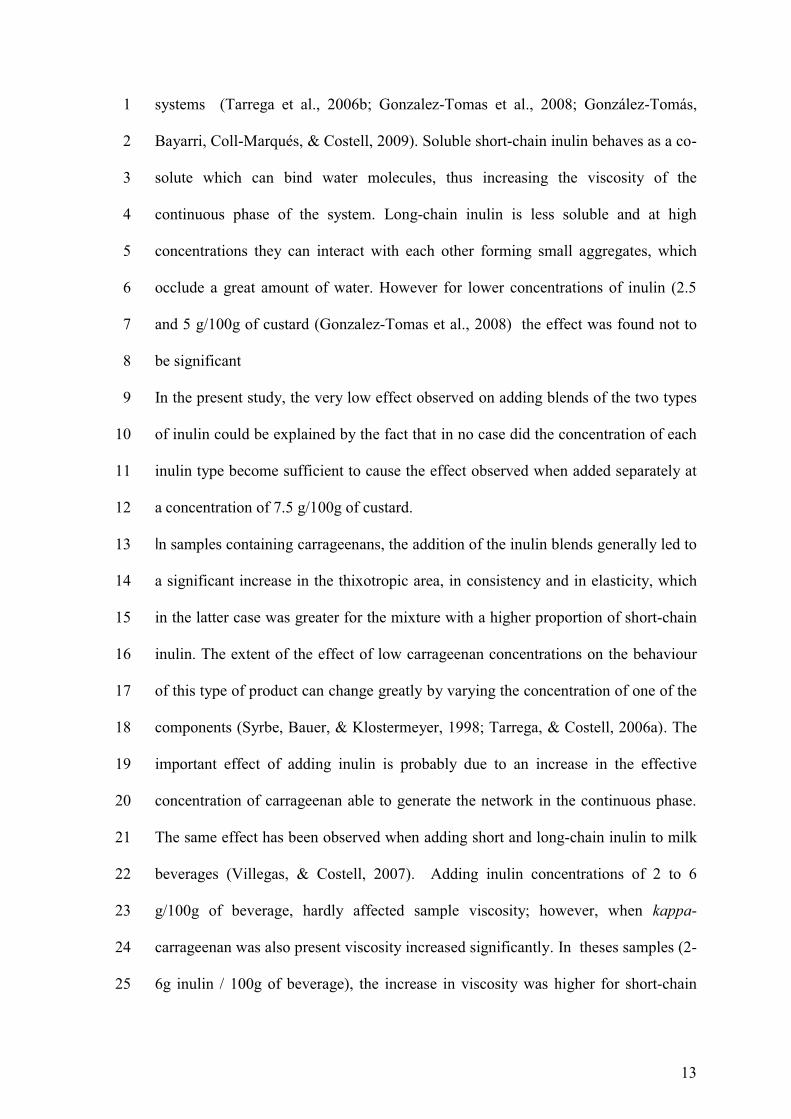
Viscoelastic properties. Mechanical spectra were obtained or each of the studied 24
samples. Figure 2 shows, for example, those obtained for some samples. In general, 25

12
mechanical spectra were typica1
both being quite frequency-dependent. The sample having the weakest structure was 2
while 3
the samples with carrageenan (0.01g / 100g of Custard) gave mechanical spectra 4
-dependent, indicating a 5
stronger gel structure. To compare the viscoelastic properties of skimmed-milk 6
samples, the values tan at 1 Hz were considered. For 7
the storage modulus G´, ANOVA revealed a significant interaction between inulin 8
and carrageenan (Fint=5.83, p=0.021). Inulin addition caused a significant increase in 9
, the increase being higher for blends 10
with a higher proportion of short-chain inulin (25:75 TEX:CLR). In the samples 11
were observed among 12
samples (Table 2). Loss modulus values were only significantly affected by the 13
presence of carrageenan (F=90.7, p<0.001) but the effect of inulin addition was not 14
significant (F=2.07, p=0.18). The values of tan decreased with inulin addition 15
(F=10.54, p=0.004) with no significant differences among the three inulin blends 16
(Table 2). 17
Rheological results show that for both flow behaviour and visco-elasticity the effect 18
of mixtures of short-chain and long-chain inulin depended on the presence of 19
carrageenan in the sample. In the absence of carrageenans, the addition of inulin 20
blends hardly affected values of most rheological parameters of the samples except 21
those recorded for the flow-index and tan , which decreased. Previous studies have 22
found that the addition of short-chain inulin and especially long-chain inulin at a 23
concentration of 6 and 7.5g/100g to custard desserts can significantly change their 24
rheological behaviour by increasing the consistency, viscosity and elasticity of 25
13
systems (Tarrega et al., 2006b; Gonzalez-Tomas et al., 2008; González-Tomás, 1
Bayarri, Coll-Marqués, & Costell, 2009). Soluble short-chain inulin behaves as a co-2
solute which can bind water molecules, thus increasing the viscosity of the 3
continuous phase of the system. Long-chain inulin is less soluble and at high 4
concentrations they can interact with each other forming small aggregates, which 5
occlude a great amount of water. However for lower concentrations of inulin (2.5 6
and 5 g/100g of custard (Gonzalez-Tomas et al., 2008) the effect was found not to 7
be significant 8
In the present study, the very low effect observed on adding blends of the two types 9
of inulin could be explained by the fact that in no case did the concentration of each 10
inulin type become sufficient to cause the effect observed when added separately at 11
a concentration of 7.5 g/100g of custard. 12
In samples containing carrageenans, the addition of the inulin blends generally led to 13
a significant increase in the thixotropic area, in consistency and in elasticity, which 14
in the latter case was greater for the mixture with a higher proportion of short-chain 15
inulin. The extent of the effect of low carrageenan concentrations on the behaviour 16
of this type of product can change greatly by varying the concentration of one of the 17
components (Syrbe, Bauer, & Klostermeyer, 1998; Tarrega, & Costell, 2006a). The 18
important effect of adding inulin is probably due to an increase in the effective 19
concentration of carrageenan able to generate the network in the continuous phase. 20
The same effect has been observed when adding short and long-chain inulin to milk 21
beverages (Villegas, & Costell, 2007). Adding inulin concentrations of 2 to 6 22
g/100g of beverage, hardly affected sample viscosity; however, when kappa-23
carrageenan was also present viscosity increased significantly. In theses samples (2-24
6g inulin / 100g of beverage), the increase in viscosity was higher for short-chain 25

14
inulin than for long-chain inulin which is in accordance with the more elastic trait 1
observed in our case for the custard containing the blend with highest amount of 2
short-chain inulin. That can be due to the fact that although both types of inulin 3
retain water, in the case of long chain inulin, the aggregates may disrupt the 4
carrageenan-casein network and in the case of short chain inulin, it remains 5
solubilised and does not affect the network. 6
7
3.2. Effect of adding inulin blends and carrageenan on sensory properties of low-fat 8
desserts 9
10
First, the effects of adding different inulin blends on the sensory properties of low-11
fat custards were studied. Friedman analysis of ranking data showed that assessors 12
perceived significant differences in the intensity of sweetness, vanilla flavour, 13
thickness and preference among samples (F values were 51.5, 15.0, 20.2 and 11.5, 14
respectively; theoretical F value being 7.81 for . In general, inulin addition 15
increased both sweetness and vanilla intensity, with this effect being more 16
remarkable in the case of samples with higher amounts of short-chain inulin (25:75 17
y 50:50 TEX:CLR) (Figure 3). These two samples also proved significantly thicker 18
than low-fat control sample and, although the effect of inulin on creaminess was not 19
significant (F=7.3 p=0.064), the trend was that these two samples were also 20
perceived as creamier. In terms of preference, no significant differences were 21
observed among the three samples containing inulin; however, they were preferred 22
to the control sample. Secondly, the effects of adding carrageenans and inulin blends 23
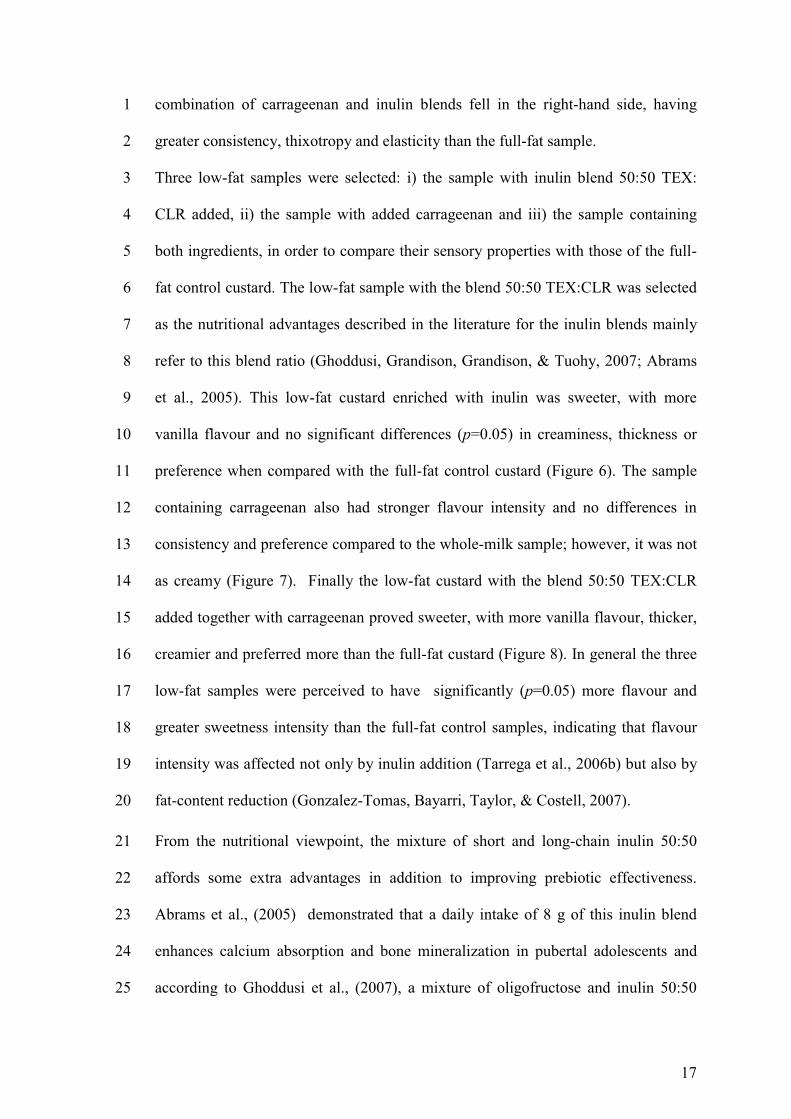
together on the sensory properties of low-fat custard were studied. In this case, the 24
samples revealed significant differences in all attributes evaluated (F values were 25

15
33.1, 14.0, 39.9, 47.2 and 10.4 for sweetness, vanilla flavour, creaminess, thickness 1
and preference respectively; theoretical F value being 7.81 for p=0.05). The joint 2
addition of carrageenans and inulin led to an increase in sweetness, vanilla flavour, 3
creaminess and consistency, which was greatest in samples containing inulin blends 4
25:75 and 50: 50 TEX:CLR (Figure 4). Likewise, these two samples were clearly 5
preferred to the control sample and the sample with the highest proportion of inulin 6
TEX. 7
Both in the case of adding inulin alone and adding inulin combined with 8
carrageenans, the sensory properties of the custard varied with the inulin blend 9
employed. In both cases and according to the differences perceived by assessors, the 10
blend with the same amount of the two inulins (50:50 TEX:CLR) and the blend 11
with a higher proportion of short-chain inulin (25:75 TEX:CLR) were those that 12
provided additional thickness, sweetness and vanilla flavour intensity to the vanilla 13
custard, while the effect was clearly lower or no significant for the mixture 14
containing a higher proportion of long-chain inulin. 15
16
3.3. Inulin and carrageenan as fat replacers in custards 17
18
As stated previously, one of the most interesting technological characteristics of 19
inulin and oligofructose is their ability to act as a fat replacer in dairy products 20
(Franck, 2002; Guven, Yasar, Karaca, & Hayaloglu, 2005; Koca, & Metin, 2004; 21
Schaller-Povolny, & Smith, 1999). In order to compare the rheological properties of 22
the different low-fat samples studied in this work with those of the control full-fat 23
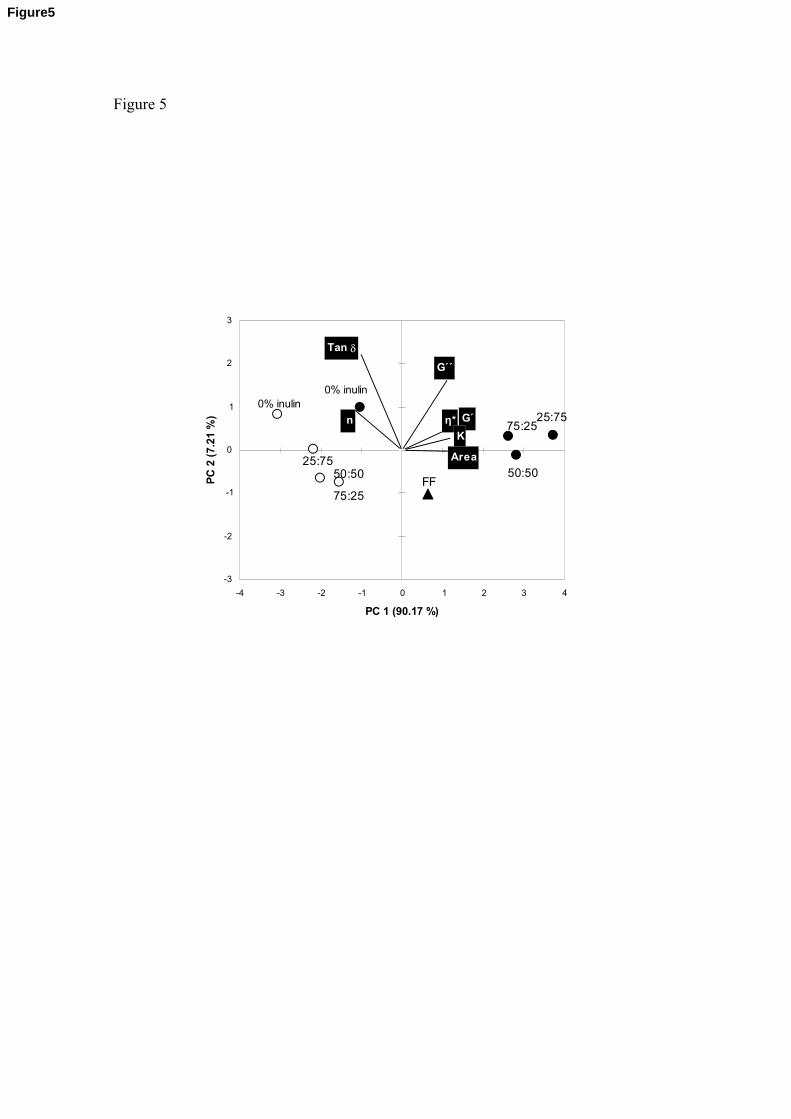
sample, the variability in all rheological parameters was studied by a PCA test. The 24
first two components (PC1 and PC2) accounted for 97.4% of the total variability 25

16
(Figure 5). PC1, accounting for 90.2 % of the total variability, was positively 1
correlated with thixotropic area, consistency index (K) and the elastic modulus . 2
PC2 accounted for 7.2 % of the variability and was mainly associated with two 3
parameters: tan and flow index (n). The low-fat control sample fell within in the 4
upper left-hand quadrant, showing the lowest values for 5
and the highest n and tan values. The full-fat control sample fell in the opposite 6
side (lower right-hand quadrant) indicating that the differences between the low-fat 7
control and the full-fat control samples affected parameters associated with the two 8
components. Fat presence caused an increase in values of thixotropic area9
but also decreased the values of parameters n and tan . In order to imitate the 10
rheological properties of fat, a fat replacer should have the same effects on the low-11
fat sample. 12
Position of samples containing inulin indicated that inulin addition mainly led to a 13
decrease in tan and n values which approximated those of the full-fat sample in the 14
PC plot but which was not enough to fully imitate its rheological behaviour. This is 15
in agreement with that observed by (Gonzalez-Tomas et al., 2008) when comparing 16
rheological behaviour of a full-fat dessert and low-fat desserts with different inulin 17
concentrations. The long-chain inulin used as fat replacer requires inulin addition at 18
concentrations over 7 g/100g of custard and in the present study all the samples 19
contained long-chain inulin at below 7 g/100g. The sample with added carrageenan 20
appeared displaced to the right side with respect to the control low fat sample 21
indicating that the main effect of carrageenan was an increase in consistency, 22
thixotropy and elasticity. Finally, the joint addition of inulin blends and carrageenan 23
caused both types of effect but to a greater extent than fat did. Samples containing a 24
17
combination of carrageenan and inulin blends fell in the right-hand side, having 1
greater consistency, thixotropy and elasticity than the full-fat sample. 2
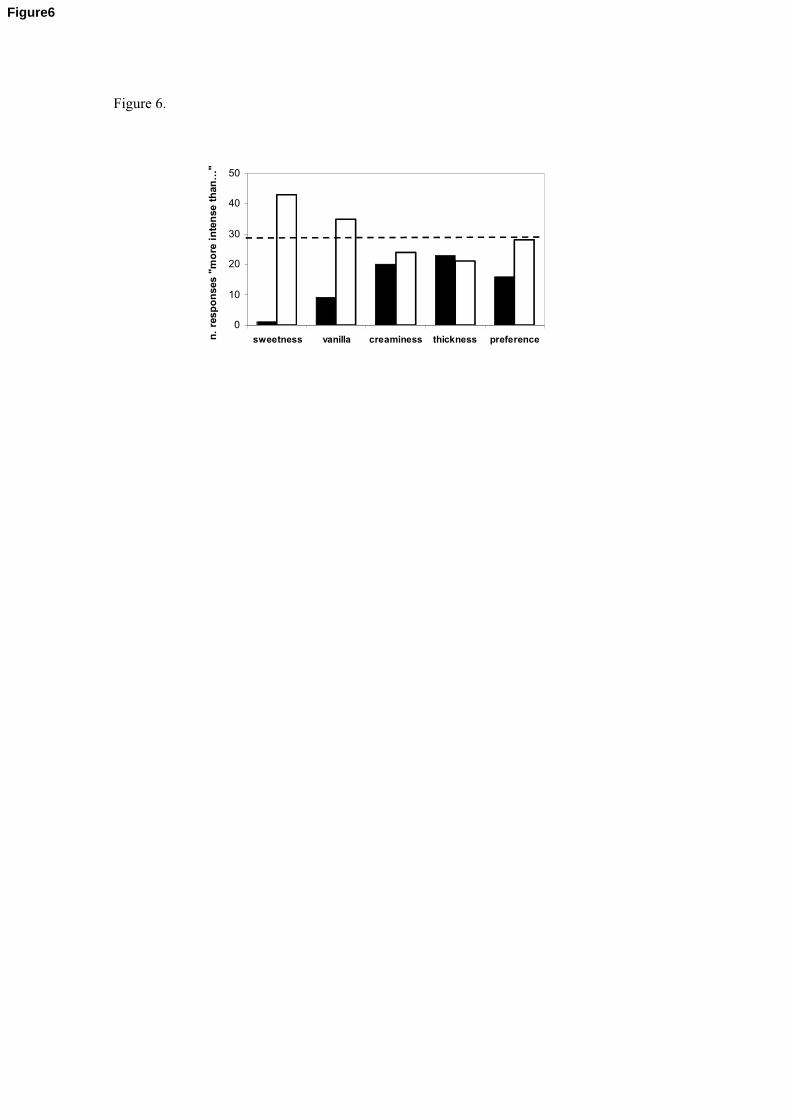
Three low-fat samples were selected: i) the sample with inulin blend 50:50 TEX: 3
CLR added, ii) the sample with added carrageenan and iii) the sample containing 4
both ingredients, in order to compare their sensory properties with those of the full-5
fat control custard. The low-fat sample with the blend 50:50 TEX:CLR was selected 6
as the nutritional advantages described in the literature for the inulin blends mainly 7
refer to this blend ratio (Ghoddusi, Grandison, Grandison, & Tuohy, 2007; Abrams 8
et al., 2005). This low-fat custard enriched with inulin was sweeter, with more 9
vanilla flavour and no significant differences (p=0.05) in creaminess, thickness or 10
preference when compared with the full-fat control custard (Figure 6). The sample 11
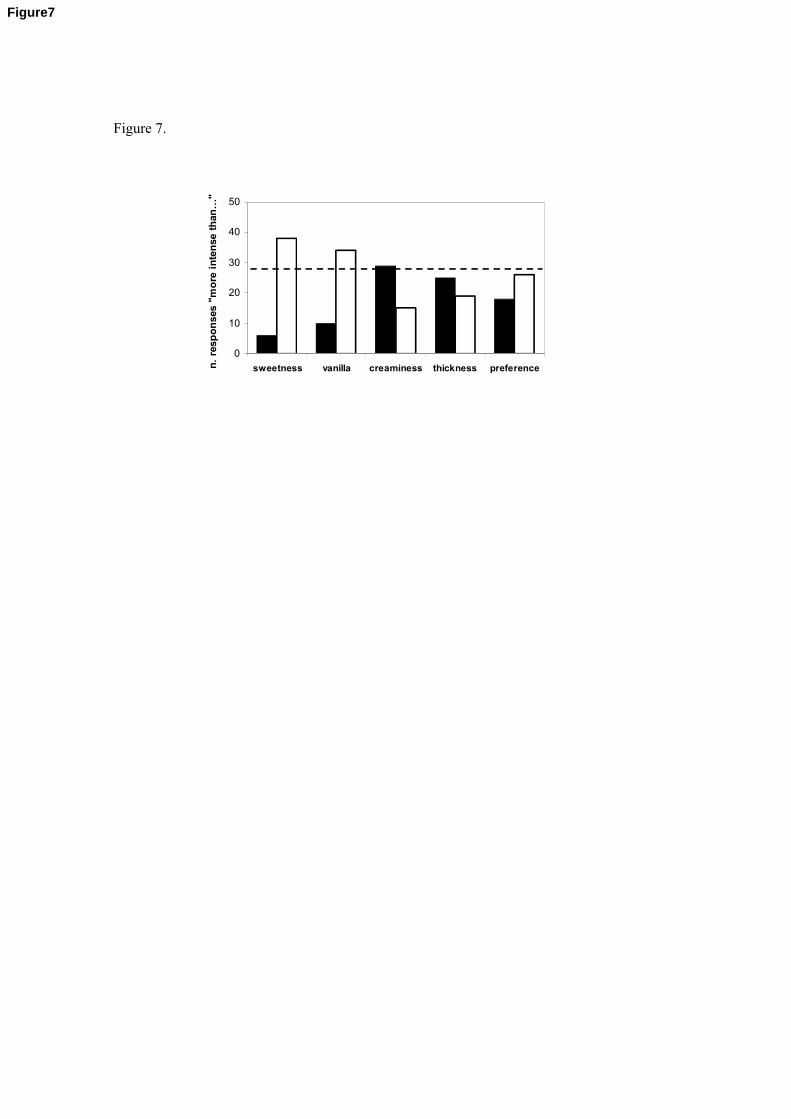
containing carrageenan also had stronger flavour intensity and no differences in 12
consistency and preference compared to the whole-milk sample; however, it was not 13
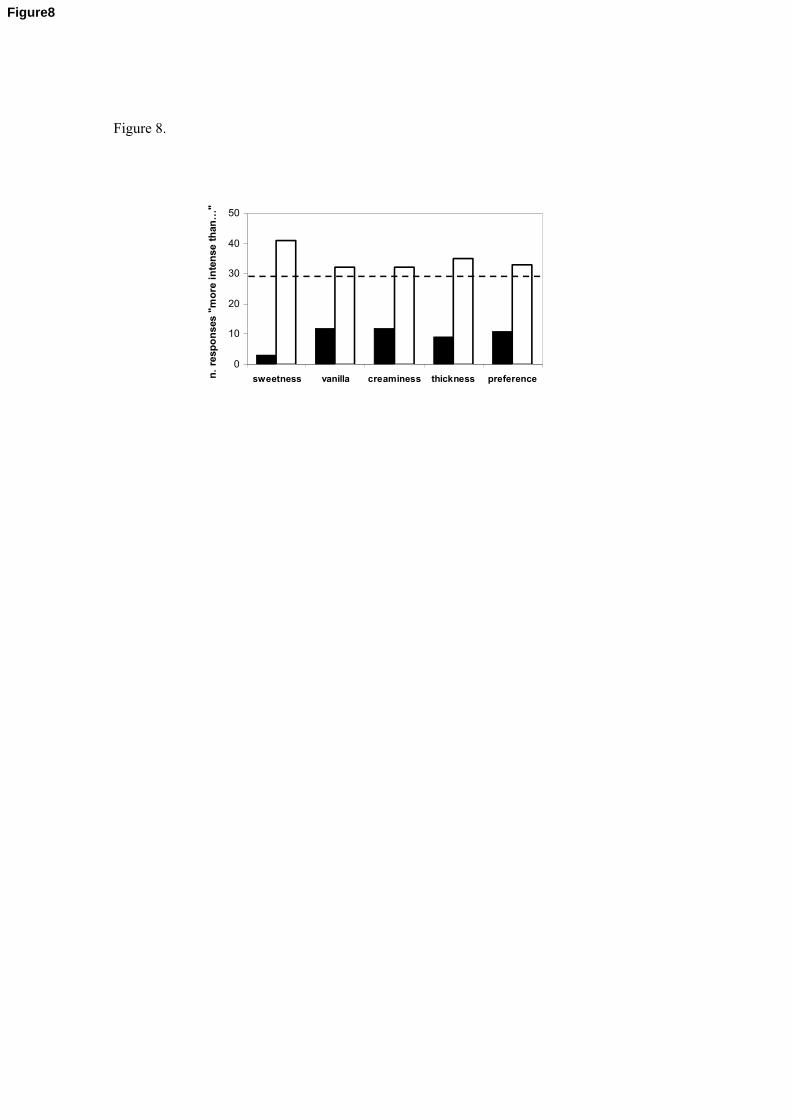
as creamy (Figure 7). Finally the low-fat custard with the blend 50:50 TEX:CLR 14
added together with carrageenan proved sweeter, with more vanilla flavour, thicker, 15
creamier and preferred more than the full-fat custard (Figure 8). In general the three 16
low-fat samples were perceived to have significantly (p=0.05) more flavour and 17
greater sweetness intensity than the full-fat control samples, indicating that flavour 18
intensity was affected not only by inulin addition (Tarrega et al., 2006b) but also by 19
fat-content reduction (Gonzalez-Tomas, Bayarri, Taylor, & Costell, 2007). 20
From the nutritional viewpoint, the mixture of short and long-chain inulin 50:50 21
affords some extra advantages in addition to improving prebiotic effectiveness. 22
Abrams et al., (2005) demonstrated that a daily intake of 8 g of this inulin blend 23
enhances calcium absorption and bone mineralization in pubertal adolescents and 24
according to Ghoddusi et al., (2007), a mixture of oligofructose and inulin 50:50 25

18
could prove effective in reducing the amount of gas produced while increasing or 1
maintaining their ability to support beneficial bacteria in the colon. Regarding the 2
technological properties, the mixture 50:50 long and short-chain inulin was found 3
the most appropriate to formulate a new petit suisse cheese with prebiotic and 4
probiotic properties because this combination improved both probiotic viable count 5
and acceptability most (Cardarelli, Buriti, Castro, & Saad, 2008). In the present 6
study adding this inulin blend (50:50, TEX:CLR) to low-fat custard proved 7
insufficient to completely emulate the rheological behaviour of full-fat custard, 8
while when combined with lambda carrageenan it exceeded the full-fat effect. 9
However, the sensorial results indicated that custard enriched with TEX:CLR inulin 10
blend 50:50 showed no significant differences in viscosity, creaminess and 11
acceptability with the full-fat custard and when this inulin blend was used combined 12
with carrageenan at 0.01 g/100g of product the custard was more viscous, creamier 13
and preferred over the whole-milk custard. 14
15
4. Conclusions 16
17
This study has shown that the effect of adding inulin blends (7.5 g/100g custard) on 18
the rheological properties of custard depends on the presence of carrageenan and 19
that only slight differences were observed among inulin blends. Sensory properties 20
did vary among the different inulin blends and in both cases (custards with and 21
without carrageenan) the 25:50 and 50:50 TEX:CLR inulin blends enhanced 22
product flavour intensity and thickness. The use of the 50:50 TEX:CLR blend, 23
which affords certain nutritional advantages, can also act as fat replacer. The results 24
of this study are of great interest in the development of prebiotic products which 25

19
maximize nutritional benefits and sensory characteristics to meet consumer 1
demands. 2
3
4
Acknowledgments 5
6
To MICINN of Spain for financial support (Project AGL 2007-63444). To CHR 7
Hansen S.A., Lucta S.A., Brentag Química, Degussa Texturant Systems and Central 8
Lechera Asturiana for providing free samples of the ingredients. 9
10
References 11
12
Abrams S. A., Griffin I. J., Hawthorne K. M., Liang L., Gunn S. K., Darlington G., 13
& Ellis K. J. (2005). A combination of prebiotic short- and long-chain inulin-type 14
fructans enhances calcium absorption and bone mineralization in young adolescents. 15
American Journal of Clinical Nutrition, 82, 471-476. 16
Bot A., Erle U., Vreeker R., & Agterof W. G. M. (2004). Influence of crystallisation 17
conditions on the large deformation rheology of inulin gels. Food Hydrocolloids, 18, 18
547-556. 19
Cardarelli H. R., Buriti F. C. A., Castro I. A., & Saad S. M. I. (2008). Inulin and 20
oligofructose improve sensory quality and increase the probiotic viable count in 21
potentially synbiotic petit-suisse cheese. Lwt-Food Science and Technology, 41, 22
1037-1046. 23
Coudray C., Tressol J. C., Gueux E., & Rayssiguier Y. (2003). Effects of inulin-type 24
fructans of different chain length and type of branching on intestinal absorption and 25

20
balance of calcium and magnesium in rats. European Journal of Nutrition, 42, 91-1
98. 2
Doublier J. L., & Durand S. (2008). A rheological characterization of semi-solid 3
dairy systems. Food Chemistry, 108, 1169-1175. 4
El-Nagar, G., Clowes, G., Tudoric, C. M., Kuri, V., & Brennan, C. S. (2002). 5
Rheological quality and stability of yog-ice cream with added inulin. International 6
Journal of Dairy Technology, 55, 89-93. 7
Franck A. (2002). Technological functionality of inulin and oligofructose. British 8
Journal of Nutrition, 87, S287-S291. 9
Ghoddusi H. B., Grandison M. A., Grandison A. S., & Tuohy K. M. (2007). In vitro 10
study on gas generation and prebiotic effects of some carbohydrates and their 11
mixtures. Anaerobe, 13, 193-199. 12
González-Tomás L., Bayarri S., Coll-Marqués J., & Costell E. (2009). Flow 13
behaviour of inulin-enriched dairy desserts: influence of inulin average chain length. 14
International Journal of Food Science and Technology, 44, 1214 1222. 15
González-Tomás L., Bayarri S., & Costell E. Inulin-Enriched Dairy Desserts: 16
Physicochemical and Sensory Aspects. Journal of Dairy Science, 92, 4188-4199. 17
Gonzalez-Tomas, L., Bayarri, S., Taylor, A. J., & Costell, E. (2007). Flavour release 18
and perception from model dairy custards. Food Research International, 40, 520-19
528. 20
González-Tomás L., Coll-Marqués J., & Costell E. (2008). Viscoelasticity of inulin-21
starch-based dairy systems. Influence of inulin average chain length. Food 22
Hydrocolloids, 22, 1372-1380. 23

21
Guven M., Yasar K., Karaca O. B., & Hayaloglu A. A. (2005). The effect of inulin 1
as a fat replacer on the quality of set-type low-fat yogurt manufacture. International 2
Journal of Dairy Technology, 58, 180-184. 3
ISO (2005). Sensory analysis. General guidance for the selection, training and 4
monitoring of assessors. Part 1: Selected assessors. Standard No. 8586. International 5
Organization for Standardization, Geneva, Switzerland. 6
ISO (2005). Sensory Analysis. Methodology. Paired comparison test. Standard No. 7
5495. International Organization for Standarization, Geneva, Switzerland. 8
ISO (2006). Sensory Analysis. Methodology. Ranking. Standard No. 8587. 9
International Organization for Standardization, Geneva, Switzerland. 10
ISO (2007). General guidance for the design of test room. Standard No 8589:2007. 11
International Organization for Standardization, Geneva, Switzerland. 12
Kip P., Meyer D., & Jellema R. H. (2006). Inulins improve sensoric and textural 13
properties of low-fat yoghurts. International Dairy Journal, 16, 1098-1103. 14
Koca N., & Metin M. (2004). Textural, melting and sensory properties of low-fat 15
fresh kashar cheeses produced by using fat replacers. International Dairy Journal, 16
14, 365-373. 17
Meilgaard, M., Civille, G. V. & Carr, B. T. (1999). Sensory Evaluation Techniques. 18
3rd ed. Boca Raton: CRC Press. 19
Paseephol T., Small D. M., & Sherkat F. (2008). Rheology and texture of set yogurt 20
as affected by inulin addition. Journal of Texture Studies, 39, 617-634. 21
Roberfroid M. B. (2007). Inulin-type fructans: functional food ingredients. Journal 22
of Nutrition, 137, 2493S-2502S. 23

22
Schaller-Povolny L. A., & Smith D. E. (1999). Sensory attributes and storage life of 1
reduced fat ice cream as related to inulin content. Journal of Food Science, 64, 555-2
559. 3
Stewart M. L., Timm D. A., & Slavin J. L. (2008). Fructooligosaccharides exhibit 4
more rapid fermentation than long-chain inulin in an in vitro fermentation system. 5
Nutrition Research, 28, 329-334. 6
Syrbe A., Bauer W. J., & Klostermeyer N. (1998). Polymer science concepts in 7
dairy systems - An overview of milk protein and food hydrocolloid interaction. 8
International Dairy Journal, 8, 179-193. 9
Tarrega A., & Costell E. (2006a). Effect of inulin addition on rheological and 10
sensory properties of fat-free starch-based dairy desserts. International Dairy 11
Journal, 16, 1104-1112. 12
Tarrega A., & Costell E. (2006b). Effect of composition on the rheological 13
behaviour and sensory properties of semisolid dairy dessert. Food Hydrocolloids, 14
20, 914-922. 15
Tarrega A., Duran L., & Costell E. (2004). Flow behaviour of semi-solid dairy 16
desserts. Effect of temperature. International Dairy Journal, 14, 345-353. 17
Villegas B., & Costell E. (2007). Flow behaviour of inulin-milk beverages. 18
Influence of inulin average chain length and of milk fat content. International Dairy 19
Journal, 17, 776-781. 20
Villegas B., Tárrega A., Carbonell I., & Costell E. (2009). Optimising acceptability 21
of new prebiotic low-fat milk beverages. Food Quality and Preference, in press 22
(doi:10.1016/j.foodqual.2009.03.001). 23
Wada T., Sugatani J. N., Terada E., Ohguchi M., & Miwa M. (2005). 24
Physicochemical characterization and biological effects of inulin enzymatically 25

23
synthesized from sucrose. Journal of Agricultural and Food Chemistry, 53, 1246-1
1253. 2
3
4
5
6
FIGURE CAPTIONS 7 8
9 Figure 1. Flow curves obtained for low fat custards. Control low fat sample ( ) and 10 samples enriched with the inulin blend 75:25 TEX:CLR (7.5 g/100g) ( ), with 11 lambda carrageenan (0.01 g/100g) ( ) and with the combination of both 12 ingredients( ). 13 14 Figure 2. Mechanical spectra obtained for low fat custards. Control low fat sample 15 ( ) and samples enriched with the inulin blend 75:25 TEX:CLR (7.5 g/100g) ( ), 16 with lambda carrageenan (0.01 g/100g) ( ) and with the combination of both 17 ingredients ( ). 18 19 Figure 3. Sensory evaluation of differences among the control low fat custard ( ) 20 and custards with different blends of TEX and CLR inulin: 25:75 ( ), 50:50 ( ) 21 and 75:25 ( ).Different letters on top of bars means significant differences (p=0.05). 22 23 Figure 4. Sensory evaluation of differences among the control low fat custard ( ) 24 and custards containing carrageenan combined with different blends of TEX and CLR 25 inulin: 25:75 ( ), 50:50 ( ) and 75:25 ( ). Different letters on top of bars 26 means significant differences (p=0.05). 27 28 Figure 5. Principal component analysis plot for rheological parameters of low fat 29 custards enriched with blend of TEX:CLR inulin and elaborated without ( ) or with 30 lambda carrageenan ( ). Control full fat sample (FF, ). 31 32 Figure 6. Sensory evaluation of the differences between the low fat custard with the 33 blend of inulin TEX:CLR 50:50 ( ) and the control full fat custard ( ). The 34 line indicates the minimum value of responses for which the difference is significant 35 (p=0.05). 36 37 Figure 7. Sensory evaluation of the differences between the low fat custard with 38 carrageenan ( ) and the control full fat custard ( ). The line indicates the 39 minimum value of responses for which the difference is significant (p=0.05). 40 41 Figure 8. Sensory evaluation of the differences between the low fat custard 42 containing carrageenan and the blend of inulin TEX:CLR 50:50 ( ) and the 43

24
control full fat custard ( ). The line indicates the minimum value of response for 1 which the difference is significant (p=0.05). 2 3
4

Table 1. Flow behaviour parameters for dairy desserts. Thixotropic Area (A), consistency index (K) and flow index (n) values.1,2,3
Carrageenan%
Inulin%
TEX:CLRRatio
A(Pa)
K(Pa.sn) n
0
0 - 814 a 6.3 a 0.47 e
7.5 25:75 797 a 7.2 ab 0.43 d
7.5 50:50 933 a 7.5 ab 0.41 cd
7.5 75:25 1200 a 11.6 b 0.33 b
0.01
0 - 1660 b 11.1 b 0.39 c
7.5 25:75 3840 c 30.1 c 0.24 a
7.5 50:50 3440 c 27.1 c 0.25 a
7.5 75:25 3550 c 29.5 c 0.25 a
1 K and n values were obtained from Ostwald de Waele fit of flow curves (0.973 R2 0.999)2 For each column, different letter superscripts means significant differences3 Values for full fat control sample: Area= 3025 ± 63 Pa, K =18.6 ± 0.1 Pa.sn, n=0.29 ± 0.002
Table

Table 2. Storage modulus (G’), loss modulus (G’’), loss angle tangent (tan ) and complex viscosity ( ) values at 1 Hz for dairy desserts. 1,2,3
Carrageenan%
Inulin%
TEX:CLRRatio
G´(Pa)
G´´(Pa) (Pa.sn) tan
0
0 - 14.8 a 10.8 a 2.9 a 0.73 d
7.5 25:75 20.3 a 11.2 a 3.7 a 0.58 bc
7.5 50:50 20.0 a 10.0 a 3.6 a 0.51 bc
7.5 75:25 21.8 a 10.8 a 3.9 a 0.50 bc
0.01
0 - 24.2 a 15.5 b 4.6 a 0.64 cd
7.5 25:75 54.9 c 20.2 c 9.3 b 0.37 a
7.5 50:50 47.9 bc 17.8 bc 8.1 b 0.37 a
7.5 75:25 43.9 b 18.4 bc 7.5 b 0.44 ab
1 For each column,2 Values for full fat control sample: G’ = 30.1 ± 1.5 Pa, G’’ =12.7 ± 0.6 Pa, *= 5.2 ± 0.3 Pa, tan = 0.42 ± 0.001

0
25
50
75
100
125
0 50 100 150 200
Shear rate (s-1)
Shea
rStr
ess
(Pa)
Figure 1.
Figure1
Figure 2.
1
10
100
0.01 0.1 1 10
G',
G"
(Pa)
Frequency (Pa)
Figure 2

Figure 3.
0
40
80
120
160
200
sweetness vanilla creaminess thickness preference
Ran
ksu
m
c
a
bc
a abbc
c
ba
bcb
a a aa
Figure3
Figure 4.
0
40
80
120
160
200
sweetness vanilla creaminess thickness preference
Ran
ksu
m
c
a ab
bb
aa
ab
b
a a a
c
a ab
ba a
b
Figure4
FF
75:25
50:50
25:75
0% inulin
75:25
50:5025:75
0% inulin
Tan dG´´
G´n K
Area
-3
-2
-1
0
1
2
3
-4 -3 -2 -1 0 1 2 3 4
PC 1 (90.17 %)
PC2
(7.2
1%
)
Figure 5
Figure5
0
10
20
30
40
50
sweetness vanilla creaminess thickness preferencen.re
spon
ses
"mor
ein
tens
eth
an…
"
Figure 6.
Figure6
0
10
20
30
40
50
sweetness vanilla creaminess thickness preferencen.re
spon
ses
"mor
ein
tens
eth
an…
"
Figure 7.
Figure7
0
10
20
30
40
50
sweetness vanilla creaminess thickness preferencen.re
spon
ses
"mor
ein
tens
eth
an…
"
Figure 8.
Figure8