Effect of Axial Agitator Configuration (Up-Pumping, Down ... · Effect of Axial Agitator...
24
Effect of Axial Agitator Configuration (Up-Pumping, Down-Pumping, Reverse Rotation) on Flow Patterns Generated in Stirred Vessels J. AUBIN, P. MAVROS, D.F. FLETCHER, J. BERTRAND AND C. XUEREB* Aubin J., Mavros P., Fletcher D.F., Xuereb C., and Bertrand J., ‘Effect of Axial Agitator Configuration (Up-pumping, Down-pumping, Reverse Rotation) on Flow Patterns Generated in Stirred Vessels’, ChERD Trans IChemE, 79, A8, 845-856, (2001).
Transcript of Effect of Axial Agitator Configuration (Up-Pumping, Down ... · Effect of Axial Agitator...
Effect of Axial Agitator Configuration (Up-Pumping, Down-Pumping,
Reverse Rotation) on Flow Patterns Generated in Stirred Vessels
J. AUBIN, P. MAVROS, D.F. FLETCHER, J. BERTRAND AND C. XUEREB*
Aubin J., Mavros P., Fletcher D.F., Xuereb C., and Bertrand J., ‘Effect of Axial Agitator
Configuration (Up-pumping, Down-pumping, Reverse Rotation) on Flow Patterns Generated
in Stirred Vessels’, ChERD Trans IChemE, 79, A8, 845-856, (2001).
ABSTRACT
Single phase turbulent flow in a tank stirred with two different axial impellers - a pitched blade turbine
(PBT) and a Mixel TT (MTT)- has been studied using Laser Doppler Velocimetry. The effect of the
agitator configuration, i.e. up-pumping, down-pumping and reverse rotation, on the turbulent flow field,
as well as power, circulation and pumping numbers has been investigated. An agitation index for each
configuration was also determined. In the down-pumping mode, the impellers induced one circulation
loop and the upper part of the tank was poorly mixed. When up-pumping, two circulation loops are
formed, the second in the upper vessel. The PBT pumping upwards was observed to have a lower flow
number and to consume more power than when down-pumping, however the agitation index and
circulation efficiencies were notably higher. The MTT has been shown to circulate liquid more efficiently
in the up-pumping configuration than in the other two modes. Only small effects of the MTT
configuration on the power number, flow number and pumping effectiveness have been observed.
Key-words: mixing, axial agitator, pitched blade turbine, Mixel TT, up-pumping, Laser Doppler Velocimetry
INTRODUCTION
Mechanically agitated vessels are widely used in the chemical, mineral and wastewater processing industries for
simple fluid mixing or even complex multiphase processes including gas-liquid and gas-liquid-solid mixing. In
such complex applications, the agitator has goals of circulation and homogenization, holding the gas within the
vessel for as long as possible, and /or suspending solids, promoting contact between gas, liquid and solid phases.
The study and understanding of the flow produced by agitators in such stirred vessels is very important as it
allows the performance of an agitator to be quantified and then, if necessary, optimized in order to achieve the
desired process results. In the early 1980s, it was proposed that inverting axial flow impellers and changing their
rotational direction giving an ‘up-pumping’ effect could be interesting for gas-liquid applications1,2
. Recently, it
has been shown that up-pumping axial hydrofoil impellers provide considerable advantages over the down-
pumping configuration3-5
and this has led to the manufacture of axial hydrofoils specifically designed for up-
pumping applications6-8
. Most of the recent studies on the up-pumping concept have concentrated mainly on
power characteristics and mixing times, and have shown that by applying up-pumping impellers to gas-liquid
systems torque and flow instabilities are reduced, flooding is less likely to occur and there is no loss in power
upon gassing9-11
.
Laser Doppler Velocimetry (LDV) is a successful experimental technique used for the study of flow
fields, having the advantage of being non-intrusive. By investigating the flow patterns produced by an impeller
and relating them to various global indices, such as the power number, pumping and circulation efficiencies, the
performance of the mechanically agitated vessel can be quantified and optimized. With respect to the study of
axial flow impellers, there have been a limited number of investigations using LDV to determine local
characteristics of velocity fields and turbulence, especially when the impellers are operated in the up-pumping
mode. Ranade and Joshi12
carried out a detailed LDV study on down-pumping pitched blade turbines,
investigating the influence of the impeller size and geometry on the flow patterns in the vessel. Mavros et al.13
used LDV to compare the flow fields of a radial flow turbine and two different down-pumping axial flow
impellers in both water and a non-Newtonian fluid. Evaluation of the performance of two commercial down-
flow impellers, the Chemineer HE3 (CHE3) and the Prochem Maxflo T (PMT), using LDV to detail the mean
and r.m.s. velocities was carried out by Jaworski et al.14
. A comparison of flow fields, as well as flow and
circulation characteristics, produced by an APV-B2 impeller in the down- and up-pumping modes were reported
by Mishra et al.15
. In the down-pumping configuration, the flow fields were similar to those reported by the other
workers mentioned above and it was observed that the liquid in the upper part of the vessel was poorly
circulated. It was shown that by operating the impeller in the up-pumping mode, two distinct circulation loops
were produced, one in the upper and one in the lower part of the vessel, and as a consequence the agitation in the
upper part of the tank was improved.
In the present work, single-phase flow patterns in a stirred vessel have been investigated using LDV in a
turbulent flow regime using two different axial impellers, a 6-bladed 45° pitched bladed turbine (PBT) and a
Mixel TT (MTT) (Mixel, France). Comparisons have been made of the flow fields produced when the impellers
are operated in the down- and up-pumping modes, and the reverse mode for the MTT. These velocity fields have
been assessed by examining the power consumption, circulation and pumping capacities of the impeller, the
agitation index, as well as spatial distributions of r.m.s velocities and turbulent kinetic energy. This investigation
has been carried out, not only to characterize impellers operating in the up-pumping mode, being different than
what has been previously published, but also to show the effects of the impeller configuration on flow fields and
mixing efficiency which can easily be altered by a simple retrofitting operation. The results presented here will
be used as a reference for future experimental gas-liquid mixing studies and for the validation of CFD models in
stirred tanks.
EXPERIMENTAL APPARATUS AND PROCEDURES
Time-averaged LDV measurements of radial, axial and tangential velocity components were performed in a
dished-bottom cylindrical vessel made of Perspex (T = 0.19 m). An aspect ratio of 1 was used, i.e. the liquid
height (H) in the vessel was equal to the tank diameter (T). The tank was equipped with four transparent baffles
made of Perspex (b = T/10), which were placed 90º from one another, flush against the vessel wall. The impeller
clearance was C = T/3, where C is defined as the distance from the vessel bottom to the lowest horizontal plane
swept by the impeller. The cylindrical vessel was placed inside a square tank, whose front panel was made of
Altuglas™ to allow distortion-free measurements; this tank was filled with water in order to minimize refraction
at the cylindrical surface of the inner vessel.
Two impellers were studied: a 6-blade 45° pitched blade turbine and a Mixel TT axial agitator (Mixel,
France). The impeller diameter was equal to D = T/2 in all cases and the agitator shaft (s = 0.008 m) extended to
the bottom of the vessel, where it fitted into a Teflon hub to avoid ‘wobbling’ of the impeller. The vessel was
filled with plain tap water and was seeded using a small amount of Iriodin 111 Rutile Fine Satin (Merck)
particles (dp=15 µm). The rotational speed of the agitator, N, was 5 Hz (= 300 rpm), which corresponded to a
Reynolds number of 45000. The description of the different operational modes of the impellers is as follows:
(a) Down-pumping mode: The impeller is operated in the classical manner, i.e. the impeller is rotated so that
blades push the fluid downwards.
(b) Reverse mode: The rotational direction of the impeller is reversed with the impeller remaining in a
downwards position.
(c) Up-pumping mode: The impeller is turned upside down and the direction of rotation is the reverse of the
down-pumping mode.
The LDV measurements were taken with a two-beam Dantec Fiberflow system, operating in back-
scattering mode, as shown in Figure 1. The light source is a 4 W Argon ion laser (Stabilite 2017 by Spectra
Physics) with a focal length of 600 mm and beam wavelengths of 514.5 nm (green) and 488 nm (blue). The
Doppler signal was transmitted to a 58N20 Flow Velocity Analyzer (Dantec) for signal processing and the
results were then collected on a computer.
Measurements were taken on a plane midway between two baffles. 5000 validated samples were taken
at each measuring point, with a maximum sampling time of 400 seconds. A seeding particle ‘residence time’
weighting was applied when calculating the mean velocity from the distribution in order to eliminate the bias
towards higher values caused by high velocity particles and their consequent short residence time within the
measuring volume.
The time-averaged velocity data obtained by LDV is used to determine the 2D radial-axial velocity
vector fields, and flow maps of the tangential and r.m.s velocities, as well as turbulent kinetic energy. Global
quantities are also calculated including the power number, the flow number and the circulation number and time,
as well as performance indices such as the circulation efficiency, the pumping efficiency and the agitation index.
Power Measurements
The power consumption, P, of each agitator configuration was determined by measuring the torque using the
integrated torque meter of a Labmaster mixer (Lightnin). Torque measurements were corrected for frictional
losses using measurements taken in an empty vessel.
Pumping and Circulation Flow Rates
The pumping flow rate or pumping capacity, QFl, corresponds to the fluid flow rate that passes through the
impeller swept volume16
. For reasons of practicality, this calculation is performed on a control volume, which
just encompasses the impeller swept volume, as shown by relation (1):
( ) ( ) ( )0 0
2 2
z r ro o o
Fl r z zr r z z z z
z
Q D v dz r v dr r v drπ π π++ ++ ++
++ ++ −−−− = = =
= + +∫ ∫ ∫ (1)
where z++
, z-- and r
++ are the boundaries of the impeller control volume and the superscript ‘o’ refers to the fluid
moving out of this volume. This expression takes into account both radial and axial pumping flow rates.
The discharge flow rate of the impeller may then be expressed as the dimensionless pumping number by
normalizing QFl by ND3:
3
FlQFl
ND= (2)
The circulation flow rate, Qc, in the tank is the total volumetric turnover rate occurring in the tank. It is
the sum of the discharged fluid flow and the flow entrained by the impeller16
. Assuming axial symmetry, the
absolute maximum values of the axial flow rate, Qz, in the vessel is equal to the total circulation flow rate14
. This
circulation flow rate may be evaluated by calculating the flow rate through a plane that passes through the centre
of the circulation loop with radial-axial coordinates (r*, z
*)
17.
( )Q Q r v drz c z z z
r
R
*
*
= ==∫ 2π (3)
where r* and z
* are the coordinates of the loop centre. In the presence of two circulation loops, the axial
circulation flow rate can be given by the sum of the flow rate entrained by the lower loop and that entrained by
the upper loop such that :
Q Q Qc c1 c2= + (4)
where
( )Q r v drc1 z z z
r
R
*1
*
==∫ 2π (5)
( )Q r v drc2 z z z
r
R
*2
*
==∫ 2π (6)
where the superfixes 1 and 2 differentiate the lower circulation loop and the upper circulation loop.
Normalizing the circulation flow rate by ND3, results in the dimensionless circulation flow rate number, Flc:
3
cc
QFl
ND= (7)
Using Fl, Flc and Po, two indices characterizing the effectiveness of an agitator can be described. The pumping
effectiveness, ηE, gives the pumping rate of the impeller per unit power consumption and is given by relation (8):
E
Fl
Poη = (8)
The second index is the circulation efficiency number, Ec, which indicates the impellers capacity to circulate the
liquid with respect to its power consumption. This relationship, defined by Jaworski et al.14
enables different
types and sizes of agitators to be compared in a turbulent flow regime, independent of impeller speed.
4c
c
Fl DE
Po T
=
(9)
Turbulent Kinetic Energy
Accurate estimation of the turbulent kinetic energy, kT, induced in a stirred tank requires the root mean square
velocities (velocity fluctuations) of the three velocity components:
( )2 2 21
2T r zk v v vθ′ ′ ′= + + (10)
This quantity is made dimensionless by dividing by the square of the impeller tip speed, 2tipV .
Agitation Index
Mavros and Baudou18
defined an agitation index, Ig, in order to determine the effectiveness of an impeller to
induce flow in a tank. Ig is calculated with the resultant mean velocity, vij, of the three time-averaged velocity
components at each measuring point in the vessel. It is supposed that the each resultant velocity corresponds to a
liquid volume Vij, surrounding the measuring point. The liquid volumes in the vessel are summed and a volume
weighted average velocity for the entire tank is obtained:
v
ˆV
ij iji j
iji j
Vv =∑ ∑∑ ∑
(11)
The volume-weighted velocity is then normalized by Vtip to give the agitation index, Ig:
[ ]ˆ100 %g
tip
vI
V= (12)
For further details on the definition and calculation of the agitation index, readers are referred to Mavros and
Baudou18
.
RESULTS AND DISCUSSION
Mean Velocity Fields and Flow Patterns
Down-Pumping
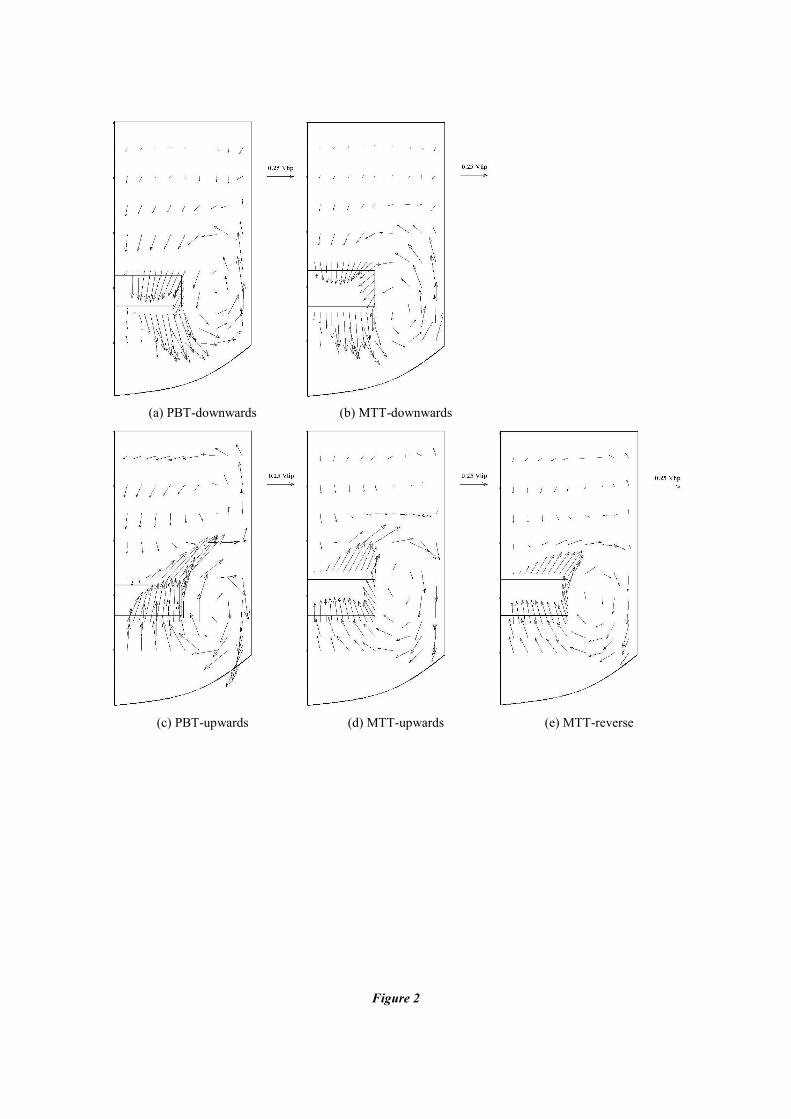
Vector plots of time-averaged velocity fields in the r-z plane at 45° to the baffle plane for the PBTD and the
MTTD are shown in Figures 2(a) and 2(b). These plots show that a circulation loop is formed in the lower part of
the vessel; in the upper part of the tank, liquid velocities are low, circulation is minimal and therefore mixing is
rather poor. These observations are characteristic of down-pumping axial agitators. In the outflow of the
impeller, the fluid is discharged axially for the most part – for the PBTD, a noticeable radial component exists in
this region which confirms the observations made be Ranade and Joshi12
. Once the down-flowing high speed jet
encounters the vessel bottom, the fluid moves along the bottom and then up the vessel wall. Due to low pressure
regions behind the impeller blades, most of the fluid is taken in at the top of the impeller-swept volume, with
some being drawn into the side. This causes the formation of a primary circulation loop. Little liquid movement
is observed in the upper part of the vessel for both impellers, although circulation for the PBTD-stirred tank
appears to be more significant. A third fluid zone exists in the vessel stirred by the PBTD, which is a conical
region of up-flowing liquid below the centre of the impeller. This observation has already been made for
pitched-blade turbines and also other axial impellers, including the Chemineer HE3 (CHE3), the Prochem
Maxflo T (PMT) and the APV-B212, 14, 15
.
Considering the axial velocity component for both impellers, the maximum down-flowing velocities
occur in the impeller discharge region and the maximum positive values of axial velocities are found close to the
vessel wall. The axial down-flow induced by the PBTD is approximately 10% greater than that induced by the
MTTD being 44% and 39% of Vtip respectively. For both agitators, the maximum up-flowing velocity is
approximately 22% less than the discharge flow at 36% and 30% of Vtip for the PBTD and MTTD. In the upper
part of the tank, axial velocities are small, with a value of about 2% of Vtip, flowing generally downwards. Such
low velocities in this region of the tank indicate quantitatively poor circulation and mixing. The cone-shaped up-
flow zone observed in the tank agitated by the PBTD has a maximum velocity of 7% of Vtip. This result
compares well with the work of Ranade and Joshi12
, who found a maximum velocity of 5% of Vtip in this region
for a PBTD.
The radial velocity component is high in the planes above and below the impeller. The liquid being
drawn in by the impeller (with a maximum radial velocity) is at 14% Vtip for the PBTD which is slightly lower
than 15% Vtip for the MTTD. However, the liquid discharged below the PBTD has a greater maximum velocity,
22% of Vtip, than the MTTD at 15% Vtip. Similar maximal discharge velocities have already been reported for a
PBTD (25% Vtip)12
, a PMT and a CHE3 (22% and 20% of Vtip, respectively)14
.
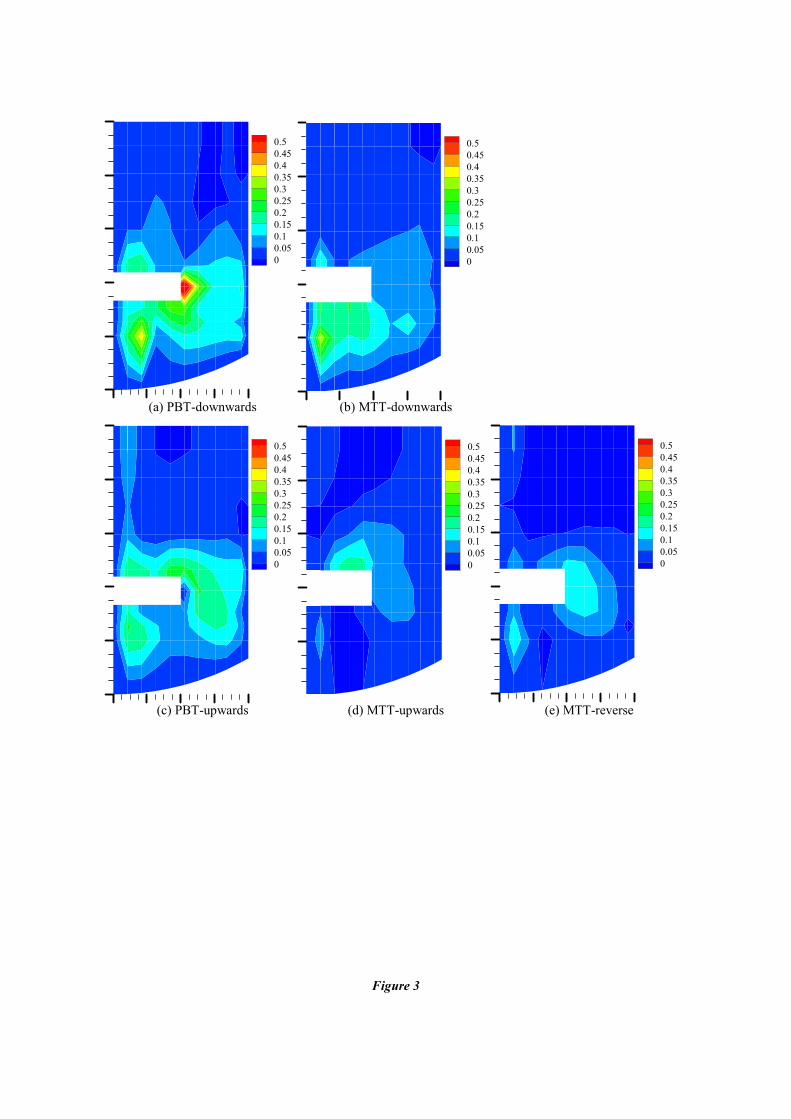
Contour maps for the tangential velocity component are presented in Figure 3. For both impellers,
maximum tangential velocities are very localized and in the rest of the vessel only small tangential velocities
exist. The PBTD induces a maximum tangential velocity at the tip of the impeller which is 63% of Vtip and the
MTTD produces the maximal tangential velocity below the centre of the agitator with a significantly lower value
of 32% Vtip. The latter is evidence of a small region of swirling liquid with minimal radial /axial movement. In
the upper part of the tank, a small zone of liquid close to the vessel wall is observed to rotate in the opposite
direction to the agitator rotation. Although this effect is slight (~1.7% % of Vtip for both the PBTD and the
MTTD), it has already been reported by Mavros et al.13
.
Up-pumping
Velocity vectors in the r-z plane for the impellers in the up-pumping configuration are shown in Figure 2.
Operation of the impellers in this mode induces two circulation loops, one in the upper part of the tank and one
in the lower part. These observations confirm previous works on up-pumping hydrofoil impellers and pitched
blade turbines15, 19
. The agitator generates a strong discharge flow into the upper part of the vessel that is
projected at approximately 45° towards the vessel wall. Due to this strong radial component, the liquid is
propelled towards the vessel wall where it either moves axially up to the liquid surface or down to the tank
bottom. In the lower half of the tank, the liquid is forced down the vessel wall and upon encountering the tank
base, its movement is redirected in an upwards direction and is drawn into the underside of the impeller swept
region. This circulation path forms the primary circulation loop.
For the MTTU, liquid is drawn in by the underside of the impeller as well as at the vertical side of the
impeller. Axial movement of the liquid close to the vessel in the upper region of the tank experiences a change in
direction due to the liquid surface. This gives rise to the secondary circulation loop with an ensuing downward
flow and induces fluid velocities in the upper region of the tank higher than those observed in the down-pumping
mode, and therefore the degree of circulation and mixing appears to be better. A third observation has been made
for the flow produced by the PBTU – a region of down-flowing liquid into the centre of the upper side of the
impeller exists, as seen also in the down-pumping configuration. Mishra et al.15
have reported similar flow
patterns for an up-pumping APV-B2 including the presence of two distinct circulation loops, as well as a small
down flowing region in the centre of the upper side of the impeller. It should be noted that the velocities induced
by the PBTU in the upper region of the vessel and at the bottom vessel corners appear greater than in the case of
the MTTU, indicating a stronger overall circulation for the PBTU.
For the two impellers, a strong axial flow of liquid moving upwards, into and out of the impeller-swept
volume is observed. High axial velocities are also noticed to be moving down the vessel wall in the lower half of
the tank. The fluid in the vessel agitated by the PBTU also exhibits high up-flowing velocities close to the vessel
wall in the upper part of the vessel, which are not observed with the MTTU. The PBTU induces considerably
higher axial velocities than the MTTU – maximums of 41% Vtip compared with 28% Vtip for up-flowing
velocities and 51% Vtip compared with 31% Vtip in the downwards direction. It is also observed that the
downward flowing velocities are stronger than those moving upwards in the case of both agitators. For the
PBTU, this effect is relatively important, as the maximum down-flowing axial velocity is ~25% greater than the
maximum velocity flow upwards.
For both up-pumping impellers, an important out-flowing radial movement is observed above the
impeller in the discharge zone, as well as two zones of high inward-flowing velocities, which are situated close
to the tank bottom and near the free liquid surface. In the impeller discharge, the maximum velocity for the
PBTU is at 37% of Vtip and for the MTTU it is at 23% of Vtip. Mishra et al.15
reported a maximum radial velocity
in the discharge region of the APV-B2 agitator of 33% of Vtip. The zones of highest in-flowing velocity are found
in the lower part of the vessel, the PBTU induces a maximum radial velocity of 23% of Vtip, whereas for the
MTTU this value is 15% of Vtip. These velocities below the impeller are greater than the ones found for the
APV-B2, which were reported to be less than 10% Vtip15
. In the upper vessel, these radial velocities are high, but
lower than those observed below the impeller, especially for the MTTU.
The maximum tangential velocity distributions in the up-pumping impeller configurations – Figures
3(c) and 3(d) – differ considerably from those of the down-pumping configurations. Here, the maximum
velocities are, for the most part, localized in the impeller discharge, and in the case of the PBTU a strong
tangential flow is also observed below the centre of the agitator. It should be noted, however, that these velocity
magnitudes are substantially lower for the up-pumping configuration, being 22% and 18% of Vtip for the PBTU
and MTTU respectively, when compared with the values measured for the down-pumping arrangement. Close to
the impeller shaft (in the upper part of the vessel for the PBTU and in the lower part for the MTTU) the liquid
moves in the direction of rotation at ~ 10% of Vtip. Like for the down-pumping mode, liquid is observed to rotate
in the reverse direction in the upper part of the vessel and also below the MTTU. For the PBTU, this reverse
rotation effect is of a similar magnitude to the down-pumping configuration (1.5% of Vtip). For the MTTU
however, the maximum reverse velocity is found to be 4.1% of Vtip in both the upper and lower regions of the
tank.
Reverse Mode
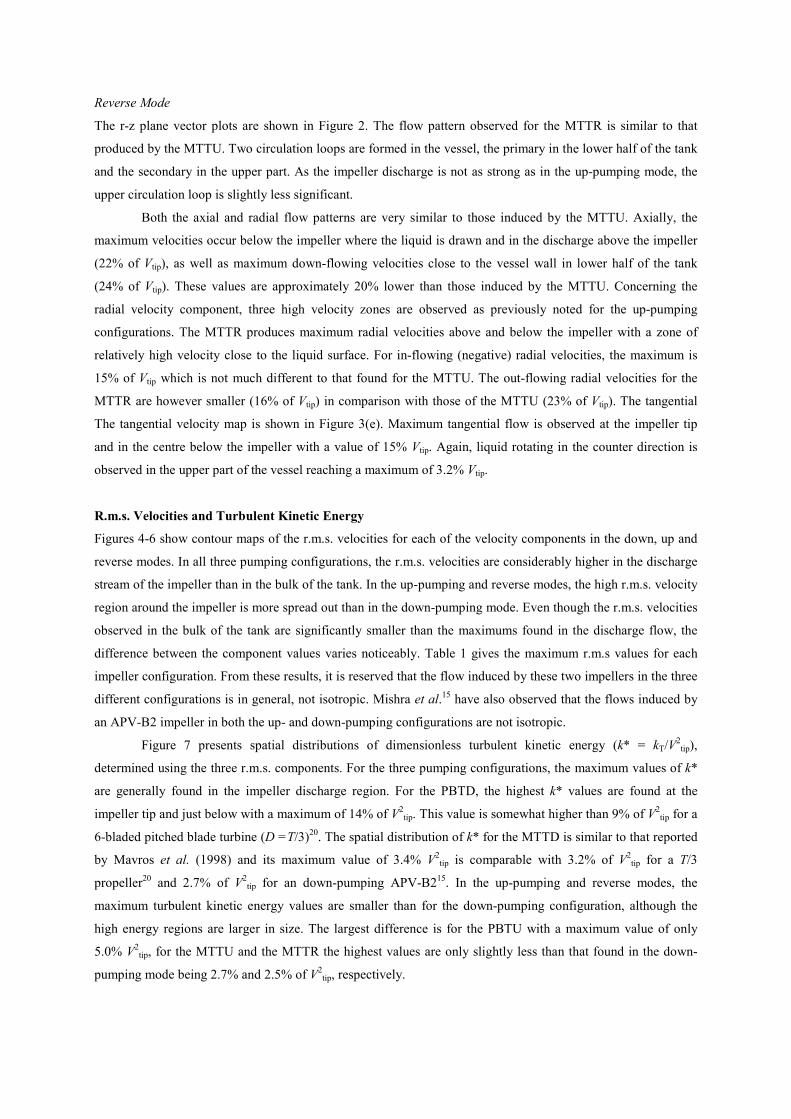
The r-z plane vector plots are shown in Figure 2. The flow pattern observed for the MTTR is similar to that
produced by the MTTU. Two circulation loops are formed in the vessel, the primary in the lower half of the tank
and the secondary in the upper part. As the impeller discharge is not as strong as in the up-pumping mode, the
upper circulation loop is slightly less significant.
Both the axial and radial flow patterns are very similar to those induced by the MTTU. Axially, the
maximum velocities occur below the impeller where the liquid is drawn and in the discharge above the impeller
(22% of Vtip), as well as maximum down-flowing velocities close to the vessel wall in lower half of the tank
(24% of Vtip). These values are approximately 20% lower than those induced by the MTTU. Concerning the
radial velocity component, three high velocity zones are observed as previously noted for the up-pumping
configurations. The MTTR produces maximum radial velocities above and below the impeller with a zone of
relatively high velocity close to the liquid surface. For in-flowing (negative) radial velocities, the maximum is
15% of Vtip which is not much different to that found for the MTTU. The out-flowing radial velocities for the
MTTR are however smaller (16% of Vtip) in comparison with those of the MTTU (23% of Vtip). The tangential
The tangential velocity map is shown in Figure 3(e). Maximum tangential flow is observed at the impeller tip
and in the centre below the impeller with a value of 15% Vtip. Again, liquid rotating in the counter direction is
observed in the upper part of the vessel reaching a maximum of 3.2% Vtip.
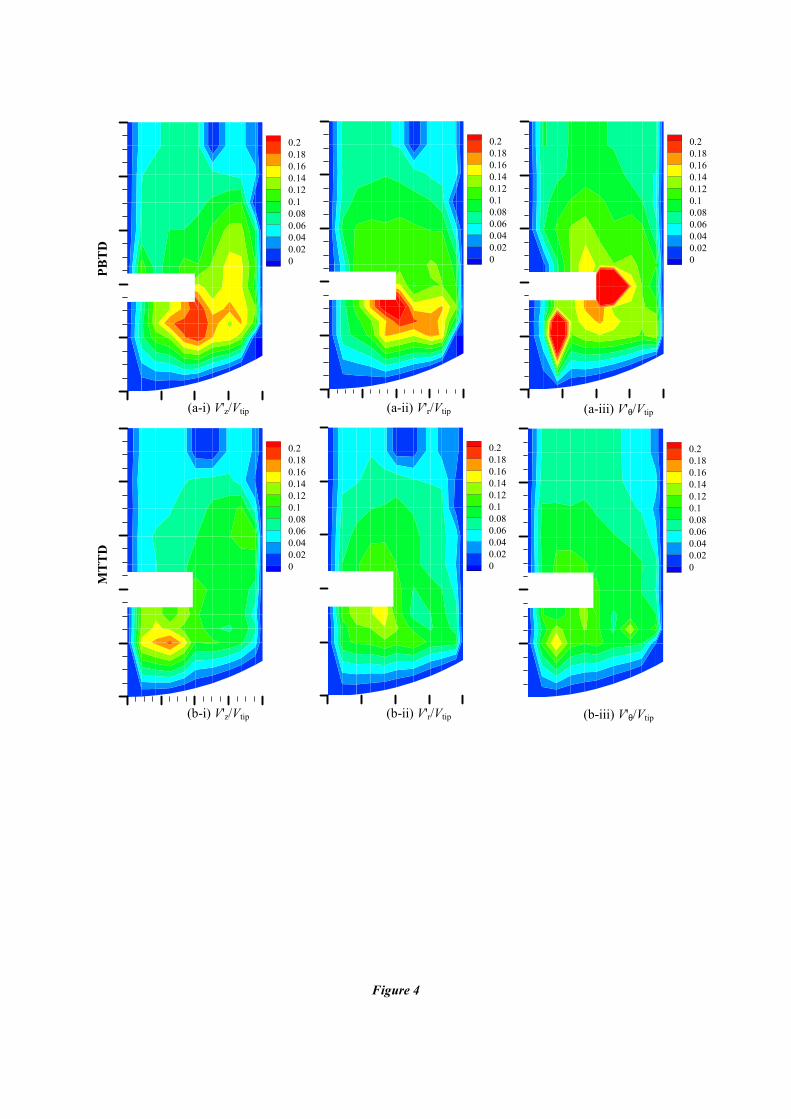
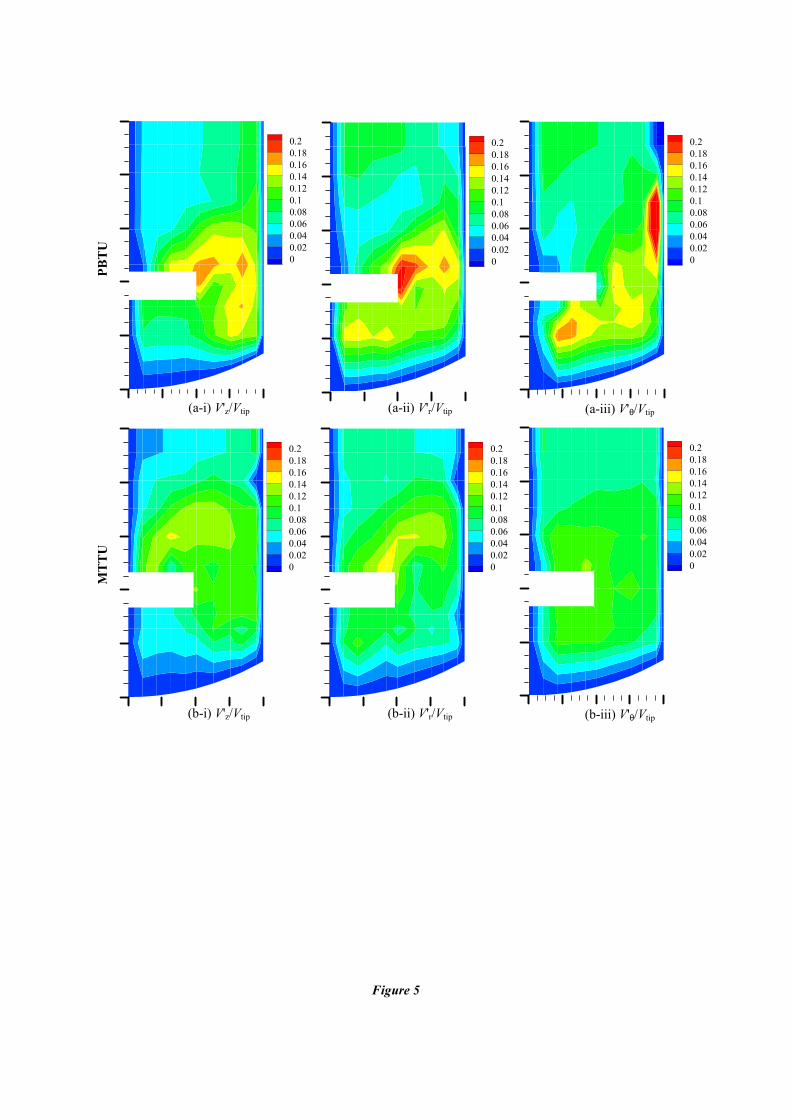
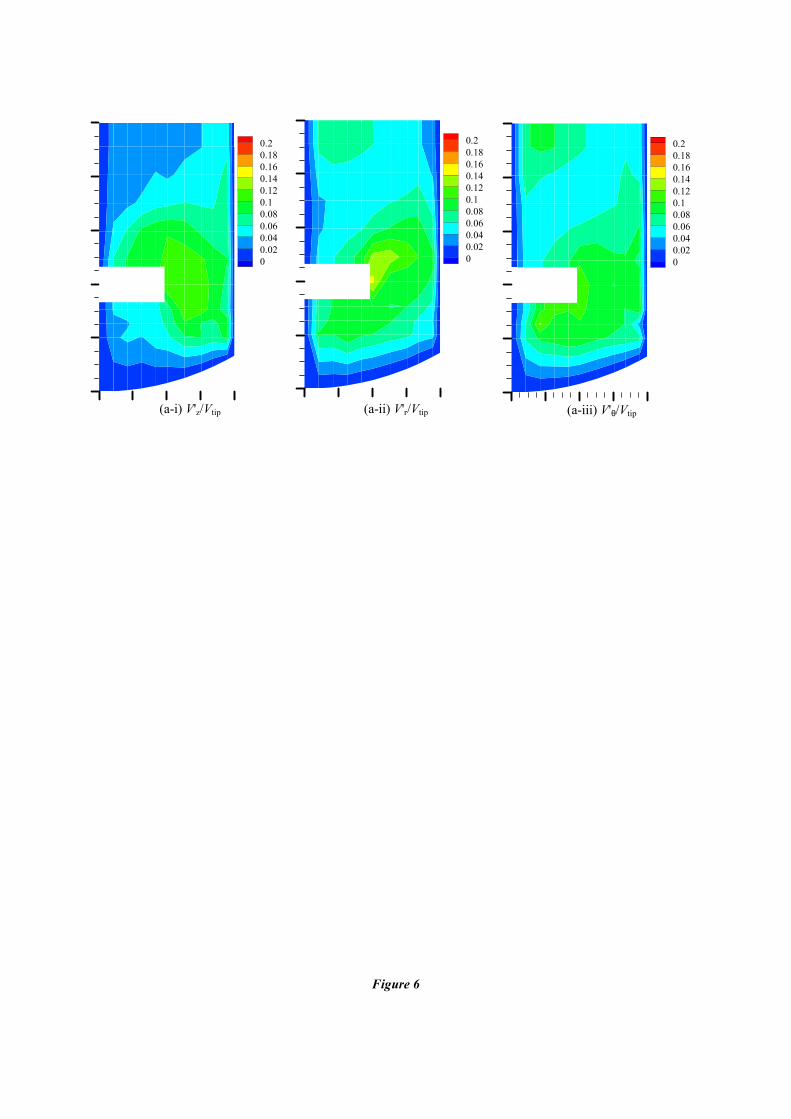
R.m.s. Velocities and Turbulent Kinetic Energy
Figures 4-6 show contour maps of the r.m.s. velocities for each of the velocity components in the down, up and
reverse modes. In all three pumping configurations, the r.m.s. velocities are considerably higher in the discharge
stream of the impeller than in the bulk of the tank. In the up-pumping and reverse modes, the high r.m.s. velocity
region around the impeller is more spread out than in the down-pumping mode. Even though the r.m.s. velocities
observed in the bulk of the tank are significantly smaller than the maximums found in the discharge flow, the
difference between the component values varies noticeably. Table 1 gives the maximum r.m.s values for each
impeller configuration. From these results, it is reserved that the flow induced by these two impellers in the three
different configurations is in general, not isotropic. Mishra et al.15
have also observed that the flows induced by
an APV-B2 impeller in both the up- and down-pumping configurations are not isotropic.
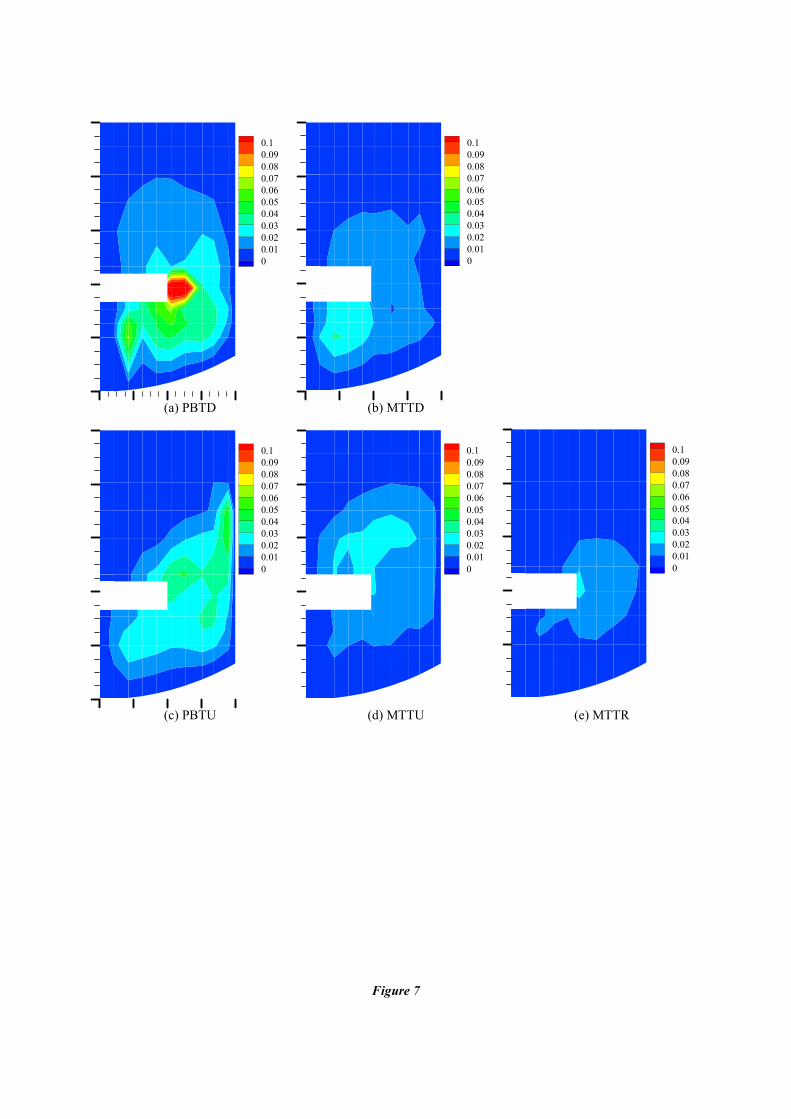
Figure 7 presents spatial distributions of dimensionless turbulent kinetic energy (k* = kT/V2
tip),
determined using the three r.m.s. components. For the three pumping configurations, the maximum values of k*
are generally found in the impeller discharge region. For the PBTD, the highest k* values are found at the
impeller tip and just below with a maximum of 14% of V2
tip. This value is somewhat higher than 9% of V2
tip for a
6-bladed pitched blade turbine (D =T/3)20
. The spatial distribution of k* for the MTTD is similar to that reported
by Mavros et al. (1998) and its maximum value of 3.4% V2
tip is comparable with 3.2% of V2
tip for a T/3
propeller20
and 2.7% of V2
tip for an down-pumping APV-B215
. In the up-pumping and reverse modes, the
maximum turbulent kinetic energy values are smaller than for the down-pumping configuration, although the
high energy regions are larger in size. The largest difference is for the PBTU with a maximum value of only
5.0% V2
tip, for the MTTU and the MTTR the highest values are only slightly less than that found in the down-
pumping mode being 2.7% and 2.5% of V2
tip, respectively.
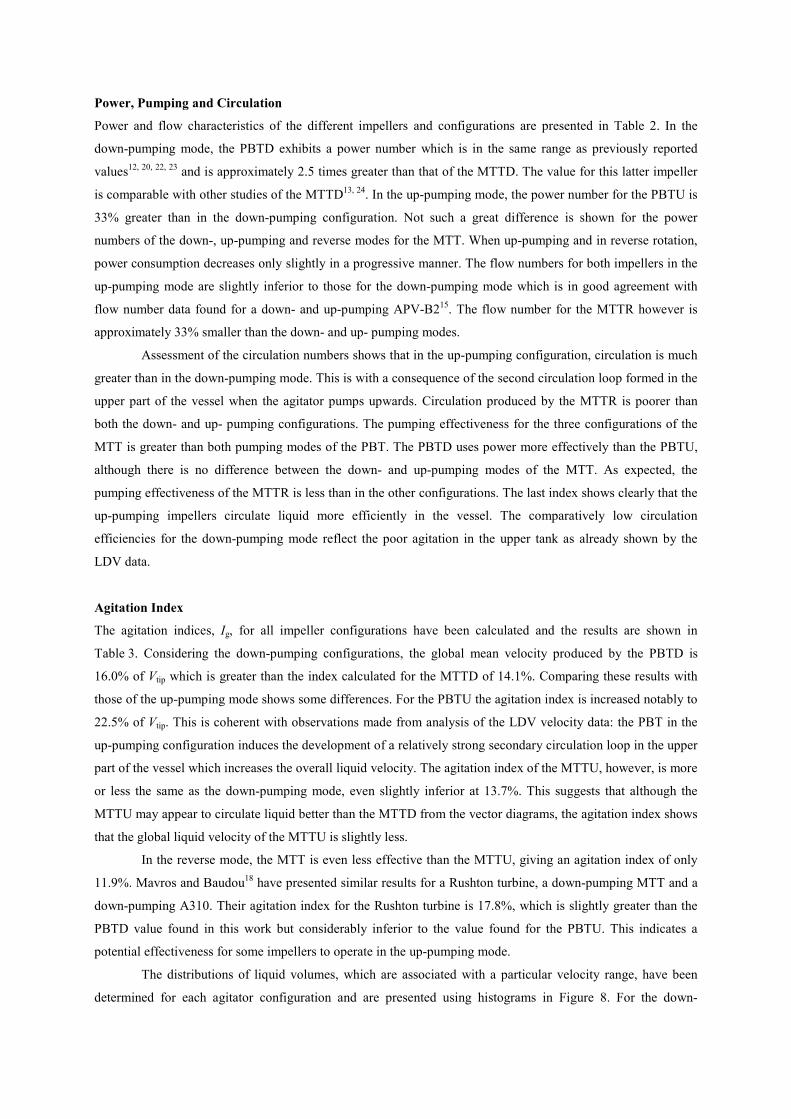
Power, Pumping and Circulation
Power and flow characteristics of the different impellers and configurations are presented in Table 2. In the
down-pumping mode, the PBTD exhibits a power number which is in the same range as previously reported
values12, 20, 22, 23
and is approximately 2.5 times greater than that of the MTTD. The value for this latter impeller
is comparable with other studies of the MTTD13, 24
. In the up-pumping mode, the power number for the PBTU is
33% greater than in the down-pumping configuration. Not such a great difference is shown for the power
numbers of the down-, up-pumping and reverse modes for the MTT. When up-pumping and in reverse rotation,
power consumption decreases only slightly in a progressive manner. The flow numbers for both impellers in the
up-pumping mode are slightly inferior to those for the down-pumping mode which is in good agreement with
flow number data found for a down- and up-pumping APV-B215
. The flow number for the MTTR however is
approximately 33% smaller than the down- and up- pumping modes.
Assessment of the circulation numbers shows that in the up-pumping configuration, circulation is much
greater than in the down-pumping mode. This is with a consequence of the second circulation loop formed in the
upper part of the vessel when the agitator pumps upwards. Circulation produced by the MTTR is poorer than
both the down- and up- pumping configurations. The pumping effectiveness for the three configurations of the
MTT is greater than both pumping modes of the PBT. The PBTD uses power more effectively than the PBTU,
although there is no difference between the down- and up-pumping modes of the MTT. As expected, the
pumping effectiveness of the MTTR is less than in the other configurations. The last index shows clearly that the
up-pumping impellers circulate liquid more efficiently in the vessel. The comparatively low circulation
efficiencies for the down-pumping mode reflect the poor agitation in the upper tank as already shown by the
LDV data.
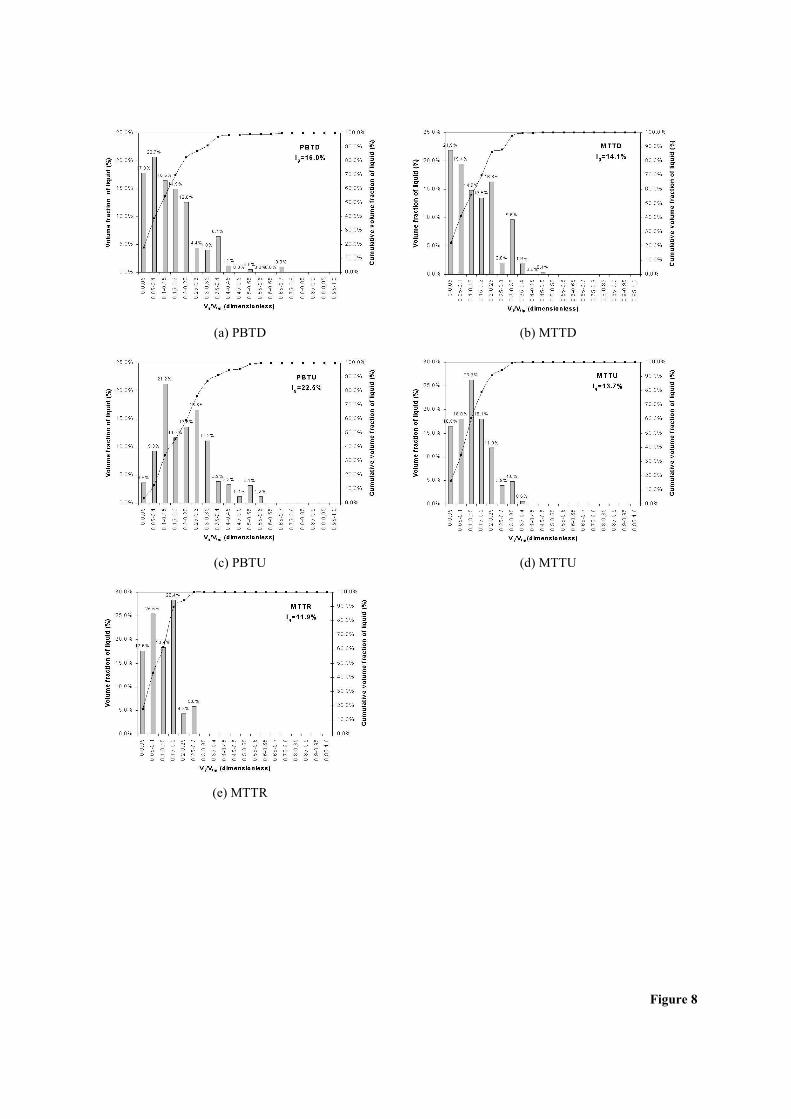
Agitation Index
The agitation indices, Ig, for all impeller configurations have been calculated and the results are shown in
Table 3. Considering the down-pumping configurations, the global mean velocity produced by the PBTD is
16.0% of Vtip which is greater than the index calculated for the MTTD of 14.1%. Comparing these results with
those of the up-pumping mode shows some differences. For the PBTU the agitation index is increased notably to
22.5% of Vtip. This is coherent with observations made from analysis of the LDV velocity data: the PBT in the
up-pumping configuration induces the development of a relatively strong secondary circulation loop in the upper
part of the vessel which increases the overall liquid velocity. The agitation index of the MTTU, however, is more
or less the same as the down-pumping mode, even slightly inferior at 13.7%. This suggests that although the
MTTU may appear to circulate liquid better than the MTTD from the vector diagrams, the agitation index shows
that the global liquid velocity of the MTTU is slightly less.
In the reverse mode, the MTT is even less effective than the MTTU, giving an agitation index of only
11.9%. Mavros and Baudou18
have presented similar results for a Rushton turbine, a down-pumping MTT and a
down-pumping A310. Their agitation index for the Rushton turbine is 17.8%, which is slightly greater than the
PBTD value found in this work but considerably inferior to the value found for the PBTU. This indicates a
potential effectiveness for some impellers to operate in the up-pumping mode.
The distributions of liquid volumes, which are associated with a particular velocity range, have been
determined for each agitator configuration and are presented using histograms in Figure 8. For the down-
pumping configurations, the liquid volume distribution is centred around a very low velocity range – 70% of the
liquid volume has a velocity of less than 20% of Vtip. In the up-pumping mode, the distributions still have a
similar form to the down-pumping distributions though their centres are shifted to higher velocity ranges, the
PBTU having a more important shift than the MTTU. In the PBTU configuration, only 45% of the liquid volume
has a velocity of less than 20% Vtip, whereas for the MTTU 60% of the liquid is moving at less than 20% Vtip.
The reverse mode produces an uneven distribution of the liquid volumes and approximately 95% of the liquid
volume has velocity of less than 25% of Vtip.
CONCLUSION
LDV measurements have been carried out in a vessel stirred by two different axial impellers operating in either
the down-, up-pumping or reverse modes. 2-D r-z velocity vector fields and tangential velocity component maps
demonstrate the differences in flow fields produced by these impellers in different operating modes. In the down-
pumping mode, one circulation loop is produced and the velocities in the upper part of the tank are very weak,
resulting in poor mixing. The impellers pumping upwards induce two circulation loops, one in the lower and one
in the upper part of the tank. This results in a better circulation in the upper part of the vessel.
Operating in the reverse mode, the impeller produces a flow pattern similar to that of the up-pumping
configuration with two circulation loops, however the velocities are much smaller. R.m.s velocities have found
to be considerably higher in the impeller discharge stream than in the bulk of the tank for the three
configurations and the flow is generally non-isotropic which is in agreement with previous up- and down-
pumping mixing studies15
. The maximum values of the turbulent kinetic energy are found in the impeller
discharge region for the different pumping modes. The values in the up-pumping and reverse modes are however
slightly smaller than for the down-pumping agitator.
Comparing pumping effectiveness of up- and down-pumping configurations reveals that the PBTU is
less effective than in the down-pumping mode, although the MTTD and MTTU are equivalent. The circulation
efficiency has been shown clearly to be superior for up-pumping impellers (especially for the PBT) than for the
down-pumping or reverse mode operations.
In conclusion, it has been shown that by simply changing the pumping direction of axial impellers to
operate in the up-pumping mode, some interesting flow features are produced. Even though power consumption
and pumping effectiveness may appear to be less favourable for some up-pumping impellers in single-phase
systems, circulation is considerably improved and the formation of two circulation loops may be promising for
gas-liquid dispersions10,25
. The liquid flow would interfere with the flow of the bubbles, hence retaining more gas
within the vessel. This would result in higher gas holdup and interfacial areas which would possibly have
positive effects on gas-liquid reactions and other gas-liquid or gas-liquid-solid contacting processes.
NOTATION
b baffle width (m)
C impeller clearance (m)
dp seeding particle diameter (µm)
D impeller diameter (m)
Dsh shaft diameter (m)
Ec circulation efficiency (-)
Fl flow number (-)
Flc circulation number (-)
H liquid height in tank (m)
ηE pumping effectiveness (-)
Ig agitation index (dimensionless)
kT turbulent kinetic energy (m2s
-1)
k* dimensionless kinetic energy (-)
N impeller rotational speed (s-1
)
P power (W)
Po power number (-)
Qc circulation flow rate (m3s
-1)
QFl pumping flow rate (m3s
-1)
Qr, Qz radial and axial flow rates (m3s
-1)
r position in the radial direction
r* radial coordinate of circulation loop center
r.m.s. root mean square
R radius of tank (m)
T tank diameter (m)
Tu turbulence intensity (-)
Vij liquid volume surrounding measuring point (m3)
vr, vz, vθ velocity components (ms-1
)
, ,r zv v vθ′ ′ ′ r.m.s. velocity components (ms-1
)
v̂ volume weighted average velocity (ms-1
)
Vtip impeller tip speed (ms-1
)
z position in the axial direction
z* axial coordinate of circulation loop center
time-averaged
Impeller types
CHE3 Chemineer HE3 impeller
MTTD, U, R Mixel TT impeller, down-pumping, up-pumping, reverse rotation
PBTD, U pitched blade turbine, down-pumping, up-pumping
PMT Prochem Maxflo T impeller
REFERENCES
1. Kuboi R. and Nienow A.W., 1982, ‘The Power Drawn by Dual Impeller Systems Under Gassed and
Ungassed Conditions’, Paper G2, 4th European Conference on Mixing, Leeuwenhorst, BHRA Fluid
Engineering U.K., 247-261.
2. Nienow A.W., Kuboi R., Chapman C.M. and Allsford K., 1983, ‘The Dispersion of Gases into Liquids by
Mixed Flow Impellers’, Paper K1, International Conference on the Physical Modelling of Multi-Phase
Flow, Coventry, BHRA Fluid Engineering U.K., 417-437.
3. Nienow A.W., 1990a, ‘Gas Dispersion Performance in Fermenter Operation’, Chem. Eng. Prog., 85, 2, 61-
71.
4. Nienow A.W., 1990b, ‘Agitators for mycelial fermentations’, TIBTECH, 8, 224-233.
5. Nienow A.W., 1996, ‘Gas-Liquid Mixing Studies : A Comparison of Rushton Turbines with Some Modern
Impellers’, Trans IChemE, 74 A, 417-423.
6. Ozcan-Taskin N.G., Badham R.S., Dyster K.N., Jaworski Z., Moore I.P.T., Nienow A.W., Wyszynski M.
and McKemmie J., 1995; ‘Development and Characterisation of a New Impeller’, The 1995 IChemE
Research Event, Edinburgh, IChemE Rugby, U.K., 671-673.
7. Ozcan-Taskin N.G., Badham R.S., Dyster K.N., Jaworski Z., Moore I.P.T., Nienow A.W., Wyszynski M.
and McKemmie J., 1996, ‘Gas-Dispersion Performance of a Newly Designed Impeller in the Transitional
Flow Regime’, The 1996 IChemE Research Event /2nd European Conference For Young Researchers,
Leeds, U.K., 112-114.
8. Kaufman P., Post T.A. and Preston M., 1998, ‘Up-pumping Mixing Technology. Breaking the Mold of
Traditional Systems’, Chem. Proc., 61, 10, 63-66.
9. McFarlane C.M., 1991, Gas-Liquid Mixing Studies on Hydrofoil Impellers, PhD Thesis, The University of
Birmingham, U.K.
10. Hari-Prajitno D., Mishra V.P, Takenaka K., Buljalski W., Nienow A.W. and McKemmie J., 1998, ‘Gas-
Liquid Mixing Studies with Multiple Up- and Down-Pumping Hydrofoil Impellers : Power Characteristcs
and Mixing Time’, Can. J. Chem. Eng., 76, 1056-1068.
11. Hari-Prajitno D., 1999, An Experimental Study of Unaerated and Aerated Single, Dual and Triple Hydrofoil
Impellers, PhD Thesis, The University of Birmingham, U.K.
12. Ranade V.V. and Joshi J.B., 1989, ‘Flow Generated by Pitched Blade Turbines I : Measurements Using
Laser Doppler Anemometer’, Chem. Eng. Comm., 81, 197-224.
13. Mavros P., Xuereb C., and Bertrand J., 1996, ‘Determination of 3-D Flow Fields in Agitated Vessels by
Laser Doppler Velocimetry : Effect of Impeller Type and Liquid Viscosity on Liquid Flow Patterns’, Trans
IChemE, 74 A, 658-668.
14. Jaworski Z., Nienow A.W. and Dyster K.N., 1996, ‘An LDA Study of the Turbulent Flow Field in a Baffled
Vessel Agitated by an Axial, Down-pumping Hydrofoil Impeller’, Can. J. Chem. Eng., 74, 3-15.
15. Mishra V.P., Dyster K.N., Jaworski Z., Nienow A.W., and McKemmie J.,1998, ‘A Study of an Up- and a
Down-Pumping Wide Blade Hydrofoil Impeller : Part I. LDA Measurements’, Can. J. Chem. Eng., 76, 577-
588.
16. Tatterson G.B., 1991, ‘Circulation Times and Pumping Capacities’, Fluid Mixing and Gas Dispersion in
Agitated Tanks, McGraw-Hill Inc., New York, 208-222.
17. Costes J., 1986, Structure des Ecoulements Générés par une Turbine de Rushton dans une Cuve Chicanée,
PhD Thesis, INP, Toulouse, France.
18. Mavros P. and Baudou C., 1997, ‘Quantification of the Performance of Agitators in Stirred Vessels :
Definition and Use of an Agitation Index’, Trans IChemE, 75 A, 737-745.
19. Meyers K.J. and Bakker A., 1998, ‘Solids Suspension with Up-Pumping Pitched-Blade and High-Efficiency
Impellers’, Can. J. Chem. Eng., 76, 3, 433-440.
20. Mishra V.P., 1993, Fluid Mechanics of Mechanically Agitated Reactors, Ph.D. Thesis, University of
Bombay, Bombay, India.
21. Mavros P., Xuereb C. and Bertrand J., 1998, ‘Determination of 3-D Flow Fields in Agitated Vessels by
Laser Doppler Velocimetry : Use and Interpretation of RMS Velocities’, Trans IChemE, 76 A, 223-233.
22. Jaworski Z., Nienow A.W., Koutsakos E., Dyster K. and Bujalski W., 1991, ‘An LDA Study of Turbulent
Flow im a Baffled Vessel Agitated by a Pitched Blade Turbine, Trans IChemE, 69 A, 313-320.
23. Bakker A., 1992, Hydrodynamics of Stirred Gas-Liquid Dispersions, Ph.D. Thesis, Delft University of
Technology, The Netherlands.
24. Baudou C., 1997, Agitation par des Systèmes Axiaux Simples ou Multi-Etages. Obtention de
l’Hydrodynamique par Vélocimétrie Laser à Effet Doppler, Ph.D. Thesis, INP Toulouse, France.
25. Nienow A.W., 1999, ‘The Versatility of Up-Pumping, Wide-Blade Hydrofoil Impellers’, Proceedings of the
3rd International Symposium on Mixing in Industrial Processes, 173-180.
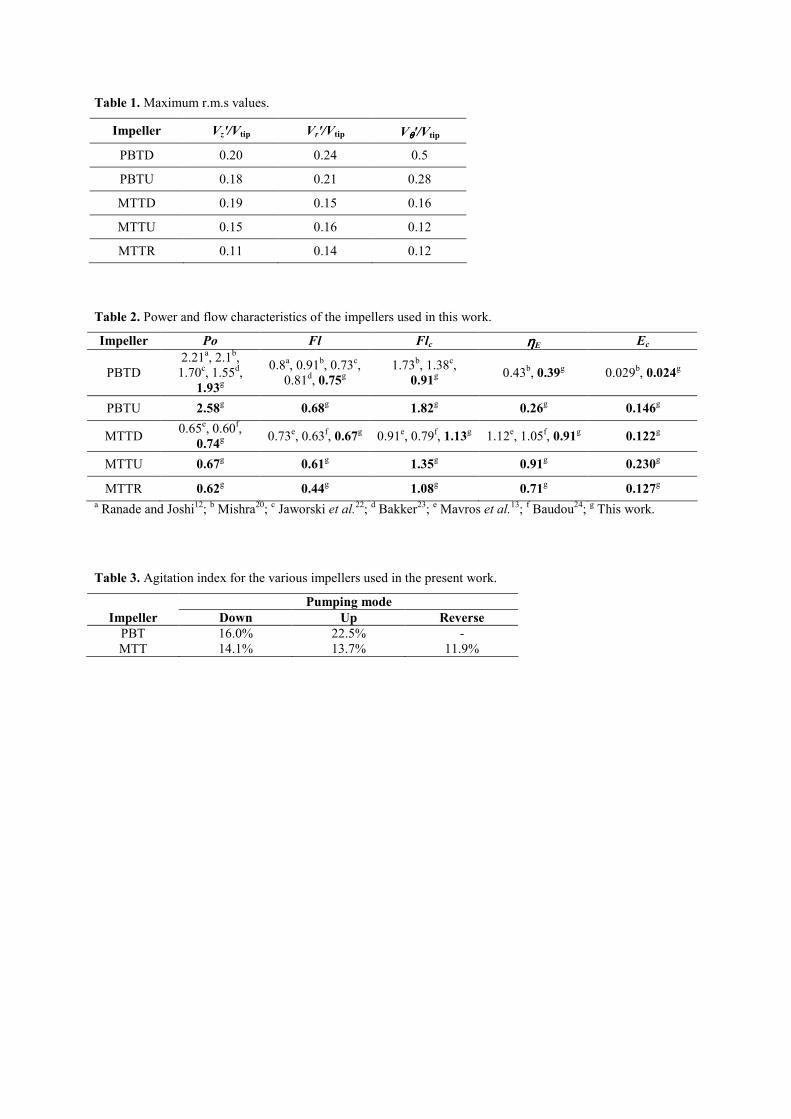
Table 1. Maximum r.m.s values.
Impeller Vz'/Vtip Vr'/Vtip Vθθθθ'/Vtip
PBTD 0.20 0.24 0.5
PBTU 0.18 0.21 0.28
MTTD 0.19 0.15 0.16
MTTU 0.15 0.16 0.12
MTTR 0.11 0.14 0.12
Table 2. Power and flow characteristics of the impellers used in this work.
Impeller Po Fl Flc ηηηηE Ec
PBTD
2.21a, 2.1
b,
1.70c, 1.55
d,
1.93g
0.8a, 0.91
b, 0.73
c,
0.81d, 0.75
g 1.73
b, 1.38
c,
0.91g
0.43b, 0.39
g 0.029
b, 0.024
g
PBTU 2.58g 0.68
g 1.82
g 0.26
g 0.146
g
MTTD 0.65
e, 0.60
f,
0.74g
0.73e, 0.63
f, 0.67
g 0.91
e, 0.79
f, 1.13
g 1.12
e, 1.05
f, 0.91
g 0.122
g
MTTU 0.67g 0.61
g 1.35
g 0.91
g 0.230
g
MTTR 0.62g 0.44
g 1.08
g 0.71
g 0.127
g
a Ranade and Joshi
12;
b Mishra
20;
c Jaworski et al.
22;
d Bakker
23;
e Mavros et al.
13;
f Baudou
24;
g This work.
Table 3. Agitation index for the various impellers used in the present work.
Pumping mode
Impeller Down Up Reverse
PBT 16.0% 22.5% -
MTT 14.1% 13.7% 11.9%

Figure 1. Experimental set-up : (1) Laser source, (2,3) Fiber-optical module, (4) Photomultipliers, (5) Flow
velocity analyser, (6) Oscilloscope, (7) Computer.
Figure 2. 2D flow maps of axial-flow impellers: (a) PBTD; (b) MTTD; (c) PBTU; (d) MTTU; (e) MTTR.
Figure 3. 2D flow maps of the dimensionless tangential velocity component, Vθ/Vtip : (a) PBTD; (b) MTTD; (c)
PBTU; (d) MTTU; (e) MTTR.
Figure 4. RMS velocity distribution maps for the downwards-pumping impellers: (a) PBTD; (b) MTTD.
Figure 5. RMS velocity distribution maps for the upwards-pumping impellers: (a) PBTU; (b) MTTU.
Figure 6. RMS velocity distribution maps for the reverse-rotating MTT impeller.
Figure 7. Maps of dimensionless turbulent kinetic energy, k* = kT/V
2tip.
Figure 8. Distribution of liquid volume fractions in the vessel with respect to dimensionless composite velocity
intervals.
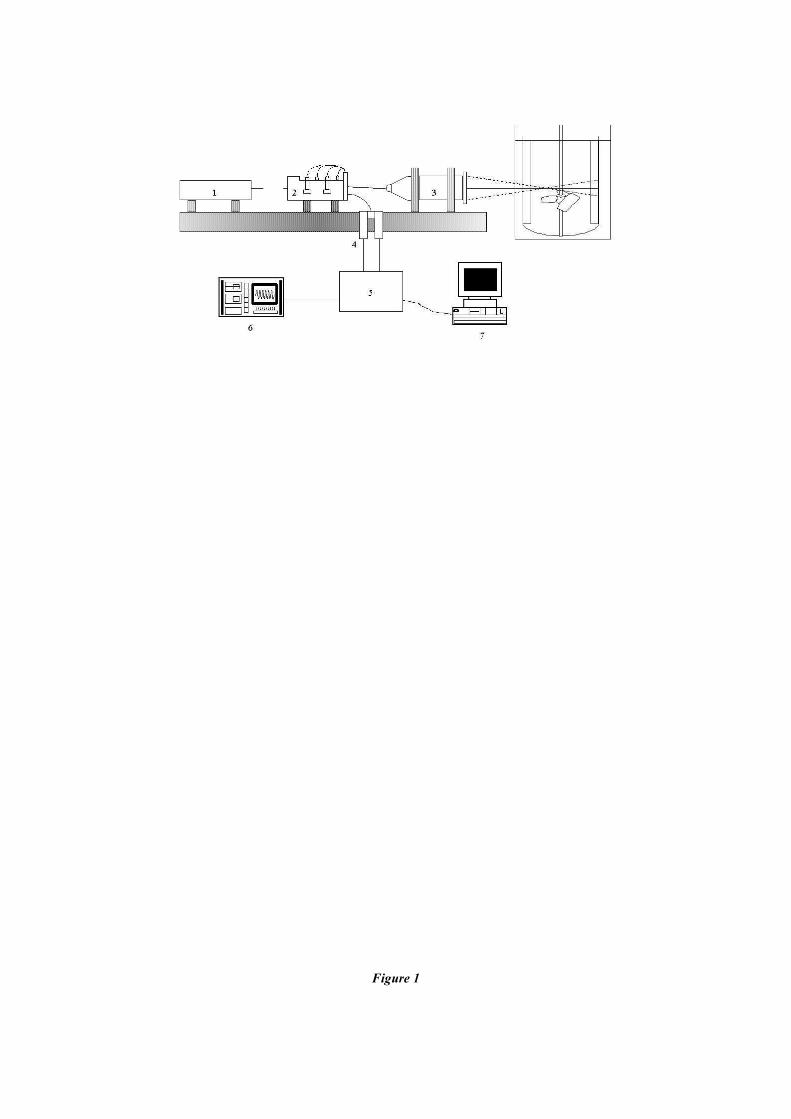
Figure 1
(a) PBT-downwards (b) MTT-downwards
(c) PBT-upwards (d) MTT-upwards (e) MTT-reverse
Figure 2
0.5
0.45
0.4
0.35
0.3
0.25
0.2
0.15
0.1
0.05
0
0.5
0.45
0.4
0.35
0.3
0.25
0.2
0.15
0.1
0.05
0
(a) PBT-downwards (b) MTT-downwards
0.5
0.45
0.4
0.35
0.3
0.25
0.2
0.15
0.1
0.05
0
0.5
0.45
0.4
0.35
0.3
0.25
0.2
0.15
0.1
0.05
0
0.5
0.45
0.4
0.35
0.3
0.25
0.2
0.15
0.1
0.05
0
(c) PBT-upwards (d) MTT-upwards (e) MTT-reverse
Figure 3
PBTD
0.2
0.18
0.16
0.14
0.12
0.1
0.08
0.06
0.04
0.02
0
0.2
0.18
0.16
0.14
0.12
0.1
0.08
0.06
0.04
0.02
0
0.2
0.18
0.16
0.14
0.12
0.1
0.08
0.06
0.04
0.02
0
(a-i) V'z/Vtip (a-ii) V'r/Vtip (a-iii) V'θ/Vtip
MTTD
0.2
0.18
0.16
0.14
0.12
0.1
0.08
0.06
0.04
0.02
0
0.2
0.18
0.16
0.14
0.12
0.1
0.08
0.06
0.04
0.02
0
0.2
0.18
0.16
0.14
0.12
0.1
0.08
0.06
0.04
0.02
0
(b-i) V'z/Vtip (b-ii) V'r/Vtip (b-iii) V'θ/Vtip
Figure 4
PBTU
0.2
0.18
0.16
0.14
0.12
0.1
0.08
0.06
0.04
0.02
0
0.2
0.18
0.16
0.14
0.12
0.1
0.08
0.06
0.04
0.02
0
0.2
0.18
0.16
0.14
0.12
0.1
0.08
0.06
0.04
0.02
0
(a-i) V'z/Vtip (a-ii) V'r/Vtip (a-iii) V'θ/Vtip
MTTU
0.2
0.18
0.16
0.14
0.12
0.1
0.08
0.06
0.04
0.02
0
0.2
0.18
0.16
0.14
0.12
0.1
0.08
0.06
0.04
0.02
0
0.2
0.18
0.16
0.14
0.12
0.1
0.08
0.06
0.04
0.02
0
(b-i) V'z/Vtip (b-ii) V'r/Vtip (b-iii) V'θ/Vtip
Figure 5
0.2
0.18
0.16
0.14
0.12
0.1
0.08
0.06
0.04
0.02
0
0.2
0.18
0.16
0.14
0.12
0.1
0.08
0.06
0.04
0.02
0
0.2
0.18
0.16
0.14
0.12
0.1
0.08
0.06
0.04
0.02
0
(a-i) V'z/Vtip (a-ii) V'r/Vtip (a-iii) V'θ/Vtip
Figure 6
0.1
0.09
0.08
0.07
0.06
0.05
0.04
0.03
0.02
0.01
0
0.1
0.09
0.08
0.07
0.06
0.05
0.04
0.03
0.02
0.01
0
(a) PBTD (b) MTTD
0.1
0.09
0.08
0.07
0.06
0.05
0.04
0.03
0.02
0.01
0
0.1
0.09
0.08
0.07
0.06
0.05
0.04
0.03
0.02
0.01
0
0.1
0.09
0.08
0.07
0.06
0.05
0.04
0.03
0.02
0.01
0
(c) PBTU (d) MTTU (e) MTTR
Figure 7
(a) PBTD (b) MTTD
(c) PBTU (d) MTTU
(e) MTTR
Figure 8