
Effect of Autofrettage in the Thick-Walled Cylinder with a ... · In the autofrettage process,...
22
Effect of Autofrettage in the Thick-Walled Cylinder with a Radial Cross-Bore Hongjun Li, Richard Johnston and Donald Mackenzie Department of Mechanical Engineering University of Strathclyde Glasgow, United Kingdom Abstract The effect of autofrettage on the stress level in thick-walled cylinders with a radial cross- bore is investigated by applying inelastic Finite Element Analysis (FEA) with cyclic pressure loading. A macro is created in ANSYS to calculate the equivalent alternating stress intensity, S eq, based on the ASME Boiler and Pressure Vessel Code. The value of S eq is used to evaluate the fatigue life of the vessel. For a specific cyclic load level, a distinct optimum autofrettage pressure is identified by plotting autofrettage pressure against the number of cycles from design fatigue data. The fatigue life of the autofrettaged vessel with such an optimum pressure is significantly increased compared with the case where no autofrettage is used.
Transcript of Effect of Autofrettage in the Thick-Walled Cylinder with a ... · In the autofrettage process,...

Effect of Autofrettage in the Thick-Walled Cylinder with a Radial Cross-Bore
Hongjun Li, Richard Johnston and Donald Mackenzie
Department of Mechanical Engineering
University of Strathclyde
Glasgow, United Kingdom
Abstract
The effect of autofrettage on the stress level in thick-walled cylinders with a radial cross-
bore is investigated by applying inelastic Finite Element Analysis (FEA) with cyclic
pressure loading. A macro is created in ANSYS to calculate the equivalent alternating
stress intensity, Seq, based on the ASME Boiler and Pressure Vessel Code. The value of
Seq is used to evaluate the fatigue life of the vessel. For a specific cyclic load level, a
distinct optimum autofrettage pressure is identified by plotting autofrettage pressure
against the number of cycles from design fatigue data. The fatigue life of the
autofrettaged vessel with such an optimum pressure is significantly increased compared
with the case where no autofrettage is used.

2
Nomenclature
a inner radius
b outer radius
c cross-bore radius
E Young’s Modulus
Nf number of cycles to failure
Pauto autofrettage pressure
Sij stress differences
Seq equivalent alternating stress intensity
Salt ij alternating stress intensity
σn ij normal stresses
σnm mean Stress
σy yield stress
υ Poisson’s Ratio

3
Figure captions
Figure 1 Fluctuating Stress Pattern
Figure 2 The thick-walled cylinder with a radial cross-bore
Figure 3 Finite element analysis model
Figure 4 Variation of Seq with Pauto, b/a=1.75 and c/a=0.2
Figure 5 Variation of Nf with Pauto, b/a=1.75 and c/a=0.2
Figure 6 Variation of Seq with Pauto for b/a=1.5
Figure 7 Variation of Seq with Pauto for b/a=1.75
Figure 8 Variation of Seq with Pauto for b/a=2
Figure 9 Variation of Seq with Pauto for c/a=0.05
Figure 10 Variation of Seq with Pauto for c/a=0.1
Figure 11 Variation of Seq with Pauto for c/a=0.15
Figure 12 Variation of Seq with Pauto for c/a=0.2
Figure 13 Variation of Seq with Pauto for c/a=0.25
Figure 14 Fatigue life comparison for b/a=1.5
Figure 15 Fatigue life comparison for b/a=1.75
Figure 16 Fatigue life comparison for b/a=2
Listing of table
Table 1 Limit and first yield pressures.

4
Introduction
In the autofrettage process, thick-walled cylinders are partially yielded by means of a
hydrostatic pressure. This produces a larger strain at the inner surface of the cylinder,
compared to the outer surface, and so it begins to yield from the inner bore. The size of
the autofrettage pressure determines the amount of yielding and therefore the amount of
the material at the bore that plastically deforms. When the autofrettage pressure is
removed, there is residual compressive stress at the bore and residual tensile stress at the
outer surface of the cylinder. This residual compressive stress can serve to reduce tensile
stress developed as a result of further applied internal pressures. The process of
autofrettage is therefore very useful in improving the fatigue life of cylinders because of
the reduction in stress.
Texts such as that of Hill [1], Lubliner [2] and Brownell & Young [3] and design Codes
such as ASME B&PV Code Division 3 Alternative Rules for High Pressure Vessels [4]
give the basis for calculating initiation and spread of plastic deformation during loading,
the residual stress upon unloading and the “combined” residual plus operating stress
when subsequently loaded to operating pressure. However, optimum autofrettage
pressures based on thick cylinder theory are of limited applicability in pressure vessel
design, as most real cylindrical vessels incorporate stress raising features which increase
the complexity of the stress distribution and cause local stress concentration. Cross-holes
in the vessel, such as fluid entry/exit bores, bursting cap ports, etc., give rise to complex
stress and strain concentration effects in the vicinity of the hole [5-7]. As the cross hole
configuration is not amenable to an accurate analytic solution of the autofrettage process,
“Numerical elastic-plastic analyses or experimental techniques…” [4] are required to
establish the autofrettage residual stresses. In this paper the optimum autofrettage
pressure of a range of thick cylinders with cross holes is determined using 3D elastic-
plastic finite element analysis. The optimum autofrettage pressure is defined here as that
leading to optimum fatigue life according to the ASME VIII Div. 3 Article KD-3 Fatigue
Evaluation [4] for a design pressure equal to half the limit pressure of the vessel. The
1998 version of the Code is used as this was the current available version when the work
reported was initiated [8].

5
Autofrettage and fatigue life
This theory underlying Article KD-3 Fatigue Evaluation proposes that the fatigue life of
a vessel design is controlled by the Alternating Stress Intensity, Salt, and the Associated
Mean Stress, σnm, normal to the plane of Salt. These stresses are combined to define the
Equivalent Alternating Stress Intensity, Seq, which is used with design fatigue curves to
determine the number of cycles to failure, Nf.
The alternating stress intensity, Salt, represents the maximum range of shear stress. The
associated mean stress, σnm, is the mean value of stress normal to the plane subjected to
maximum alternating stress intensity. These values are demonstrated in Figure 1.
Three principal stresses, σ1, σ2, σ3 are used to calculate the stress differences, S, at each
pressure.
S12 = σ1 - σ2 (1)
S23 = σ2 - σ3 (2)
S31 = σ3 - σ1 (3)
Sij is used to represent any one of these differences. The largest and smallest algebraic
stress differences (Sij max, Sij min) for the design cycle were then identified.
The alternating stress intensity is given by:
Salt ij = 0.5(Sij max - Sij min) (4)
The stresses normal to the plane of the maximum shear stress, associated with the three
alternating stress intensities (Salt ij) are given by:
σn 12 = 0.5(σ1 + σ2) (5)
σn 23 = 0.5(σ2 + σ3) (6)
σn 31 = 0.5(σ3 + σ1) (7)
σn ij is used to represent any one of the three normal stresses. The largest and smallest
normal stresses (σn ij max, σn ij min) for the whole design cycle is identified. The associated
mean stress, σnm, was determined by:
σnm ij = 0.5(σn ij max + σn ij min) (8)

6
The value of the associated mean stress is limited to a value not less than zero. Using the
values obtained for the alternating stress intensity and the associated mean stress, the
equivalent alternating stress intensity can be calculated.
Seq ij = Salt ij (1/ (1- β σnm ij / S’a)) (9)
From the above relationship S’a is the allowable amplitude of the alternating stress
component when σnm = 0 and N =106 cycles. This was taken as 131N/mm2 from the
design fatigue curves. The value of β is a constant value of 0.2. The value of β σnm ij / S’a
was limited to a maximum of 0.9 if it exceeded this value.
Three values of Seq ij are obtained for the design cycle. The largest of these is used in
combination with the design fatigue curve to determine the maximum number of cycles
to failure. The largest value is used, as it will be the main driver towards failure.
In the autofrettage process, the location of maximum stress may differ at different parts of
the cycle, as will the maximum stress ranges, etc. It was therefore necessary to monitor
the stress at all nodes in the vicinity of the cross hole, where the significant stresses
generally occurred. A macro was written to incorporate all the fatigue calculations at
nodal level and give an output of the equivalent alternating stress intensity, Seq.
Modeling and analysis
The thick cylinder with radial cross-bore is illustrated in Fig. 2. A one-eighth model of
the cylinder was constructed in ANSYS 8.1 [9] with three-dimensional SOLID45
elements. Based on the mesh study, the finer mesh was created around the cross-bore
where maximum stress occurred, as shown in Fig. 3. There are 20 elements in thickness
and circumference direction of the cylinder and 22 elements in the direction of the cross-
bore’s circumference. Symmetry boundary conditions were applied to three surfaces in
order to show one-eighth symmetry. The end of the cylinder remote from the cross-bore
was constrained in order to keep the plane section flat and an axial thrust was applied
simulating closed end conditions. For the size of cross holes and cylinders considered,
cross hole end thrust has a negligible effect on limit pressure and stress distribution [7]
and is neglected. The internal pressure was applied to the inner surface of the bore as well
as the inner surface of the cross-bore. The internal pressure load cycle consists of loading

7
from zero to the autofrettage pressure, unloading to zero pressure then reloading to design
pressure. The specified design pressure in all cases is half the limit load of the vessel. A
range of autofrettage pressures (between yield pressure and limit pressure) was
considered for each vessel.
The material chosen for all models was a typical low alloy steel as used in standard
pressure vessels. It was assumed to be elastic perfectly plastic in behaviour and follow the
Von Mises yield criteria. The Bauschinger effect is not considered. The material
properties used are yield stress, σy = 300 MPa , Young’s Modulus, E = 200 GPa and
Poisson’s Ratio, υ = 0.3.
The internal radius of the cylinder was kept constant at a = 0.01m. Three cylinder radius
ratios, b/a, were analyzed
b/a = 1.5, 1.75,2
and five cross-bore radius ratios, c/a, were analyzed for each cylinder radius ratio.
c/a = 0.05, 0.1, 0.15, 0.2, 0.25
The model length is 0.35m which ensures that the stress distribution at the end remote
from the cross bore has no effect on the stress distribution near the cross-bore.
In order to define the design pressure and the range of possible autofrettage pressures,
limit analysis is performed for each model (autofrettage only occurs between the yield
and limit pressures, as the cylinder will only plastically deform within these bounds). By
loading the cylinder up to autofrettage pressure then unloading it to zero pressure the
residual stress distribution can be seen. If the cylinder is then loaded up to design
pressure the operating stress distribution is obtained.
For the models where the ratio b/a varies, new autofrettage ranges had to be found, which
meant finding a new limit pressure and therefore the design pressure changed. The design
pressure was kept specific to the particular geometry of the design (1/2 limit pressure).
The limit and first yield pressures for all configurations investigated are listed in table 1.
The limit pressures reported are slightly higher than reported by Dixon and Perez [10].
Example is the case of b/a=2 and c/a=0.2, the limit pressure is 220 MPa, but based on
Dixon’s Remaining Strength Factor (RSF) the value, the limit would be about 200 MPa.

8
In the case where the cross-bore size was being investigated there is little difference in
the limit pressure and the design pressure doesn’t change much as well.
The same analysis was performed for each of the cylinder radius, and cross-bore, ratios
when autofrettage was not used. This allowed comparisons to be made between the two
situations.
Results
For the model with b/a=1.75 and c/a=0.2, the range of autofrettage pressure was found to
be between 45 MPa and 176 MPa, which leads to a design pressure of 88 MPa. The
autofrettage pressure, Pauto, is plotted against the maximum equivalent alternating stress
intensity, Seq, as shown in Figure 4. The curve shows a distinct dip indicating an optimum
Pauto of around 115 MPa. If the standard design pressure was applied without
autofrettage, the resultant value of Seq would be 177 MPa. (This is the ideal elastic
analysis case: in practice the vessel would be subject to a hydro-test at 1.25 times design
pressure, 110MPa, which would effectively autofrettage the vessel). Comparing with the
value of Seq (148 MPa) at optimum Pauto shows a reduction of 16.4% in stress through the
autofrettage process. It is clear from Code Design Fatigue Curves [7] that the increase in
Seq will result in decrease in the number of cycles to failure. The lowest Seq at optimum
Pauto, therefore, will correspond to a maximum number of cycles to failure as shown in
Figure 5. This figure shows the relationship between the numbers of cycles to failure, Nf,
against Pauto for non-welded parts made from low alloy steel.
Effect of cross-bore ratio
For each radius ratio there were five cross-bore ratios investigated, the graphs of
autofrettage pressure against Seq were plotted in Figures 6-8 for three different radius
ratios. All the curves have the same characteristics and follow the same trends, showing a
clear resemblance to previous work done on the effect of autofrettage on plain thick-
walled cylinders [3].
There was little change in Seq if the autofrettage pressure applied is less than the design
pressure. As Pauto increases past design pressure, the stress values decrease rapidly to the
optimum pressure and then start to rise slowly. The optimum autofrettage pressures for

9
all cross-bore ratios were found to be very close to each other. For R=1.5 the optimum
Pautos are around 85 MPa and in the range of 62.5%-69.6% limit pressures (1.35–1.39
design pressures). For R=1.75 the optimum Pautos are in the range of 110MPa-120MPa,
i.e. 60.1%-66.7% limit pressures. For R=2 the optimum Pautos are in the range of
140MPa-150MPa, i.e. 60%-69.4% limit pressures.
When the autofrettage pressure is above the optimum Pauto, the higher cross-bore ratio is,
the higher Seq indicating shorter fatigue life. The trend is opposite while the autofrettage
pressure is below the optimum Pauto. The value of Seq at optimum pressure increased as
the cross-bore ratio was increased. However, this character is not very obvious for larger
radius ratio, b/a=2.
Effect of radius ratio
Increasing the radius ratio will increase the limit pressure, design pressure and the range
of autofrettage pressure. The effect of radius ratio on Seq was demonstrated in Figures 9-
13 for each cross-bore ratio. These curves clearly show that a higher radius ratio will
result in a higher optimum autofrettage pressure. The value of Seq at optimum Pauto
remains very close to a constant value despite the change in radius ratio. This is true for
all cross-bore ratios. The radius ratio will therefore have little effect on the fatigue life. It
should be noted that the design pressures for three radius ratios are different in present
investigation.
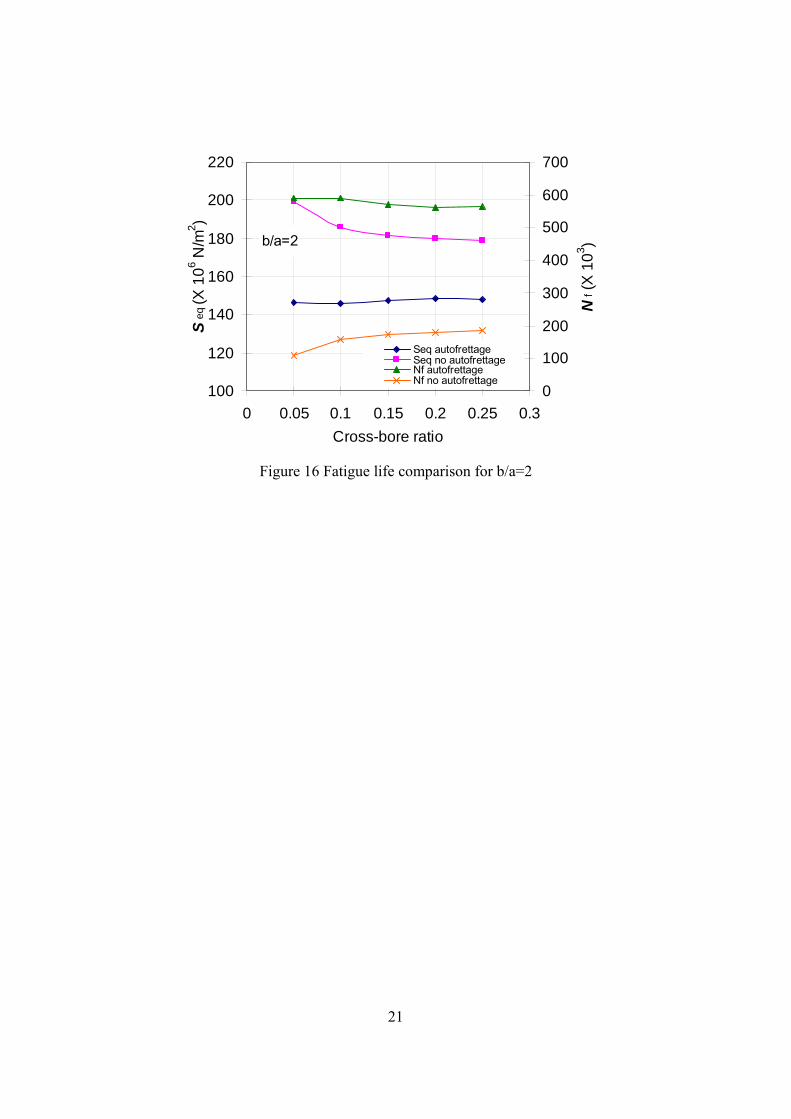
Effect of autofrettage
The pressure vessel with optimum autofrettage done was compared to that where no
autofrettage had taken place. Figure 14-16 show plots of Seq (Primary Y axis) and fatigue
life Nf (Secondary Y axis) against cross-bore ratio for three radius ratios respectively.
The fatigue life of the vessel is much greater where autofrettage has been used. This is
more apparent at the smallest cross-bore ratio where a difference of around 490,000
cycles to failure can be seen for b/a=1.5. This equates to autofrettage improving the
fatigue life of cylinder by three times that where autofrettage had not been used. For the
autofrettaged cylinder Seq increases with increasing cross-bore ratio and the fatigue life of
the autofrettaged cylinder decreases. The number of cycles to failure slowly increases in
the case where no autofrettage has been used. However, this is not such a clear trend.

10
This along with the decreasing fatigue life of the autofrettaged vessel makes the
difference become less with increasing cross-bore. Even for the largest cross-bore ratio
the fatigue life can be improved by around two times the number of cycles to failure.
Conclusion
This paper investigated the effects of introducing a radial cross-bore in an autofrettaged
thick-walled cylinder on fatigue life according to the Fatigue Evaluation guidelines of
ASME Boiler and Pressure Vessel Code. It is concluded that:
1. The cross-bore ratio has little effect on the value of optimum autofrettage pressure,
which is mainly determined by the cylinder radius ratio.
2. The fatigue life decreases with increasing cross-bore ratio for a specific cylinder
radius ratio.
3. The fatigue life of an optimally autofrettaged cylinder stays constant for a specific
cross-bore ratio regardless of change in the cylinder radius ratio.
4. The fatigue life can be greatly improved by using autofrettage, especially for smaller
cross-bore ratios.
References
[1] Hill R, The mathematical theory of plasticity, Oxford University Press, Oxford, 1950
[2] Lubliner J, Plasticity Theory, Macmillan Publishing Company, New York, 1990
[3] Brownell L E & Young E H , Process Equipment Design, John Wiley & Sons, New
York, ISBN 0-471-11319-0, 1995
[4] ASME Boiler & Pressure Vessel Code Division 3 Alternative Rules for High Pressure
Vessels, The American Society of Mechanical Engineers, New York, 1998.
[5] Fessler, H. and Lewin, B. H., “Stress distribution in a tee junction of thick pipes”,
British Journal of Applied Physics, 7, 76-79, 1956.
[6] Gerdeen J C. “Analysis of stress concentrations in thick cylinders with side holes and
cross holes”, J. Eng. for Industry, 94, 815-823, 1972.

11
[7] Makulsawatudom P, Mackenzie D & Hamilton R, “Stress Concentration at
Crossholes in Thick Cylindrical Vessels,” J. Strain Analysis for Engineering Design,
39, pp471-481, 2004.
[8] Johnston R, “A Finite Element Simulation of Autofrettage in High Pressure Vessels”,
BSc. Thesis, University of Strathclyde, Glasgow, 2006.
[9] ANSYS Inc. ANSYS version 8.1, Canonsberg, PA 15317, 2004
[10] Dixon, R.D. and Perez, E. H., “Effects of Cross-bores on the Limit Load of High Pressure Cylindrical Vessels”, High Pressure Technology, ASME PVP, Vol. 371, pp. 119-123, 1998

12
Figures
Figure 1 Fluctuating Stress Pattern

13
Figure 2 The thick-walled cylinder with a radial cross-bore

14
Figure 3 Finite element analysis model

15
100
110
120
130
140
150
160
170
180
190
200
0 25 50 75 100 125 150 175
P auto (MPa)
Seq
(MP
a)
P design=88 MPa
177
Figure 4 Variation of Seq with Pauto, b/a=1.75 and c/a=0.2
050
100150200250300350400450500
0 50 100 150 200
P auto (MPa)
Nf (
X 10
3)
Figure 5 Variation of Nf with Pauto, b/a=1.75 and c/a=0.2

16
b/a=1.5
120130140150160170180190200
0 25 50 75 100 125 150P auto (MPa)
Seq
(X 1
06 N/m
m2 )
c/a=0.1 c/a=0.05 c/a=0.15c/a=0.2 c/a=0.25
Figure 6 Variation of Seq with Pauto for b/a=1.5
b/a=1.75
120
130
140
150
160
170
180
190
200
0 25 50 75 100 125 150 175 200P auto (MPa)
S eq
(X 1
06 N/m
2)
c/a=0.1 c/a=0.05 c/a=0.15c/a=0.2 c/a=0.25
Figure 7 Variation of Seq with Pauto for b/a=1.75

17
b/a=2
120130140150160170180190200210220
0 25 50 75 100 125 150 175 200 225 250
P auto (MPa)
S eq
(X 1
06 N/m
2 )
c/a=0.1 c/a=0.05 c/a=0.15c/a=0.2 c/a=0.25
Figure 8 Variation of Seq with Pauto for b/a=2
c/a=0.05
0
50
100
150
200
250
0 25 50 75 100 125 150 175 200 225 250
P auto (MPa)
Seq
(X 1
06 N/m
2 )
b/a=1.5 b/a=1.75 b/a=2
Figure 9 Variation of Seq with Pauto for c/a=0.05

18
c/a=0.1
0
50
100
150
200
250
0 25 50 75 100 125 150 175 200 225 250
P auto (MPa)
Seq
(X10
6 N/m
2 )
b/a=1.5 b/a=1.75 b/a=2
Figure 10 Variation of Seq with Pauto for c/a=0.1
c/a=0.15
020406080
100120140160180200
0 25 50 75 100 125 150 175 200 225 250
P auto (MPa)
Se (
X 1
06 N/m
2 )
b/a=1.5 b/a=1.75 b/a=2
Figure 11 Variation of Seq with Pauto for c/a=0.15

19
c/a=0.2
020406080
100120140160180200
0 25 50 75 100 125 150 175 200 225
P auto (MPa)
Seq
(X 1
06 N/m
2 )
b/a=1.5 b/a=1.75 b/a=2
Figure 12 Variation of Seq with Pauto for c/a=0.2
c/a=0.25
020406080
100120140160180200
0 25 50 75 100 125 150 175 200 225P auto (MPa)
Seq
(X 1
06 N/m
2 )
b/a=1.5 b/a=1.75 b/a=2
Figure 13 Variation of Seq with Pauto for c/a=0.25

20
b/a=1.5
100110120130140150160170180190
0 0.05 0.1 0.15 0.2 0.25 0.3
Cross-bore ratio
Seq
(X 1
06 N/m
2 )
0
100
200
300
400
500
600
700
Nf (
X 1
03 )
Seq autofrettageSeq no autofrettageNf autofrettageNf no autofrettage
Figure 14 Fatigue life comparison for b/a=1.5
b/a=1.75
100110120130140150160170180190200
0 0.05 0.1 0.15 0.2 0.25 0.3Cross-bore ratio
Seq
(X 1
06 N/m
2 )
0
100
200
300
400
500
600
700
Nf (
X 1
03 )
Seq autofrettageSeq no autofrettageNf autofrettageNf no autofrettage
Figure 15 Fatigue life comparison for b/a=1.75
21
b/a=2
100
120
140
160
180
200
220
0 0.05 0.1 0.15 0.2 0.25 0.3Cross-bore ratio
Seq
(X 1
06 N/m
2 )
0
100
200
300
400
500
600
700
Nf (
X 1
03 )
Seq autofrettageSeq no autofrettageNf autofrettageNf no autofrettage
Figure 16 Fatigue life comparison for b/a=2

22
Table
Cylinder radius
ratio b/a
Cross-bore radius ratio, c/a
0.05 0.1 0.15 0.2 0.25
1.5
Limit pressure
(MPa)
136 133 129 125 122
1.75 189 188 180 176 171
2 234 232 227 220 216
1.5 First yield
pressure
(MPa)
39 38 37 35 32
1.75 48 48 47 45 43
2 55 55 53 52 51
Table 1 Limit and first yield pressures.


![Optimisation of autofrettage in thick- walled cylindersshuman/NEXT/MATERIALS&COMPONENTS... · Brownell and Young [7], and Yu [8] proposed a repeated trial calculation method to determine](https://static.fdocuments.in/doc/165x107/5b0de7fd7f8b9ab7658d2881/optimisation-of-autofrettage-in-thick-walled-cylinders-shumannextmaterialscomponentsbrownell.jpg)