Effect of Alloying on Topologically Close EFFECT OF ALLOYING ON TOPOLOGICALLY CLOSE PACKED PHASE...
16
NASA / TM--1998-206622 The Effect of Alloying on Topologically Close Packed Phase Instability in Advanced Nickel-Base Superalloy Rene N6 Frank Ritzert Lewis Research Center, Cleveland, Ohio David Arenas Pennsylvania State University, State College, Pennsylvania Dennis Keller RealWorld Quality Systems, Inc., Rocky River, Ohio Vijay Vasudevan University of Cincinnati, Cincinnati, Ohio Prepared for the 1998 Annual Meeting sponsored by The Minerals, Metals, and Materials Society San Antonio, Texas, February 15-19, 1998 National Aeronautics and Space Administration Lewis Research Center May 1998 https://ntrs.nasa.gov/search.jsp?R=19980148002 2018-06-09T03:49:26+00:00Z
Transcript of Effect of Alloying on Topologically Close EFFECT OF ALLOYING ON TOPOLOGICALLY CLOSE PACKED PHASE...

NASA / TM--1998-206622
The Effect of Alloying on Topologically Close
Packed Phase Instability in Advanced
Nickel-Base Superalloy Rene N6
Frank Ritzert
Lewis Research Center, Cleveland, Ohio
David Arenas
Pennsylvania State University, State College, Pennsylvania
Dennis Keller
RealWorld Quality Systems, Inc., Rocky River, Ohio
Vijay Vasudevan
University of Cincinnati, Cincinnati, Ohio
Prepared for the
1998 Annual Meeting
sponsored by The Minerals, Metals, and Materials Society
San Antonio, Texas, February 15-19, 1998
National Aeronautics and
Space Administration
Lewis Research Center
May 1998
https://ntrs.nasa.gov/search.jsp?R=19980148002 2018-06-09T03:49:26+00:00Z

Trade names or manufacturers' names are used in this report for
identification only. This usage does not constitute an official
endorsement, either expressed or implied, by the National
Aeronautics and Space Administration.
NASA Center for Aerospace Information7121 Standard Drive
Hanover, MD 21076Price Code: A03
Available from
National Technical Information Service
5287 Port Royal Road
Springfield, VA 22100Price Code: A03

THE EFFECT OF ALLOYING ON TOPOLOGICALLY CLOSE PACKED
PHASE INSTABILITY IN ADVANCED NICKEL-BASE SUPERALLOY
RENE N6
Frank Ritzert
NASA Lewis Research Center
Cleveland, OH 44135
David Arenas
Penn State University
State College, PA 16801
Dennis Keller
RealWorld Quality Systems, Inc.
Rocky River, OH 44 116
Vijay Vasudevan
Department of Materials Science and Engineering
University of Cincinnati
Cincinnati, OH 45221-0012
An investigation was conducted to describe topologically close packed (TCP) phase instability
as a function of composition in the advanced Ni-base superalloy Rene N6. TCP phases are
detrimental to overall high-temperature performance of Ni-base superalloys because of their
brittle nature and because they deplete the Ni-rich matrix of potent solid solution
strengthening elements. Thirty-four variations of polycrystalline Rene N6 determined from a
design-of-experiments approach were cast and homogenized at 1315°C for 80 hours followed
by exposure at 1093°C for 400 hours to promote TCP formation. The alloys had the
following composition ranges in atomic percent: Co 10.61 to 16.73%, Mo 0.32 to 1.34%,
W 1.85 to 2.52%, Re 1.80 to 2.11%, Ta 2.36 to 3.02%, A1 11.90 to 14.75%, and Cr 3.57 to
6.23%. Physical and chemical characteristics of all microstructures obtained were described
using various analytical techniques. From these observations, a mathematical description of
TCP occurrence (t_ and P phase) was generated for polycrystalline Rene N6.
NASA/TM--1998-206622 1

Introduction
Ni-base superalloy single crystals represent the state-of-the-art for turbine engine airfoil
application as they offer the best balance of properties to allow for the high operating
temperatures required for efficient engine operation. 1 Current trends in alloy design take
advantage of improved creep rupture strength with the addition of higher levels of refractory
elements. 2 In particular, the addition of significantly higher levels of Re in third generation
superalloys is key for both microstructural stability and creep rupture strength. 3 While the
presence of the refractories is thought to provide strength benefits from solid solution
hardening, a tendency for alloy instability in the form of topologically-close-packed (TCP)
phases or secondary reaction zone (SRZ) phenomena accompanies the high refractory
content. 3 The formation of these phases in sufficient amount is detrimental to the overall high
temperature performance of Ni-base superalloys because of their brittle nature and because
they deplete the Ni-rich matrix of potent solid solution strengthening elements. 4 The tendency
for a particular composition to form TCP may not be immediately known since the
precipitation of TCP phases in Ni-base superalloys is nucleation controlled, thereby requiring
long times at elevated temperatures to precipitate. 5 They preferentially nucleate along the
octahedral planes of the Ni-base superalloys, usually in areas of refractory metal enrichment at
grain boundaries or inside dendrites. 5'6 In Rene N6, two closely related TCP phases, o and P,have been observed. 2
Early attempts to predict TCP phase formation were based on the PHACOMP method, 7 which
calculates an average electron vacancy number, Nv, for a given alloy. This theory is based on
the premise that TCP phase precipitates in the "/phase when Nv of that ), phase exceeds a
critical value. 8 The difficulty of PHACOMP was described by Murphy et. al. 9 who concluded
that PHACOMP calculations are not accurate unless detailed knowledge is available as to the
exact compositions of the precipitating phases. Efforts to predict TCP phase formation have
continued into this decade by a group of Japanese authors who also make predictions based on
the electronic structure of the Ni-base superalloy, commonly known as the "d-electrons
method", m'll They have determined that 2 parameters, the bond order (Bo) and the average
d-orbital energy level (Md) can be used to predict o phase. As with the Nv method, the new
method defines a critical value of Md above which instability occurs. This method also does
not take into account the synergistic effects of the alloying elements on their partitioning
behavior (i.e., the dependence of elemental partitioning on the presence or absence of other
alloying elements).
Approach
The current work was designed to examine TCP phase formation in modem single crystal
superalloys paying particular attention to the potential synergistic effects of alloying elements.
In order to accomplish this, close attention must be paid to the structure and composition of
all phases present. The approach chosen in this investigation to understand the presence of
TCP phase instability in third generation Ni-base superalloys was to develop a model based on
a design-of-experiments (DOE) methodology. While the investigation of multiple
temperatures would have been of interest, it was instead decided to focus on one temperature
and investigate the compositional effects in more detail. A DOE was set up to quantify both
the linear and pairwise interactive effects of A1, Co, Cr, Mo, Re, Ta and W in an 8-component
superalloy (Ni-base Rene N6 without C) on the resultant amount of TCP phase. It is a relative
certainty that eventual turbine blade materials will be in single crystal form. However, to
improve experimental feasibility and simplify the microstructures, it was decided to examine
NASA/TM--1998-206622 2

the alloys in polycrystalline form and without the inclusion of carbon. The effects of those
choices will be an increase in the likelihood of TCP in the microstructure due to the increased
amount of high-energy grain boundary area and by precluding the formation of carbides.
Although carbides may enhance TCP formation by providing more nucleation sites 12, the
absence of carbon allows more refractory atoms that would be tied up in carbides to instead
contribute to TCP. These choices are believed to be conservative in the sense that a single
crystal is expected to have slightly less TCP formation than a polycrystal of the same
composition. The full statistical model supported by the DOE was:
TCP phase = _0 + I]1X1 + 132X2 + [_3X3 + _4X4 + _5X5 + _6X6 + 1_7X7 +
_12XlX2 -F l_,3XlX3 + [_14XlX4 + [_15XlX5 + [_16XlX6 + [_17XlX7 "l-
_23X2X3 + _24X2X4 "t- _25X:X5 -I- [_26X2X6 + l_27X2X7 "1- _34X3X 4 +
_3sX3Xs + _36X3X6 -I- _37X3X7 + _45X4X s + _46X4X6 + _47X4X7 -{-
[_56X5X6 + _57X5X7 + _67X6X7 + [[3s,B, + _s2B2 + _83B3 ]
where XI=A1, X2=Co, X3=Cr, X4=Mo, Xs=Re, X6=Ta, X7=W, [_o=intercept, and B_, B2, and
B3 are blocking terms. The ranges of investigation for each of the seven elements are listed in
the next section. The 44 runs were conducted in four furnace batches of 11 experiments each.
The DOE strategy employed is called D-Optimal. 13 This strategy allows the reliable
estimation of a user-supplied model in the absolute minimum number of experiments. In this
study the desired model incorporated 32 terms involving all seven linear effects of the
alloying elements and 21 two-variable interactions that captured their interactive behaviors.
The remaining 4 terms in the model were for the intercept and the three dummy variables that
accounted for potential differences among the four furnace runs.
Material Selection
Rene N6 was chosen for this analysis because it is typical of third generation alloys. 14 Single
crystal Rene N6 has a melting temperature of 1399°C and a _/' solvus of 1299°C. _5 A series of
experimental superalloys with compositions containing Ni-Co-A1-Cr-Mo-W-Re-Ta were
chosen based on Rene N6. In commercial Rene N6 trace amounts of C, B, and Hf are also
present. Other elements not included in Rene N6, such as Ti and Y, may also contribute to
phase instability in third generation Ni-base superalloys.
Forty-four Rene N6 compositions (thirty-four variations plus 10 repeats of one composition)
were determined from a DOE strategy. The DOE defines a range of elements included at
either their low or high limit as defined by the patent. 4 The alloys had the following
composition ranges in atomic %: Co 10.61 to 16.73%, Mo 0.32 to 1.34%, W 1.85 to 2.52%,
Re 1.80 to 2.11%, Ta 2.36 to 3.02%, A1 11.90 to 14.75%, and Cr 3.57 to 6.23%. The
compositions studied are given in Table I. Alloys 1, 2, 3, 12, 13, 14, 23, 24, 25, 34, 35 were
designed to be the repeats located at the middle composition level of each of the elements.
Procedure
All alloys were vacuum induction melted in argon starting with 100 gram charges of high-
purity melting stock. The inductively stirred melts were then poured into a copper mold to
obtain the cylindrical castings nominally 2 cm in diameter by 4 cm long. The heat treatment
procedure was carried out in two steps. The goal of the first heat treatment was to fully
homogenize the samples from top to bottom while the second heat treatment step would
NA,RA/TM--1998-206622 3

Table I Compositions of all Rene N6 Castings in Atomic Percent With Actual
and Predicted TCP Response
Alloy A1 Co C__£r Mo Ni R_ge T__aa W Vol %
TCP
1 13.18 12.71 4.56 0.78 62.41 1.84 2.48 2.04 0.42
2 11.90 12.92 4.48 0.79 63.47 1.86 2.54 2.05 0.23
3 12.58 12.80 4.47 0.79 62.96 1.86 2.50 2.05 0.11
4 14.48 10.91 3.64 0.33 63.35 1.90 2.96 2.43 4.47
5 12.66 16.73 3.59 1.34 58.08 2.11 2.99 2.49 5.56
6 12.47 16.48 3.66 1.32 59.27 1.91 2.95 1.93 0.58
7 14.19 16.57 3.68 1.33 57.73 2.09 2.47 1.94 8.57
8 14.09 16.45 6.09 0.33 55.58 2.08 2.94 2.45 12.25
9 12.69 10.97 6.10 1.32 62.09 1.91 2.45 2.48 7.98
10 14.03 10.92 6.07 1.32 60.72 2.07 2.93 1.96 13.34
11 12.39 11.13 3.71 1.34 63.96 1.93 3.02 2.52 4.46
12 12.95 12.60 4.44 0.85 62.91 1.81 2.48 1.97 0.24
13 12.85 12.61 4.52 0.77 62.97 1.80 2.50 1.99 0.3
14 13.38 12.57 4.55 0.78 62.47 1.81 2.48 1.96 0.33
15 13.06 10.79 3.63 0.33 65.40 2.03 2.40 2.36 0.29
16 14.22 15.26 5.56 1.18 56.89 1.86 2.75 2.29 16.7
17 14.86 16.16 3.61 1.31 57.30 2.02 2.87 1.87 9.1
18 12.93 15.96 5.99 1.30 57.74 1.84 2.38 1.86 2.38
19 13.32 16.26 6.06 1.31 56.27 2.00 2.89 1.89 7.96
20 14.68 10.61 6.07 0.39 61.70 1.83 2.36 2.36 8.91
21 14.75 15.93 3.59 0.32 58.90 1.80 2.37 2.33 1.7
22 14.46 10.61 3.57 1.29 64.05 1.80 2.36 1.85 4.94
23 12.76 12.75 4.70 0.78 62.60 1.85 2.53 2.04 0.46
24 12.77 12.86 4.58 0.78 62.65 1.85 2.49 2.01 0.14
25 12.98 12.73 4.69 0.78 62.41 1.85 2.52 2.04 0.2
26 12.92 10.97 6.22 0.33 62.30 1.91 2.94 2.41 2.31
27 13.03 10.86 3.74 1.31 64.69 2.06 2.43 1.88 0.55
28 13.02 16.18 6.15 0.33 57.61 1.89 2.43 2.39 1.06
29 13.09 10.92 3.76 0.33 65.02 2.07 2.93 1.89 0.03
30 14.70 10.90 3.75 1.31 62.41 2.06 2.44 2.43 6.5
31 13.07 11.10 6.29 1.34 60.62 2.10 3.01 2.48 11
32 12.43 10.85 3.70 0.32 66.53 1.87 2.40 1.89 0
33 14.70 16.09 6.20 0.32 56.06 1.83 2.91 1.89 4.48
34 12.98 12.84 4.69 0.78 62.31 1.85 2.52 2.04 0.2
35 12.98 12.84 4.69 0.78 62.31 1.85 2.52 2.04 0.32
36 12.97 16.52 3.79 0.33 58.98 1.95 2.99 2.46 0.74
37 12.91 10.76 6.22 0.32 63.45 2.04 2.41 1.89 0.66
38 12.94 16.48 6.23 1.32 56.01 2.11 2.46 2.45 7.16
39 12.53 16.26 3.73 0.33 60.80 2.05 2.42 1.87 0
40 13.05 16.33 6.17 0.33 57.22 2.06 2.92 1.92 1.15
41 14.68 10.81 3.69 0.32 64.19 2.03 2.39 1.88 0.53
42 12.71 16.49 3.79 1.32 58.87 1.91 2.46 2.45 0.56
43 13.11 10.93 6.20 1.32 61.66 1.90 2.97 1.92 7.79
44 14.57 16.46 3.78 0.33 57.36 2.08 2.98 2.45 5.49
Predicted
0.91+1.21
0.01_+0.13
0.21_+0.58
3.73+_.2.45
4.53+_2.70
0.12_+0.44
7.96+3.58
10.49+4.11
6.45+3.23
13.92+4.74
4.29+_2.63
0.44_+0.84
0.29_+0.68
0.94+1.23
0.06_+0.31
14.5+4.84
9.54+_3.92
1.89-2_1.75
8.27+3.65
8.75+3.76
1.23+1.41
3.47+_2.37
0.44_+0.84
0.31_+0.71
0.73+1.09
3.02+_2.21
1.15+1.36
0.75+1.10
0.04_+0.25
6.68+3.28
11.46+4.30
0.08_+0.36
4.76+2.77
0.71 + 1.07
0.71+1.07
1.29-!-_1.44
0.26_+0.65
8.62+3.73
0-L-0
1.41+1.51
0.51_+0.91
1.3+1.45
6.71 +3.29
6.53+3.25
NASA/TM--1998-206622 4

simulate the microstructural evolution of the alloys at unstressed, hot-engine conditions.
Following a furnace calibration, all of the 44 alloys were homogenized in flowing argon at
1315°C for 80 hours. This was not a typical Rene N6 homogenization treatment. The longer
time was chosen to minimize both macro and microsegregation in the castings. The
homogenization procedure was carried out in four randomized batches of eleven samples
each. All samples were air cooled from the homogenization treatment. Subsequent to
homogenization, longer term heat treatments at 1093°C for 400 hours were conducted on all
44 as-homogenized samples using the same randomized array of four batches. The
temperature 1093°C is considered to be a typical exposure for turbine blades in advanced
engines.
Scanning electron microscopy was performed on all aged microstructures. Both secondary
electron and backscatter electron imaging (BSE) were used to capture the predominantly
three-phase (y+y'+TCP) aged microstructures. Since phase identification was important, BSE
imaging was advantageous given the ability to capture compositional differences between
phases in the form of intensity differences. Strong delineation of all microstructural phases
allowed for more accurate quantitative image analysis.
Image analyses of the microstructures were performed using either a computerized image
analysis software package or point counting as per ASTM Standard E562-95. The gray levels
were set manually (by inspection) for each photograph when using the computer software.
For each casting, four areas were analyzed and the results averaged.
Results
As-homogenized microstructures
Figure 1 - As-homogenized microstructure.
The microstructural characteristics of the as-homogenized alloys were very diverse. Three as-
homogenized alloys were strategically chosen for microprobe analyses to cover both lean and
heavily alloyed compositions. The microprobe results indicated that no macro or
microsegregation was present. Again, it is noted that carbides were absent in all alloys. Small
amounts of TCP phase was observed in alloys 8, 10, 16, 30, and 31. The balance of the alloys
exhibited the desired two-phase y/y' . y' volume fractions ranged from 60 to 75 percent. The
y' precipitates were mostly cuboidal in shape (Figure 1) and ranged in size from 0.1 to
0.25 _'n. Size differences could be the result of compositional variations, differences between
NASA/TM--1998-206622 5
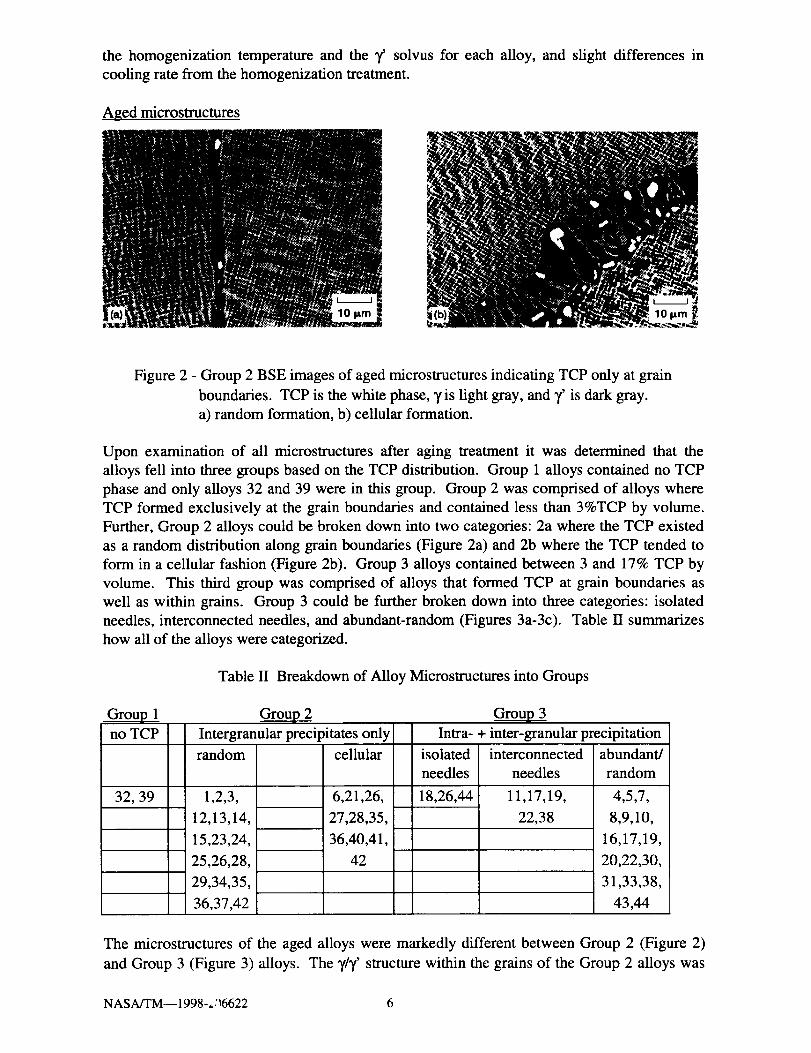
the homogenization temperature and the `/' solvus for each alloy, and slight differences in
cooling rate from the homogenization treatment.
Aged microstructures
Figure 2 - Group 2 BSE images of aged microstructures indicating TCP only at grain
boundaries. TCP is the white phase, "/is light gray, and "/' is dark gray.
a) random formation, b) cellular formation.
Upon examination of all microstructures after aging treatment it was determined that the
alloys fell into three groups based on the TCP distribution. Group 1 alloys contained no TCP
phase and only alloys 32 and 39 were in this group. Group 2 was comprised of alloys where
TCP formed exclusively at the grain boundaries and contained less than 3%TCP by volume.
Further, Group 2 alloys could be broken down into two categories: 2a where the TCP existed
as a random distribution along grain boundaries (Figure 2a) and 2b where the TCP tended to
form in a cellular fashion (Figure 2b). Group 3 alloys contained between 3 and 17% TCP by
volume. This third group was comprised of alloys that formed TCP at grain boundaries as
well as within grains. Group 3 could be further broken down into three categories: isolated
needles, interconnected needles, and abundant-random (Figures 3a-3c). Table 11 summarizes
how all of the alloys were categorized.
Table II Breakdown of Alloy Microstructures into Groups
Group 1no TCP
32, 39
Group 2
Intergranular precipitates only
random cellular
1,2,3,
12,13,14,
15,23,24,
25,26,28,
29,34,35,
36,37,42
6,21,26,
27,28,35,
36,40,41,
42
Group 3
Intra- + inter-granular precipitation
isolated interconnected abundant/
needles needles random
18,26,44 11,17,19,
22,38
4,5,7,
8,9,10,
16,17,19,
20,22,30,
31,33,38,
43,44
The microstructures of the aged alloys were markedly different between Group 2 (Figure 2)
and Group 3 (Figure 3) alloys. The ,//T' structure within the grains of the Group 2 alloys was
NASA/TM-- 1998-U_6622 6

undisturbedby thepresenceof TCP phase which was located at the grain boundaries. There
was evidence of y' alignment within the grains and also some evidence of y' coarsening.
Conversely, in regions near the TCP phase at the grain boundaries the y' became the
continuous phase at the expense of y which is in agreement with the literature. 3 Group 2b
alloys exhibited a cellular precipitation of phases at the grain boundaries including a variety of
TCP phase morphologies while the TCP phase aspect ratio in Group 2a alloys was closer to 1.
Group 3 alloys contained many different TCP phase morphologies. In all Group 3 alloys, the
stable phase adjacent to the TCP phase was T'. Group 3a contained a random placement of
low TCP volume fraction while Group 3c formed TCP similarly but in more prolific amounts.
Group 3b seemed to form TCP on preferred planes which are not conclusively identified at
this time, however, {111 } type planes are probable based on a measurement of roughly 54 °
from the { 100} type 11' orientation. The TCP that was present in Group 3 alloys interrupted
the y/_' structure but was most noticeable in the case of Group 3c where it is obvious that 1/,
was no longer present as discrete particles but as an interconnected, interpenetrating y/7
network.
i ¸¸ i.... , !i̧
Figure 3 - Group 3 aged microstructures indicating both intra- and inter-granular TCP.
a) isolated needles, b) interconnected needles, c) abundant/random.
Microprobe analyses of the TCP phase in a random sampling of 11 alloys indicated that it was
rich in Re and Co. The average composition in atomic percent was: Ni 23.68, Co 19.60,
Mo 5.40, W 12.30, Re 23.77, Ta 1.96, A1 0.44, and Cr 12.86. These values are meant to
indicate the general trends in TCP phase composition because they represent a limited
sampling and also because only the TCP at the grain boundaries was analyzed. As can be seen
from Figures 2 and 3 it is obvious that the TCP phase cannot be classified as having any one
NASA/TM--1998-206622 7

morphology. The TCP phase takes the form of needles, rods, and equiaxed particles
depending on several factors, including composition and volume fraction. Transmission
electron microscopy (TEM) in conjunction with electron diffraction conclusively identified
both _ and P phases in the microstructure of alloy #17. The orthorhombic P-phase had lattice
parameters of a=l.73nm, b=0.49nm, and ¢=0.92nm and the tetragonal _ phase had lattice
parameters of a=0.931nm and e=0.486nm. It was not possible to distinguish _ from P using
BSE contrast in the scanning electron microscope and TEM examination was not performed
in sufficient detail to determine the relative amounts of the two phases. Therefore, the general
designation of "TCP phase" is used to refer to the total volume fraction of _ plus P in all
alloys.
Discussion
It is generally accepted that a complete understanding of the microstructure of complex Ni-
base superalloys is elusive. While ternary and even quaternary systems can be described by
phase diagrams, extrapolating those simpler cases for 8-component systems is often futile. It
is of particular interest in this study to gain further understanding regarding the occurrence of
TCP phase in third generation Ni-base superalloy microstructures. Future work will include
analysis of compositional effects on the TIT' microstructure.
It is widely known that the refractory metal content in a Ni-base superalloy contributes to the
formation of TCP phases such as _ and _. This idea has also been substantiated by electron
vacancy theory where the Nv values for the refractories are greater than Nv of other constituent
elements. Most of the research substantiating this theory involved investigation of first- and
second-generation Ni-base superalloys. Current Ni-base superalloys, termed third-generation,
contained a greater amount of the refractory elements so as to improve the solid-solution
strengthening of the alloy and improve its high-temperature engine performance. It is
expected that the total refractory metal content in the alloys directly affects the TCP content.
However, a strong sensitivity for both the type of refractory metal addition and also the level
of other alloying elements exists. In other words, certain elements or combinations of
alloying elements are more potent than others in forming TCP. It is situations such as these
where DOE strategies are valuable as they employ multi-variable regression models to
accurately quantify both the simple linear and complex interactive effects. A full multiple
regression model is necessary in order to capture these effects.
Two approaches to model building were conducted in this work. The "backwards elimination
with review" approach began with all 32 terms in the generic DOE model and sequentially
eliminated the non-significant terms. The "forward selection with review" approach began
with just an intercept and sequentially selected significant terms into the model. Both
modeling approaches yielded the same final model. The actual regression calculations were
performed on composition data that was in normalized units ranging from -1 to +1. Actual,
not aim compositions were used. The volume percent of TCP was transformed by a square
root function to accommodate the fact that TCP response values were more reproducible at
lower volume % than they were at the higher volume fractions near 15%. Even though the
blocking terms were significant, they were removed from the final model to make possible
future predictions. The resultant decrease in agreement between actual and predicted TCP
values was reflected in a slightly increased error of prediction. The result of this analysis in
terms of atomic percent is:
NASA/TM--1998-20662; 8

(vol% TCP) 1/2 = 16.344782 - 1.019587(A1) - 2.624322(Cr) - 3.821997(Mo) +
1.109575(Re) - 3.207295(Ta) + 6.462984(W) - 2.271803(Co) +
0.052884(A1"Co) + 0.214059(Al*Cr) + 0.300698(Al*Mo) +
0.8001 l(Co*Re) + 0.257108(Cr*Mo) - 5.081598(Re*W) +
1.824441(Ta*W)
The model's predictive capability can be expressed by an approximate 95% confidence
interval around the predicted value, and is given by TCP + 1.27(TCP) 1/2. The model's
goodness of fit is captured in the statistic R 2 = 0.954, which implies that 95.4% of the total
variation in the response, (vol% TCP) 1/2, across all 44 experiments is explained by the model.
Actual TCP volume percents as well as model predicted TCP phase values with 95%
confidence intervals are given in Table I. Since the TCP prediction relies heavily on
interactive effects as well as linear effects, its usefulness will be limited when applied to
alloys that lie outside of the design space of Rene N6. The casting and heat treatment of
several different alloys is forthcoming to experimentally verify the predictive capabilities of
the model.
The above mathematical relationship indicates that every element in the composition can have
a statistically significant effect on TCP phase formation. However, it is not simple to discern
the direct relationship between the coefficients associated with individual elements and their
primary effect on resultant TCP. In other words, coefficients associated with the linear effects
of the elements can not be relied upon solely for indicating TCP phase response. Interactive
effects captured by the interaction terms are also of critical importance, namely Co*Re,
Mo*Cr, Cr*A1, Co*A1, Mo*A1, W'Re, and W*Ta. Figures 4a-4f represent these
relationships graphically where volume % TCP phase is the response with uniform scaling
across all graphs to indicate the relative strength of interactions. The response surface for
Mo*A1 was omitted because it was essentially identical to the Cr*AI response. For the
generation of each graph, all 5 elements that were not included in the interactive relationship
were kept at their midpoint compositional level. Figure 4a shows the response surface of
volume percent TCP as a function of Re and Co content. The figure indicates that at low Co
levels the inclusion of Re has very little effect on TCP content. However, when the Co level
is high Re has a more pronounced, positive effect on TCP phase content. Figure 4b and 4c
indicate that at higher levels of Cr, either high Mo or high A1 levels contribute strongly to
TCP formation. Conversely, the effect of Cr is negligible with low A1. Figure 4d shows that
Co has less of an impact on TCP at lower A1 levels and that the increase of A1 across all Co
levels contributes toward more TCP. Figures 4e and 4f show that the interactive effect of W
with either Ta or Re gives a more subtle TCP response similar to that observed in the Co*Re
interaction in Figure 4a. From inspection, the interactive effects of Re, W, and Ta are not
major with respect to some of the other sharper trends toward high TCP content. The survey
of Figures 4c-4e strongly suggests low A1 levels to minimize TCP phase content. Figure 4b,
when studied in conjunction with Figures 4c and 4e makes investigation of potential 3-way
interaction among Mo, Cr, and A1 intriguing for future studies. Further detailed inspection of
the response surfaces in Figures 4a-4g could provide several additional, substantive arguments
regarding the interactive effects of two elements on TCP.
If we were to look at this model using the Rene N6 target composition (Table HI) a TCP
content of 1.57 + 1.59 percent after exposure to 1093°C for 400 hours is predicted. This is a
NASA/TM--1998-206622 9

Ca)j
16---
12--
8 ---.
TCP. _2
4"--
0-- 0411.0
.88 1.9613.0 1_.0_ "11.80 Re
Co
8_TCP _/_]_
0.2
6.
• 4.4 3.6Cr
14.4
f_'_::l 2.8 13.6
12.0 A1
(e)
82TCP,
4_
0
2.45 ,, ,- .8
2.05 2.41.85 TaW
16"-"
12
8---.TCP-
4-.
0
1.20.8
Mo
\
0.4 3.6 Cr
6.0
(d)
12 -.[ /_/
82TCP. /_
13Co
i 12.0 12.8
14.4
AI
- 3.0
(f)
16
12
TCt_
4
o .04_25 _0_:-.-_7_, 88-'_W 1.85 Re
Figure 4 - Graphical representation of model predictions showing significant linear
interactive effects, a)Co*Re, b)Mo*Cr, c)Al*Cr, d)Co*A1, e)W*Ta, f)W*Re.
reasonable result for Rene N6 close to its target composition. However, it is fair to assume
from the results of this study that TCP content could become much higher if compositions of
certain elements are at their high or low limits, but still within the specification of the alloy.
Table 11I applies the mathematical description of TCP occurrence generated in this study to
NASA/TM-- 1998-206622 10

severalcommerciallyavailablealloys. The traceelementspresentin the alloyswereomittedfrom the tableto simplify the applicationof the modelwhile higherNi valueswere usedtoabsorbthe excludedvaluesandbring the compositionsto 100percent. Although Ti is notincludedin themodel,it wasassumedandtreatedto behavesimilar to Ta. In eachcase,thepredictedTCPphasecontentis pairedwith a 95% confidencenumber. Theobvious,inflatedpredictionof ReneN5 TCP contentindicatesthat the"model" is not applicableto all secondand third generationNi-base superalloys. Especially those falling outside the designparametersof this study. By inspectionit appearsthat the low Co level may be the mainsourcefor this discrepancy.Theotherpredictedresultsof Table 111 appear believable after
exposure at 1093°C for 400 hours.
Table HI Compositions of Several Commercially Available Alloys in Atomic Percent
Alloy W Re T___g C___r Mo A1 C___QO Ti "Ni" TCP
Rene N4 1.9 0 1.3 10.3 1.2 8.1 8.1 5.2 63.8 0
CMSX 4 2 1 2.2 7.6 0.4 12.6 9.3 1.3 63.8 7.55+3.49
Rene N5 1.6 1 2.3 8.1 1.3 13.9 8.2 0 63.6 23.09_+6.10
Rene 162 1.9 2.1 2.4 5.4 0 14.3 13.1 0 60.8 1.53+_/1.57
CMSX 10 1.7 2 2.8 2.4 0.3 13.2 3.2 0.3 74.2 0
Rene N6 2 1.8 2.5 5 0.9 13.3 13.2 0 61.2 1.57+1.59
CMSX-4 ® and CMSX-10 ® are registered trademarks of the Cannon-Muskegon Corporation.
Summary and Conclusions
An approach based on a DOE was conducted to describe TCP phase instability as a function
of chemical content in advanced Ni-base superalloy Rene N6. A regression model was
developed to describe the presence of TCP phase in the microstructures of polycrystalline
Rene N6 based on chemical content. Forty-four alloys were cast, homogenized, and aged to
produce samples for microstructural evaluations. For compositions all within the
specification limits of the patent, TCP content varied from 0 to 17 volume percent. It was
determined that A1, Mo, Cr, W, Re, and Ta had strong primary as well as interactive effects on
the presence of TCP phase. While these primary effects can be described by PHACOMP, the
present work was able to also quantify interaction effects which are difficult to obtain in
PHACOMP-based approaches. For example, this study found the following interactions to be
significant in varying degrees: AI*Co, AI*Cr, AI*Mo, Co*Re, Cr*Mo, Re*W, and Ta*W.
The model was accurate (R2=0.954) within the alloy design space, but extrapolation to other
alloys is of unknown utility. The predictive capabilities of this model still require
experimental verification but it did produce a reasonable prediction for a target composition of
single crystal Rene N6.
References
1. Decker, R.F. and Sims, C.T. "The Metallurgy of Nickel-Base Alloys", The
Superalloys, ed. Sims & Hagel, 1972, p.33.
2. Walston, W.S.; Schaeffer, J.C., Murphy, W.H., A New Type of Microstructural
Instability in Superalloys - SRZ, Proceedings of Superalloys Symposium, Seven
Springs, PA, September 22-26, 1996.
NASA/TM--1998-206622 11

3. Walston,W.S.;O'Hara,K.S.; Pollock,T.M.; Murphy,W.H., ReneN6:ThirdGenerationSingleCrystalSuperalloy,Proceedingsof SuperalloysSymposium,SevenSprings,PA, September22-26,1996.
4. Walston,W.S.; Ross,W; O'Hara,K.S.; Pollock, T.M., U.S.PatentNumber 5,270,123,December14,1993.
5. Duhl, D.N. Alloy PhaseStabilityRequirementsin SingleCrystalSuperaUoys,AlloyPhaseStabilityandDesign;Proceedingsof Symposium,SanFrancisco,CA, April 18-20, 1990,p.389.
6. Sims,C.T., "predictionof PhaseComposition",SuperalloysH, ed.Sims,Stoloff,&Hagel,1987,p.217.
7. Woodyatt,L.R., Sims,C.T.,andBeattie,H.J.,Predictionof Sigma-TypePhaseOccurrencefromCompositionsin AusteniticSuperalloys,Trans.Met. Soc.AIME,Vol.236,April 1966,p.519.
8. Machlin,E.S.andShao,J.,SIGMA-SAFE:A PhaseDiagramApproachto theSigmaPhaseProblemin Ni BaseSuperaUoys,Met.Trans.A, Vol.9A, April 1978,p.561.
9. Murphy,H.J.;Sims,C.T.;andBeltran,A.M., PHACOMPRevisited,JournalofMetals,November1968,p.46.
10. Zhang,J.S.;Hu,Z.Q.;Murata,Y.; Morinaga,M.; andYukawa,N., DesignandDevelopmentof HotCorrosion-ResistantNickel-BaseSingle-CrystalSuperalloysbythed-ElectronsAlloy DesignTheory:PartI. Characterizationof thePhaseStability,Met TransA, Vol.24A,November1993,p.2443.
11. Yukawa,N.; Morinaga,M.; Murata,Y.; Ezaki,H.; andInoue, S.,High PerformanceSingleCrystalSuperalloysDevelopedby thed-ElectronsConcept,in Superalloys1988,p.225.
12. Sims, C.T., A Contemporary View of Nickel-Base Superalloys, Journal of Metals,
October 1966, p. 1119.
13. Bach, G.E.P., Draper, N.R., "Empirical Model-Building and Response Surfaces",
Wiley Publishers, 1987, pp. 489-501.
14. Erickson, G.L., A New, Third-Generation, Single-Crystal, Casting Superalloy, Journal of
Materials, April 1995.
15. Walston, W.S., personal communication.
NASA/TM-- 1998-206622 12


REPORT DOCUMENTATION PAGE FormApprovedOMB No. 0704-0188
Public reporting burden for this collection of information is estimated to average 1 hour per response, including the time for reviewing instructions, searching existing data sources,
gathering and maintaining the data needed, and completing and reviewing the collection of information. Send comments regarding this burden estimate or any other aspect of this
collection of information, including suggestions for reducing this burdan, to Washington Headquarters Services, Directorate for Information Operations and Reports, 1215 Jefferson
Davis Highway, Suite 1204, Arlington, VA 22202-4302, and to the Office of Management and Budget, Paperwork Reduction Project (0704-0188), Washington, DC 20503
1. AGENCYUSEONLY(Leaveblank) 2. REPORTDATE 3. REPORTTYPEANDDATESCOVERED
May 1998 Technical Memorandum4. TITLEANDSUBTITLE 5. FUNDINGNUMBERS
The Effect of Alloying on Topologically Close Packed Phase Instability in
Advanced Nickel-Base Superalloy Rene N6
6. AUTHOR(S)
Frank Ritzert, David Arenas, Dennis Keller, and Vijay Vasudevan
7. PERFORMINGORGANIZATIONNAME(S)ANDADDRESS(ES)
National Aeronautics and Space AdministrationLewis Research Center
Cleveland, Ohio 44135-3191
9. SPONSORING/MONITORINGAGENCYNAME(S)AND ADDRESS(ES)
National Aeronautics and Space Administration
Washington, DC 20546- 0001
WU-523-21-13--00
8. PERFORMINGORGANIZATIONREPORTNUMBER
E-11058
10. SPONSORING/MONITORING
AGENCY REPORT NUMBER
NASA TM--1998-206622
11. SUPPLEMENTARYNOTES
Prepared for the 1998 Annual Meeting sponsored by The Minerals, Metals, and Materials Society, San Antonio, Texas,
February 15-19, 1998. Frank Ritzert, NASA Lewis Research Center; David Arenas, Pennsylvania State University, State
College, Pennsylvania 16801 ; Dennis Keller, RealWorld Quality Systems, Inc., Rocky River, Ohio 44116; Vijay Vasudevan
University of Cincinnati, Department of Materials Science and Engineering, Cincinnati, Ohio 45221-0012. Responsible
person r Frank Ritzen r organization code 5120_ (216) 433-8199.12a. DISTRIBUTION/AVAILABILITYSTATEMENT 12b. DISTRIBUTIONCODE
Unclassified - Unlimited
Subject Category: 26 Distribution: Nonstandard
This publication is available from the NASA Center for AeroSpace Information, (301) 621-0390.
13. ABSTRACT (Maximum 200 words)
An investigation was conducted to describe topologically close packed (TCP) phase instability as a function of composi-tion in the advanced Ni-base superalloy Rene N6. TCP phases are detrimental to overall high-temperature performance of
Ni-base superalloys because of their brittle nature and because they deplete the Ni-rich matrix of potent solid solution
strengthening elements. Thirty-four variations of polycrystalline Rene N6 determined from a design-of-experiments
approach were cast and homogenized at 1315°C for 80 hours followed by exposure at 1093°(2 for 400 hours to promote
TCP formation. The alloys had the following composition ranges in atomic percent: Co 10.61 to 16.73%, Mo 0.32 to
1.34%, W 1.85 to 2.52%, Re 1.80 to 2.11%, Ta 2.36 to 3.02%, A! 11.90 to 14.75%, and Cr 3.57 to 6.23%. Physical and
chemical characteristics of all microstructures obtained were described using various analytical techniques. From these
observations, a mathematical description of TCP occurrence (c and P phase) was generated for polycrystalline Rene N6.
14. SUBJECTTERMS
Superalloy; Nickel; Instability
17. SECURITY CLASSIFICATION 18. SECURITY CLASSIFICATION
OF REPORT OFTHIS PAGE
Unclassified Unclassified
NSN 7540-01-280-5500
15. NUMBER OF PAGES
1816. PRICECODE
A0319. SECURITY CLASSIFICATION 20. LIMITATION OF ABSTRACT
OFABSTRACT
Unclassified
Standard Form 298 (Rov. 2-89)
Prescribed by ANSI Std. Z39-18
298-102


![Adaptive Cube Tessellation for Topologically Correct ... · Adaptive Cube Tessellation for Topologically Correct Isosurfaces ... [PT90]. This method is ... Tessellation for Topologically](https://static.fdocuments.in/doc/165x107/5adfba127f8b9a5a668ca39b/adaptive-cube-tessellation-for-topologically-correct-cube-tessellation-for-topologically.jpg)