Effect of Accounting Ratios on Investment Performance of ... · Effect of Accounting Ratios on...
38
www.idosr.org Okpe et al 101 IDOSR JOURNAL OF CURRENT ISSUES IN SOCIAL SCIENCES 4(1): 101-138, 2018. International Digital Organization for Scientific Research ISSN: 2579-0765 IDOSR JOURNAL OF CURRENT ISSUES IN SOCIAL SCIENCES 4(1): 101-138, 2018. Effect of Accounting Ratios on Investment Performance of Deposit Money Banks in Nigeria. Innocent Ikechukwu Okpe 2, Anastesia Nwakaego Duru 1 and Omughele Favour 3 1 Department of Accountancy, Enugu State University of Science and Technology, Enugu State, Nigeria. 2 Department of Accountancy, Enugu State University of Science and Technology, Enugu State, Nigeria. 3 Department of Accountancy, Enugu State University of Science and Technology, Enugu State, Nigeria. ABSTRACT This work examined the effect of accounting ratios on investment performance of deposit money banks in Nigeria. Five research objectives guided this study and they sought to: determine the effect of capitalization ratio on return on equity (ROE); determine the effect of credit risk ratio on return on equity (ROE); determine the effect of operating expenses ratio on return on equity (ROE); determine the effect of liquidity ratio on return on equity (ROE) of deposit money banks in Nigeria; and to determine the effect of bank size ratio on return on equity (ROE) of deposit money banks in Nigeria. This research was carried out using secondary data. Multiple regression analyses were used for testing the hypotheses. The result reveals that capitalization ratio had negative and insignificant effect on return on equity; credit risk ratio had positive and insignificant effect on return on equity; operating expenses ratio had insignificant and positive effect on return on equity; liquidity ratio had a negative and insignificant effect on return on equity; and that bank size had significant and negative effect on return on equity of deposit money banks. It was recommended, among other things, that the management of deposit money banks should put more attention on their liquidity in order to maintain an adequate liquidity as the study has empirically proved that higher liquidity signifies better performance, and that the management should reduce the amount held in cash as current asset and concentrate more in investing them, so that it could yield higher return rather than tie down the idle cash. Key Word: Accounting Ratios, Investment Performance, and Multiple Regressions
Transcript of Effect of Accounting Ratios on Investment Performance of ... · Effect of Accounting Ratios on...

www.idosr.org Okpe et al
101 IDOSR JOURNAL OF CURRENT ISSUES IN SOCIAL SCIENCES 4(1): 101-138, 2018.
International Digital Organization for Scientific Research ISSN: 2579-0765
IDOSR JOURNAL OF CURRENT ISSUES IN SOCIAL SCIENCES 4(1): 101-138, 2018.
Effect of Accounting Ratios on Investment Performance of
Deposit Money Banks in Nigeria.
Innocent Ikechukwu Okpe2,
Anastesia Nwakaego Duru1
and Omughele Favour3
1
Department of Accountancy, Enugu State University of Science and Technology, Enugu
State, Nigeria.
2
Department of Accountancy, Enugu State University of Science and Technology, Enugu
State, Nigeria.
3
Department of Accountancy, Enugu State University of Science and Technology, Enugu
State, Nigeria.
ABSTRACT
This work examined the effect of accounting ratios on investment performance of deposit
money banks in Nigeria. Five research objectives guided this study and they sought to:
determine the effect of capitalization ratio on return on equity (ROE); determine the effect
of credit risk ratio on return on equity (ROE); determine the effect of operating expenses
ratio on return on equity (ROE); determine the effect of liquidity ratio on return on equity
(ROE) of deposit money banks in Nigeria; and to determine the effect of bank size ratio on
return on equity (ROE) of deposit money banks in Nigeria. This research was carried out
using secondary data. Multiple regression analyses were used for testing the hypotheses.
The result reveals that capitalization ratio had negative and insignificant effect on return
on equity; credit risk ratio had positive and insignificant effect on return on equity;
operating expenses ratio had insignificant and positive effect on return on equity; liquidity
ratio had a negative and insignificant effect on return on equity; and that bank size had
significant and negative effect on return on equity of deposit money banks. It was
recommended, among other things, that the management of deposit money banks should
put more attention on their liquidity in order to maintain an adequate liquidity as the study
has empirically proved that higher liquidity signifies better performance, and that the
management should reduce the amount held in cash as current asset and concentrate more
in investing them, so that it could yield higher return rather than tie down the idle cash.
Key Word: Accounting Ratios, Investment Performance, and Multiple Regressions

www.idosr.org Okpe et al
102 IDOSR JOURNAL OF CURRENT ISSUES IN SOCIAL SCIENCES 4(1): 101-138, 2018.
INTRODUCTION
A financial ratio or accounting ratio is a
relative magnitude of two selected
numerical values taken from an
enterprise's financial statements [1].
Often used in accounting, there are many
standard ratios used to try to evaluate the
overall financial condition of a
corporation or other
organization. Financial ratios may be used
by managers within a firm, by current and
potential shareholders (owners) of a firm,
and by a firm's creditors. Financial
analysts use financial ratios to compare
the strengths and weaknesses in various
companies [2]. If shares in a company are
traded in a financial market, the market
price of the shares is used in
certain financial ratios.
Financial ratios are useful indicators of a
firm’s performance and financial
situation. They are the most powerful of
all the tools used in the analysis and
interpretation of financial statements.
Financial ratios can be used to analyze
trends and to compare the firm’s financial
performance to those of other firms. In
some cases, ratio analysis can be used to
predict future trend [3].
However, the determination of
appropriate standard against which a
company’s ratio may be compared is
often a difficult problem for financial
analyst [4]. To overcome this problem, a
firm’s financial ratio may be compared
against the ratios of other firms in the
same industry. Financial ratios serve as
important tool of evaluating the
performance and financial conditions of a
business entity over a period of time ,
empirical studies like [5] and [6]
demonstrated the usefulness of financial
ratios in this regard. [5] captured the
value of the accounting ratios when they
averred that financially distressed firms
can be separated from the non-failed
firms in the years before the declaration
of bankruptcy at an accurate rate of better
than 90% by examining financial ratios.
Financial ratios are tools of financial
analysis. In financial ratio evaluation is
normally done using the financial
information generated by the firm.
However, financial ratios can be classified
according to the information they
provide. The frequently used ratios are
Liquidity Ratio, Asset Turnover Ratio,

www.idosr.org Okpe et al
103 IDOSR JOURNAL OF CURRENT ISSUES IN SOCIAL SCIENCES 4(1): 101-138, 2018.
Financial Leverage Ratio, Profitability
Ratio and Dividend Policy Ratios [7].
The profitability ratio which is the major
ratio for analysis in this study as a
measure of performance can assist in
determining the different level of success
of the firms at generating profit. It is
against this backdrop that this work
intends to measure the investment
performance of deposit money banks in
Nigeria using financial or accounting
ratios.
STATEMENT OF PROBLEM
The financial sector consist of strings of
financial activities whose major end is
profit making, over the years the means
and manner of measuring this financial
performance remain issue of concern, the
variables to use in the measurement of
this performance is germane to growth
and stability, the issue therefore is
determining the variables to use in
financial performance measurement and
how well do these variables can measure
the performance in the financial sector in
the financial sector major identified
measure of performance include size,
capitalization, credit risk, operating
expenses or liquidity as far as the banking
sector is concern. The extent to wish each
of these variables and indicators measure
the performance over time is an issue of
concern and factor to bed evaluated
therefore it is the focus of the study to
examine the extent and how effective
these variables measure performance in
the banking industry.
OBJECTIVES OF THE STUDY
The broad objective of this study is to
examine the effect of accounting ratios on
investment performance of deposit
money banks in Nigeria. The specific
objectives include:
(1) To determine the effect of
capitalization ratio on return on
equity (ROE) of deposit money
banks in Nigeria
(2) To ascertain the effect of credit
risk ratio on return on equity (ROE)
of deposit money banks in Nigeria
(3) To examine the effect of operating
expenses ratio on return on equity
(ROE) of deposit money banks in
Nigeria
(4) To evaluate the effect of liquidity
ratio on return on equity (ROE) of
www.idosr.org Okpe et al
104 IDOSR JOURNAL OF CURRENT ISSUES IN SOCIAL SCIENCES 4(1): 101-138, 2018.
deposit money banks in Nigeria;
and
(5) To assess the effect of bank size
ratio on return on equity (ROE) of
deposit money banks in Nigeria;
RESEARCH QUESTIONS
The following questions guided
this study:
(1) What is the effect of capitalization
ratio on return on equity (ROE) of
deposit money banks in Nigeria?
(2) What is the effect of credit risk
ratio on return on equity (ROE) of
deposit money banks in Nigeria?
(3) What is the effect of operating
expenses ratio on return on equity
(ROE) of deposit money banks in
Nigeria?
(4) What is the effect of liquidity ratio
on return on equity (ROE) of
deposit money banks in Nigeria?
(5) What is the effect of bank size
ratio on return on equity (ROE) of
deposit money banks in Nigeria?
STATEMENT OF HYPOTHESES
The study has formulated the following
null hypotheses in order to bring about a
logical conclusion to the subject matter of
study:
(1) Capitalisation ratio has no
significant effect on return on
equity of deposit money banks
(2) Credit risk ratio has no significant
effect on return on equity of
deposit money banks
(3) Operating expenses ratio has no
significant effect on return on
equity of deposit money banks
(4) Liquidity ratio has no significant
effect on return on equity of
deposit money banks
(5) Bank size ratio has no significant
effect on return on equity of
deposit money banks
SIGNIFICANCE OF THE STUDY
Basically, this study will expatiate and in
greater details, the benefits that can be
www.idosr.org Okpe et al
105 IDOSR JOURNAL OF CURRENT ISSUES IN SOCIAL SCIENCES 4(1): 101-138, 2018.
derived from the application of financial
ratio analysis as tool for performance
measurement.
It will help to highlight various areas of
interest which includes profitability
trends on one hand and capitalisation,
liquidity, size and operating expenses on
the other hand. It will help the
organization in measuring performance in
the industry it operates. It will also help
auditors and banks managers identify the
ratios to emphasize in assessing their
performance.
Moreso, members of the academia will
benefit greatly from this study as it will
serve as reference material for this and
related subject matter.
SCOPE OF THE STUDY
This study expatriates the effect of
financial ratios like liquidity, size,
operating expenses, etc. on the return on
investment (equity) of banks in Nigeria.
Zenith Bank Plc, First Bank Plc and Fidelity
Bank Plc were the bank of study and data
covering ten years period will be collected
in this regard.
LIMITATION OF THE STUDY
In the course of this research work, the
researcher encountered some
bureaucratic problems which are very
peculiar to Nigeria banking industry.
Necessity calls for personal interaction
with personnel of the bank under study,
and the bureaucracy for booking and
meeting an appointment such personnel
was overwhelming.
The problem of bureaucracy became even
more serious considering the short
available for the completion of this study,
which leads to the issue of limited time.
Furthermore, necessary data were not
readily available. The annual reports of
the bank were hard to come by, and they
placed a grave financial burden on the
researcher.
www.idosr.org Okpe et al
106 IDOSR JOURNAL OF CURRENT ISSUES IN SOCIAL SCIENCES 4(1): 101-138, 2018.
RESEARCH METHODOLOGY
Research Design
The project is an ex- post facto research
design which provides a systematic and
empirical solution to research problems,
by using data which are already in
existence.
Population of the Study
The population of the study is comprises
of all deposit money banks quoted on the
floor of the Nigeria Stock Exchange.
Sample Size of the Study
For the purpose of this study, three
deposit money banks were selected. They
include Zenith Bank Plc, First Bank Plc and
Fidelity bank Plc were chosen for data
analysis covering the period 2007 to 2016
(i.e. ten years period). These banking
firms were selected because of their data
are readily available and they are
prominent firms in the Nigeria banking
industry.
Sources of Data
Data for analysis on accounting ratios and
financial performance of deposit banks in
Nigeria were extracted from the quarterly
reports and accounts of Zenith bank Plc,
First Bank Plc and Fidelity Bank Plc. Data
for analysis on captialisation ratio, credit
risk ratio, operating expenses ratio,
liquidity ratio and bank size were
extracted from the banks’ annual reports
and accounts.
Model Specification
Multiple regression models were used to
find the correlation between accounting
ratios and profitability of banks; The base
models took the following form:
ROEit
= β0
+ β1
CAPit
+ β2
LQit
+ β3
OERit
β4
CRit
+
β5
SIZEit
+µit
Where:
ROE is return on equity
representing the the dependent
variable.
β0
is the intercept.
β1
– β5
are the slopes
CAP is capitalization ration
(independent variable)
LQ is liquidity ratio (independent
variable)
OER is operating expense ratio
(independent variable)
CR is credit risks ratio
(independent variable)

www.idosr.org Okpe et al
107 IDOSR JOURNAL OF CURRENT ISSUES IN SOCIAL SCIENCES 4(1): 101-138, 2018.
SIZE is bank size (independent
variable)
µit
are the error terms or variations
that cannot be explained by the
above model.
i is the number of firms and
t is the number of time periods.
Description of Variables
(1) Capitalization ratio:
The capitalization ratio measures the debt
component of a company's capital
structure, or capitalization (i.e., the sum
of long-term
debt liabilities and shareholders' equity)
to support a company's operations and
growth. This ratio is considered to be one
of the more meaningful of the "debt"
ratios - it delivers the key insight into a
company's use of leverage.
(2) Credit Risk Ratio
. If a bank's credit quality is in decline
because of non-performing loans and
assets and/or charge-offs increases, the
bank's earnings and capital may be at
risk. A non-performing loan is a loan
where payments of interest or principal
are overdue by 90 days or more, and it is
typically presented as a percentage of
outstanding loans. It can be calculated as:
The ratio of the total loans to total
assets
The ratio of the non performing
loans to the total loans
The ratio of the loan losses to the
total loans
(3) Operating Expenses Ratio
The operating expense ratio (OER) is a
measure of what it costs to operate a
piece of property compared to the income
that the property brings in. The operating
expense ratio is calculated by dividing a
property's operating expense by its gross
operating income and used for comparing
the expenses of similar properties. It is
also referred to as cost to income ratio or
efficiency ratio. The formula for
calculating OER is operating expenses /
revenues i.e.
(4) Liquidity Ratio
Liquidity Ratio: are used to measure a
firm’s ability to meet its most current
obligations as they come due. Two

www.idosr.org Okpe et al
108 IDOSR JOURNAL OF CURRENT ISSUES IN SOCIAL SCIENCES 4(1): 101-138, 2018.
commonly used liquidity ratios are presented here:
(5) Bank Size Ratio
Bank size is a measure of bank’s
total assets. Bank size ratio is
calculated as the log
transformation of the bank total
assets.
(6) Return on Equity (ROE)
In corporate finance, the return on
equity (ROE) is a measure of the
profitability of a business in relation to
the book value of shareholder equity, also
known as net assets or assets minus
liabilities. ROE is a measure of how well a
company uses investments to generate
earnings growth. It is usually calculated
using the following formulae

www.idosr.org Okpe et al
109 IDOSR JOURNAL OF CURRENT ISSUES IN SOCIAL SCIENCES 4(1): 101-138, 2018.
PRESENTATION AND ANALYSIS OF DATA
Table 1: Time Series Data of the Variables – Zenith Bank Plc
YEARS ROE CAP.
RATIO
(CAPR)
CREDIT
RISK
(CRR)
OP. EXP.
RATIO
(OER)
LIQUIDITY
RATIO
(LR)
BANK
SIZE
RATIO
(BSIZE)
2007 0.1551 0.8724 0.2961 0.7319 1.073 5.989
2008 0.1374 0.7986 0.2494 0.6175 1.525 6.252
2009 0.0559 0.7913 0.4254 0.4069 1.294 6.220
2010 0.0951 0.8042 0.3732 0.5259 1.310 6.278
2011 0.1417 0.8325 0.3813 0.5034 1.228 6.367
2012 0.235 0.8202 0.3674 0.3979 1.231 6.416
2013 0.196 0.8358 0.3913 0.2315 1.321 6.497
2014 0.188 0.8503 0.4615 0.2026 1.434 6.575
2015 0.184 0.8541 0.4931 0.2102 1.259 6.603
2016 0.200 0.8561 0.4991 0.1856 1.200 6.676
Source: Researchers Computation from Annual Report and Accounts, 2016.
In Table 1, the time series data indicate
that the focal and explanatory variables
which are return on equity, capitalization
ratio, credit risk ratio, operational
expenses ratio, liquidity ratio and bank
size ratio have some level of linearity
among them. This linearity or otherwise
has been revealed in subsequent analysis.
Table 2 Descriptive Statistics of the variables – Zenith Bank Plc
ROE BSIZE CAPR CRR LR OER
Mean 0.158820 6.387300 0.831550 0.393780 1.287500 0.401340
Median 0.169550 6.391500 0.834150 0.386300 1.276500 0.402400
Maximum 0.235000 6.676000 0.872400 0.499100 1.525000 0.731900
Minimum 0.055900 5.989000 0.791300 0.249400 1.073000 0.185600
Std. Dev. 0.053526 0.209566 0.027352 0.080423 0.125056 0.192467
Skewness -0.580166 -0.376753 -0.124790 -0.333365 0.337559 0.319394
Kurtosis 2.535389 2.363639 1.744792 2.268379 2.949292 1.832273
Jarque-Bera 0.650931 0.405302 0.682432 0.408250 0.190981 0.738182
Probability 0.722191 0.816563 0.710905 0.815361 0.908927 0.691362
Sum 1.588200 63.87300 8.315500 3.937800 12.87500 4.013400
Sum Sq. Dev. 0.025786 0.395260 0.006733 0.058211 0.140750 0.333391
Observations 10 10 10 10 10 10

www.idosr.org Okpe et al
110 IDOSR JOURNAL OF CURRENT ISSUES IN SOCIAL SCIENCES 4(1): 101-138, 2018.
Source: Researcher’s computation using Eviews, 2017.
Table 2 reveals, most importantly, the
mean, maximum and minimum values for
the series. While the mean of the series
stood at 0.15%, 6.39%, 0.83%, 0.39%, 1.28%
and 0.40% for ROE, BSIZE, CAPR, CRR, LR
and OER respectively, the maximum of
the series stood at 0.24%, 6.68%, 0.87%,
0.49%, 1.53% and 0.731% respectively.
The minimum of the series stood at
0.056%, 5.99%, 0.791%, 0.249%, 1.07% and
0.195% for ROE, BSIZE, CAPR, CRR, LR and
OER respectively.
The skewness for all variables are below
4, which shows that all the variables are
within normal frequency distribution. The
probability for the Jarque-Bera
coefficients shows that none of the
variables has significant contribution.
This is in line with the skewness.

www.idosr.org Okpe et al
111 IDOSR JOURNAL OF CURRENT ISSUES IN SOCIAL SCIENCES 4(1): 101-138, 2018.
FIGURE:1 Line Graph of Focal And Explanatory Variables – Zenith Bank Plc
5.8
6.0
6.2
6.4
6.6
6.8
07 08 09 10 11 12 13 14 15 16
BSIZE
.78
.80
.82
.84
.86
.88
07 08 09 10 11 12 13 14 15 16
CAPR
.24
.28
.32
.36
.40
.44
.48
.52
07 08 09 10 11 12 13 14 15 16
CRR
1.0
1.1
1.2
1.3
1.4
1.5
1.6
07 08 09 10 11 12 13 14 15 16
LR
.1
.2
.3
.4
.5
.6
.7
.8
07 08 09 10 11 12 13 14 15 16
OER
.04
.08
.12
.16
.20
.24
07 08 09 10 11 12 13 14 15 16
ROE
Source: Researcher’s computation using Eviews, 2017.
Fig. 1 shows that liquidity ration (LR) and
operational expenses ratio (OER) have
similar pattern of movement, while return
on equity (ROE) and credit risk ratio (CRR)
have similar pattern of movement from
2007 to 2016. This implies that there are
some degrees of association between

www.idosr.org Okpe et al
112 IDOSR JOURNAL OF CURRENT ISSUES IN SOCIAL SCIENCES 4(1): 101-138, 2018.
them which will be revealed in the output below.
Table 3 Regression analysis – Zenith Bank Plc
Variable Coefficient Std. Error t-Statistic Prob.
C -1.249382 0.894900 -1.396114 0.2352
BSIZE 0.242619 0.126457 1.918587 0.1275
CAPR 0.699038 0.462999 1.509805 0.2056
CRR -0.940922 0.298172 -3.155632 0.0343
LR -0.204418 0.118743 -1.721512 0.1603
OER -0.221906 0.176541 -1.256966 0.2772
R-squared 0.880415 Mean dependent var 0.158820
Adjusted R-squared 0.730934 S.D. dependent var 0.053526
S.E. of regression 0.027765 Akaike info criterion -4.046376
Sum squared resid 0.003084 Schwarz criterion -3.864825
Log likelihood 26.23188 Hannan-Quinn criter. -4.245537
F-statistic 5.889796 Durbin-Watson stat 3.245518
Prob(F-statistic) 0.055254
Source: Researcher’s Computation using Eview, 2017.
Interpretation of Regression Coefficient Result
In Table 4, the regression result indicates
that bank size (BSIZE) and capitalization
ratio (CAPR) have positive and
insignificant effect on return on equity
(ROE). This was evidenced as they have
positive coefficients and p-values of
0.1275 and 0.2056 respectively, which are
greater than 0.05. Credit risk ratio (CRR),
liquidity ratio (LR) and operational
expenses ratio (OER) have negative
coefficients indicating a negative effect
on ROE. P-values of CRR is <0.05 and
those of LR and OER are >0.05 indicating a
significant effect for CRR and
insignificant effect for both LR and OER.
www.idosr.org Okpe et al
113 IDOSR JOURNAL OF CURRENT ISSUES IN SOCIAL SCIENCES 4(1): 101-138, 2018.
FIRST BANK PLC
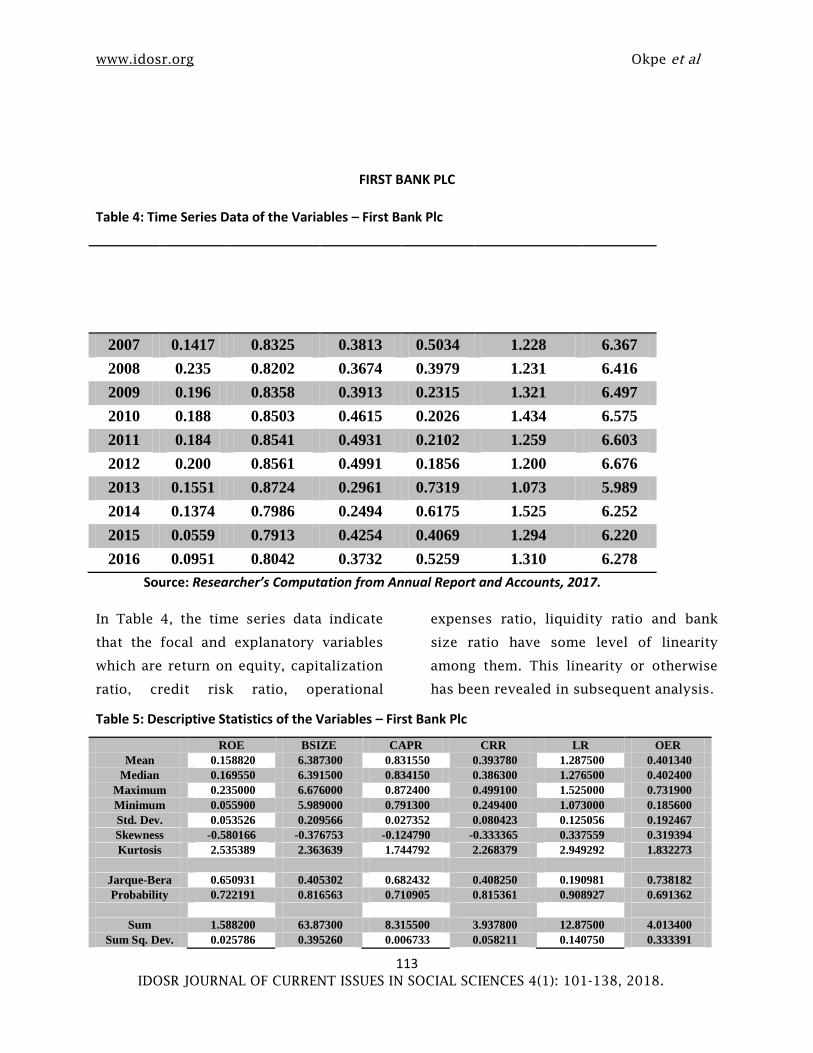
Table 4: Time Series Data of the Variables – First Bank Plc
YEARS ROE CAP.
RATIAPR)
CREDIT
RISO
(CRR)
OP.
EXP.
RATIO
(OER)
LIQUIDITY
RATIO
(LR)
BANK
SIZE
RATIO
(BSIZE)
2007 0.1417 0.8325 0.3813 0.5034 1.228 6.367
2008 0.235 0.8202 0.3674 0.3979 1.231 6.416
2009 0.196 0.8358 0.3913 0.2315 1.321 6.497
2010 0.188 0.8503 0.4615 0.2026 1.434 6.575
2011 0.184 0.8541 0.4931 0.2102 1.259 6.603
2012 0.200 0.8561 0.4991 0.1856 1.200 6.676
2013 0.1551 0.8724 0.2961 0.7319 1.073 5.989
2014 0.1374 0.7986 0.2494 0.6175 1.525 6.252
2015 0.0559 0.7913 0.4254 0.4069 1.294 6.220
2016 0.0951 0.8042 0.3732 0.5259 1.310 6.278
Source: Researcher’s Computation from Annual Report and Accounts, 2017.
In Table 4, the time series data indicate
that the focal and explanatory variables
which are return on equity, capitalization
ratio, credit risk ratio, operational
expenses ratio, liquidity ratio and bank
size ratio have some level of linearity
among them. This linearity or otherwise
has been revealed in subsequent analysis.
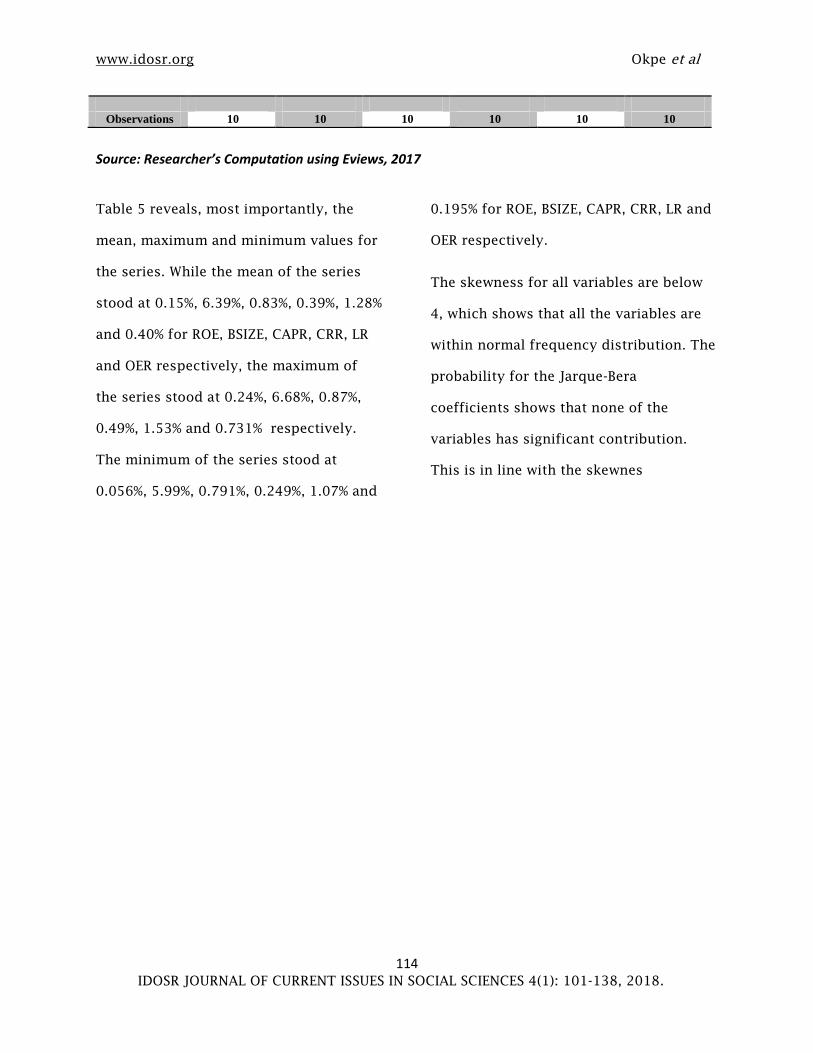
Table 5: Descriptive Statistics of the Variables – First Bank Plc
ROE BSIZE CAPR CRR LR OER
Mean 0.158820 6.387300 0.831550 0.393780 1.287500 0.401340
Median 0.169550 6.391500 0.834150 0.386300 1.276500 0.402400
Maximum 0.235000 6.676000 0.872400 0.499100 1.525000 0.731900
Minimum 0.055900 5.989000 0.791300 0.249400 1.073000 0.185600
Std. Dev. 0.053526 0.209566 0.027352 0.080423 0.125056 0.192467
Skewness -0.580166 -0.376753 -0.124790 -0.333365 0.337559 0.319394
Kurtosis 2.535389 2.363639 1.744792 2.268379 2.949292 1.832273
Jarque-Bera 0.650931 0.405302 0.682432 0.408250 0.190981 0.738182
Probability 0.722191 0.816563 0.710905 0.815361 0.908927 0.691362
Sum 1.588200 63.87300 8.315500 3.937800 12.87500 4.013400
Sum Sq. Dev. 0.025786 0.395260 0.006733 0.058211 0.140750 0.333391
www.idosr.org Okpe et al
114 IDOSR JOURNAL OF CURRENT ISSUES IN SOCIAL SCIENCES 4(1): 101-138, 2018.
Observations 10 10 10 10 10 10
Source: Researcher’s Computation using Eviews, 2017
Table 5 reveals, most importantly, the
mean, maximum and minimum values for
the series. While the mean of the series
stood at 0.15%, 6.39%, 0.83%, 0.39%, 1.28%
and 0.40% for ROE, BSIZE, CAPR, CRR, LR
and OER respectively, the maximum of
the series stood at 0.24%, 6.68%, 0.87%,
0.49%, 1.53% and 0.731% respectively.
The minimum of the series stood at
0.056%, 5.99%, 0.791%, 0.249%, 1.07% and
0.195% for ROE, BSIZE, CAPR, CRR, LR and
OER respectively.
The skewness for all variables are below
4, which shows that all the variables are
within normal frequency distribution. The
probability for the Jarque-Bera
coefficients shows that none of the
variables has significant contribution.
This is in line with the skewnes
www.idosr.org Okpe et al
115 IDOSR JOURNAL OF CURRENT ISSUES IN SOCIAL SCIENCES 4(1): 101-138, 2018.
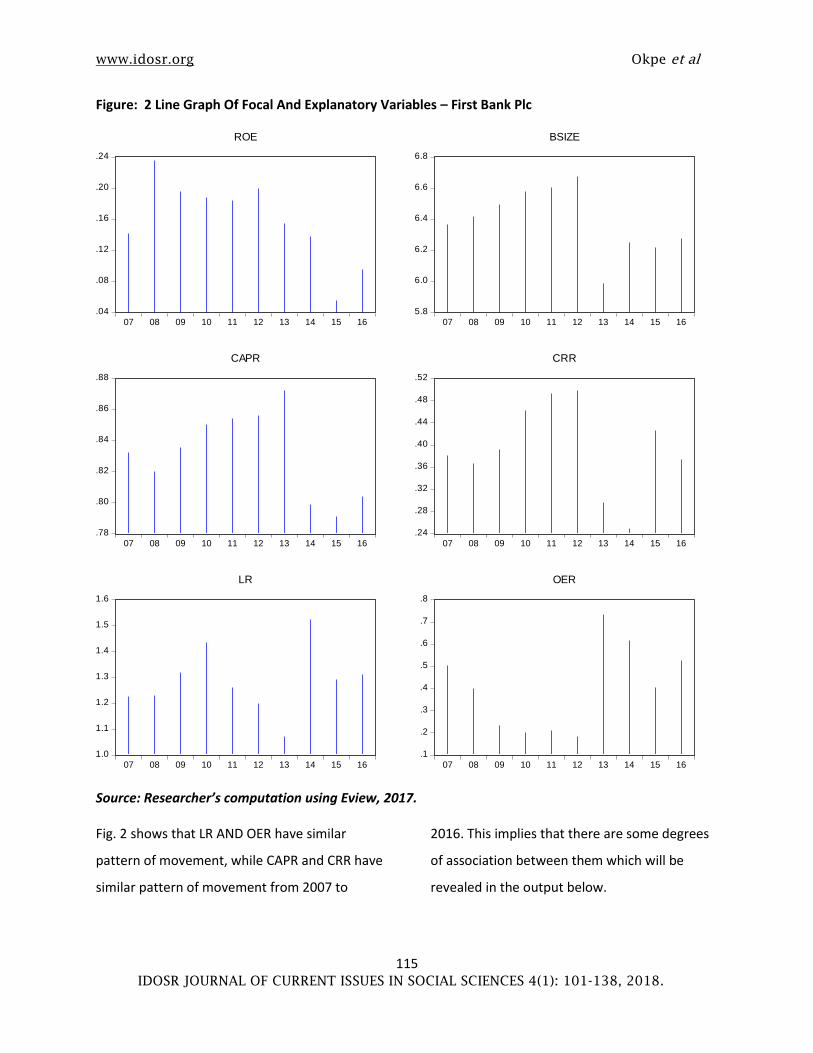
Figure: 2 Line Graph Of Focal And Explanatory Variables – First Bank Plc
.04
.08
.12
.16
.20
.24
07 08 09 10 11 12 13 14 15 16
ROE
5.8
6.0
6.2
6.4
6.6
6.8
07 08 09 10 11 12 13 14 15 16
BSIZE
.78
.80
.82
.84
.86
.88
07 08 09 10 11 12 13 14 15 16
CAPR
.24
.28
.32
.36
.40
.44
.48
.52
07 08 09 10 11 12 13 14 15 16
CRR
1.0
1.1
1.2
1.3
1.4
1.5
1.6
07 08 09 10 11 12 13 14 15 16
LR
.1
.2
.3
.4
.5
.6
.7
.8
07 08 09 10 11 12 13 14 15 16
OER
Source: Researcher’s computation using Eview, 2017.
Fig. 2 shows that LR AND OER have similar
pattern of movement, while CAPR and CRR have
similar pattern of movement from 2007 to
2016. This implies that there are some degrees
of association between them which will be
revealed in the output below.
www.idosr.org Okpe et al
116 IDOSR JOURNAL OF CURRENT ISSUES IN SOCIAL SCIENCES 4(1): 101-138, 2018.
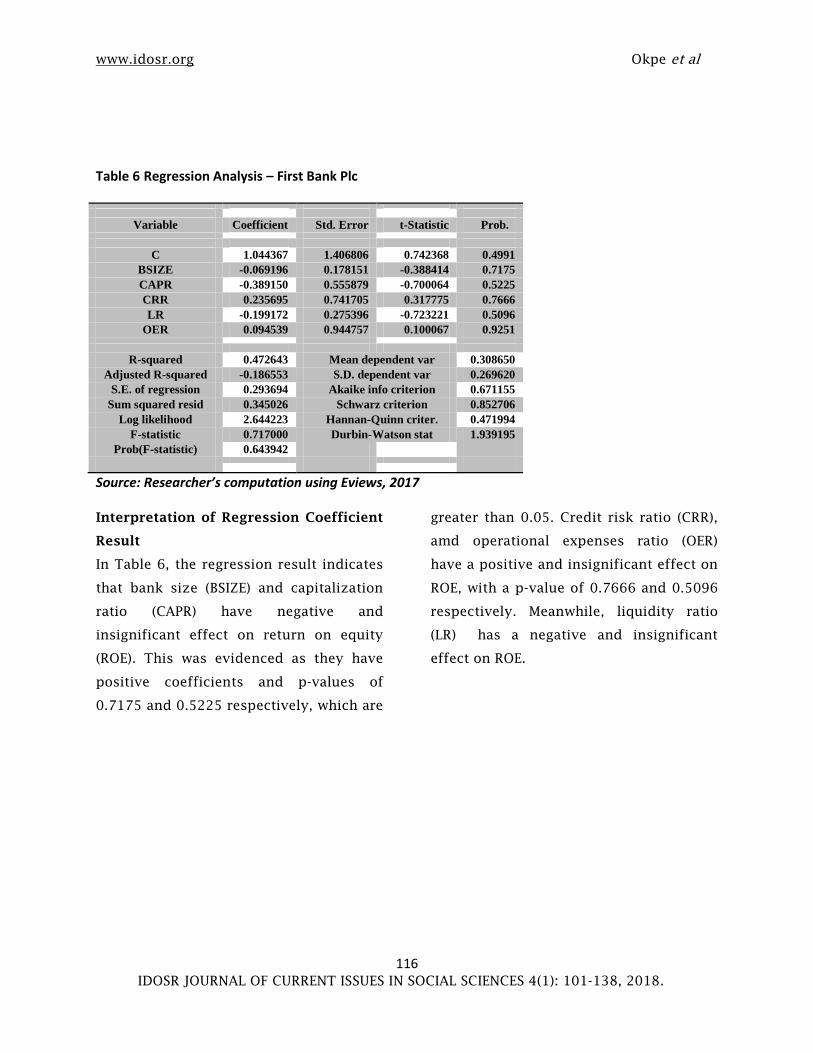
Table 6 Regression Analysis – First Bank Plc
Variable Coefficient Std. Error t-Statistic Prob.
C 1.044367 1.406806 0.742368 0.4991
BSIZE -0.069196 0.178151 -0.388414 0.7175
CAPR -0.389150 0.555879 -0.700064 0.5225
CRR 0.235695 0.741705 0.317775 0.7666
LR -0.199172 0.275396 -0.723221 0.5096
OER 0.094539 0.944757 0.100067 0.9251
R-squared 0.472643 Mean dependent var 0.308650
Adjusted R-squared -0.186553 S.D. dependent var 0.269620
S.E. of regression 0.293694 Akaike info criterion 0.671155
Sum squared resid 0.345026 Schwarz criterion 0.852706
Log likelihood 2.644223 Hannan-Quinn criter. 0.471994
F-statistic 0.717000 Durbin-Watson stat 1.939195
Prob(F-statistic) 0.643942
Source: Researcher’s computation using Eviews, 2017
Interpretation of Regression Coefficient
Result
In Table 6, the regression result indicates
that bank size (BSIZE) and capitalization
ratio (CAPR) have negative and
insignificant effect on return on equity
(ROE). This was evidenced as they have
positive coefficients and p-values of
0.7175 and 0.5225 respectively, which are
greater than 0.05. Credit risk ratio (CRR),
amd operational expenses ratio (OER)
have a positive and insignificant effect on
ROE, with a p-value of 0.7666 and 0.5096
respectively. Meanwhile, liquidity ratio
(LR) has a negative and insignificant
effect on ROE.
www.idosr.org Okpe et al
117 IDOSR JOURNAL OF CURRENT ISSUES IN SOCIAL SCIENCES 4(1): 101-138, 2018.
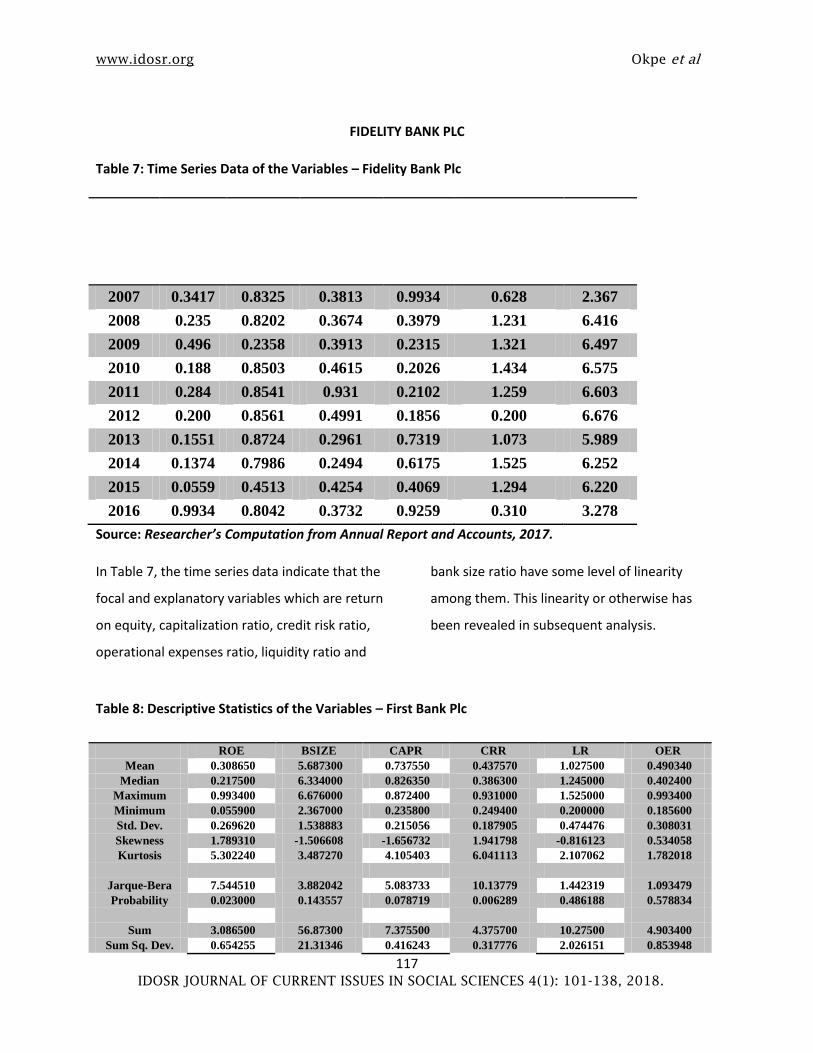
FIDELITY BANK PLC
Table 7: Time Series Data of the Variables – Fidelity Bank Plc
YEARS ROE CAP.
RATIO
(CAPR)
CREDIT
RISK
RATIO
(CRR)
OP.
EXP.
RATIO
(OER)
LIQUIDITY
RATIO
(LR)
BANK
SIZE
RATIO
(BSIZE)
2007 0.3417 0.8325 0.3813 0.9934 0.628 2.367
2008 0.235 0.8202 0.3674 0.3979 1.231 6.416
2009 0.496 0.2358 0.3913 0.2315 1.321 6.497
2010 0.188 0.8503 0.4615 0.2026 1.434 6.575
2011 0.284 0.8541 0.931 0.2102 1.259 6.603
2012 0.200 0.8561 0.4991 0.1856 0.200 6.676
2013 0.1551 0.8724 0.2961 0.7319 1.073 5.989
2014 0.1374 0.7986 0.2494 0.6175 1.525 6.252
2015 0.0559 0.4513 0.4254 0.4069 1.294 6.220
2016 0.9934 0.8042 0.3732 0.9259 0.310 3.278
Source: Researcher’s Computation from Annual Report and Accounts, 2017.
In Table 7, the time series data indicate that the
focal and explanatory variables which are return
on equity, capitalization ratio, credit risk ratio,
operational expenses ratio, liquidity ratio and
bank size ratio have some level of linearity
among them. This linearity or otherwise has
been revealed in subsequent analysis.
Table 8: Descriptive Statistics of the Variables – First Bank Plc
ROE BSIZE CAPR CRR LR OER
Mean 0.308650 5.687300 0.737550 0.437570 1.027500 0.490340
Median 0.217500 6.334000 0.826350 0.386300 1.245000 0.402400
Maximum 0.993400 6.676000 0.872400 0.931000 1.525000 0.993400
Minimum 0.055900 2.367000 0.235800 0.249400 0.200000 0.185600
Std. Dev. 0.269620 1.538883 0.215056 0.187905 0.474476 0.308031
Skewness 1.789310 -1.506608 -1.656732 1.941798 -0.816123 0.534058
Kurtosis 5.302240 3.487270 4.105403 6.041113 2.107062 1.782018
Jarque-Bera 7.544510 3.882042 5.083733 10.13779 1.442319 1.093479
Probability 0.023000 0.143557 0.078719 0.006289 0.486188 0.578834
Sum 3.086500 56.87300 7.375500 4.375700 10.27500 4.903400
Sum Sq. Dev. 0.654255 21.31346 0.416243 0.317776 2.026151 0.853948
www.idosr.org Okpe et al
118 IDOSR JOURNAL OF CURRENT ISSUES IN SOCIAL SCIENCES 4(1): 101-138, 2018.
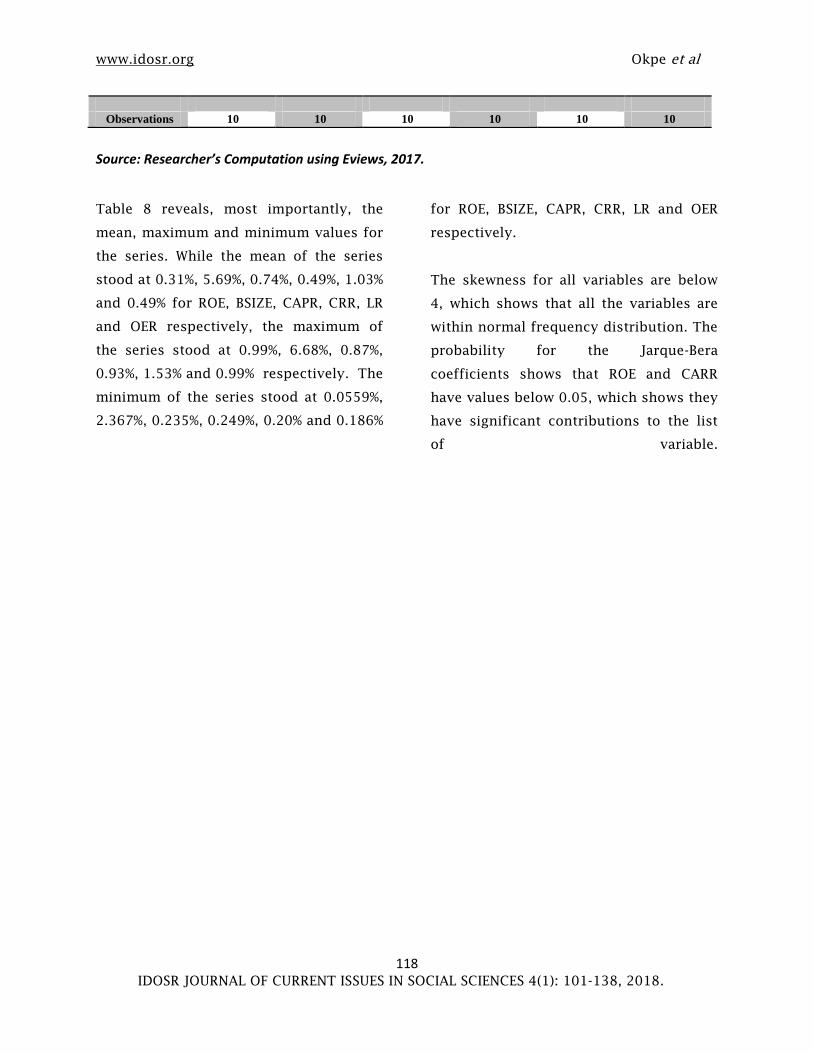
Observations 10 10 10 10 10 10
Source: Researcher’s Computation using Eviews, 2017.
Table 8 reveals, most importantly, the
mean, maximum and minimum values for
the series. While the mean of the series
stood at 0.31%, 5.69%, 0.74%, 0.49%, 1.03%
and 0.49% for ROE, BSIZE, CAPR, CRR, LR
and OER respectively, the maximum of
the series stood at 0.99%, 6.68%, 0.87%,
0.93%, 1.53% and 0.99% respectively. The
minimum of the series stood at 0.0559%,
2.367%, 0.235%, 0.249%, 0.20% and 0.186%
for ROE, BSIZE, CAPR, CRR, LR and OER
respectively.
The skewness for all variables are below
4, which shows that all the variables are
within normal frequency distribution. The
probability for the Jarque-Bera
coefficients shows that ROE and CARR
have values below 0.05, which shows they
have significant contributions to the list
of variable.

www.idosr.org Okpe et al
119 IDOSR JOURNAL OF CURRENT ISSUES IN SOCIAL SCIENCES 4(1): 101-138, 2018.
Figure: 3 Line Graph of Focal and Explanatory Variables – First Bank Plc
0.0
0.2
0.4
0.6
0.8
1.0
07 08 09 10 11 12 13 14 15 16
ROE
2
3
4
5
6
7
07 08 09 10 11 12 13 14 15 16
BSIZE
.2
.3
.4
.5
.6
.7
.8
.9
07 08 09 10 11 12 13 14 15 16
CAPR
0.2
0.4
0.6
0.8
1.0
07 08 09 10 11 12 13 14 15 16
CRR
0.0
0.4
0.8
1.2
1.6
07 08 09 10 11 12 13 14 15 16
LR
0.0
0.2
0.4
0.6
0.8
1.0
07 08 09 10 11 12 13 14 15 16
OER
Source: Researcher’s computation using Eviews, 2017.
Fig. 3: shows that LR and OER have similar
pattern of movement, while CAPR and CRR have
similar pattern of movement from 2007 to
2016. This implies that there are some degrees
of association between them which will be
revealed in the output below.

www.idosr.org Okpe et al
120 IDOSR JOURNAL OF CURRENT ISSUES IN SOCIAL SCIENCES 4(1): 101-138, 2018.
Table 9: Regression Analysis – Fidelity Bank Plc
Variable Coefficient Std. Error t-Statistic Prob.
C -1.249382 0.894900 -1.396114 0.2352
BSIZE 0.242619 0.126457 1.918587 0.1275
CAPR 0.699038 0.462999 1.509805 0.2056
CRR -0.940922 0.298172 -3.155632 0.0343
LR -0.204418 0.118743 -1.721512 0.1603
OER -0.221906 0.176541 -1.256966 0.2772
R-squared 0.880415 Mean dependent var 0.158820
Adjusted R-squared 0.730934 S.D. dependent var 0.053526
S.E. of regression 0.027765 Akaike info criterion -4.046376
Sum squared resid 0.003084 Schwarz criterion -3.864825
Log likelihood 26.23188 Hannan-Quinn criter. -4.245537
F-statistic 5.889796 Durbin-Watson stat 3.289320
Prob(F-statistic) 0.055254
Source: Researcher’s computation using Eviews, 2017
Interpretation of Regression Coefficient Result
In Table 6, the regression result indicates that
bank size (BSIZE) and capitalization ratio (CAPR)
have positive and insignificant effect on return
on equity (ROE). This was evidenced as they
have positive coefficients and p-values of
0.1275 and 0.2056 respectively, which are
greater than 0.05. Credit risk ratio (CRR),
liquidity ratio (LR) and operational expenses
ratio (OER) have negative coefficients indicating
a negative effect on ROE. P-values of CRR is
<0.05 and those of LR and OER are >0.05
indicating a significant effect for CRR and
insignificant effect for both LR and OER.
www.idosr.org Okpe et al
121 IDOSR JOURNAL OF CURRENT ISSUES IN SOCIAL SCIENCES 4(1): 101-138, 2018.
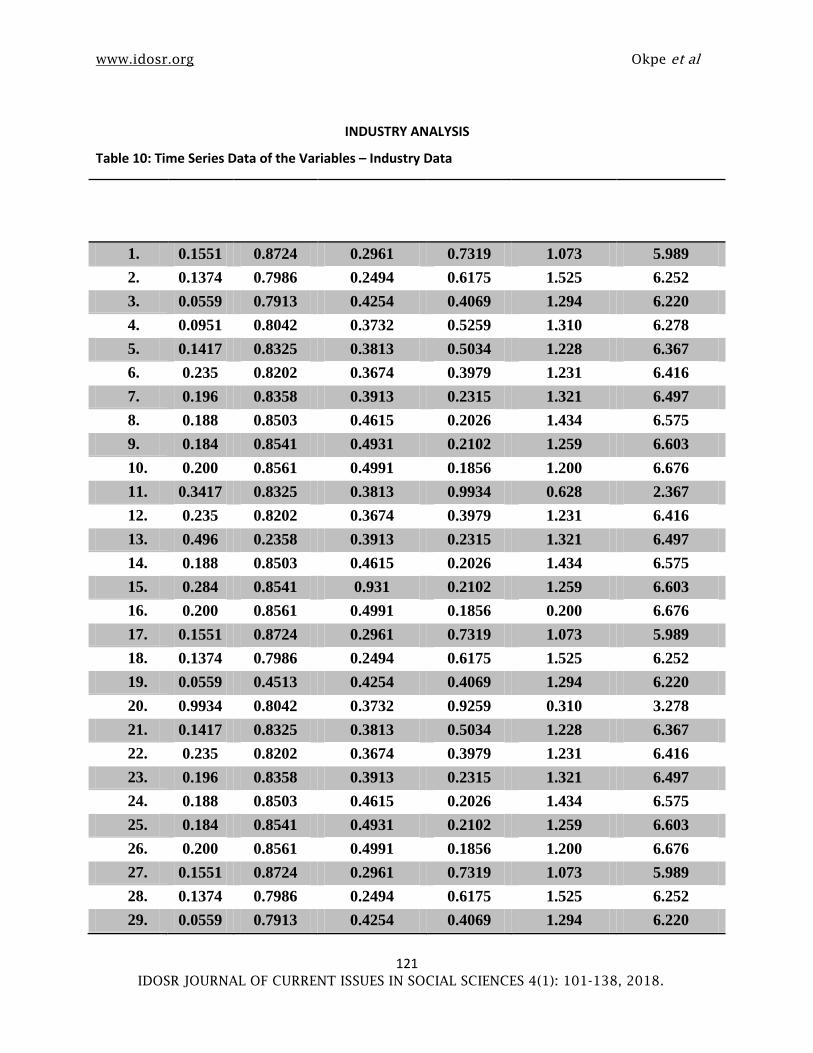
INDUSTRY ANALYSIS
Table 10: Time Series Data of the Variables – Industry Data
S/n ROE CAP.
RATIO
(CAPR)
CREDIT
RISK RATIO
(CRR)
OP. EXP.
RATIO
(OER)
LIQUIDITY
RATIO
(LR)
BANK SIZE
RATIO
(BSIZE)
1. 0.1551 0.8724 0.2961 0.7319 1.073 5.989
2. 0.1374 0.7986 0.2494 0.6175 1.525 6.252
3. 0.0559 0.7913 0.4254 0.4069 1.294 6.220
4. 0.0951 0.8042 0.3732 0.5259 1.310 6.278
5. 0.1417 0.8325 0.3813 0.5034 1.228 6.367
6. 0.235 0.8202 0.3674 0.3979 1.231 6.416
7. 0.196 0.8358 0.3913 0.2315 1.321 6.497
8. 0.188 0.8503 0.4615 0.2026 1.434 6.575
9. 0.184 0.8541 0.4931 0.2102 1.259 6.603
10. 0.200 0.8561 0.4991 0.1856 1.200 6.676
11. 0.3417 0.8325 0.3813 0.9934 0.628 2.367
12. 0.235 0.8202 0.3674 0.3979 1.231 6.416
13. 0.496 0.2358 0.3913 0.2315 1.321 6.497
14. 0.188 0.8503 0.4615 0.2026 1.434 6.575
15. 0.284 0.8541 0.931 0.2102 1.259 6.603
16. 0.200 0.8561 0.4991 0.1856 0.200 6.676
17. 0.1551 0.8724 0.2961 0.7319 1.073 5.989
18. 0.1374 0.7986 0.2494 0.6175 1.525 6.252
19. 0.0559 0.4513 0.4254 0.4069 1.294 6.220
20. 0.9934 0.8042 0.3732 0.9259 0.310 3.278
21. 0.1417 0.8325 0.3813 0.5034 1.228 6.367
22. 0.235 0.8202 0.3674 0.3979 1.231 6.416
23. 0.196 0.8358 0.3913 0.2315 1.321 6.497
24. 0.188 0.8503 0.4615 0.2026 1.434 6.575
25. 0.184 0.8541 0.4931 0.2102 1.259 6.603
26. 0.200 0.8561 0.4991 0.1856 1.200 6.676
27. 0.1551 0.8724 0.2961 0.7319 1.073 5.989
28. 0.1374 0.7986 0.2494 0.6175 1.525 6.252
29. 0.0559 0.7913 0.4254 0.4069 1.294 6.220

www.idosr.org Okpe et al
122 IDOSR JOURNAL OF CURRENT ISSUES IN SOCIAL SCIENCES 4(1): 101-138, 2018.
30. 0.0951 0.8042 0.3732 0.5259 1.310 6.278
Source: Researcher’s Computation, 2017.
Table 11: Descriptive Statistics of the Variables - Industry Data
ROE BSIZE CAPR CRR LR OER
Mean 0.208763 6.153967 0.800217 0.408377 1.200833 0.431007
Median 0.186000 6.391500 0.832500 0.386300 1.259000 0.402400
Maximum 0.993400 6.676000 0.872400 0.931000 1.525000 0.993400
Minimum 0.055900 2.367000 0.235800 0.249400 0.200000 0.185600
Std. Dev. 0.171754 0.935334 0.129803 0.124150 0.308406 0.232937
Skewness 3.417603 -3.299714 -3.521137 2.381903 -2.095350 0.739180
Kurtosis 15.91705 12.79765 14.63494 11.61322 7.037392 2.658231
Jarque-Bera 266.9629 174.4330 231.2069 121.1017 42.32813 2.877946
Probability 0.000000 0.000000 0.000000 0.000000 0.000000 0.237171
Sum 6.262900 184.6190 24.00650 12.25130 36.02500 12.93020
Sum Sq. Dev. 0.855486 25.37065 0.488616 0.446982 2.758318 1.573536
Observations 30 30 30 30 30 30
Source: Researcher’s Computation using Eviews, 2017
In Table 11: the descriptive statistics was
computed as it relates to industry data for
all the variables that operationalized the
study in a common sample.

www.idosr.org Okpe et al
123 IDOSR JOURNAL OF CURRENT ISSUES IN SOCIAL SCIENCES 4(1): 101-138, 2018.
Figure 3: Line Graph of Focal and Explanatory Variables –Industry Data
0.0
0.2
0.4
0.6
0.8
1.0
2007 2036
ROE
2
3
4
5
6
7
2007 2036
BSIZE
.2
.3
.4
.5
.6
.7
.8
.9
2007 2036
CAPR
0.2
0.4
0.6
0.8
1.0
2007 2036
CRR
0.0
0.4
0.8
1.2
1.6
2007 2036
LR
0.0
0.2
0.4
0.6
0.8
1.0
2007 2036
OER
Source: Researcher’s computation using Eviews, 2017
Fig. 4 shows that LR and OER have similar
pattern of movement, while CAPR and CRR have
similar pattern of movement from 2007 to
2016. This implies that there are some degrees
of association between them which will be
revealed in the output below.
2016 2016
2016 2016

www.idosr.org Okpe et al
124 IDOSR JOURNAL OF CURRENT ISSUES IN SOCIAL SCIENCES 4(1): 101-138, 2018.
Table12: Regression Analysis Results – Industry Data
Variable Coefficient Std. Error t-Statistic Prob.
C 1.421296 0.424898 3.345029 0.0027
BSIZE -0.115258 0.051292 -2.247067 0.0341
CAPR -0.289696 0.195163 -1.484380 0.1507
CRR 0.050685 0.273336 0.185433 0.8544
LR -0.172182 0.102558 -1.678880 0.1062
OER -0.198044 0.219289 -0.903119 0.3754
R-squared 0.515753 Mean dependent var 0.208763
Adjusted R-squared 0.414868 S.D. dependent var 0.171754
S.E. of regression 0.131382 Akaike info criterion -1.044566
Sum squared resid 0.414267 Schwarz criterion -0.764326
Log likelihood 21.66849 Hannan-Quinn criter. -0.954915
F-statistic 5.112296 Durbin-Watson stat 2.562001
Prob(F-statistic) 0.002483
Source: Researcher’s computation using Eviews, 2017
Interpretation of Regression Coefficient Result
In Table 12, the regression result
indicates that return on equity is
negatively influenced by bank size,
capitalization ratio, and liquidity ratio.
The extent of the influence exerted on
ROE by BSIZE is significant and negative,
capitalization ratio and liquidity ratio
exerts insignificant effects on ROE
equivalent while liquidity ratio and
operational expenses had insignificant
and positive effects on return on equity
equivalent. This was evidenced at 5 per
cent level of significance at a p-value of
0.0341, 0.1507, 0.8544, 0.1062 and
0.3754 respective for BSIZE, CAPR, CRR,
LR and OER respectively. The Durbin
Watson statistics shows that the data have
no serial correlation. The adjusted R2
is
0.414868 and this reveals that about 41%
of the variations in return on equity could
be explained by CAPR, CRR LR and OER
while 59% could be explained by other
factors.
Test of Hypotheses
Hypothesis One
Ho:
Capitalisation ratio has no significant
effect on return on equity of
deposit money banks
HI
: Capitalisation ratio has significant
effect on return on equity of
deposit money banks
www.idosr.org Okpe et al
125 IDOSR JOURNAL OF CURRENT ISSUES IN SOCIAL SCIENCES 4(1): 101-138, 2018.
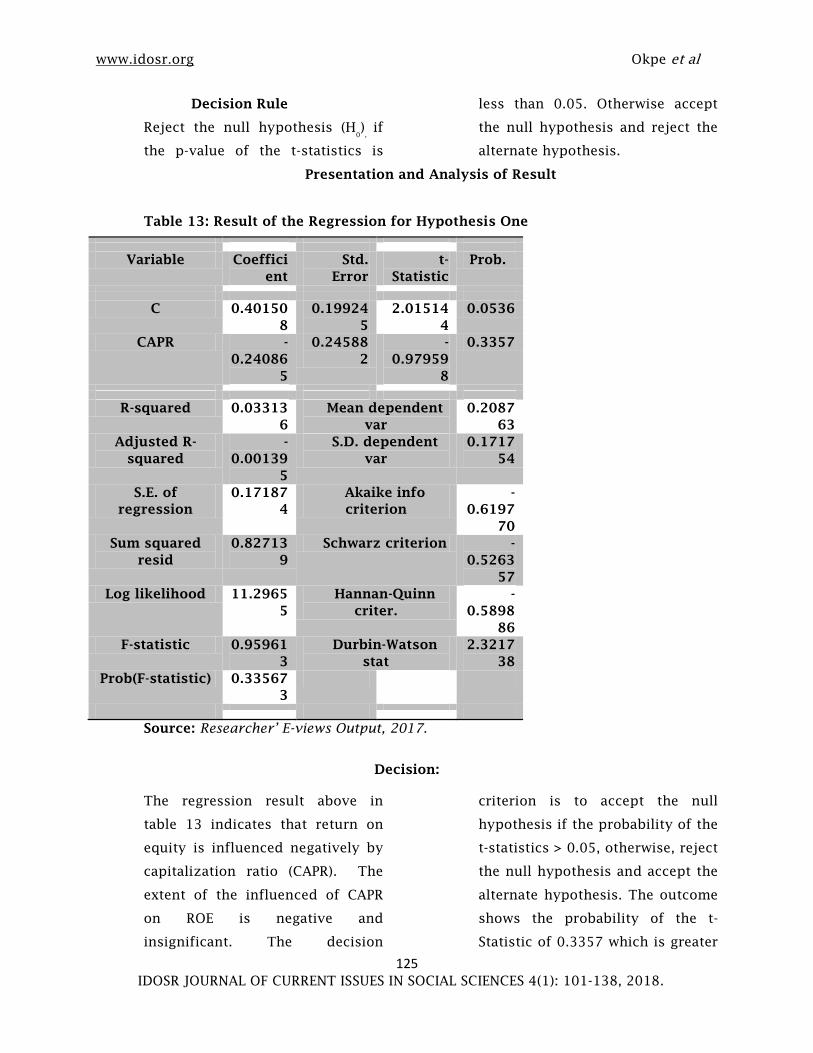
Decision Rule
Reject the null hypothesis (H0
),
if
the p-value of the t-statistics is
less than 0.05. Otherwise accept
the null hypothesis and reject the
alternate hypothesis.
Presentation and Analysis of Result
Table 13: Result of the Regression for Hypothesis One
Variable Coeffici
ent
Std.
Error
t-
Statistic
Prob.
C 0.40150
8
0.19924
5
2.01514
4
0.0536
CAPR -
0.24086
5
0.24588
2
-
0.97959
8
0.3357
R-squared 0.03313
6
Mean dependent
var
0.2087
63
Adjusted R-
squared
-
0.00139
5
S.D. dependent
var
0.1717
54
S.E. of
regression
0.17187
4
Akaike info
criterion
-
0.6197
70
Sum squared
resid
0.82713
9
Schwarz criterion -
0.5263
57
Log likelihood 11.2965
5
Hannan-Quinn
criter.
-
0.5898
86
F-statistic 0.95961
3
Durbin-Watson
stat
2.3217
38
Prob(F-statistic) 0.33567
3
Source: Researcher’ E-views Output, 2017.
Decision:
The regression result above in
table 13 indicates that return on
equity is influenced negatively by
capitalization ratio (CAPR). The
extent of the influenced of CAPR
on ROE is negative and
insignificant. The decision
criterion is to accept the null
hypothesis if the probability of the
t-statistics > 0.05, otherwise, reject
the null hypothesis and accept the
alternate hypothesis. The outcome
shows the probability of the t-
Statistic of 0.3357 which is greater
www.idosr.org Okpe et al
126 IDOSR JOURNAL OF CURRENT ISSUES IN SOCIAL SCIENCES 4(1): 101-138, 2018.
than 0.05. Therefore, we reject the
alternate hypothesis and accept
the null hypothesis that
capitalization ratio has no
significant effect on return on
equity of banks.
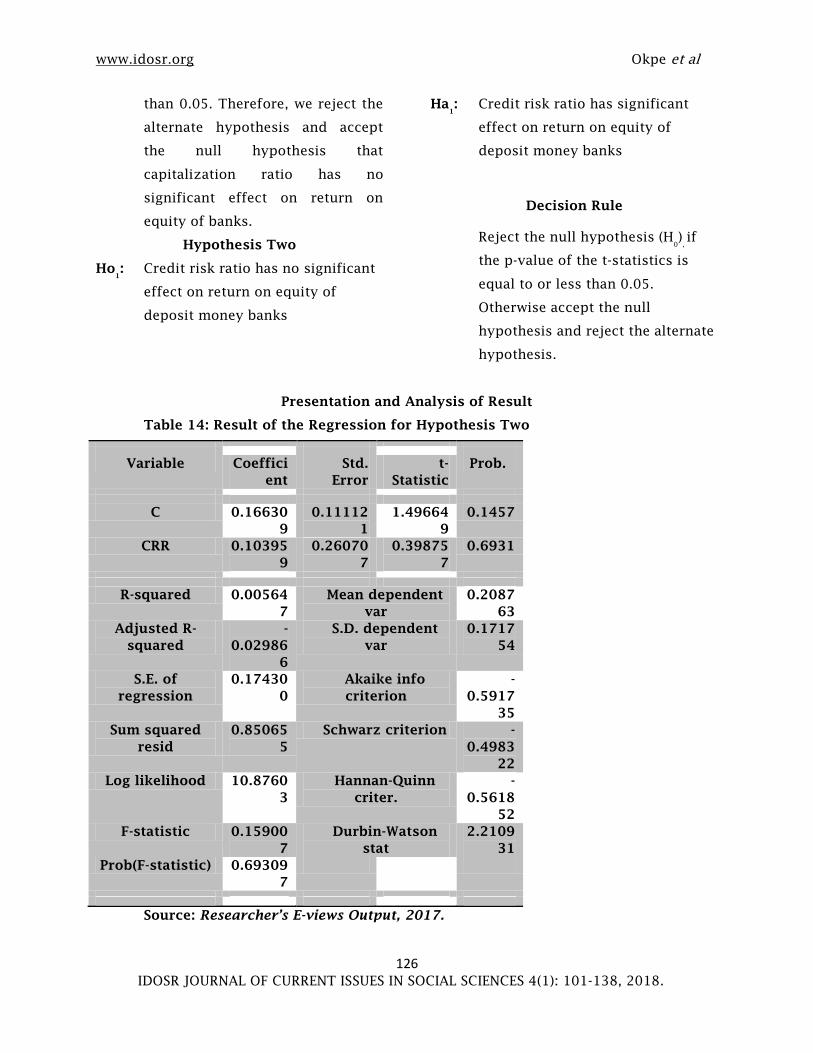
Hypothesis Two
Ho1
: Credit risk ratio has no significant
effect on return on equity of
deposit money banks
Ha1
: Credit risk ratio has significant
effect on return on equity of
deposit money banks
Decision Rule
Reject the null hypothesis (H0
),
if
the p-value of the t-statistics is
equal to or less than 0.05.
Otherwise accept the null
hypothesis and reject the alternate
hypothesis.
Presentation and Analysis of Result
Table 14: Result of the Regression for Hypothesis Two
Variable Coeffici
ent
Std.
Error
t-
Statistic
Prob.
C 0.16630
9
0.11112
1
1.49664
9
0.1457
CRR 0.10395
9
0.26070
7
0.39875
7
0.6931
R-squared 0.00564
7
Mean dependent
var
0.2087
63
Adjusted R-
squared
-
0.02986
6
S.D. dependent
var
0.1717
54
S.E. of
regression
0.17430
0
Akaike info
criterion
-
0.5917
35
Sum squared
resid
0.85065
5
Schwarz criterion -
0.4983
22
Log likelihood 10.8760
3
Hannan-Quinn
criter.
-
0.5618
52
F-statistic 0.15900
7
Durbin-Watson
stat
2.2109
31
Prob(F-statistic) 0.69309
7
Source: Researcher’s E-views Output, 2017.
www.idosr.org Okpe et al
127 IDOSR JOURNAL OF CURRENT ISSUES IN SOCIAL SCIENCES 4(1): 101-138, 2018.
Decision
The regression result above in
table 14 indicates that credit risk
ratio (CRR) positively influenced
return on equity (ROE). The
decision criterion is to accept the
null hypothesis if the probability
of the t-statistics > 0.05, otherwise,
reject the null hypothesis and
accept the alternate hypothesis.
The outcome shows the probability
of the t-Statistic of 0.398757 which
is more than 0.05. Therefore, we
reject the alternate hypothesis and
accept the null hypothesis that
CRR has no significant effect on
return on equity of banks in
Nigeria.
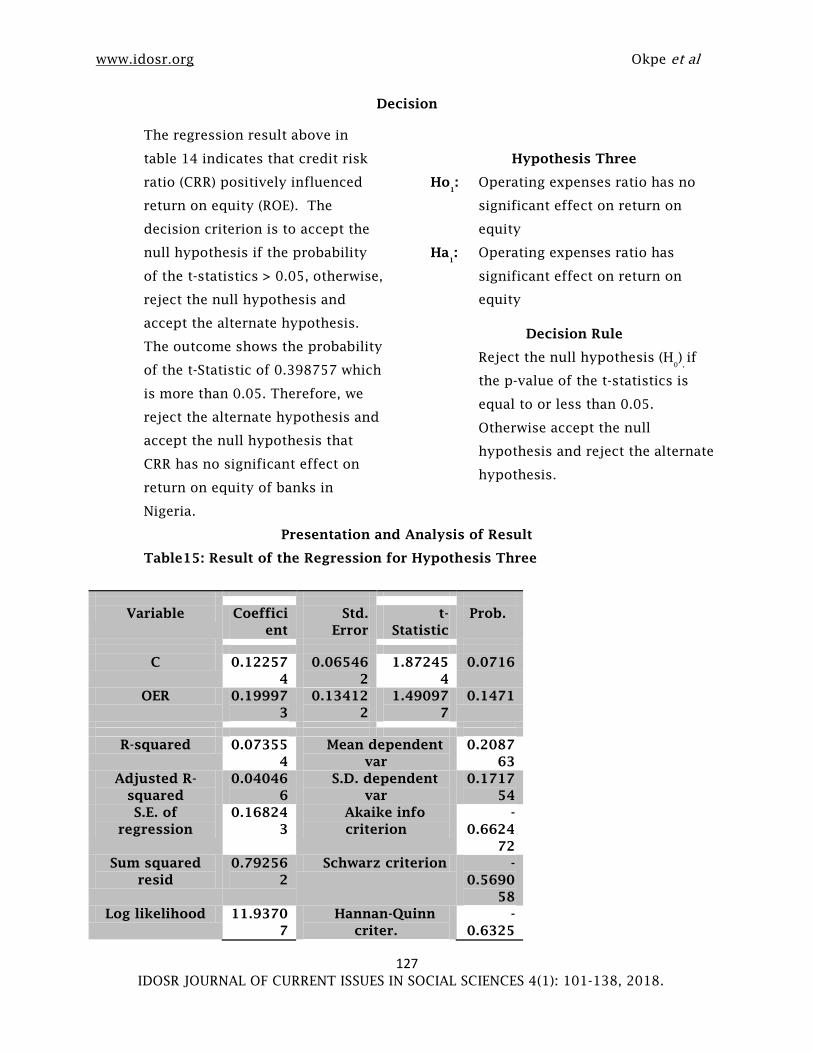
Hypothesis Three
Ho1
: Operating expenses ratio has no
significant effect on return on
equity
Ha1
: Operating expenses ratio has
significant effect on return on
equity
Decision Rule
Reject the null hypothesis (H0
),
if
the p-value of the t-statistics is
equal to or less than 0.05.
Otherwise accept the null
hypothesis and reject the alternate
hypothesis.
Presentation and Analysis of Result
Table15: Result of the Regression for Hypothesis Three
Variable Coeffici
ent
Std.
Error
t-
Statistic
Prob.
C 0.12257
4
0.06546
2
1.87245
4
0.0716
OER 0.19997
3
0.13412
2
1.49097
7
0.1471
R-squared 0.07355
4
Mean dependent
var
0.2087
63
Adjusted R-
squared
0.04046
6
S.D. dependent
var
0.1717
54
S.E. of
regression
0.16824
3
Akaike info
criterion
-
0.6624
72
Sum squared
resid
0.79256
2
Schwarz criterion -
0.5690
58
Log likelihood 11.9370
7
Hannan-Quinn
criter.
-
0.6325

www.idosr.org Okpe et al
128 IDOSR JOURNAL OF CURRENT ISSUES IN SOCIAL SCIENCES 4(1): 101-138, 2018.
88
F-statistic 2.22301
4
Durbin-Watson
stat
1.9681
51
Prob(F-statistic) 0.14714
8
Source: Researcher’s E-views Output, 2017.
Decision
The regression result above in
table 15 indicates that return on
equity (ROE) is positively
influenced by operational
expenses ratio (OER). The extent
of the influenced of OER on ROE is
positive and insignificant. The
decision criterion is to accept the
null hypothesis if the probability
of the t-statistics > 0.05, otherwise,
reject the null hypothesis and
accept the alternate hypothesis.
The outcome shows the probability
of the t-Statistic of 0.1471 which is
greater than 0.05. Therefore, we
reject the alternate hypothesis and
accept the null hypothesis that
operational expenses ratio has no
significant effect on return on
equity of Nigeria banking firms.
Hypothesis Four
Ho1
: Liquidity ratio has no significant
effect on return on equity of
deposit money banks
Ha1
: Liquidity ratio has significant
effect on return on equity of
deposit money banks
Decision Rule
Reject the null hypothesis (H0
),
if
the p-value of the t-statistics is
equal to or less than 0.05.
Otherwise accept the null
hypothesis and reject the alternate
hypothesis.
Presentation and Analysis of Result
Table 16: Result of the Regression for Hypothesis Three
Variable Coeffici
ent
Std.
Error
t-
Statistic
Prob.
C 0.58558
4
0.10768
7
5.43782
7
0.0000
LR -
0.31379
9
0.08694
8
-
3.60905
0
0.0012
R-squared 0.31749
3
Mean dependent
var
0.2087
63
Adjusted R-
squared
0.29311
8
S.D. dependent
var
0.1717
54
www.idosr.org Okpe et al
129 IDOSR JOURNAL OF CURRENT ISSUES IN SOCIAL SCIENCES 4(1): 101-138, 2018.
S.E. of
regression
0.14440
5
Akaike info
criterion
-
0.9680
55
Sum squared
resid
0.58387
5
Schwarz criterion -
0.8746
42
Log likelihood 16.5208
3
Hannan-Quinn
criter.
-
0.9381
72
F-statistic 13.0252
4
Durbin-Watson
stat
2.1613
70
Prob(F-statistic) 0.00118
6
Source: Researcher’s E-views Output, 2017.
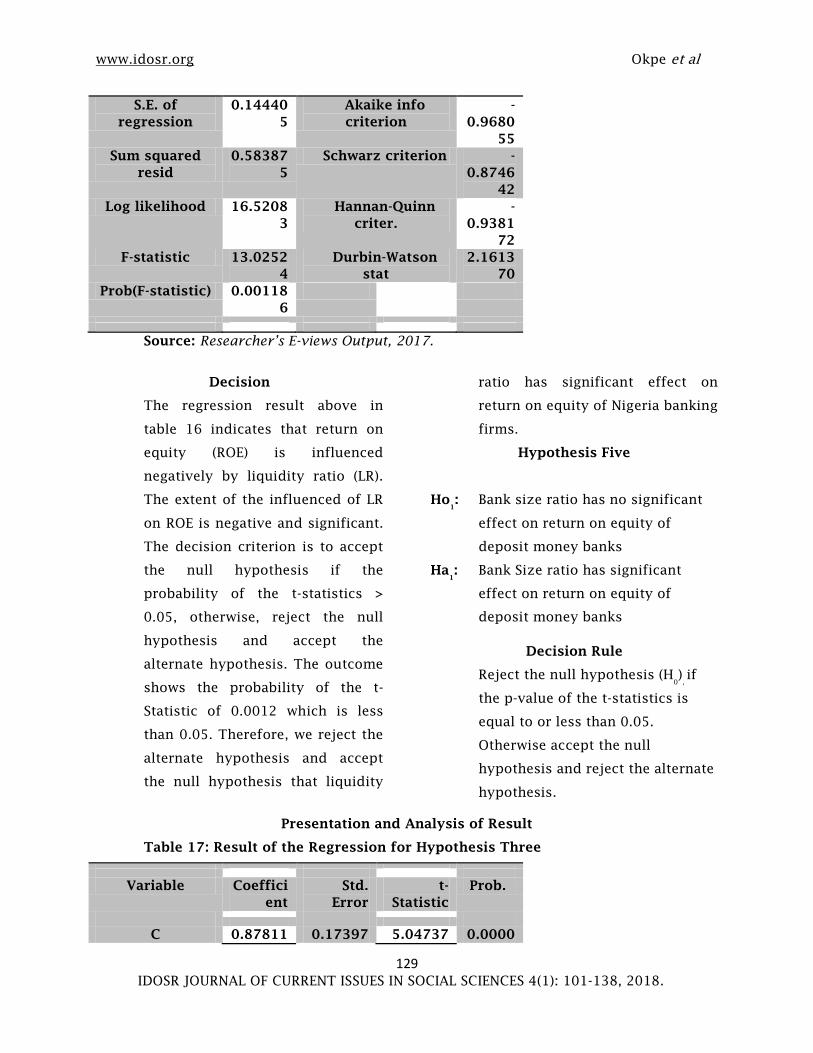
Decision
The regression result above in
table 16 indicates that return on
equity (ROE) is influenced
negatively by liquidity ratio (LR).
The extent of the influenced of LR
on ROE is negative and significant.
The decision criterion is to accept
the null hypothesis if the
probability of the t-statistics >
0.05, otherwise, reject the null
hypothesis and accept the
alternate hypothesis. The outcome
shows the probability of the t-
Statistic of 0.0012 which is less
than 0.05. Therefore, we reject the
alternate hypothesis and accept
the null hypothesis that liquidity
ratio has significant effect on
return on equity of Nigeria banking
firms.
Hypothesis Five
Ho1
: Bank size ratio has no significant
effect on return on equity of
deposit money banks
Ha1
: Bank Size ratio has significant
effect on return on equity of
deposit money banks
Decision Rule
Reject the null hypothesis (H0
),
if
the p-value of the t-statistics is
equal to or less than 0.05.
Otherwise accept the null
hypothesis and reject the alternate
hypothesis.
Presentation and Analysis of Result
Table 17: Result of the Regression for Hypothesis Three
Variable Coeffici
ent
Std.
Error
t-
Statistic
Prob.
C 0.87811 0.17397 5.04737 0.0000
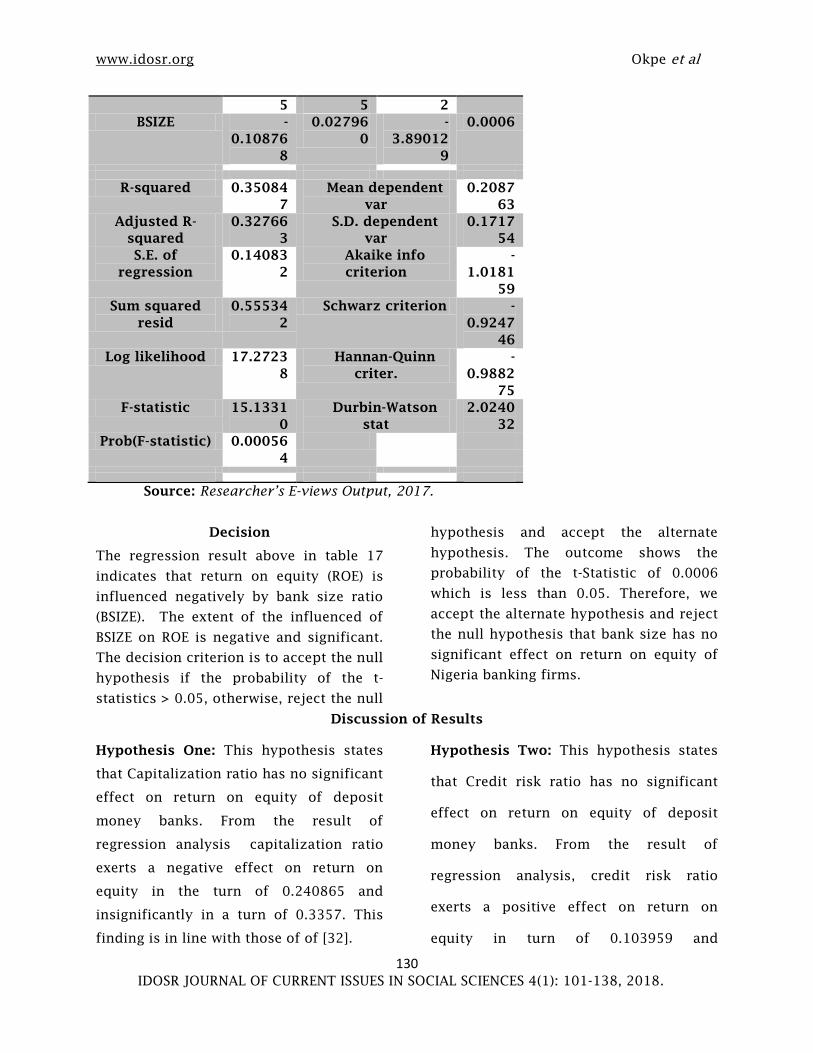
www.idosr.org Okpe et al
130 IDOSR JOURNAL OF CURRENT ISSUES IN SOCIAL SCIENCES 4(1): 101-138, 2018.
5 5 2
BSIZE -
0.10876
8
0.02796
0
-
3.89012
9
0.0006
R-squared 0.35084
7
Mean dependent
var
0.2087
63
Adjusted R-
squared
0.32766
3
S.D. dependent
var
0.1717
54
S.E. of
regression
0.14083
2
Akaike info
criterion
-
1.0181
59
Sum squared
resid
0.55534
2
Schwarz criterion -
0.9247
46
Log likelihood 17.2723
8
Hannan-Quinn
criter.
-
0.9882
75
F-statistic 15.1331
0
Durbin-Watson
stat
2.0240
32
Prob(F-statistic) 0.00056
4
Source: Researcher’s E-views Output, 2017.
Decision
The regression result above in table 17
indicates that return on equity (ROE) is
influenced negatively by bank size ratio
(BSIZE). The extent of the influenced of
BSIZE on ROE is negative and significant.
The decision criterion is to accept the null
hypothesis if the probability of the t-
statistics > 0.05, otherwise, reject the null
hypothesis and accept the alternate
hypothesis. The outcome shows the
probability of the t-Statistic of 0.0006
which is less than 0.05. Therefore, we
accept the alternate hypothesis and reject
the null hypothesis that bank size has no
significant effect on return on equity of
Nigeria banking firms.
Discussion of Results
Hypothesis One: This hypothesis states
that Capitalization ratio has no significant
effect on return on equity of deposit
money banks. From the result of
regression analysis capitalization ratio
exerts a negative effect on return on
equity in the turn of 0.240865 and
insignificantly in a turn of 0.3357. This
finding is in line with those of of [32].
Hypothesis Two: This hypothesis states
that Credit risk ratio has no significant
effect on return on equity of deposit
money banks. From the result of
regression analysis, credit risk ratio
exerts a positive effect on return on
equity in turn of 0.103959 and

www.idosr.org Okpe et al
131 IDOSR JOURNAL OF CURRENT ISSUES IN SOCIAL SCIENCES 4(1): 101-138, 2018.
insignificantly effect in a turn of 0.6931.
This agrees with the work [33] found out
that credit risk ratio affect profitability
negatively, and disagreed by [10] and [2]
and [34].
Hypothesis Three: This hypothesis states
that operating expenses ratio has no
significant effects on return on equity of
deposit money banks in Nigeria. From the
result of regression analysis. Operating
expenses ratio exerts a positive effect on
return on equity in a turn of 0.199973 and
insignificant in a turn of 0.1471. This
agrees with the work of [13] and
disagreed by [22] and [35].
Hypothesis Four: This hypothesis states
that liquidity ratio has no significant
effects on return on equity of deposit
money banks in Nigeria. From the result
of regression analysis, liquidity ratio
exerts a negative effect on return on
equity in a turn of 0.3138 and significant
in a turn of 0.0012. In this light, [9] from
his findings indicated that there is a
significant relationship between liquidity
management and the performance of
Deposit Money Banks in Nigeria.
Hypothesis Five: This hypothesis states
that bank size ratio has no significant
effects on return on equity of deposit
money banks in Nigeria. From the result
of regression analysis, bank size ratio
exerts a negative effect on return on
equity in a turn of 0.1088 and significant
in a turn of 0.0006. This finding is similar
to that of [36].
www.idosr.org Okpe et al
132 IDOSR JOURNAL OF CURRENT ISSUES IN SOCIAL SCIENCES 4(1): 101-138, 2018.
SUMMARY OF FINDINGS, CONCLUSION AND RECOMMENDATIONS
SUMMARY OF FINDINGS
Based on the analysis on the research
work on the effect of accounting ratios on
investment performance of deposit
money banks in Nigeria, for the period
2007–2016, it was revealed that:
(1) Capitalization ratio have negative
and insignificant effect on return
on equity of deposit money banks
in Nigeria;
(2) Credit risk ratio have positive and
insignificant effect on return on
equity of deposit money banks in
Nigeria;
(3) Operating expenses ratio have
positive and insignificant effect on
return on equity of deposit money
banks in Nigeria;
(4) Liquidity ratio have negative and
significant effect on return on
equity of deposit money banks in
Nigeria;
(5) Bank size have negative and
significant effect on return on
equity of deposit money banks in
Nigeria.
CONCLUSION
The study has established that for a
period of ten years (covering 2007 and
2016), the statistics from three deposit
money banks revealed cumulative
significant relationship between
accounting ratios and performance. It is
the submission of the study that
accounting ratio analysis had significant
effect on investment performance of
banks in Nigeria between 2007 and 2016.
RECOMMENDATIONS
Based on the findings of this research
study, the following recommendations are
made:
(1) The management of deposit money
banks should put more attention
on their liquidity in order to
maintain an adequate liquidity as
the study has empirically proved
that higher liquidity signifies
better performance. The listed
Deposit Money Banks in Nigeria
should try and maintain a higher
quick ratio as it will have a
positive impact on their
profitability.
(2) The management should reduce
the amount held in cash as current
asset and concentrate more in
investing them, so that it could

www.idosr.org Okpe et al
133 IDOSR JOURNAL OF CURRENT ISSUES IN SOCIAL SCIENCES 4(1): 101-138, 2018.
yield higher return rather than tie
down the idle cash.
(3) Efforts must be geared towards
managing operating expenses as it
has been seen to have negative
effect on performance. Rise in
operating expenses must be
curbed so as not to overspend.
(4) Management of financial
institution in Nigeria should set up
financial analysis and monitoring
section for the purpose of
developing, analyzing and
interpreting financial report of the
bank on weekly, monthly,
quarterly and yearly basis for
dynamic and strategic response to
challenges in the environment and
to help quick and prompt decision
making process.
(5) Concerted effort must be put in
place to grow the asset column of
these banks. The study has shown
that bank size is major
determinant of performance, so
with a huge asset base, the chances
for investment performance will be
greatly enhanced.

www.idosr.org Okpe et al
134 IDOSR JOURNAL OF CURRENT ISSUES IN SOCIAL SCIENCES 4(1): 101-138, 2018.
REFERENCES
1. Wikipedia, (2017). Financial Ratio.
An article of the online
encyclopaedia available at
https://en.wikipedia.org/wiki/Fina
ncial_ratio.
2. Groppelli, A.A. and Ehsan N.
(2000). Finance, 4th ed. Barron's
Educational Series, Inc.
p. 433. ISBN 0-7641-1275-9
3. Kehinde, J.S. (2015). Accounting
Ratio: The Organisation Decision
Making and Evaluation Dynamism.
Research Journal of Finance and
Accounting, 6(5):12 – 18.
4. 4.Igben R. O. (2009): Financial
Accounting Made Simple. Robert
Orighotsuwa Publication: Isolo.
5. 5. Chen, K.H. and Shimerda, T. A.
(1981). An empirical analysis of
useful financial ratios. Jstor:
Financial Management, 10(1), 51-
61
6. Chukwu, U.C. (2002). Accounting
and Finance Terminologies:
Amawbia” Bills Print and
Publishers.
7. Lucey, T. (2003). Management
Accounting: UK: Book Power
Publishers.
8. Wood, F. And Sangsher, A. (2002).
Business Accounting 2. England:
Pearson Educational LimitedPandy,
I.M. (1995) Essential of
Management Accountings “New
Delhi: Vikas Publishing House, PVT
Limited.
10. National Council for Educational
Research and Training (2008).
Available at
http://www.ncert.nic.in/ncerts/l/l
eac205.pdf
11. Okan V.S. (2007). Credit risk
assesment for the banking sector
of northern cyprus. Journal of
Yasir University
12. Rose, P. (2002), “Commercial Bank
Management”, 5th edition, Mc
Graw-Hill/Irwin, USA
13. Bratton, E. and Garrido F.I. (2016).
Cost-to-Income Ratios of Banks
Worldwide.
http://marketintelligence.spglobal.
com/our-thinking/ideas/cost-to-
income-ratios-of-banks-worldwide
14. Oladejo, M. O., & Oladipupo, A. U.
(2011): Capital Regulation and the
Performance of the Nigerian banks:
Need for Review, Journal of
Emerging Trends in Economics and
Management Sciences (JETEMS) 2
(3): 215-224
15. Calem and Rob (1996): The Impact
of Capital-based Regulation on
Bank Risk-taking: A
Dynamicmodelavailable@https://w
ww.federalreserve.gov/pubs/feds/
1996/199612/1 99612abs.html.
16. Rime, .B. (2001): Capital
Requirements and Bank Behaviour:
Empirical evidence for Switzerland,
Journal of Banking & Finance 25,
789–805.
17. Soyemi K.A., Akinpelu L. and
Ogunleye J. O. (2013). The
Determinants of Profitability
among Deposit Money Banks
(DMBS) in Nigeria Post
Consolidation. Global Advanced
Research Journal of Economics,
www.idosr.org Okpe et al
135 IDOSR JOURNAL OF CURRENT ISSUES IN SOCIAL SCIENCES 4(1): 101-138, 2018.
Accounting and Finance, 2(5): 093 -
103.
18. Adegboye F. B., Olowe O. and
Uwuigbe O. (2013). Returns on
Investment of Deposit Money
Banks (DMBs) in Nigeria. Journal of
Applied Finance & Banking, (3)3:
195 – 206.
19. Zayyad A., Ahmad B.U. and
Mubaraq S. (2014). Financial ratios
as performance measure: A
comparison of IFRS and Nigerian
GAAP. Accounting and Management
Information Systems. 13(1): 82–97
20. Aniefor S.J. and Oghenero O.G. (2015).
Accounting Ratios as a Veritable
Tool for Corporate Investment
Decisions: A Study of Selected
Organizations in Delta State.
Journal of Policy and Development
Studies,. 9(5): 38 – 49.
21. Yahaha, A. (2015). Working Capital
Management and Financial
Performance of Deposit Money
Banks in Nigeria. Research Journal
of Finance and Accounting,
6(16):57 – 71.
22. Mukarushema V., Kule, J. W. and
Mbabazize M. (2016). Effect of
financial statement analysis on
investment decision making. A
case of bank of Kigali. European
Journal Of Business and Social
Sciences, 5(6): 279 - 303
23. Edem, D. B.(2017). Liquidity
Management and Performance of
Deposit Money Banks in Nigeria
(1986 – 2011): An Investigation.
International Journal of Economics,
Finance and Management Sciences;
5(3): 146-161
24. Adorode, R. (2004). A Practical
approach to advanced financial
accounting, Lagos: Master Stock
Consulting.
25. Eyisi, S.A. (2003). Cost Accounting;
theory and Practice. Enugu: Valson
(W.A.) Ltd.
26. Bagyenda, J., Brownbridge, M. and
Kasekende, L. (2011): Basel III and
the Global Reform of Financial
Regulation: How should Africa
respond? A bank regulators
perspective, New Rules for Global
27. Gee, P. (1988). Book-Keeping and
Accounting: UK Butterworth and
Co. Ltd.
28. Nwabuokei, P.O.(2001). Fundamentals
of Statistics: Enugu: Koruna Books
29. Chukwu, U.C. (2004). Financial
Accounting; Principles and
Practice, Abakaliki: New Concept
Publishing
30. Lucey, T. (2002). Costing: UK: Book
Power Publishers.
31. Finance. Retrieved from
http://www.newrules.org/storage/
documents/g20-fsb-
imf/kasekende.docx
32. Nwankwo, O. (2002) Bank Credit and
Loan Administration: Enugu: Jones
Communications and Ozoani, G.
(2014) Basic Financial Management
and Analysis, Enugu: Veamaks
Publishers.
33. Ozoani, G. (2014) Basic Financial
Management and Analysis, Enugu:
Veamaks Publishers.
34. Ozoli and Nnado (2013) consolidated
and Others Accounts: Theory and
Practice Jamoe Pulishers.
35. Moody’s Investors Service (2011).
Banking Account & Ratio
Definitions. Retrieved March 06,
2017 at
https://www.moodys.com/sites/pr
oducts/ProductAttachments/Banki

www.idosr.org Okpe et al
136 IDOSR JOURNAL OF CURRENT ISSUES IN SOCIAL SCIENCES 4(1): 101-138, 2018.
ng%20Account%20and%20Ratio%20
Definitions.pdf
36. Hindu Business Line (2014). Key ratios
associated with banks' P&L
statements. Retrieved March 07,
2017 at
http://www.thehindubusinessline.
com/portfolio/beyond-stocks/key-
ratios-associated-with-banks-pl-
statements/article6324221.ece

www.idosr.org Okpe et al
137 IDOSR JOURNAL OF CURRENT ISSUES IN SOCIAL SCIENCES 4(1): 101-138, 2018.
APPENDIX
RAW DATA
Time Series Data of the Variables - Zenith Bank Plc
Year Profit
after tax
(N’m)
Long-
term
debt
(N’m)
Shareholders
equity
(N’m)
Total
liabilities
(N’m)
Total
assets
(N’m)
Operating
expenses
(N’m)
Revenues
(N’m)
Current
assets
(N’m)
Current
liabilities
(N’m)
2007 17,509 21,947 294,444 568,012 883,940 45,388 89,193 34,543 170,087
2008 49,566 40,431 341,794 1,331,286 1,673,080 81,013 190,075 341,794 1,164,459
2009 21,933 36,402 335,760 1,243,152 1,578,912 103,338 255,264 335,760 1,114,271
2010 32,305 28,358 356,909 1,441,770 1,798,679 89,107 168,415 356,909 1,290,014
2011 41,301 21,070 372,017 1,797,056 2,169,073 108,529 214,980 372,017 1,577,290
2012 95,803 15,138 438,003 1,998,883 2,436,886 111,644 279,042 438,003 1,802,008
2013 83,414 60,150 472,622 2,406,071 2,878,693 138,789 311,275 472,622 2,079,862
2014 92,479 198,066 512,707 2,911,112 3,423,819 152,335 372,015 512,707 2,265,262
2015 98,784 268,111 546,946 3,203,381 3,750,327 155,406 396,653 546,946 2,333,017
2016 119,285 292,802 616,353 3,667,383 4,283,736 156,676 454,808 616,353 2,552,963
Time Series Data of the Variables - First Bank Plc
Year Profit
after
tax
(N’m)
Long-
term
debt
(N’m)
Shareholders
equity
(N’m)
Total
liabilities
(N’m)
Total
assets
(N’m)
Operating
expenses
(N’m)
Revenues
(N’m)
Current
assets
(N’m)
Current
liabilities
(N’m)
2007 20,636 28,007 301,551 441,210 1,001,457 670,884 115,740 145,565 989,102
2008 36,540 40,431 341,794 1,331,286 1,673,080 81,013 190,075 341,794 1,164,459
2009 3,622 36,402 335,760 1,243,152 1,578,912 103,338 255,264 335,760 1,114,271
2010 29,177 28,358 356,909 1,441,770 1,798,679 89,107 168,415 356,909 1,290,014
2011 18,636 21,070 372,017 1,797,056 2,169,073 108,529 214,980 372,017 1,577,290
2012 75,097 15,138 438,003 1,998,883 2,436,886 111,644 279,042 438,003 1,802,008

www.idosr.org Okpe et al
138 IDOSR JOURNAL OF CURRENT ISSUES IN SOCIAL SCIENCES 4(1): 101-138, 2018.
2013 66,451 60,150 472,622 2,406,071 2,878,693 138,789 311,275 472,622 2,079,862
2014 84,842 198,066 512,707 2,911,112 3,423,819 152,335 372,015 512,707 2,265,262
2015 2,945 268,111 546,946 3,203,381 3,750,327 155,406 396,653 546,946 2,333,017
2016 10,452 292,802 616,353 3,667,383 4,283,736 156,676 454,808 616,353 3,012,816
Time Series Data of the Variables - Fidelity Bank Plc
Year Profit
after
tax
(N’m)
Long-
term
debt
(N’m)
Shareholders
equity
(N’m)
Total
liabilities
(N’m)
Total
assets
(N’m)
Operating
expenses
(N’m)
Revenues
(N’m)
Current
assets
(N’m)
Current
liabilities
(N’m)
2007 4,844 28,007 301,551 441,210 1,001,457 670,884 115,740 145,565 989,102
2008 3,127 40,431 341,794 1,331,286 1,673,080 81,013 190,075 341,794 1,164,459
2009 3,622 36,402 335,760 1,243,152 1,578,912 103,338 255,264 335,760 1,114,271
2010 5,828 28,358 356,909 1,441,770 1,798,679 89,107 168,415 356,909 1,290,014
2011 3,911 21,070 372,017 1,797,056 2,169,073 108,529 214,980 372,017 1,577,290
2012 17,924 15,138 438,003 1,998,883 2,436,886 111,644 279,042 438,003 1,802,008
2013 7,721 60,150 472,622 2,406,071 2,878,693 138,789 311,275 472,622 2,079,862
2014 13,796 198,066 512,707 2,911,112 3,423,819 152,335 372,015 512,707 2,265,262
2015 13,904 268,111 546,946 3,203,381 3,750,327 155,406 396,653 546,946 2,333,017
2016 8,753 292,802 616,353 3,667,383 4,283,736 156,676 454,808 616,353 3,012,816