Effect of 2-Butyne-1, 4-Diol on the Nanostructure and
17
Int. J. Electrochem. Sci., 6 (2011) 1189 - 1205 International Journal of ELECTROCHEMICAL SCIENCE www.electrochemsci.org Effect of 2-Butyne-1, 4-Diol on the Nanostructure and Corrosion Resistance Properties of Electrodeposited Ni-W-B Coatings M.G. Hosseini 1,* , M. Abdolmaleki 1 , H. Ebrahimzadeh 2 , S.A. Seyed Sadjadi 2 1 Electrochemistry Research Laboratory, Department of Physical Chemistry, Chemistry Faculty, University of Tabriz, Iran 2 Department of Chemistry, IUST University, Tehran, Iran * E-mail: [email protected] Received: 24 October 2010 / Accepted: 20 January 2011 / Published: 1 April 2011 The paper reports a study on the influence of 2-butyne-1, 4-diol brightener on the electrochemical corrosion behavior of electrodeposited nanocrystalline Ni-W-B alloy coatings. Corrosion behavior of the coatings deposited on cupper substrates was studied at different immersion times in 3.5% NaCl solution by using electrochemical impedance spectroscopy while their passivation behavior was studied in 1N sulphuric acid solution by using potentiodynamic polarization. Scanning electron microscopy and X-ray diffraction were used to characterize the morphology and surface analysis, respectively. A full-bright and smooth Ni-W-B alloy can be electrodeposited in the presence of 2- butyne-1, 4-diol. It is found that appropriate amount of this additive could lead to finer structure and higher hardness of the deposit. The electrochemical impedance spectroscopy results exhibited that the higher corrosion resistance of the nanocrystalline Ni-W-B electrodeposited from solution containing 2- butyne-1, 4-diol is due to the preferential dissolution of nickel and formation of a tungsten rich film on the surface. Potentiodynamic polarization studies exhibited that regardless of composition, all the alloys exhibited passivation behavior over a wide range of anodic potentials. The impedance data for optimum coating represented different behavior at applied anodic potential in 1N sulphuric acid solution. Keywords: Nanostructures, coatings, corrosion test, hardness 1. INTRODUCTION The electroplating of steel sheets and tubes used in many applications include plating by copper, nickel and chromium. Decorative chromium coatings are applied from hexavalent chromium processes based on chromic acid. Hexavalent chromium in solution is a recognized carcinogen and causes other health problems such as skin and lung irritation [1, 3]. Due to these reasons, replacement of chrome coatings by another process has been required. Electrodeposition of alloys is particularly
Transcript of Effect of 2-Butyne-1, 4-Diol on the Nanostructure and

Int. J. Electrochem. Sci., 6 (2011) 1189 - 1205
International Journal of
ELECTROCHEMICAL SCIENCE
www.electrochemsci.org
Effect of 2-Butyne-1, 4-Diol on the Nanostructure and Corrosion
Resistance Properties of Electrodeposited Ni-W-B Coatings
M.G. Hosseini1,*
, M. Abdolmaleki 1
, H. Ebrahimzadeh2, S.A. Seyed Sadjadi
2
1 Electrochemistry Research Laboratory, Department of Physical Chemistry, Chemistry Faculty,
University of Tabriz, Iran 2 Department of Chemistry, IUST University, Tehran, Iran
*E-mail: [email protected]
Received: 24 October 2010 / Accepted: 20 January 2011 / Published: 1 April 2011
The paper reports a study on the influence of 2-butyne-1, 4-diol brightener on the electrochemical
corrosion behavior of electrodeposited nanocrystalline Ni-W-B alloy coatings. Corrosion behavior of
the coatings deposited on cupper substrates was studied at different immersion times in 3.5% NaCl
solution by using electrochemical impedance spectroscopy while their passivation behavior was
studied in 1N sulphuric acid solution by using potentiodynamic polarization. Scanning electron
microscopy and X-ray diffraction were used to characterize the morphology and surface analysis,
respectively. A full-bright and smooth Ni-W-B alloy can be electrodeposited in the presence of 2-
butyne-1, 4-diol. It is found that appropriate amount of this additive could lead to finer structure and
higher hardness of the deposit. The electrochemical impedance spectroscopy results exhibited that the
higher corrosion resistance of the nanocrystalline Ni-W-B electrodeposited from solution containing 2-
butyne-1, 4-diol is due to the preferential dissolution of nickel and formation of a tungsten rich film on
the surface. Potentiodynamic polarization studies exhibited that regardless of composition, all the
alloys exhibited passivation behavior over a wide range of anodic potentials. The impedance data for
optimum coating represented different behavior at applied anodic potential in 1N sulphuric acid
solution.
Keywords: Nanostructures, coatings, corrosion test, hardness
1. INTRODUCTION
The electroplating of steel sheets and tubes used in many applications include plating by
copper, nickel and chromium. Decorative chromium coatings are applied from hexavalent chromium
processes based on chromic acid. Hexavalent chromium in solution is a recognized carcinogen and
causes other health problems such as skin and lung irritation [1, 3]. Due to these reasons, replacement
of chrome coatings by another process has been required. Electrodeposition of alloys is particularly

Int. J. Electrochem. Sci., Vol. 6, 2011
1190
important for applications in microfabrication technologies. The electrodeposition of pure tungsten
coatings from tungstate solutions is hindered by the formation of an oxide layer on the cathode during
electrodeposition. This oxide cannot be directly reduced to metallic tungsten because of the very low
overvoltage for hydrogen evolution on tungsten. Hence, a further reduction to metallic tungsten does
not proceed, and the entire current is consumed for hydrogen evolution [4, 5]. Tungsten and
molybdenum ions do co-deposit with iron group metals so that alloys containing a high content of
refractory elements are obtained [6-9]. This phenomenon is called induced co-deposition [9].
Electrodeposited tungsten alloys possess attractive corrosion and tribological properties [8-13].
Therefore such coatings were considered recently as an alternative to electrolytic chromium coatings.
The electrochemical synthesis of W and Mo based alloys has essential advantages compared to the
electrodeposition of chromium in terms of ecological and health risks [14-16]. It is well known that
good appearance is very important for application of a new electroplating technology, but few papers
studied the brightness of deposited Ni-W-B alloy, one reason may be those Na2WO4 and complexing
agents which are often used have positive effect on the appearance of Ni-W-B deposit. Generally, Ni-
W alloys are known to exhibit higher hardness, higher heat resistance and also a better corrosion
behavior compared to elemental Ni [17]. During the corrosion process tungsten preferentially migrated
toward the surface and formed oxides. In our previous study, for the first time, optimized Ni-W-B
alloys were prepared from tartrate bath [18-20]. Some of the advantages of tartrate baths as compared
to ammonia citrate baths are electroplating in the acidic medium, higher current efficiency and increase
of tungsten content in the deposit that leads to the formation of nanocrystalline or amorphous coatings
with higher hardness and corrosion resistance. 2-butyne-1, 4-diol (BD) is used as corrosion inhibitor
for mild steel, and Aluminum [21-22]. In this paper, we have studied the changes in morphology,
composition and structure of the electrodeposited Ni-W-B coatings deposited from the optimum bath
with different concentration of additive from tartrate bath. In addition, the influence of 2-butyne-1, 4-
diol brightener (BD) on the corrosion resistance of electrodeposited Ni-W-B coatings was discussed
through the application of electrochemical impedance spectroscopy (EIS) and potentiodynamic
polarization.
2. EXPERIMENTAL
2.1. Sample preparation
Electrolyte was prepared by dissolving chemical reagents in triply distilled water. Nickel
sulfate (Merck, 99% pure) and sodium tungstate (Merck, 99% pure) were incorporated in the bath as
source of nickel and tungsten, respectively. Sodium borate (Merck, 99% pure) was added to the bath to
provide a source of boron for creating hard deposit. Sodium potassium tartrate (Merck, 99% pure) and
2-butyne-1, 4-diol (Merck, 99% pure) were added as complexing agent for stability of the bath and
brightener, respectively. The detailed chemical composition of electrolyte was listed in Table 1. The
concentration of BD was varied from 0 to 1.5 g L-1
. All electrodeposition experiments were carried out
at 60 ºC. A platinum sheet (geometric area 20cm2) was used as an insoluble anode and copper sheets
(geometric area 1 cm2) were used as cathode. Before the electrodeposition, the cathode substrates were

Int. J. Electrochem. Sci., Vol. 6, 2011
1191
polished mechanically to mirror finish with 2500 grit SiC paper, degreased in a 30% NaOH solution
for 5 min, washed with distilled water, and dried in air. All specimens were etched in a 10% sulfuric
acid solution for 2 min and then rinsed with deionized water and acetone then weighed prior to the
plating process by a Mettler analytical balance with sensitivity of 0.01 mg.
Table 1. Composition and operating conditions of the Ni-W-B alloy plating bath
Concentration Chemical reagents
0.076 mol L-1 NiSO4.6H2O
0.404 mol L-1
NaKC4O6H4 0.197 mol L
-1 Na2WO4.2H2O 0.13 mol L
-1 Na2B4O7.10H2O
Variable (0-1.5 g L-1
) 2-butyne-1, 4-diol
40 mA cm-2
Current density
60 °C Temperature
6.0 pH
Deposition faradaic efficiency (FE) of the alloy was measured by using the following equation
[23]:
c n FW iiFE = ×100It BM
i
(1)
where W is the measured weight of the deposit (g), I is the current passed (A), t is the
deposition time (h), Ci is the weight fraction of the element (nickel, tungsten and born) in the ternary
alloy deposit, ni is the number of electrons transferred in the reduction of 1 mol atoms of that element
(ni = 2 for nickel, 6 for tungsten and 3 for boron), Mi is the atomic weight of that element (g mol−1
), F
is the Faraday constant (96,485.3Cmol−1
) and B is a unit conversion factor (3600 CA−1
h−1
). The partial
currents of elements were also calculated using the deposit composition (w), the deposition time (t), the
mass of the deposit (m) and electrochemical equivalent (e):
et
mwiP
100 (2)
The hydrogen partial current density was determined by subtracting the sum of the metal
current densities from the total applied current density.

Int. J. Electrochem. Sci., Vol. 6, 2011
1192
2.2. Characterization
After electrodeposition, the sample was dissolved in an aqueous solution containing 250 g L-1
of CrO3 and 15 cm3 L
-1 of H2SO4 by heating in 373 K and then the metal content was determined using a
Varian inductively coupled plasma (ICP) instrument (model VARIAN/VISTA-PRO). The surface
morphology of the Ni-W-B electrodeposits was characterized with a scanning electron microscope
(SEM, Philips XL30 with EDAX DETECTING UNIT model NLW XL30 144-2.5). The thickness of
the deposits was large enough (average thickness of 20µm) so that no signal from the underlying gold
substrate was observed. Each sample was measured at different locations to confirm uniformity. The
structure of deposits was studied using an X-ray diffraction (XRD) with Cu-Kα radiation (Philips PW-
3020 Goniometer) operated at 40 kV and 200 mA. Microhardness of the deposits was determined by
using a Vickers diamond pyramid model BUEHLER with a load of 10 g and loading time of 15 s. Each
value was the average of five readings.
2.3. Electrochemical corrosion testing
Electrochemical impedance spectroscopy (EIS) and electrochemical potentiodynamic
measurements were performed in a three-electrode cell arrangement. A platinum mesh of the
geometric area of about 20 cm2 was used as counter electrode, while all potentials were measured with
respect to a commercial saturated calomel electrode (SCE). Electrochemical experiments were carried
out using a Princeton Applied Research, EG&G PARSTAT 2263 Advanced Electrochemical system
run by PowerSuite software. The r.m.s amplitude of the modulation potential for the EIS
measurements was 10 mV, and the frequency range was from 100 kHz to 1 mHz. The acquired data
were curve fitted and analyzed using ZView (ІІ) software. Prior to potentiodynamic polarization
measurements the samples were immersed in 1 N sulfuric acid solution for about 30 min in order to
establish the open circuit potential (EOCP). Potentiodynamic curves were recorded at a scan rate of 1
mV s-1
in the potential range of -0.1 V vs. open circuit potential to +2.0 V vs. SCE. In this work, the
impedance spectra were recorded after different immersion times (30 min, 2 h, 4 h, 8 h, 12 h and 24 h)
in 3.5% NaCl solution in order to compare corrosion resistance of Ni-W-B coatings deposited in
solution with 0.5 g L-1
BD and without BD, then the influence of the different anodic potentials on the
impedance pattern were studied for optimum coating in 1N sulphuric acid solution after
potentiodynamic polarization measurements.
3. RESULTS AND DISCUSSIONS
3.1. Relationship between BD concentration and current efficiency
BD concentration in the electrolyte was found to be a direct factor influencing the composition
of electrodeposited coatings. Figure 1 shows the effect of the concentration of BD on partial current
density of W, H2 and cathodic efficiency.

Int. J. Electrochem. Sci., Vol. 6, 2011
1193
Figure 1. Effects of the concentrations of BD on partial current density of W, H2 and cathodic
efficiency.
As it can be seen from Figure 1, addition of BD decreases both W content in the deposit and
the cathodic efficiency to a great extent. The results indicate that BD has more profound effects on
hydrogen evolution reactions (HER, which is decided factor for the cathodic efficiency). It is thus
reasonable to say that, during Ni-W-B plating, increasing BD concentration can accelerate HER and
thereby decreases faradic deposition efficiency. One of the possible reasons behind decreasing the
current efficiency is adsorption of BD on the plating surface decreasing the effective area on the
electrode free for Ni-W-B electrodeposition. From Figure 1, it can be seen that the optimum
concentration of BD is 0.5 g L-1
, because smooth and bright deposits, high W content as well as,
current efficiency could be obtained from the electroplating bath. By using ICP analysis, the
composition of alloys prepared from electrolyte with BD concentration of 0.5 g L-1
and without it
contains 38.94 wt. % and 44.12 wt. % tungsten, respectively.
3.2. Effects of BD on morphology and grain size of Ni-W-B alloy
Figure 2 shows the change in the surface morphology of the electrodeposited Ni-W-B alloy as a
function of concentration of BD in solution.
The surface of Ni-44.12 wt. %W-1.86 wt. %B alloy electrodeposited from the plating bath
without BD shows coarse nodular structure as the small globules superimposed on the bigger ones
show that the surface is not uniform and composed of different sized domains (Figure 2(a)). A surface
smoothing effect was observed with the addition of 0.5 g L-1
BD to the bath solution (Figure 2(b)). The
more smooth deposit is the Ni-34.83 wt. %W-1.86 wt. %B alloy prepared from electrolyte with BD
concentration of 1 g L-1
(Figure 2(c)). By increasing BD concentration beyond this value, the deposit
appearance became slightly rougher and there were more micro-cracks at the deposits (Figure 2(d)).
Generally, the brightener introduction has played a major role in reducing/inhibiting the activation of
Int. J. Electrochem. Sci., Vol. 6, 2011
1194
additional nodule sites. This has led to refinement in microstructure and disappearance of nodules in
the deposit. This could be the reason for obtaining very smooth and bright ternary Ni-W-B coating.
Figure 2. Surface morphology depending on BD concentration in electrolyte: (a) 0, (b) 0.5, (c) 1 and
(d) 1.5 g L-1
.
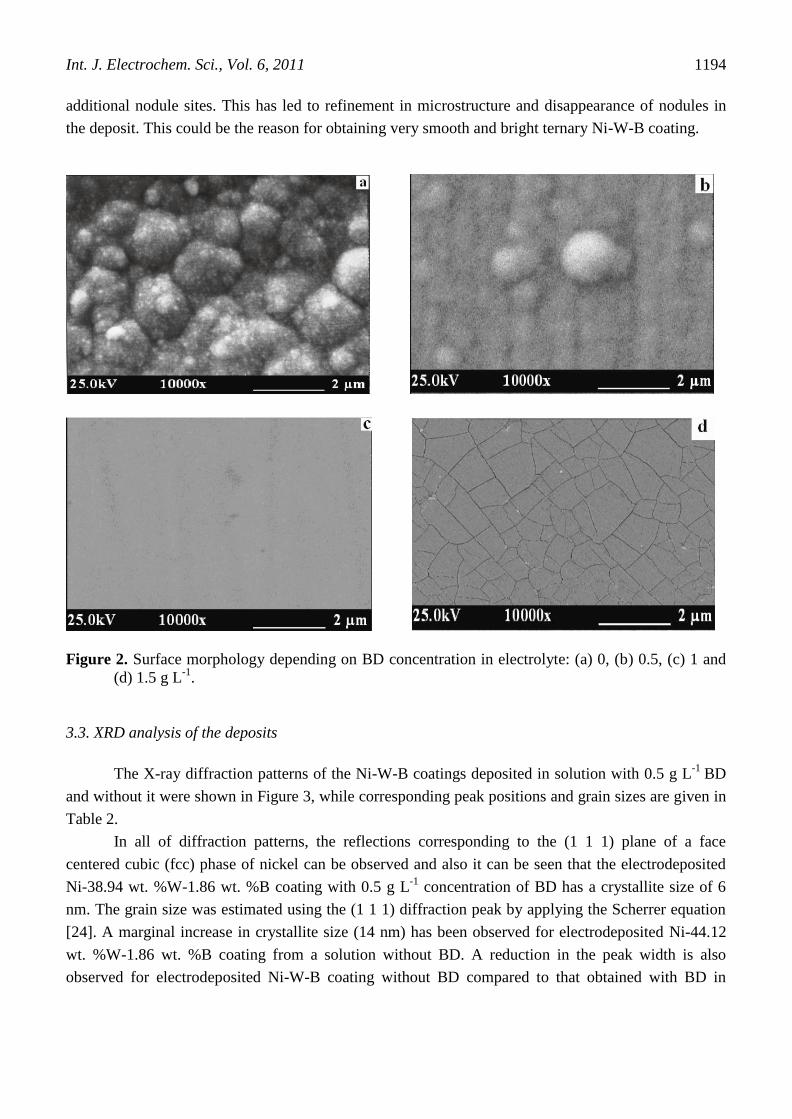
3.3. XRD analysis of the deposits
The X-ray diffraction patterns of the Ni-W-B coatings deposited in solution with 0.5 g L-1
BD
and without it were shown in Figure 3, while corresponding peak positions and grain sizes are given in
Table 2.
In all of diffraction patterns, the reflections corresponding to the (1 1 1) plane of a face
centered cubic (fcc) phase of nickel can be observed and also it can be seen that the electrodeposited
Ni-38.94 wt. %W-1.86 wt. %B coating with 0.5 g L-1
concentration of BD has a crystallite size of 6
nm. The grain size was estimated using the (1 1 1) diffraction peak by applying the Scherrer equation
[24]. A marginal increase in crystallite size (14 nm) has been observed for electrodeposited Ni-44.12
wt. %W-1.86 wt. %B coating from a solution without BD. A reduction in the peak width is also
observed for electrodeposited Ni-W-B coating without BD compared to that obtained with BD in
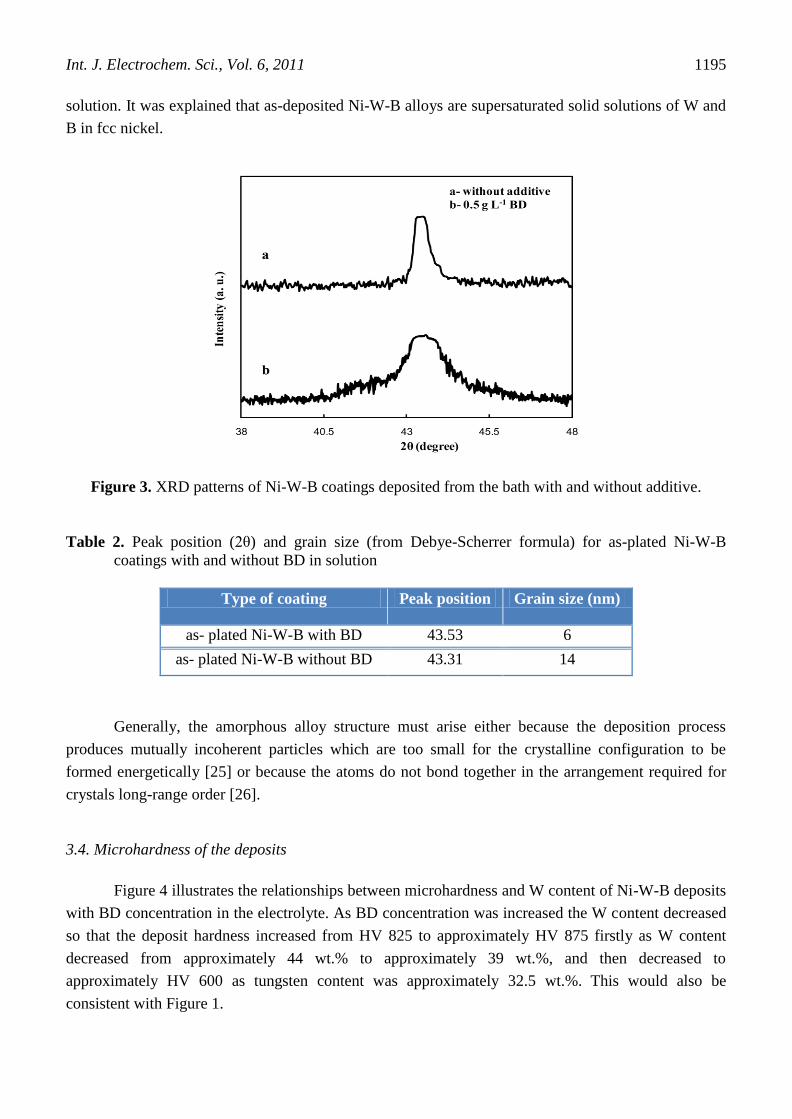
Int. J. Electrochem. Sci., Vol. 6, 2011
1195
solution. It was explained that as-deposited Ni-W-B alloys are supersaturated solid solutions of W and
B in fcc nickel.
Figure 3. XRD patterns of Ni-W-B coatings deposited from the bath with and without additive.
Table 2. Peak position (2θ) and grain size (from Debye-Scherrer formula) for as-plated Ni-W-B
coatings with and without BD in solution
Grain size (nm) Peak position Type of coating
6 43.53 as- plated Ni-W-B with BD
14 43.31 as- plated Ni-W-B without BD
Generally, the amorphous alloy structure must arise either because the deposition process
produces mutually incoherent particles which are too small for the crystalline configuration to be
formed energetically [25] or because the atoms do not bond together in the arrangement required for
crystals long-range order [26].
3.4. Microhardness of the deposits
Figure 4 illustrates the relationships between microhardness and W content of Ni-W-B deposits
with BD concentration in the electrolyte. As BD concentration was increased the W content decreased
so that the deposit hardness increased from HV 825 to approximately HV 875 firstly as W content
decreased from approximately 44 wt.% to approximately 39 wt.%, and then decreased to
approximately HV 600 as tungsten content was approximately 32.5 wt.%. This would also be
consistent with Figure 1.

Int. J. Electrochem. Sci., Vol. 6, 2011
1196
Figure 4. Effect of BD concentration in the electrolyte on the tungsten content and deposit
microhardness
The hardness variation is believed to result from the grain size refinement effect of the addition
of BD or sodium tungstate to the electrolyte. The maximum hardness was achieved for the Ni-38.94
wt. %W-1.86 wt. %B alloy, which was about 875 HV, as shown in Figure 4.
3.5. Electrochemical impedance spectroscopy studies
The equivalent circuit, Nyquist and Bode plots for Ni-W-B alloys plated at solutions with
concentration of 0.5 g L-1
BD and without it at different immersion times in 3.5% NaCl solution are
shown in Figures 5, 6.
Figure 5. Equivalent circuit, Nyquist (a) and Bode plots (b) for Ni-44.12 wt. %W-1.86 wt. %B alloy
deposited from solution without BD concentration after different immersion times.
In these Figures, almost all of the curves appear to be similar (Nyquist plots), consisting of a
single semicircle in the investigated frequency region signifying the electron transfer reaction at the
metal/solution interface. However, it should be noted that though these curves appear to be similar

Int. J. Electrochem. Sci., Vol. 6, 2011
1197
with respect to their shape, they differ considerably in their size. This indicates that the same
fundamental processes must be occurring on all these coatings but to different extent in each case. The
dissolution of Ni species is due to the Cl− attack (e.g. NiO + H2O →Ni
2+ + 2OH
−). In addition, the
formation of nickel oxide species (e.g. Ni2+
+ 2H2O → Ni(OH)2 + 2H+) should also provide the
impedance at the electrolyte/hydroxide interface.
Figure 6. Equivalent circuit, Nyquist (a) and Bode plots (b) for Ni-38.94 wt. %W-1.86 wt. %B alloy
deposited from solution with 0.5 g L-1
BD concentration after different immersion times.
Therefore, the above reactions can be modeled as a double- layer capacitor in parallel with a
charge-transfer resistor.
Figure 7. Nyquist diagram of impedance spectrum of experimental data (dots points) and fitting curve
(solid line) for Ni-44.12 wt. %W-1.86 wt. %B alloy deposited from solution without BD
concentration in 3.5 wt. % NaCl solution after 2 h of immersion.
The best equivalent circuit for the EIS spectra of the alloys is a randles-like model, designated
as Rs-Rct-CPE, in which the polarization charge transfer resistance (Rct) is in parallel with a constant

Int. J. Electrochem. Sci., Vol. 6, 2011
1198
phase element (CPE), and both of these elements are in series with the ohmic resistance (Rs), as shown
in Figures 5, 6. In this model, constant- phase element may have some combination of capacitative,
resistive and inductive character [27]. In this model, Rs is the total ohmic resistance of the
electrochemical cell and contains contributions from the solution, cables and other sources.
Rct is considered to be the corrosion resistance of the alloy, which is inversely proportional to
the corrosion current density. The CPE is defined by two parameters, T and P, in the equation for
impedance [28, 29].
pjTZ
)(
1
(3)
The value of the exponent P may vary from 0 to 1. If p equals 0, then the CPE is a resistor. A
CPE is often used in an equivalent circuit model in place of a capacitor to compensate for
inhomogeneity in the system. In Figure 7 is represented one experimental diagram together with the
best fit curve in terms of equivalent circuit of Figures 5, 6. It could be observed that the experimental
impedance data fit very well with the equivalent circuit proposed.
Table 3. Corrosion data obtained from EIS spectra in 3.5 wt. % NaCl solution after different
immersion time calculated with equivalent circuit from figures 5 and 6.
Sample Element
0.5 h 2 h 4 h 8 h 12 h 24 h
Without
BD
Rs (Ω cm2) 5.342 5.955 7.72 8.76 8.348 7.662
CPE-T (F cm-2
) 0.00046343 0.00090055 0.00033863 0.0017445 0.00061129 0.0001742
CPE-P 0.750 0.798 0.764 0.761 0.77 0.811
R ct (Ω cm2) 2832 2544 1979 963 450.6 137.6
Error (%) 1.62 2.48 1.02 1.69 0.88 0.79
0.5 g L-1
BD
Rs (Ω cm2) 8.989 9.119 8.321 7.094 5.803 6.681
CPE-T (F cm-2
) 0.0002959 0.0017028 0.00039721 0.00019877 0.0013926 0.00083553
CPE-P 0.845 0.789 0.840 0.821 0.763 0.752
R ct (Ω cm2) 6547 4733 3572 1859 725.1 488.9
Error (%) 0.84 5.98 1.21 0.88 2.56 1.81
The best fit values of the equivalent-circuit elements for Ni-W-B alloys deposited at solutions
with concentration of 0.5 g L-1
BD and without it are listed in Table 3. The data in this Table indicate
that the mean error of modulus is smaller than 6%, indicating a good fitting of the experimental data.
In Table 3, the values of CPE-P for Ni-W-B alloys deposited at solutions with concentration of 0.5 g L-
1 BD are larger than those of the Ni-W-B alloys deposited at solutions without BD, indicating the
smooth nature of these deposits.
The charge transfer resistance for Ni-W-B alloys as a function of the immersion time in 3.5 wt.
% NaCl solution is shown in Figure 8.

Int. J. Electrochem. Sci., Vol. 6, 2011
1199
Figure 8. Calculated charge transfer resistance for Ni-W-B alloy coatings as a function of the
immersion time in 3.5 wt. % NaCl solution
It can be seen that the charge transfer resistance of coatings decreased with increasing
immersion time in 3.5 wt. % NaCl solution. Based on the results obtained from the impedance diagram
the following conclusions can be drawn: The highest value of charge transfer resistance (6547 Ohm
cm2) was obtained for Ni-W-B alloy deposited from solution with concentration of 0.5 g L
-1 BD after
0.5h immersion time.
The charge transfer resistance values of Ni-W-B alloys deposited at solutions with BD were
higher compared to those of the alloys without BD, maybe it is due to the change in alloy
electrodeposition mechanism and a decreases in the grain size as well as a total increase in the
amorphousity of the alloy were evident as confirmed by XRD results shown in Figure 3. The Bode
plots for all coatings showed similar trends and thus it can be concluded that only one mechanism
prevailed for the corrosion of the coatings.
3.6. Potentiodynamic polarization studies
Potentiodynamic polarization curves were recorded for nanocrystalline Ni-38.94 wt. %W-1.86
wt. %B alloy, Ni-30.74 wt. %W-1.86 wt. %B alloy deposited from solution with 0.5 g L-1
BD
concentration in current density of 30 mA cm-2
and conventional coarse-grained polycrystalline Ni-
44.12 wt. %W-1.86 wt. %B alloy in 1 N H2SO4 solution (Figure 9).

Int. J. Electrochem. Sci., Vol. 6, 2011
1200
Figure 9. Potentiodynamic polarization curves of Ni-W-B coatings deposited from the bath with and
without additive in 1 N H2SO4 at scan rate of 1 mV s-1
Comparison of curves a-c, reveals two features; first, the sequence of deposits with respect to a
less negative Eocp is: Ni-44.12 wt. %W-1.86 wt. %B alloy (−0.28 V) << Ni-30.74 wt. %W-1.86 wt. %B
alloy (−0.047 V) < Ni-38.94 wt. %W-1.86 wt. %B alloy (−0.027 V). This positive shift in Eocp
indicates the good anticorrosion property of nanocrystalline Ni-W-B coatings deposited in solution
with 0.5 g L-1
BD in sulfuric acid medium. The hydrogen evolution is the predominant reduction
reaction in the present case. It is known that defects like dislocation, affects the kinetics of hydrogen
evolution reaction. Moreover, reversible trapping of hydrogen at the dislocations, grain boundaries and
voids (pores) can change the kinetics of hydrogen evolution. Second, the critical current densities of
passivation for all the Ni-W-B samples were approximately similar. This indicates that the mechanism
of onset of passivity and passivation itself is similar in nature for all the Ni-W-B samples. There were
two reasons for superior corrosion resistance of Ni-W-B alloy films; one is preferential dissolution of
Ni and formation of W-rich film on the surface, which inhibited further corrosion. During the
corrosion process tungsten preferentially migrates toward the surface and forms oxides; other reasons
are water molecules which are absorbed on the electrode surface and the formation of Ni(OH)2 passive
films, according to the following different mechanisms involving chemical and electrochemical steps
[30, 31]:
Ni + H2O → Ni(H2O) ads (4)
Ni(H2O) ads → Ni(OH) +
+ H++ 2e
- (5)
Ni(OH) +
+ OH- → Ni(OH)2 (6)

Int. J. Electrochem. Sci., Vol. 6, 2011
1201
The insoluble Ni(OH)2 covers the surface of the corroded samples and creates the passivation
region (approximately from +0.35 V to +1.55 V) where the current density is almost independent of
the potential. With an increase of potential up to approximately +1.55 V, the anodic current density
dramatically increases with the increase of potential, indicating the breakdown of the surface Ni(OH)2
passive film and the occurrence of pitting corrosion in Ni-W-B coatings.
3.7. EIS measurements at different anodic potentials
Equivalent circuits and the influence of the different anodic potentials on the impedance pattern
of Ni-38.94 wt. %W-1.86 wt. %B alloy coatings in 1 N sulfuric acid solution are presented in Figure
10.
Figure 10. Equivalent circuits and Nyquist’s plots of Ni-38.94 wt. %W-1.86 wt. %B alloy deposited
from solution with 0.5 g L-1
BD concentration in 1 N H2SO4 at different anodic potentials

Int. J. Electrochem. Sci., Vol. 6, 2011
1202
The EIS measurements were carried out sequentially starting with freshly Ni-W-B samples and
polarizing it at increasingly anodic potentials. The equivalent circuit model and the Nyquist diagrams
of Ni-38.94 wt. %W-1.86 wt. %B alloy coatings in the potential range 0.15-0.3 V are shown in Figure
10a (active region). In this model, Rs, R1, CPE1 and W are the solution resistance, the charge transfer
resistance, constant phase element and Warburg diffusion impedance, respectively.
In the potential range 0.15-0.275 V, one can observe a poorly defined high-frequency
capacitive loop, followed by a Warburg type behavior linked to the diffusive electro-kinetic control.
This kind of behavior can be related to mass-transport controlled dissolution of the Ni-W-B alloy. In
this region, with increasing of potential, the values of R1 of samples tend to decrease, indicating an
easier diffusion of species to the electrode surface and a faster electrochemical reaction process, as the
least of the charge transfer resistance can be seen in anodic nose (0.275 V). In potential of 0.3 V, that
is required potential for forming of the passive film, corrosion resistance of coating increased
somewhat.
Figure 11. Nyquist diagrams (dotts) and the fitted curves (solid lines) of Ni-38.94 wt. %W-1.86 wt.
%B alloy deposited at solution with 0.5 g L-1
BD concentration in 1 N H2SO4 at potentials (a)
0.15 V (b) 0.5 V and (c) 1.7 V vs. SCE.
Generally, corrosion rate is affected by the dissolution of Ni together with the inter-diffusion of
Ni2+
and OH− ions to the electrode surface. In potential of 0.5 V, the complex plane plot presented only
one capacitive loop and one inductive loop at low frequencies (Figure 10(b)); the capacitive loop is
associated with the double layer capacity and the inductive loop can be associated with the

Int. J. Electrochem. Sci., Vol. 6, 2011
1203
adsorption/desorption process. In corresponding equivalent circuit, R2 and L1 are the resistance and
inductance related to the adsorption/desorption process, respectively. In potential of 1 V, there are two
time constants in the impedance spectrum (Figure 10b).
Table 4. Fitting results of the impedance spectra of Ni-38.94 wt. %W-1.86 wt. %B alloy at different
anodic potentials in 1 N H2SO4 solution.
Element 0.15 V 0.22 V 0.275 V 0.3 V 0.5 V 1 V 1.7 V
Rs (Ω cm2) 3.044 3.29 3.043 3.342 4.005 4.193 2.612
CPE1(F cm-2
) 0.0001157 0.00012172 0.000062907 0.000055659 0.001279 0.00039335 0.0016316
R1( Ω cm2) 9.555 4.342 0.0016149 0.66836 48 83.02 1.546
CPE2(F cm-2
) - - - - - 0.0097989 3.886
R2( Ω cm2) - - - - 56 184.9 1.385
L1 (H cm2) - - - - 57 - -
W1( Ω s-1/2
) 51.4 42.93 3.675 466.7 - - -
Error (%) 0.037 0.044 0.04 2.9 1.67 2.73 0.1
In this potential, an equivalent circuit consisting of two RC circuits shown was proposed.
Circuit R2CPE2 describes the electrode Faraday process (nickel oxidation) and corresponds to low-
frequency impedance while circuit R1CPE1 represents the presence of a surface film and corresponds
to high-frequency impedance. Generally, in potentials of 0.5 V and 1 V (passive region), because of
formation of the WO3, NiO and Ni(OH)2 films, corrosion resistance of coating increased very much
(Figure 10b).
The Nyquist plot at potential of 1.7 V, corresponding to trans-passive region is shown in Figure
10c. In this potential, an equivalent circuit consisting of two RC circuits is also proposed. In this
region, due to break down of passive film, both the charge transfer resistance and the resistance of the
film drop drastically. Generally, decrease in the resistance values during of the active region was
ascribed to the dissolution of Ni, while the increasing resistance was attributed to the presence of
corrosion products on the surface, which improved the barrier properties. This feature is typical of a
surface containing corrosion products that act as a barrier against corrosion.
The Figure 11 shows that the fitting data have good correlation with experimental impedance
results. The corresponding data for each element are listed in Table 4. The goodness of the fit can be
judged by the estimated relative errors as presented in Table 4 and by the fitting lines in Figure 11.
4. CONCLUSIONS
Based on the results obtained in the present investigation on electrodeposited nanocrystalline
Ni-W-B alloys in the presence and absence of BD the following conclusions have been drawn: The
incorporation of BD into the plating bath resulted in inhibition of crystal growth, reduction of surface

Int. J. Electrochem. Sci., Vol. 6, 2011
1204
roughness, increase in surface brightness and sharp reduction of grain size. The microhardness of as-
plated Ni-W-B coatings reaches 875 HV that is comparable to the hardness of traditional
electrodeposited chromium. Based on the results and discussion for the corrosion potential, corrosion
current and corrosion resistance from the electrochemical polarization methods and the corrosion
resistance from the EIS technique, the Ni-38.94 wt. %W-1.86 wt. %B alloys deposited at solution with
0.5 g L-1
BD concentration are concluded to be the best corrosion resistant coatings compared to those
of the alloys deposited at solution without BD. The superior corrosion resistance of Ni-W-B alloy
films was due to preferential dissolution of nickel and formation of tungsten rich film or Ni(OH)2
passive films on the surface. All the Ni-W-B samples exhibited active-passive-transpassive
polarization behavior due to the reasons mentioned above. The shift of OCP toward more the noble
potential with decreasing grain size has been related to modification in cathodic reaction (hydrogen
reduction) processes. The mechanism of onset of passivity and passivation itself is similar in nature for
all the Ni-W-B samples.
ACKNOWLEDGEMENT
The authors would like to acknowledge the financial support of Iranian Nanotechnology Society and
the Office of Vice Chancellor in Charge of Research of University of Tabriz.
References
1. J.H. Lindsay, Plat. Surf. Finish. 82 (1995) 19.
2. P.C. Wynn, C.V. Bishop, Trans. IMF. 79 (2001) 27.
3. J. N. Balaraju and K. S. Rajam, Int. J. Electrochem. Sci., 2 (2007) 747 – 761. [20]
4. E. Lassner, W.D. Schubert, Tungsten - Properties, Chemistry, Technology of the Element, Alloys,
and Chemical Compounds, Springer, 1999.
5. E. Beltowska-Lehman, Phys. Stat. Sol. 5 (2008) 3514.
6. E.J. Podlaha, D. Landolt, J. Electrochem. Soc. 143 (1996) 885.
7. E.J. Podlaha, D. Landolt, J. Electrochem. Soc. 144 (1997) 1672.
8. M. Donten, H. Cesiulis, Z. Stojek, Electrochim. Acta. 45 (2000) 3389.
9. A.Brenner, Electrodeposition of Alloys 2, Academic Press Inc, New York, 1963.
10. T. Yamasaki, P. SchloBmacher, K. Ehrlich, Y. Ogino, Nanostruct. Mater. 10 (1998) 375.
11. M. Donten, T. Gromulski, Z. Stojek, J. Alloys and Comp. 279 (1998) 272.
12. [R.M. Krishnam, Kennedy C. Joseph, Jayakrishnam Sobha, S. Sriveeraraghavan, S.R. Natarajam,
Met. Finish. 7 (1995) 33.
13. G.E. Shahin, Plat. Surf. Finish. 85 (1998) 8.
14. H. Capel, P.H. Shipway, S.J. Harris, Wear. 255 (2003) 917.
15. M. Jayalakshmi, Woo-Young Kim, Kwang-Deog Jung, Oh-Shim Joo, Int. J. Electrochem. Sci., 3
(2008) 356 – 408
16. E.W. Brooman, Met. Finish. 99 (2004) 42.
17. S. Latif, M. Mehmood, J. Ahmad, M. Aslam, M. Ahmed, Z.D. Zhang, Appl. Surf. Sci., 256 (2010)
3098.
18. M.G. Hosseini, M. Abdolmaleki, S.A. Seyed Sadjadi, Protection of Metals and Physical Chemistry
of Surfaces. 45 (2009) 757.
19. M.G. Hosseini, M. Abdolmaleki, S.A. Seyed Sadjadi, M. Raghibi Boroujeni, M.R. Arshadi, H.
Khoshvaght, Surf. Eng. 25 (2009) 382.

Int. J. Electrochem. Sci., Vol. 6, 2011
1205
20. M. G. Hosseini, M. R. Arshadi, Int. J. Electrochem. Sci., 4 (2009) 1339 – 1350.
21. .R. Yazdzad, T.Shahrabi, M.G. Hosseini, Mat. Chem. Phy 109 (2008) 199.
22. T. Shahrabi, A.R. Yazdzad, M.G. Hosseini, J. Mat. Sci. Tech. 24 (2008) 427.
23. N. Eliaz,. TM. Sridhar, E. Gileadi, Electrochim. Acta. 50 (2005) 2893.
24. B.D. Cullity, Elements of X-Ray Diffraction, 2nd ed, Addison-Wesley, Reading, 1978, p. 281.
25. T. Omi, H.L. Glass, H. Yamamoto, J. Electrochem. Soc. 123 (1976) 341.
26. T. Omi, H. Yamamoto, H.L. Glass, J. Electrochem. Soc. 119 (1972) 168.
27. W.S. Tait, An Introduction to Electrochemical Corrosion Testing for Practicing Engineers and
Scientists, Pair O Docs Publications, Racine, WI, 1994, pp. 79 and 95.
28. I.D. Raistrick, J.R. Macdonald (Ed.), D.R. Franceschetti, Impedance Spectroscopy, Wiley, New
York, 1987, p. 27.
29. Gamry Instruments, Warminster, PA. Application Notes, in “The Basics, Electrochemical
Impedance Spectroscopy: A Primer”, (Gamry Instruments, Warminster PA, 2000).
30. W.A. Badawy, K.M. Ismail, A.M. Fathi, Electrochim. Acta. 50 (2005) 3603.
31. W.A. Badawy, F.M. Al-Kharafi, J.R. Al-Ajmi, J. Appl. Electrochem. 30 (2000) 693.
© 2011 by ESG (www.electrochemsci.org)