Ef cient associative memory storage in cortical circuits of
9
Efficient associative memory storage in cortical circuits of inhibitory and excitatory neurons Julio Chapeton, Tarec Fares, Darin LaSota, and Armen Stepanyants 1 Department of Physics and Center for Interdisciplinary Research on Complex Systems, Northeastern University, Boston, MA 02115 Edited by Terrence J. Sejnowski, Salk Institute for Biological Studies, La Jolla, CA, and approved November 2, 2012 (received for review July 10, 2012) Many features of synaptic connectivity are ubiquitous among cortical systems. Cortical networks are dominated by excitatory neurons and synapses, are sparsely connected, and function with stereotypically distributed connection weights. We show that these basic structural and functional features of synaptic connectivity arise readily from the requirement of efficient associative memory storage. Our theory makes two fundamental predictions. First, we predict that, despite a large number of neuron classes, functional connections between potentially connected cells must be realized with <50% probability if the presynaptic cell is excitatory and >50% probability if the pre- synaptic cell is inhibitory. Second, we establish a unique relation between probability of connection and coefficient of variation in connection weights. These predictions are consistent with a dataset of 74 published experiments reporting connection probabilities and distributions of postsynaptic potential amplitudes in various cortical systems. What is more, our theory explains the shapes of the distri- butions obtained in these experiments. learning and memory | cortical connectivity | synaptic weight | perceptron | critical capacity F undamental functions of the brain, such as learning and mem- ory storage, are mediated by many mechanisms of excitatory (1– 4) and inhibitory (5–9) synaptic plasticity. Working together with the genetically encoded developmental mechanisms of circuit for- mation, synaptic plasticity shapes neural circuits by creating, mod- ifying, and eliminating individual synaptic connections in an experience-dependent manner. It is, therefore, reasonable to hy- pothesize that many stereotypic features of adult synaptic connec- tivity, whether established through evolution or the developmental learning process, have arisen to facilitate memory storage. In this study, we focus on three such features of cortical connec- tivity. Cortical connectivity is predominantly excitatory; it is medi- ated by two major classes of neurons—excitatory glutamatergic and inhibitory GABAergic cells. Chemical synapses made by the axons of inhibitory cells in the adult brain are believed to be all inhibitory, whereas those synapses made by the axons of excitatory neurons are believed to be all excitatory (10). The resulting connectivity is largely excitatory, with only about 15–20% of inhibitory neurons and inhibitory synapses (11). The second stereotypic feature of cortical connectivity is sparseness. Networks in the cortex are thought to be organized into relatively small units ranging from hundreds to tens of thousands of neurons in size. Such units may include mini columns (12, 13), structural columns (14, 15), and a variety of functional columns (16, 17). Analysis of neuron mor- phology (14, 18–21) has shown that cells within such units have the potential of being connected by structural synaptic plasticity (22– 24). However, despite this potential, synaptic connectivity within the units is sparse. For example, nearby excitatory neurons in the neocortex are synaptically coupled with less than 50% probability (25–30), and this probability decays with the increase in lateral distance between the neurons beyond the 100-μm range (29). Al- though connections between inhibitory and excitatory neurons are comparatively more frequent (29, 31), their probabilities also are well below 100%. Lastly, we note that the distributions of excitatory and inhibitory connection weights, measured in terms of the amplitudes of unitary postsynaptic potentials (PSPs), have a ste- reotypic shape (28–30, 32–34). This shape can be described as a truncated Gaussian, except for a somewhat heavier tail. In this study, we set out to show that the above basic structural and functional features of cortical circuits could have arisen from the hypothesized requirement of efficient memory storage. Over the years, there has been a great deal of theoretical interest in the problem of associative memory storage. In particular, the perceptron (35, 36) and networks composed of McCulloch and Pitts neurons (37) received much attention (32, 38–46). This is due in part to the existence of a theoretical framework for solving such problems, which was initially developed in the context of statistical physics. Remarkably, most of the models considered thus far do not explicitly constrain the neurons in the network to be either excit- atory or inhibitory, and thus, these models are not biologically plausible. Notable exceptions are the studies by Brunel et al. (32) and Barbour et al. (34) that analyzed associative memory storage in a model of a Purkinje cell receiving excitatory parallel fiber inputs. These works show that, at the maximum (critical) storage capacity, the probability of finding a functional parallel fiber to Purkinje cell connection is less than 50% (32, 34). In other words, the majority of parallel fibers that are potentially connected to a given Purkinje cell does not establish functional connections (i.e., connections are either silent or absent). What is more, the shape of the PSP am- plitude distribution is consistent with the idea that the parallel fiber Purkinje cell system is functioning at its critical memory storage capacity. In this study, we extend the framework in the works by Brunel et al. (32) and Barbour et al. (34), making it applicable to cortical neurons receiving both excitatory and inhibitory inputs. We show that the critical memory storage capacity and the shape of the connection weight distribution in the biologically constrained model considered here exhibit complex dependence on network architecture (i.e., connection probabilities and the fraction of in- hibitory neurons). By comparing the theoretical results with the connection probabilities and the distributions of unitary PSP amplitudes measured in numerous cortical systems, we substantiate the hypothesis of efficient memory storage and put forward ex- perimentally verifiable predictions regarding cortical connectivity. Results Associative Memory Storage in Local Cortical Circuits. We analyze a recurrent McCulloch and Pitts neural network (37) of N inh in- hibitory and N exc = N − N inh excitatory neurons (Fig. 1A, Left). This network represents a small cortical unit (e.g., structural or functional column), in which neurons are all to all connected in terms of potential synapses (14, 19). This restriction on the geo- metric size of the network is necessary to ensure that, if needed, Author contributions: A.S. designed research; J.C., T.F., D.L., and A.S. performed research; J.C., T.F., D.L., and A.S. analyzed data; and J.C., T.F., D.L., and A.S. wrote the paper. The authors declare no conflict of interest. This article is a PNAS Direct Submission. 1 To whom correspondence should be addressed. E-mail: [email protected]. This article contains supporting information online at www.pnas.org/lookup/suppl/doi:10. 1073/pnas.1211467109/-/DCSupplemental. www.pnas.org/cgi/doi/10.1073/pnas.1211467109 PNAS Early Edition | 1 of 9 NEUROSCIENCE PNAS PLUS
Transcript of Ef cient associative memory storage in cortical circuits of
Efficient associative memory storage in cortical circuitsof inhibitory and excitatory neuronsJulio Chapeton, Tarec Fares, Darin LaSota, and Armen Stepanyants1
Department of Physics and Center for Interdisciplinary Research on Complex Systems, Northeastern University, Boston, MA 02115
Edited by Terrence J. Sejnowski, Salk Institute for Biological Studies, La Jolla, CA, and approved November 2, 2012 (received for review July 10, 2012)
Many features of synaptic connectivity are ubiquitous among corticalsystems. Cortical networks are dominated by excitatory neurons andsynapses, are sparsely connected, and function with stereotypicallydistributed connection weights. We show that these basic structuraland functional features of synaptic connectivity arise readily fromthe requirement of efficient associativememory storage. Our theorymakes two fundamental predictions. First, we predict that, despitea large number of neuron classes, functional connections betweenpotentially connected cellsmust be realizedwith<50%probability ifthe presynaptic cell is excitatory and >50% probability if the pre-synaptic cell is inhibitory. Second, we establish a unique relationbetween probability of connection and coefficient of variation inconnection weights. These predictions are consistent with a datasetof 74 published experiments reporting connection probabilities anddistributions of postsynaptic potential amplitudes in various corticalsystems. What is more, our theory explains the shapes of the distri-butions obtained in these experiments.
learning and memory | cortical connectivity | synaptic weight |perceptron | critical capacity
Fundamental functions of the brain, such as learning and mem-ory storage, are mediated by many mechanisms of excitatory (1–
4) and inhibitory (5–9) synaptic plasticity. Working together withthe genetically encoded developmental mechanisms of circuit for-mation, synaptic plasticity shapes neural circuits by creating, mod-ifying, and eliminating individual synaptic connections in anexperience-dependent manner. It is, therefore, reasonable to hy-pothesize that many stereotypic features of adult synaptic connec-tivity, whether established through evolution or the developmentallearning process, have arisen to facilitate memory storage.In this study, we focus on three such features of cortical connec-
tivity. Cortical connectivity is predominantly excitatory; it is medi-ated by two major classes of neurons—excitatory glutamatergic andinhibitory GABAergic cells. Chemical synapses made by the axonsof inhibitory cells in the adult brain are believed to be all inhibitory,whereas those synapses made by the axons of excitatory neuronsare believed to be all excitatory (10). The resulting connectivity islargely excitatory, with only about 15–20% of inhibitory neuronsand inhibitory synapses (11). The second stereotypic feature ofcortical connectivity is sparseness. Networks in the cortex arethought to be organized into relatively small units ranging fromhundreds to tens of thousands of neurons in size. Such units mayinclude mini columns (12, 13), structural columns (14, 15), anda variety of functional columns (16, 17). Analysis of neuron mor-phology (14, 18–21) has shown that cells within such units have thepotential of being connected by structural synaptic plasticity (22–24). However, despite this potential, synaptic connectivity withinthe units is sparse. For example, nearby excitatory neurons in theneocortex are synaptically coupled with less than 50% probability(25–30), and this probability decays with the increase in lateraldistance between the neurons beyond the 100-μm range (29). Al-though connections between inhibitory and excitatory neurons arecomparatively more frequent (29, 31), their probabilities also arewell below 100%. Lastly, we note that the distributions of excitatoryand inhibitory connection weights, measured in terms of theamplitudes of unitary postsynaptic potentials (PSPs), have a ste-
reotypic shape (28–30, 32–34). This shape can be described asa truncated Gaussian, except for a somewhat heavier tail. In thisstudy, we set out to show that the above basic structural andfunctional features of cortical circuits could have arisen from thehypothesized requirement of efficient memory storage.Over the years, there has been a great deal of theoretical interest
in the problem of associative memory storage. In particular, theperceptron (35, 36) and networks composed of McCulloch andPitts neurons (37) received much attention (32, 38–46). This is duein part to the existence of a theoretical framework for solving suchproblems, which was initially developed in the context of statisticalphysics. Remarkably, most of themodels considered thus far do notexplicitly constrain the neurons in the network to be either excit-atory or inhibitory, and thus, these models are not biologicallyplausible. Notable exceptions are the studies by Brunel et al. (32)and Barbour et al. (34) that analyzed associativememory storage ina model of a Purkinje cell receiving excitatory parallel fiber inputs.These works show that, at the maximum (critical) storage capacity,the probability of finding a functional parallel fiber to Purkinje cellconnection is less than 50% (32, 34). In other words, the majorityof parallel fibers that are potentially connected to a given Purkinjecell does not establish functional connections (i.e., connections areeither silent or absent). What is more, the shape of the PSP am-plitude distribution is consistent with the idea that the parallelfiber Purkinje cell system is functioning at its critical memorystorage capacity.In this study, we extend the framework in the works by Brunel
et al. (32) and Barbour et al. (34), making it applicable to corticalneurons receiving both excitatory and inhibitory inputs. We showthat the critical memory storage capacity and the shape of theconnection weight distribution in the biologically constrainedmodel considered here exhibit complex dependence on networkarchitecture (i.e., connection probabilities and the fraction of in-hibitory neurons). By comparing the theoretical results with theconnection probabilities and the distributions of unitary PSPamplitudesmeasured in numerous cortical systems, we substantiatethe hypothesis of efficient memory storage and put forward ex-perimentally verifiable predictions regarding cortical connectivity.
ResultsAssociative Memory Storage in Local Cortical Circuits. We analyzea recurrent McCulloch and Pitts neural network (37) of Ninh in-hibitory and Nexc = N − Ninh excitatory neurons (Fig. 1A, Left).This network represents a small cortical unit (e.g., structural orfunctional column), in which neurons are all to all connected interms of potential synapses (14, 19). This restriction on the geo-metric size of the network is necessary to ensure that, if needed,
Author contributions: A.S. designed research; J.C., T.F., D.L., and A.S. performed research;J.C., T.F., D.L., and A.S. analyzed data; and J.C., T.F., D.L., and A.S. wrote the paper.
The authors declare no conflict of interest.
This article is a PNAS Direct Submission.1To whom correspondence should be addressed. E-mail: [email protected].
This article contains supporting information online at www.pnas.org/lookup/suppl/doi:10.1073/pnas.1211467109/-/DCSupplemental.
www.pnas.org/cgi/doi/10.1073/pnas.1211467109 PNAS Early Edition | 1 of 9
NEU
ROSC
IENCE
PNASPL
US

any connectivity diagram can be realized during learning. Theweights, J, of inhibitory and excitatory connections in the modelrepresent the amplitudes of inhibitory and excitatory postsynapticpotentials (IPSP and EPSP). Zero-weight connections correspondto unconnected neurons or neurons connected only with silentsynapses. Our theoretical model needs not distinguish betweenthese two possibilities, because both cases are classified as an ab-sence of a connection in electrophysiological experiments. Theactivity of neurons in the network, where zero represents theresting state and one is the firing state, is described by the prob-ability of firing, f. This activity is determined at every time step bycomparing the neuron’s total input with its firing threshold, h (Fig.1A, Right). Both f and h may differ among neuron classes.The state of the network in our model is described by a set of
binary activities of all neurons. The neurons can learn to associatecertain subsequent network states by modifying their connectionweights. Such learning may be important for processing of sensoryinformation and recall of memories. A number of constraints mustbe imposed on the learning process to build a biologically plausiblemodel. First, because all synapses made by inhibitory neurons inthe adult brain are inhibitory and all synapses made by excitatoryneurons are excitatory, the signs of the connection weights in thenetwork should remain fixed throughout learning. Such a networkis referred to as sign-constrained (43), whereas in the absenceof this constraint, the network is termed unconstrained. Second,our analysis of published electrophysiological data (ExperimentalProcedures and Tables S1 and S2) shows that the variability in theneurons’ firing thresholds is significantly smaller than the vari-
ability in the weights of connections that they receive. This ob-servation motivated us to keep the firing thresholds of all modelneurons fixed throughout learning. Third, it is commonly assumedthat, similar to many biological networks (47, 48), cortical net-works need to be robust (32, 40). Robustness may be required towithstand failures in generation or propagation of presynapticaction potentials, spontaneous neural activity, synaptic failure, andfluctuations in synaptic weight. The requirement of robustness isimposed in the model by the parameter κ ≥ 0 (Experimental Pro-cedures and SI Text). For nonzero κ, small fluctuations within thenetwork do not necessarily change its dynamics.In this work, we assume that the networkmust learn to associate
pairs of subsequent states that are random and independent. Withthis assumption, the problem of learning by the network becomesequivalent to the problem of learning by the N independent in-hibitory and excitatory neurons that it contains. Consequently, it issufficient to analyze learning in a single biologically constrainedneuron (Fig. 1A, Right). The ratio between the number of associ-ations (m) that such a neuron can learn and the total number ofpotential inputs (N) that it receives is referred to as the neuron’scapacity, α = m/N. Fig. 1B shows how the probability of perfectlearning depends on the number of presented associations. Withincreasing m, it becomes progressively more difficult to find con-nection weights that fulfill all associations, and therefore, theprobability of successful learning is a decaying function of m. Thecapacity at which the associations can be learned with 50% successprobability is known as the critical capacity, αc (40). Fig. 1B illus-trates that αc = 2 for a simple unconstrained perceptron learning
Fig. 1. Associative memory storage in perceptron-like neural network models. (A) A local neural circuit (e.g., cortical column; Left), consisting of inhibitory(red) and excitatory (blue) neurons, may be modeled as a network of binary threshold units. Each such unit (Right) can learn to associate input patterns withappropriate outputs by adjusting the weights of its connections, J. (B) The probability of learning a set of presented associations decreases with the number ofassociations in the set,m. Critical capacity, αc (dashed arrows), is defined as the number of associations per potential input,m/N, that can be learned with 50%probability of success. Critical capacity is two in the unconstrained and one in the sign-constrained perceptron model. The dependence of success probabilityon number of associations for this model is shown in red. Solid lines show theoretical results (38), and dotted lines are the results of numerical simulations. (C)Geometric interpretation of the presented model for a neuron receiving only two potential inputs. The two sets of inequalities in Eq. 1 parse the space ofpossible connection weights, J1 and J2, with padded dashed lines for the associations and the figure axes for the sign constraints. The colored areas mark allpossible solution regions (if a solution exists). In the limit of a large number of potential inputs, N, the solution must be in the vicinity (gray region) of thehyperplane provided by Eq. 2.
2 of 9 | www.pnas.org/cgi/doi/10.1073/pnas.1211467109 Chapeton et al.

random unbiased (f= 0.5) associations (38) and that αc reduces toone if a sign constraint is applied (42–44). The red curve in Fig. 1Bshows that the success probability in our model exhibits a similarcritical dependence on the number of presented associations.The biologically constrained neuron is faced with the learning
task of finding connection weights J that fulfill the presented set ofassociations given the above-mentioned constraints (second set ofinequalities in Eq. 1). This task is illustrated geometrically in Fig.1C for a neuron receiving only two potential inputs. The axes in Fig.1C parse the space of the possible connection weights into positive(excitatory) and negative (inhibitory) regions. The solution has tobe confined to one of four quadrants as prescribed by the in-hibitory/excitatory nature of the individual inputs (sign constraints).The dashed lines in Fig. 1C represent the individual associationsthat the neuron must learn. Robust learning restricts the solutionsto be on a particular side of the margin surrounding each dashedline (first set of inequalities in Eq. 1). Combined, the two sets ofrequirements constrain the solutions (if a solution exists) to a singleconvex region (one of the colored regions in Fig. 1C).In the limit of large N and m, the total input received by the
biologically constrained neuron is near threshold (SI Text), and thesolution region is guaranteed to be on the hyperplane described byEq. 2 (gray region in Fig. 1C). As the neuron learns a progressivelyincreasing number of associations, the solution volume decreases,and at the critical number of associations, the typical volume ofsolutions shrinks to zero. This number is the maximum number ofassociations that the neuron can learn. Any additional learning isnot possible without forgetting some of the previously learnedassociations. Next, we examine the properties of the biologicallyconstrained neuron at its critical capacity.
Properties of the Biologically Constrained Neuron at Critical Capacity.The properties of the biologically constrained neuron at criticalcapacity depend on the four model parameters: the fraction ofpotential inhibitory inputs, Ninh/N; the firing probabilities of in-hibitory and excitatory neurons, finh and fexc; and rescaled robust-ness parameter, ~κ ¼ κ
ffiffiffiffiN
p=h. Fig. 2 illustrates some aspects of this
dependence. For networks of mostly excitatory neurons (Ninh/N <0.5), the critical capacity is a decreasing function of robustness(Fig. 2A). This trend can be explained by the fact that some of thesolution regions close as ~κ increases (Fig. 1C), lowering the solu-tion probability. In the limit of large ~κ, all interior solution regionsclose, and αc converges to its minimum value (black line in Fig.2A). These theoretical results were confirmed by numerical sim-ulations (dotted lines in Fig. 2A).A characteristic feature of sign-constrained neural networks at
critical capacity is a finite fraction of zero-weight connections (32,43). The zero-weight connections result from the clear delineationof synapses into excitatory and inhibitory. In the course of learn-ing, the weights of many inhibitory and excitatory connections willapproach zero, where many of these weights will remain, becausethey are unable to cross to the other side. This feature is essentialfor biological feasibility, because a finite fraction of zero-weightconnections (or less than 100% probability of connection betweenneurons) is a ubiquitous feature of neural circuits in the brain. Fig.2B illustrates how the connection probability, Pcon, depends on thevalue of robustness and the fraction of inhibitory neurons. For~κ ¼ 0, both excitatory and inhibitory connection probabilities re-main at 50% for all values of Ninh/N < 0.5. In robust networks(~κ> 0), excitatory connection probabilities decrease, whereas theprobabilities for inhibitory connections increase with increasingNinh/N or ~κ. This trend is accompanied with the overall strength-ening of inhibitory and excitatory connections (Fig. 2C) and a de-cline in the neuron’s ability to recall learned associations reliablyin the presence of noisy synaptic transmission (Fig. 2D). The re-liability of recall is captured by the reliability parameter ρ (32),which is defined as the ratio of robustness to noise fluctuations inthe input (SI Text). For some combinations of Ninh/N, finh, fexc, and
~κ (Fig. 2, ♦), the average absolute connection weight diverges, andat the same time, the reliability parameter reduces to zero, ren-dering such network configurations metabolically and functionallyunfavorable.
Comparison of Theoretical Predictionswith Experimental Measurements.In this section, we test the predictive power of the theory by makingcomparisons with the available synaptic connectivity data. To thisend, we examined experimental connection probabilities and shapesof unitary PSP amplitude distributions for inhibitory and excitatoryinputs to principle cortical neurons (e.g., pyramidal cell in the ce-rebral cortex or Purkinje cell in the cerebellum). Although ourtheoretical results may hold well for nonprinciple postsynaptic cells,this idea is not examined here in detail because of insufficient ex-perimental data (Discussion). To facilitate the comparison, thetheoretical results are expressed only in terms of experimentallymeasurable parameters Ninh/N, Pinh
con, and Pexccon (SI Text, section 6).
Fig. 3A shows that the volume of biologically plausible solutions,expressed in terms of these parameters, is very limited. It amounts toonly 4.9% of the total volume of the parameter space (unit cube inFig. 3A). Any combination ofNinh/N, Pinh
con, and Pexccon outside the 4.9%
volume corresponds to a subcritical network or a completely un-reliable network (ρ=0) with prohibitively large connection weights.Fig. 3B shows experimental distributions of inhibitory and ex-
citatory connection probabilities gathered from a large number ofstudies (Experimental Procedures and Table S2). In agreement withthe theoretical predictions, probabilities of excitatory connectionsare entirely within the region of biologically plausible solutions(green square in Fig. 3B); inhibitory connection probabilities, al-though not entirely within the region, have a significant overlap. Itshould be noted that connection probabilities obtained in tis-sue-slice recording experiments may underestimate the in vivo
Fig. 2. Critical capacity and properties of connectivity in the presentedmodel. (A) Critical capacity as a function of the fraction of inhibitory neuronsfor different values of robustness, ~κ. Solid lines show results of the theo-retical calculation (Eq. S24), and dotted lines are the results of numericalsimulations performed for N = 100 neurons. The critical capacity decreaseswith increasing ~κ if the fraction of inhibitory neurons is less than 50%. (B)Dependence of inhibitory (dashed lines) and excitatory (solid lines) connec-tion probabilities, Pcon, on model parameters. Color key is shown in A. Thefractions of inhibitory neurons beyond which connections are prohibitivelyexpensive and memory storage is unreliable are shown by ♦. (C and D) De-pendence of the average inhibitory/excitatory connection weights and thereliability parameter, ρ, on fraction of inhibitory neurons.
Chapeton et al. PNAS Early Edition | 3 of 9
NEU
ROSC
IENCE
PNASPL
US
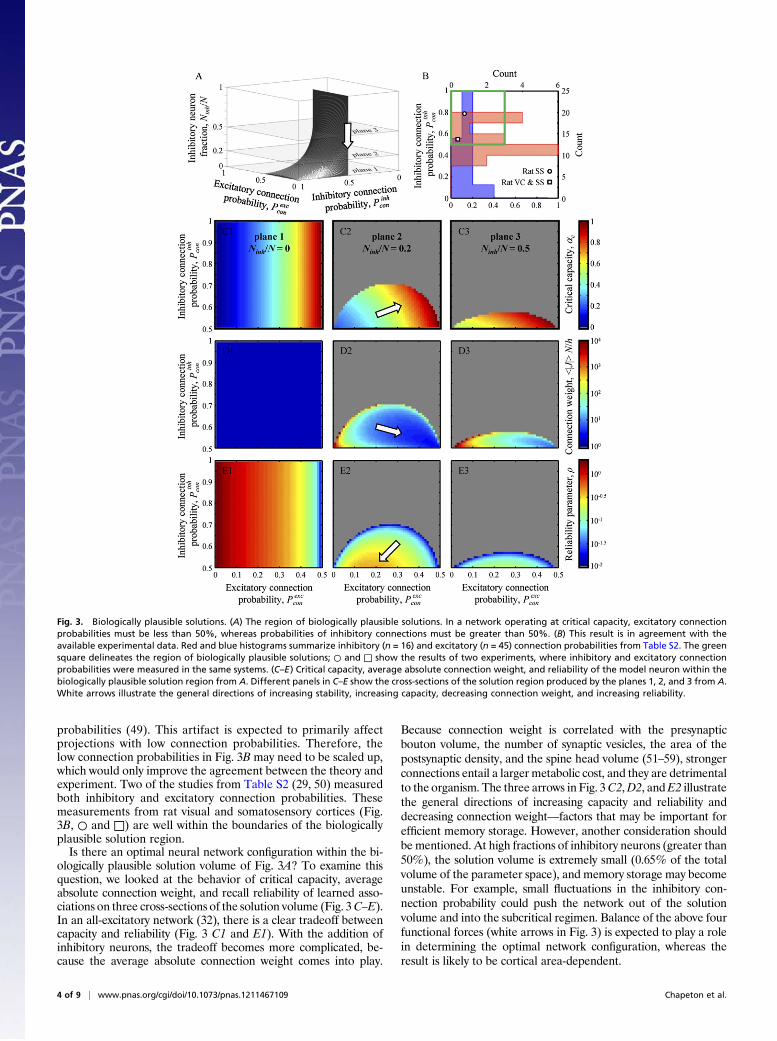
probabilities (49). This artifact is expected to primarily affectprojections with low connection probabilities. Therefore, thelow connection probabilities in Fig. 3B may need to be scaled up,which would only improve the agreement between the theory andexperiment. Two of the studies from Table S2 (29, 50) measuredboth inhibitory and excitatory connection probabilities. Thesemeasurements from rat visual and somatosensory cortices (Fig.3B, ○ and □) are well within the boundaries of the biologicallyplausible solution region.Is there an optimal neural network configuration within the bi-
ologically plausible solution volume of Fig. 3A? To examine thisquestion, we looked at the behavior of critical capacity, averageabsolute connection weight, and recall reliability of learned asso-ciations on three cross-sections of the solution volume (Fig. 3C–E).In an all-excitatory network (32), there is a clear tradeoff betweencapacity and reliability (Fig. 3 C1 and E1). With the addition ofinhibitory neurons, the tradeoff becomes more complicated, be-cause the average absolute connection weight comes into play.
Because connection weight is correlated with the presynapticbouton volume, the number of synaptic vesicles, the area of thepostsynaptic density, and the spine head volume (51–59), strongerconnections entail a larger metabolic cost, and they are detrimentalto the organism. The three arrows in Fig. 3C2,D2, andE2 illustratethe general directions of increasing capacity and reliability anddecreasing connection weight—factors that may be important forefficient memory storage. However, another consideration shouldbe mentioned. At high fractions of inhibitory neurons (greater than50%), the solution volume is extremely small (0.65% of the totalvolume of the parameter space), and memory storage may becomeunstable. For example, small fluctuations in the inhibitory con-nection probability could push the network out of the solutionvolume and into the subcritical regimen. Balance of the above fourfunctional forces (white arrows in Fig. 3) is expected to play a rolein determining the optimal network configuration, whereas theresult is likely to be cortical area-dependent.
Fig. 3. Biologically plausible solutions. (A) The region of biologically plausible solutions. In a network operating at critical capacity, excitatory connectionprobabilities must be less than 50%, whereas probabilities of inhibitory connections must be greater than 50%. (B) This result is in agreement with theavailable experimental data. Red and blue histograms summarize inhibitory (n = 16) and excitatory (n = 45) connection probabilities from Table S2. The greensquare delineates the region of biologically plausible solutions; ○ and □ show the results of two experiments, where inhibitory and excitatory connectionprobabilities were measured in the same systems. (C–E) Critical capacity, average absolute connection weight, and reliability of the model neuron within thebiologically plausible solution region from A. Different panels in C–E show the cross-sections of the solution region produced by the planes 1, 2, and 3 from A.White arrows illustrate the general directions of increasing stability, increasing capacity, decreasing connection weight, and increasing reliability.
4 of 9 | www.pnas.org/cgi/doi/10.1073/pnas.1211467109 Chapeton et al.

Next, we compared the shapes of the theoretical and experi-mental distributions of connection weights. Similar to the study byBrunel et al. (32) performed for all-excitatory connections, ourtheory predicts that the distributions of inhibitory and excitatoryconnection weights must consist of finite fractions of zero-weightconnections and Gaussians shifted to the left and truncated at zero(Eq. 3). This theoretical finding is validated with a numericalsimulation in Fig. 4A. For the first point of comparison, we deriveda unique theoretical expression relating (with no free parameters)the coefficient of variation (CV) in connection weight and theconnection probability. Fig. 4B shows the experimental data (red/blue points and histograms) overlaid on the theoretical curve(green line). The histograms represent all of the CV and con-nection probability data from Table S2, whereas the points rep-resent studies where CV and the connection probability weremeasured in the same experiment. As expected (Fig. 3B), there isa clear clustering between inhibitory and excitatory connectionprobabilities, with the former being significantly higher. There isalso a reasonably good agreement between the data points and thetheoretical prediction (R2 = 0.72, n = 38 points). However, CVsfor many excitatory projections seem to be significantly greaterthan predicted. For example, the agreement between theory andexperiment improves substantially if data points corresponding toexcitatory projections from mouse and rat barrel cortices (Fig. 4B,blue open circles) (33, 60) are excluded from the analysis (adjustedR2 = 0.83, n = 26). Unexpectedly large CVs result from a smallfraction of very large-amplitude EPSPs (5- to 10-fold larger thanthe mean) recorded in many cortical systems (30, 33, 60). Al-though not very numerous (see for example Fig. 5G), these strongconnections seem to be a characteristic feature of cortical con-nectivity. We postpone the discussion of the tail of the connectionweight distribution for the moment, and instead, we continue withthe examination of the overall distribution shape.The nine largest count distributions of unitary PSP amplitudes
(Table 1) were selected from the dataset for comparison with thetheoretical distribution of connection weights. One-parameter fitsof these distributions with Eq. 3 are shown in Fig. 5. The fitting
parameter was required to match the dimensionless scale of thetheoretical connection weights to the scale of unitary PSP ampli-tudes recorded in millivolts. Gray bins in all of the histograms inFig. 5 were deemed unreliable and excluded from fitting (Experi-mental Procedures). The goodness of all fits, as captured by theadjusted R2 coefficients 0.92 ± 0.07 (mean ± SD), was high. Asexpected, a closer examination of the tails of the distributionsrevealed the deviations from the theoretical model.To examine this deviation in more detail, we replotted the two
highest count distributions (Fig. 5 F andG) along with their fits ona logarithmic scale by using logarithmic binning. Fig. 6 A and Bshows that the theoretical fits appear to be nearly perfect on asemilog scale (adjusted R2 = 0.995 and 0.989). However, on a log–log scale (Fig. 6C), the deviation between the tails of the theo-retical Gaussian distributions (Fig. 6, dashed lines) and the ex-perimental distributions (Fig. 6, solid lines) becomes apparent.Remarkably, the two experimental distributions of connectionweights obtained from rat visual and mouse barrel cortices (Fig.6C, solid blue and red lines) have nearly identical shapes on a log–log scale. In fact, the remaining seven distributions from Fig. 5exhibit very similar nonexponential decays (not confirmed statis-tically because of the low counts), suggesting that this feature maybe inherent to many cortical areas.Subcriticality of the network and nonlinearity in the input
summation have been proposed as possible explanations for theheavy tails of the experimental distributions of connection weights(34). Here, we examine an alternative possibility. Because thetheoretical results were obtained in the limit of large network size(N→∞), we wondered whether the heavy tail of the experimentalconnection weight distribution could be a result of the finite net-work size. Fig. 6D shows the result of a numerical simulationperformed for a model neuron receiving 75 inhibitory and 425excitatory potential connections. The tail of this finite-size nu-merical distribution (Fig. 6D, solid line) deviates from the infinite-size theoretical distribution (Fig. 6D, dashed line) in a mannersimilar to the manner observed in Fig. 6C for the experimentaldistributions. Hence, the heavy tails of unitary PSP amplitudedistributions may be explained by the fact that cortical neuronsreceive large (N ∼ 1,000) but finite numbers of potential inputs.
DiscussionIn this study, we examined the hypotheses that cortical circuits aredesigned for efficient associative memory storage and that manystereotypic features of adult synaptic connectivity originate fromthis requirement. To test the hypothesis, we theoretically solved theproblem of associative memory storage in a model network of bi-ologically constrained inhibitory and excitatory neurons. The resultsquantitatively explain many basic features of cortical connectivity,providing support for the efficient memory storage hypothesis.Our theoretical analysis builds on the work by Brunel et al.
(32), which considers an excitatory feed-forward system con-sisting of a cerebellar Purkinje cell receiving excitatory parallelfiber inputs. The work by Brunel et al. (32) shows that sucha system is analogous to a perceptron functioning at criticalmemory storage capacity. Motivated by recent observations ofinhibitory neuron plasticity (5–9), we developed a more generaltheory, which can be applied to networks containing not onlyexcitatory but also inhibitory neurons. Our results suggest thatboth neuron classes are actively involved in efficient associativememory storage.Specifically, our theory makes two experimentally testable pre-
dictions. First, we predict that, despite a large number of neuronclasses, all inhibitory to excitatory connections between potentiallyconnected neurons must be realized with >50% connection prob-ability. In contrast, all-excitatory to excitatory connections musthave <50% connection probability. Hence, connectivity is sparse(i.e., it contains a large fraction of zero-weight connections). Azero-weight connection between potentially connected neu-
Fig. 4. Distribution of connection weights. (A) The histogram showsa characteristic distribution of connection weights for a neuron receiving N =500 potential connections, 15% of which are inhibitory. The two broken barsnear zero represent the fractions of inhibitory and excitatory zero-weightconnections. The green lines show the theoretical fit of the distribution witha function consisting of two truncated Gaussians and two Dirac δ-functions.Note that both Gaussian fits, corresponding to the inhibitory and excitatoryparts of the distribution, are shifted to the left relative to zero. (B) Thetheory predicts a unique relation between the CV of connection weights andthe probability of connection (green line). This prediction is supported by theavailable experimental data. Red and blue histograms summarize CVs (10inhibitory and 41 excitatory projections) and connection probabilities (16inhibitory and 45 excitatory projections) for the inhibitory and excitatoryprojections from Table S2. The red (n = 8) and blue (n = 30) points are theresults of studies where CVs and connection probabilities were determinedin the same experiment; ○ denotes data from rodent barrel cortex (BC).
Chapeton et al. PNAS Early Edition | 5 of 9
NEU
ROSC
IENCE
PNASPL
US

rons corresponds to the absence of functional synaptic contacts(unconnected neurons or neurons connected by silent synapses).Second, we predict that the CV in the connection weights isuniquely related to the probability of that connection. These fun-damental predictions do not depend on any parameters and musthold for all circuits that are designed for learning. We tested thesepredictions on a dataset compiled from a large number of pub-lished studies, in which connection probabilities and unitary EPSP/IPSP amplitudes had been measured for postsynaptic principlecells in various cortical systems. These measurements, based on a
total of 74 experiments, are in good agreement with the theory(Figs. 3B and 4B).Do the model predictions extend on postsynaptic inhibitory
cells? To examine this question, we identified eight studies in whichthe probabilities of excitatory and inhibitory connections ontopostsynaptic inhibitory cells were determined based on recordingsfrom at least 20 connected neuron pairs. These probabilities are0.60 (n = 73 connected pairs) among inhibitory [fast spiking in-hibitory (FS) and somatostatin positive inhibitory cell] cells (64)and 0.47 (n= 110) for excitatory (regular spiking excitatory cell) to
Fig. 5. Theoretical distributions of connectionweights are consistentwith experimentalmeasurements. Histograms inA–I showexperimental probability densities ofconnection weights obtained from the studies listed in Table 1. Note that C describes an inhibitory projection. The green lines are one-parameter fits according to Eq.3. Because of the experimental uncertainties in the detection ofweak connections, gray bars in the histogramswere ignored duringfitting. In all cases, the area underthefit function (excluding the range of the gray bars) is normalized tomatch the area of the blue bars. The goodness offits is captured by the adjusted R2 coefficients.
Table 1. Nine largest count distributions of unitary PSP amplitudes obtained from published experimental studies
No. Species Brain area Projection Age (d)Pcon (no. of
connected pairs)Unitary PSP amplitude
mean ± SD (mV; no. of pairs) CV Ref.
A Rat SS L5 PC → L5 PC P14–16 0.10 (138) 1.3 ± 1.1 (138) 0.85 28B Rat VC and SS L2/3 PC → L2/3 PC P14–16 0.06 (83) 0.65 ± 0.64 (83) 0.98 29C Rat VC and SS L2/3 FS → L2/3 PC P14–16 0.55 (109) 3.0 ± 2.5 (109) 0.85 29D Rat BC L4 EXC → L4 EXC P12–15 0.20–0.31 (132) 1.6 ± 1.5 (132) 0.95 26E Rat VC L5 PC → L5 PC P12–21 0.15 (239) 0.73 ± 0.63 (139) 0.86 61F Rat VC L5 PC → L5 PC P14–16 0.12 (931) 0.77 ± 0.84 (931) 1.1 30G Mouse BC All layers, EXC → EXC P18–21 0.10 (909) 0.75 ± 0.94 (909) 1.2 33H Rat CB Granule → Purkinje cell P60–90 0.071 (34) 0.072 ± 0.064 (104) 0.89 32, 62I Guinea pig HC CA3 PC → CA1 PC 600–900 g 0.063 (72) 0.13 ± 0.11 (74) 0.83 63
Letters in the first column match Fig. 5. The complete dataset analyzed in this study is described in Table S2. BC, barrel cortex; CB, cerebellum; EXC,excitatory (pyramidal and spiny stellate) cells; HC, hippocampus; PC, pyramidal cell; SS, somatosensory cortex; VC, visual cortex.
6 of 9 | www.pnas.org/cgi/doi/10.1073/pnas.1211467109 Chapeton et al.

inhibitory (FS and low-threshold spiking inhibitory cell) con-nections (65) in cortical layer 4 (L4) of rodent barrel cortex; 0.45(n = 146) in auditory cortex (66) and 0.59 (n = 79) in visual andsomatosensory cortices (29) for excitatory to inhibitory (FS) pro-jections in rodent L2/3; 0.43 (n = 26) for pyramidal to Martinotticonnections in L5 of rat somatosensory cortex (67); 0.21 (n = 22)for pyramidal to inhibitory connections in L2/3 of rat somatosen-sory, motor, and visual cortices (68); 0.88 (n= 36) for excitatory toinhibitory (FS) connections in L2/3 of mouse V1 (69); and 0.76(n = 28) for L4 spiny stellate to L2/3 inhibitory cell connections inrat barrel cortex (70). The last two of these projections deviatesignificantly from the predictions of the model, indicating that ei-ther these projections are not directly involved in efficient asso-ciative memory storage or the model assumptions must be revisedto extend the theory on these classes of postsynaptic inhibitorycells. More data are needed to examine these possibilities in detail.The shape of the theoretical distribution for nonzero-weight
connections, which is a truncated Gaussian, is in good agreementwith the experimental distributions of unitary EPSP/IPSP ampli-tudes recorded from principle neurons (Fig. 5). However, a sys-tematic deviation was observed in the tails of the distributions. Asillustrated in Fig. 6C, a heavy, nonexponentially decaying tail isa stereotypic feature of many unitary PSP amplitude distributions.Two mechanisms have been considered to account for this featuretheoretically (32). One argument is that neurons may be operatingbelow their critical capacity. As the memory storage becomes moreand more subcritical, the tail of the connection weight distributiontransitions fromGaussian to exponential. This argument, however,is not sufficient to explain the tails of the experimental dis-tributions, which appear to be superexponential (30). An alterna-
tive mechanism is the nonlinear summation of inputs, which forspecific forms of nonlinearity, can result in distributions of con-nection weights with superexponential tails. We propose yet anotherexplanation. Deviations from the theoretical (Gaussian) prediction,similar to those deviations shown in Fig. 6C, were observed in ournumerical simulations performed for large, but finite, numbers ofpotential inputs (N = 100–1,000) (Fig. 6D). Hence, by attributingthe heavy tail of the PSP amplitude distributions to the finite size ofcortical neural networks, we can account for this feature withoutmoving away from the biologically constrained neuron model con-sidered in this study.Our theoretical model explains how cortical networks may
benefit from the presence of inhibitory neurons. In nonrobust andcompletely unreliable networks (~κ ¼ ρ ¼ 0), the critical capacity isindependent of the inhibitory neuron fraction as long as the systemoperates within the biologically plausible region of solutions (Ninh/N < 0.5 region in Fig. 2A). In this case, the inhibition may, in fact,be unfavorable, because it leads to an increase in the average ab-solute connection weight (Fig. 2C). In contrast, the critical capacityof reliable networks increases with an increasing fraction of in-hibitory neurons, which could be one of the reasons for the pres-ence of inhibitory neurons in cortical circuits. Our results suggestthat sparse cortical circuits, built with small fractions of inhibitoryneurons and synapses, result from the tradeoff among networkcapacity, reliability, metabolic cost, and stability (Fig. 3).
Experimental ProceduresIn this section, we provide a summary of the model, state model assumptions,outline the main theoretical results, and give a brief description of the ex-perimental dataset used to validate these results. Amore detailed descriptioncan be found in SI Text.
Formulation of the Model. In our theoretical model, a neuron receives Npotential connections, of which Ninh are inhibitory and Nexc are excitatory(Fig. 1A). The neuron is presented with a set ofm binary (0, 1) input–outputassociations (ζμj →oμ), which are randomly drawn from the probability dis-tributions of inhibitory and excitatory inputs, Xinh,exc. Here, index μ = 1, . . .,m enumerates different associations, and j = 1, . . ., N enumerates the po-tential inputs. The associations must be learned by the neuron subject toa number of biologically motivated constraints: (i ) learning is mediatedthrough changes in the connection weights, Jj, whereas the firing thresh-old, h, is held constant; (ii) weights of the inhibitory and excitatory con-nections cannot change signs throughout learning; and (iii) the associationsmust be learned robustly, which is enforced by the robustness parameter, κ.The model can be written as a set of inequalities—m inequalities to enforcerobust implementation of the associations and N inequalities to impose thesign constraints (Eq. 1):
ð2oμ − 1Þ
∑N
j¼1Jjζ
μj −h
!> κ> 0; μ ¼ 1; . . . ;m
Jjgj > 0; j ¼ 1; . . . ;N
ζinh;exc ∈ Xinh;exc ; o∈ Xexc
Xinh;exc ¼�0; 1− finh;exc1; finh;exc
:
[1]
Here, f is the probability of firing, and gj specifies the sign of input weight j(−1 for inhibitory and +1 for excitatory).
In the large N limit, the total input received by the biologically con-strained neuron is near threshold (Eq. S3), and as a result, all solutions ofEq. 1 must be located in the vicinity of a single hyperplane (gray region inFig. 1C) (Eq. 2):
∑N
j¼1
�1−gj
2finh þ 1þ gj
2fexc
�Jj ¼ h: [2]
The critical capacity of the model and the distribution of connection weightsat critical capacity can be calculated in this limit by using the replica theoryfrom statistical physics (32, 40). In result, the critical capacity αc, connectionprobabilities Pcon
inh;exc , and probability densities of inhibitory and excitatoryconnection weights, Pinh,exc(J), are determined in terms of the four model
Fig. 6. The distributions of connection weights have heavy, nonexponentiallydecaying tails. To examine the tails of the distributions, we replotted the twolargest count probability densities from Fig. 5 F and G on a semilog scale in Aand B and a log–log scale in C. Equal-sized bins on the logarithmic scale wereused in these plots. The blue and red solid lines in C correspond to the dis-tributions in A and B, respectively. The dashed lines are the corresponding fitsfrom A and B. (D) The nonexponential decay observed experimentally isreproduced in numerical simulations. To illustrate this point, we replotted thedistribution of excitatory connections from Fig. 4A on a log–log scale (solidblack line). The dashed line is the theoretical fit from Fig. 4A.
Chapeton et al. PNAS Early Edition | 7 of 9
NEU
ROSC
IENCE
PNASPL
US

parameters, Ninh/N, finh, fexc, and ~κ ¼ κffiffiffiffiN
p=h. In particular, one can show that
the probability densities of nonzero inhibitory and excitatory connectionweights are Gaussian, shifted to the left by an amount dependent on con-nection probability, and truncated at zero (Eq. 3):
Pinh;excðJÞ ¼ 1ffiffiffiffiffiffi2π
psinh;excP con
inh;exc
e−�
Jffiffi2
psinh;exc
±erfinv�2P con
inh;exc −1�2
;
�J<0; inhJ>0; exc:
[3]
Parameter s in this expression, defining the distribution scale, is the onlyparameter used in the fitting of the experimental distributions in Fig. 5;erfinv denotes the inverse error function.
Model Assumptions and Approximations. Below, we provide some biologicaljustifications for a number of assumptions and approximations made in thetheory. McCulloch and Pitts neurons with binary (0, 1) inputs and outputs wereused to represent cortical cells. This simplification can be justified if one canchoose an integration window that is larger than the duration of a typicalunitary PSP (τd) but small enough not to contain PSPs from multiple actionpotentials from the same input. Such binning is possible if the average firingfrequencies of neurons in the network are sufficiently low, f × τd < 1. Thiscondition also ensures that the postsynaptic neurons generally produce one orzero action potentials per integration window. We examined this conditionfor local neocortical networks. Connections between cortical pyramidal cellsproduce unitary EPSPs of 20–100 ms in duration (28, 33, 63), whereas theiraverage spontaneous firing rates in vivo are below 10 Hz (71–74). Thesenumbers justify input/output binarization for the excitatory model neurons.For inhibitory to excitatory connections, IPSP durations and in vivo inhibitoryfiring frequencies vary depending on the class of the inhibitory cell but gen-erally support the above assumption (71, 73, 75–77). We would like to notethat, because most of the results of this study (Figs. 3, 4, 5, and 6) are cast ina manner that is independent of firing probabilities, we expect them to holdeven if the product f × τd was somewhat greater than one.
We assume that coincident PSPs arriving from different inputs to a neuronsum linearly, which is generally a very good approximation for corticalneurons (32, 78, 79). The neurons in the model can learn by adjusting theirconnection weights; however, the firing thresholds are kept constant. Thisapproximation is based on the observation that the distributions of con-nection weights between neurons in different systems are much more var-iable than the distributions of the neurons’ firing thresholds. For example,Tables S1 and S2 show that the CVs in connection weights, 0.47–1.7 [0.94 ±0.03 (mean ± SE), n = 52 systems], are significantly higher than the CVs forfiring thresholds, 0.10–0.24 (0.17 ± 0.02, n = 9 systems).
The activities of the model neurons at different time steps are randomlydrawn from their respective probability distributions, giving rise to in-dependent network states. This approximation is motivated by the Poisson-like statistics of cortical spike trains recorded in vivo (80). Although successiveinterspike intervals are often negatively correlated, these correlations aresmall and reduce to zero at low firing frequencies (ref. 81 and referencestherein). With this approximation, it is possible to decouple the recurrentnetwork into a set of independent perceptron-like units (Fig. 1A) (34). Wealso assume that these units are functioning at their critical capacities, whichenables us to find a unique analytic solution, independent of the details ofthe learning rule. Although it is difficult to evaluate the effect of theseassumptions directly, they are supported by the agreement of our theoret-ical results with the experimental measurements.
Throughout this study, we discuss only two types of neurons, inhibitoryand excitatory; however, the theory can be easily generalized to include anynumber of distinct neuron classes. Given the assumptions of the model, onecan show that the probabilities of inhibitory connections must be higher than50% for all inhibitory neuron classes, whereas the connection probabilitiesfor all-excitatory neuron types must be below 50%. Similarly, the resultsshown in Figs. 4, 5, and 6 will remain unaltered.
The theoretical calculations in this studywere performed in the largeN limitto use the powerful methods of statistical physics. However, the numbers oflocal potential connections received by cortical neurons range from thousands(in primary neocortical areas) to hundreds of thousands (for Purkinje cells). Arethese numbers large enough to justify the large N approximation? To answerthis question, we compared a number of theoretical results to the corre-sponding results of the finite-sized numerical simulations. Figs. 1B, 2A, and 4Ashow that most quantities that we describe already converge to their theo-retical values at 100–500 potential inputs. A notable exception is that the tailof the numerical connection weight distribution, obtained for 100–500 po-tential inputs, deviates from the theoretically predicted Gaussian (Fig. 6). In-terestingly, a similar deviation is observed experimentally.
Experimental Dataset and Data Analysis. The dataset used in this study wascompiled from a number of published articles reporting local connectivitymeasurements obtained in patch-clamp or sharp-electrode recording experi-ments. Specifically, we targeted studies containing distributions of unitary PSPamplitudes, mean values and SDs of unitary PSP amplitudes, and/or connectionprobabilities. Initially, we selected about 200 articles published in the majorneuroscience journals,but later,we limitedouranalysis toexperiments inwhichrecordings were made from at least 20 connected neuron pairs (Table S2).Furthermore, because of very sparse data regarding connections onto post-synaptic inhibitory interneurons (Discussion), we decided to limit our analysisto excitatory and inhibitory connections onto the principle neurons (e.g., py-ramidal and spiny stellate cells in the cerebral cortex and Purkinje cells in thecerebellum). These restrictions lead to 42 articles describing 74 projections.
A custom-made MatLab (MathWorks) algorithm was used to extract accu-rate quantitative information fromhigh-resolution digital images of publisheddistributions of unitary PSP amplitudes. The distributions were fit with Eq. 3 inMatLab using the Nonlinear Least Squares method, and goodness of fits wascharacterized by the adjusted R2 coefficients provided by MatLab’s fit func-tion. Because of fluctuations in baseline recordings, very weak connectionsbetween neurons cannot be detected reliably. Such connections are oftenmissed or ignored in experiments, leading to a systematic underestimate ofweak connection counts. Therefore, connections with weights below PSP de-tection thresholds [0.1–0.25 mV in rodent neocortex (26, 28, 82, 83) and 0.017mV in cerebellum (32)] were deemed unreliable and ignored during fitting(gray bins in Fig. 5 and gray areas in Fig. 6).
Numerical simulations were performed to confirm the results of the theo-retical calculations (Figs. 1B, 2A, and 4A) and examine the tail of the connec-tion weight distribution (Fig. 6D). These simulations were performed by usinga modified perceptron learning algorithm (SI Text).
ACKNOWLEDGMENTS. We thank Vincent Hakim, Nicolas Brunel, BorisBarbour, andDmitri Chklovskii for constructive discussions related to the subjectof this study. A portion of this workwas done byA.S. while on a sabbatical leaveat the Statistical Physics Laboratory of Ecole Normale Supérieure in Paris. Thiswork was supported by National Institutes of Health Grants NS047138and NS063494.
1. Hebb DO (1949) The Organization of Behavior; a Neuropsychological Theory (Wiley,
New York).2. Bliss TV, Lomo T (1973) Long-lasting potentiation of synaptic transmission in the dentate
area of the anaesthetized rabbit following stimulation of the perforant path. J Physiol
232(2):331–356.3. Markram H, Lübke J, Frotscher M, Sakmann B (1997) Regulation of synaptic efficacy
by coincidence of postsynaptic APs and EPSPs. Science 275(5297):213–215.4. Chklovskii DB, Mel BW, Svoboda K (2004) Cortical rewiring and information storage.
Nature 431(7010):782–788.5. Chen JL, et al. (2011) Structural basis for the role of inhibition in facilitating adult
brain plasticity. Nat Neurosci 14(5):587–594.6. Holmgren CD, Zilberter Y (2001) Coincident spiking activity induces long-term changes
in inhibition of neocortical pyramidal cells. J Neurosci 21(20):8270–8277.7. Chen JL, et al. (2012) Clustered dynamics of inhibitory synapses and dendritic spines in
the adult neocortex. Neuron 74(2):361–373.8. Keck T, et al. (2011) Loss of sensory input causes rapid structural changes of inhibitory
neurons in adult mouse visual cortex. Neuron 71(5):869–882.9. van Versendaal D, et al. (2012) Elimination of inhibitory synapses is a major component
of adult ocular dominance plasticity. Neuron 74(2):374–383.
10. Eccles J (1976) From electrical to chemical transmission in the central nervous system.
Notes Rec R Soc Lond 30(2):219–230.11. Braitenberg V, Schüz A (1998) Cortex: Statistics and Geometry of Neuronal Connectivity
(Springer, Berlin), 2nd Ed.12. Peters A, Payne BR (1993) Numerical relationships between geniculocortical
afferents and pyramidal cell modules in cat primary visual cortex. Cereb Cortex
3(1):69–78.13. Mountcastle VB (1997) The columnar organization of the neocortex. Brain 120(Pt 4):
701–722.14. Stepanyants A, et al. (2008) Local potential connectivity in cat primary visual cortex.
Cereb Cortex 18(1):13–28.15. Lübke J, Feldmeyer D (2007) Excitatory signal flow and connectivity in a cortical
column: Focus on barrel cortex. Brain Struct Funct 212(1):3–17.16. Hubel DH, Wiesel TN (1963) Shape and arrangement of columns in cat’s striate cortex.
J Physiol 165:559–568.17. Hubel DH, Wiesel TN (1977) Ferrier lecture. Functional architecture of macaque
monkey visual cortex. Proc R Soc Lond B Biol Sci 198(1130):1–59.18. Binzegger T, Douglas RJ, Martin KA (2004) A quantitative map of the circuit of cat
primary visual cortex. J Neurosci 24(39):8441–8453.
8 of 9 | www.pnas.org/cgi/doi/10.1073/pnas.1211467109 Chapeton et al.

19. Stepanyants A, Chklovskii DB (2005) Neurogeometry and potential synaptic connectivity.Trends Neurosci 28(7):387–394.
20. Kalisman N, Silberberg G, Markram H (2003) Deriving physical connectivity fromneuronal morphology. Biol Cybern 88(3):210–218.
21. Kalisman N, Silberberg G, Markram H (2005) The neocortical microcircuit as a tabularasa. Proc Natl Acad Sci USA 102(3):880–885.
22. Stepanyants A, Hof PR, Chklovskii DB (2002) Geometry and structural plasticity ofsynaptic connectivity. Neuron 34(2):275–288.
23. Trachtenberg JT, et al. (2002) Long-term in vivo imaging of experience-dependentsynaptic plasticity in adult cortex. Nature 420(6917):788–794.
24. Fares T, Stepanyants A (2009) Cooperative synapse formation in the neocortex. ProcNatl Acad Sci USA 106(38):16463–16468.
25. Thomson AM, Morris OT (2002) Selectivity in the inter-laminar connections made byneocortical neurones. J Neurocytol 31(3–5):239–246.
26. Feldmeyer D, Egger V, Lubke J, Sakmann B (1999) Reliable synaptic connectionsbetween pairs of excitatory layer 4 neurones within a single ‘barrel’ of developing ratsomatosensory cortex. J Physiol 521(1):169–190.
27. Feldmeyer D, Lübke J, Silver RA, Sakmann B (2002) Synaptic connections betweenlayer 4 spiny neurone-layer 2/3 pyramidal cell pairs in juvenile rat barrel cortex:Physiology and anatomy of interlaminar signalling within a cortical column. J Physiol538(3):803–822.
28. Markram H, Lübke J, Frotscher M, Roth A, Sakmann B (1997) Physiology and anatomyof synaptic connections between thick tufted pyramidal neurones in the developingrat neocortex. J Physiol 500(2):409–440.
29. Holmgren C, Harkany T, Svennenfors B, Zilberter Y (2003) Pyramidal cellcommunication within local networks in layer 2/3 of rat neocortex. J Physiol 551(1):139–153.
30. Song S, Sjöström PJ, Reigl M, Nelson S, Chklovskii DB (2005) Highly nonrandomfeatures of synaptic connectivity in local cortical circuits. PLoS Biol 3(3):e68.
31. Fino E, Yuste R (2011) Dense inhibitory connectivity in neocortex. Neuron 69(6):1188–1203.
32. Brunel N, Hakim V, Isope P, Nadal JP, Barbour B (2004) Optimal information storageand the distribution of synaptic weights: Perceptron versus Purkinje cell. Neuron43(5):745–757.
33. Lefort S, Tomm C, Floyd Sarria JC, Petersen CC (2009) The excitatory neuronal networkof the C2 barrel column in mouse primary somatosensory cortex. Neuron 61(2):301–316.
34. Barbour B, Brunel N, Hakim V, Nadal JP (2007) What can we learn from synapticweight distributions? Trends Neurosci 30(12):622–629.
35. Rosenblatt M (1957) The Multidimensional Prediction Problem. (Translated from eng).Proc Natl Acad Sci USA 43(11):989–992.
36. Minsky ML, Papert S (1988) Perceptrons: An Introduction to Computational Geometry(MIT Press, Cambridge, MA), Expanded Ed.
37. McCulloch W, Pitts W (1943) A logical calculus of the ideas immanent in nervousactivity. Bull Math Biol 5(4):115–133.
38. Cover TM (1965) Geometrical and statistical properties of systems of linearinequalities with applications in pattern recognition. IEEE Trans EC 14:326–334.
39. Hopfield JJ (1982) Neural networks and physical systems with emergent collectivecomputational abilities. Proc Natl Acad Sci USA 79(8):2554–2558.
40. Gardner E (1988) The space of interactions in neural network models. J Phys A MathGen 21:257–270.
41. Gardner E, Derrida B (1988) Optimal storage properties of neural network models.J Phys A Math Gen 21:271–284.
42. Nadal JP (1990) On the storage capacity with sign-constrained synaptic couplings.Network Comp Neur Syst 1:463–466.
43. Kohler HM, Widmaier D (1991) Sign-constrained linear learning and diluting in neuralnetworks. J Phys A Math Gen 24:L495–L502.
44. Amit JA, Campbell C, Wong KYM (1989) The interaction space of neural networkswith sign_constrained synapses. J Phys A Math Gen 22:4687–4693.
45. Viswanathan RR (1993) Sign-constrained synapses and biased patterns in neuralnetworks. J Phys A Math Gen 26(22):6195–6203.
46. Amit JA, Wong KYM, Campbell C (1989) Perceptron learning with sign-constrainedweights. J Phys A Math Gen 22:2039–2045.
47. Li F, Long T, Lu Y, Ouyang Q, Tang C (2004) The yeast cell-cycle network is robustlydesigned. Proc Natl Acad Sci USA 101(14):4781–4786.
48. Kauffman SA (1993) The Origins of Order: Self-Organization and Selection in Evolution(Oxford Univ Press, New York).
49. Stepanyants A, Martinez LM, Ferecskó AS, Kisvárday ZF (2009) The fractions of short-and long-range connections in the visual cortex. Proc Natl Acad Sci USA 106(9):3555–3560.
50. Silberberg G, Markram H (2007) Disynaptic inhibition between neocortical pyramidalcells mediated by Martinotti cells. Neuron 53(5):735–746.
51. Matsuzaki M, Honkura N, Ellis-Davies GC, Kasai H (2004) Structural basis of long-termpotentiation in single dendritic spines. Nature 429(6993):761–766.
52. Kopec CD, Li B, Wei W, Boehm J, Malinow R (2006) Glutamate receptor exocytosis andspine enlargement during chemically induced long-term potentiation. J Neurosci 26(7):2000–2009.
53. Harvey CD, Svoboda K (2007) Locally dynamic synaptic learning rules in pyramidalneuron dendrites. Nature 450(7173):1195–1200.
54. Yang Y, Wang XB, Frerking M, Zhou Q (2008) Spine expansion and stabilizationassociated with long-term potentiation. J Neurosci 28(22):5740–5751.
55. Zhou Q, Homma KJ, Poo MM (2004) Shrinkage of dendritic spines associated withlong-term depression of hippocampal synapses. Neuron 44(5):749–757.
56. Harris KM, Stevens JK (1988) Dendritic spines of rat cerebellar Purkinje cells: Serialelectron microscopy with reference to their biophysical characteristics. J Neurosci8(12):4455–4469.
57. Schikorski T, Stevens CF (1999) Quantitative fine-structural analysis of olfactorycortical synapses. Proc Natl Acad Sci USA 96(7):4107–4112.
58. Zito K, Scheuss V, Knott G, Hill T, Svoboda K (2009) Rapid functional maturation ofnascent dendritic spines. Neuron 61(2):247–258.
59. Arellano JI, Benavides-Piccione R, Defelipe J, Yuste R (2007) Ultrastructure of dendriticspines: Correlation between synaptic and spine morphologies. Front Neurosci 1(1):131–143.
60. Petersen CC, Sakmann B (2000) The excitatory neuronal network of rat layer 4 barrelcortex. J Neurosci 20(20):7579–7586.
61. Sjöström PJ, Turrigiano GG, Nelson SB (2001) Rate, timing, and cooperativity jointlydetermine cortical synaptic plasticity. Neuron 32(6):1149–1164.
62. Isope P, Barbour B (2002) Properties of unitary granule cell—>Purkinje cell synapses inadult rat cerebellar slices. J Neurosci 22(22):9668–9678.
63. Sayer RJ, Friedlander MJ, Redman SJ (1990) The time course and amplitude of EPSPsevoked at synapses between pairs of CA3/CA1 neurons in the hippocampal slice. JNeurosci 10(3):826–836.
64. Hu H, Ma Y, Agmon A (2011) Submillisecond firing synchrony between differentsubtypes of cortical interneurons connected chemically but not electrically. J Neurosci31(9):3351–3361.
65. Beierlein M, Gibson JR, Connors BW (2003) Two dynamically distinct inhibitorynetworks in layer 4 of the neocortex. J Neurophysiol 90(5):2987–3000.
66. Oswald AM, Doiron B, Rinzel J, Reyes AD (2009) Spatial profile and differentialrecruitment of GABAB modulate oscillatory activity in auditory cortex. J Neurosci29(33):10321–10334.
67. Berger TK, Silberberg G, Perin R, Markram H (2010) Brief bursts self-inhibit andcorrelate the pyramidal network. PLoS Biol 8(9):e1000473.
68. Thomson AM, West DC, Wang Y, Bannister AP (2002) Synaptic connections and smallcircuits involving excitatory and inhibitory neurons in layers 2-5 of adult rat and catneocortex: Triple intracellular recordings and biocytin labelling in vitro. Cereb Cortex12(9):936–953.
69. Hofer SB, et al. (2011) Differential connectivity and response dynamics of excitatoryand inhibitory neurons in visual cortex. Nat Neurosci 14(8):1045–1052.
70. Helmstaedter M, Staiger JF, Sakmann B, Feldmeyer D (2008) Efficient recruitment oflayer 2/3 interneurons by layer 4 input in single columns of rat somatosensory cortex.J Neurosci 28(33):8273–8284.
71. Yazaki-Sugiyama Y, Kang S, Câteau H, Fukai T, Hensch TK (2009) Bidirectionalplasticity in fast-spiking GABA circuits by visual experience. Nature 462(7270):218–221.
72. Puig MV, Celada P, Díaz-Mataix L, Artigas F (2003) In vivo modulation of the activityof pyramidal neurons in the rat medial prefrontal cortex by 5-HT2A receptors:Relationship to thalamocortical afferents. Cereb Cortex 13(8):870–882.
73. Csicsvari J, Hirase H, Czurkó A, Mamiya A, Buzsáki G (1999) Oscillatory coupling ofhippocampal pyramidal cells and interneurons in the behaving Rat. J Neurosci 19(1):274–287.
74. Hromádka T, Deweese MR, Zador AM (2008) Sparse representation of sounds in theunanesthetized auditory cortex. PLoS Biol 6(1):e16.
75. Azouz R, Gray CM, Nowak LG, McCormick DA (1997) Physiological properties ofinhibitory interneurons in cat striate cortex. Cereb Cortex 7(6):534–545.
76. González-Burgos G, Krimer LS, Povysheva NV, Barrionuevo G, Lewis DA (2005)Functional properties of fast spiking interneurons and their synaptic connections withpyramidal cells in primate dorsolateral prefrontal cortex. J Neurophysiol 93(2):942–953.
77. Sun QQ, Huguenard JR, Prince DA (2006) Barrel cortex microcircuits: Thalamocorticalfeedforward inhibition in spiny stellate cells is mediated by a small number of fast-spiking interneurons. J Neurosci 26(4):1219–1230.
78. Cash S, Yuste R (1998) Input summation by cultured pyramidal neurons is linear andposition-independent. J Neurosci 18(1):10–15.
79. Cash S, Yuste R (1999) Linear summation of excitatory inputs by CA1 pyramidalneurons. Neuron 22(2):383–394.
80. Shadlen MN, Newsome WT (1998) The variable discharge of cortical neurons:Implications for connectivity, computation, and information coding. J Neurosci 18(10):3870–3896.
81. Avila-Akerberg O, Chacron MJ (2011) Nonrenewal spike train statistics: Causes andfunctional consequences on neural coding. Exp Brain Res 210(3–4):353–371.
82. Berger TK, Perin R, Silberberg G, Markram H (2009) Frequency-dependent disynapticinhibition in the pyramidal network: A ubiquitous pathway in the developing ratneocortex. J Physiol 587(22):5411–5425.
83. Mason A, Nicoll A, Stratford K (1991) Synaptic transmission between individualpyramidal neurons of the rat visual cortex in vitro. J Neurosci 11(1):72–84.
Chapeton et al. PNAS Early Edition | 9 of 9
NEU
ROSC
IENCE
PNASPL
US