
EEPSEA Research Reports Reports . EEPSEA ......Kim Anh T. Nguyen, Trang T.H. Le, Chuong N.P.T. Bui,...
52
Transcript of EEPSEA Research Reports Reports . EEPSEA ......Kim Anh T. Nguyen, Trang T.H. Le, Chuong N.P.T. Bui,...


Published by WorldFish (ICLARM)– Economy and Environment Program for Southeast Asia (EEPSEA) EEPSEA Philippines Office, SEARCA bldg., College, Los Baños, Laguna 4031 Philippines Tel: +63 49 536 2290 loc. 4107; Fax: +63 49 501 3953; Email: [email protected]
EEPSEA Research Reports are the outputs of research projects supported by the Economy and Environment Program for Southeast Asia. All have been peer reviewed and edited. In some cases, longer versions may be obtained from the author(s). The key findings of most EEPSEA Research Reports are condensed into EEPSEA Policy Briefs, which are available for download at www.eepsea.org. EEPSEA also publishes the EEPSEA Practitioners Series, case books, special papers that focus on research methodology, and issue papers. ISBN: 978-621-8041-39-4 The views expressed in this publication are those of the author(s) and do not necessarily represent those of EEPSEA or its sponsors. This publication may be reproduced without the permission of, but with acknowledgement to, WorldFish-EEPSEA. Front cover photo: Boat ride along the Mekong River in Ben Tre province, Vietnam. Photo by Chelsea Marie Hicks under the creative commons license at https://www.flickr.com/photos/seafaringwoman/5461267477/
Suggested Citation: Nguyen, K.A.T.; T.T.H. Le; C.N.P.T. Bui; T.A.T. Nguyen; and C.M. Jolly. 2017. Climate change impact and vulnerability assessment and economic analysis of climate change adaptation strategies in Ben Tre province, Vietnam. EEPSEA Research Report No. 2017-RR14. Economy and Environment Program for Southeast Asia, Laguna, Philippines.

Climate Change Impact, Vulnerability Assessment, and Economic Analysis of Adaptation Strategies
in Ben Tre, Vietnam
Kim Anh T. Nguyen Trang T.H. Le
Chuong N.P.T. Bui Tram Anh T. Nguyen
Curtis M. Jolly
February, 2017

Comments should be sent to: Dr. Kim Anh T. Nguyen Faculty of Economics, Nha Trang University, Nha Trang City, Khanh Hoa Province, Vietnam Tel: + 84-58-3875350 Fax: +84 -58-3832070 Email: [email protected]
The Economy and Environment Program for Southeast Asia (EEPSEA) was established in May 1993 to support training and research in environmental and resource economics. Its goal is to strengthen local capacity in the economic analysis of environmental issues so that researchers can provide sound advice to policymakers.
To do this, EEPSEA builds environmental economics (EE) research capacity, encourages
regional collaboration, and promotes EE relevance in its member countries (i.e., Cambodia, China, Indonesia, Lao PDR, Malaysia, Myanmar, Papua New Guinea, the Philippines, Thailand, and Vietnam). It provides: a) research grants; b) increased access to useful knowledge and information through regionally-known resource persons and up-to-date literature; c) opportunities to attend relevant learning and knowledge events; and d) opportunities for publication.
EEPSEA was founded by the International Development Research Centre (IDRC) with co-
funding from the Swedish International Development Cooperation Agency (Sida) and the Canadian International Development Agency (CIDA). In November 2012, EEPSEA moved to WorldFish, a member of the Consultative Group on International Agricultural Research (CGIAR) Consortium.
EEPSEA’s structure consists of a Sponsors Group comprising its donors (now consisting of
IDRC and Sida) and host organization (WorldFish), an Advisory Committee, and its secretariat. EEPSEA publications are available online at http://www.eepsea.org.
ACKNOWLEDGMENT
The authors would like to thank the following individuals and institutions that made valuable contributions to this research project:
The Economy and Environment Program for Southeast Asia (EEPSEA) for the generous
support they have provided to young researchers over the years. EEPSEA Director, Dr. Herminia A. Francisco for her support, guidance, and encouragement
throughout the course of this study. The local government of Ben Tre province, especially the Honorable Chairman of the
Provincial People’s Committee Nguyen Van Hieu; staff of the Ben Tre Department of Natural Resources and Environment, the Ben Tre Department of Agriculture and Rural Development; the local government of Binh Dai, Ba Tri, and Thanh Phu districts and staff of these districts’ offices—for their assistance and hospitality and for providing valuable information and data necessary to complete this study.
Dr. Maripaz L. Perez and her team for their assistance in the technical support. The faculty and staff of the Faculty of Economics of the Nha Trang University for their
encouragement and support. Mr. Chau Huu Tri for his contribution and assistance during the local government seminar-
workshops. Mr. Ho Xuan Huong, Mr. Chau Huu Tri, and Mr. Phan Tan Cuong for their inexhaustible
energy during the field work and for their assistance in collecting data and in administering the survey.
The friendly people of Binh Dai, Ba Tri, and Thanh Phu districts for sharing their valuable
time, and for patiently answering our questions during the survey. To all others who made this study possible.

TABLE OF CONTENTS
EXECUTIVE SUMMARY 1
1.0 INTRODUCTION AND RATIONALE 2
1.1 Local Settings 2
1.2 Climate Risks to Address 5
1.3 Objectives of the Study 9
2.0 METHODOLOGY 10
2.1 Focus Group Discussions and Community-Based Vulnerability Assessment 10
2.2 Household Analysis 13
3.0 COMMUNITY-BASED HAZARD AND PHYSICAL VULNERABILITY MAPPING 14
3.1 Historical Timeline Analysis of Bio-geophysical Impacts 14
3.2 Vulnerability Matrix 15
3.3 Households and Sectors at Risk from Bio-geophysical Impacts 16
4.0 EVALUATING DAMAGES FROM CLIMATE HAZARDS 17
4.1 Damage Value from Climate Hazards 17
4.2 Cost of the Measures Employed by Households in Response to Climate Hazards
18
5.0 HOUSEHOLD ADAPTATIONS 21
5.1 Household Adaptations against Future Climate Risks 21
6.0 CEA OF PLANNED ADAPTATIONS 21
6.1 Identifying Planned Adaptation Strategies 21
6.2 Selection Method of Planned CCA Strategies 25
6.3 Results of CEA 26
6.4 Discussion of CEA results 27
7.0 HOUSEHOLD VULNERABILITY INDEX 28
8.0 INSTITUTIONAL ANALYSIS 32
8.1 Decision Making and Planning by LGUs to Deal with Climate Change 32
8.2 Awareness, Perception, and Capacity of LGUs to Deal with Climate Change 33
9.0 CONCLUSIONS AND RECOMMENDATIONS 34
LITERATURE CITED 36
APPENDICES 37

LIST OF TABLES
Table 1. Population, number of households, and average persons per household by district in 2009
4
Table 2. Proportion of population aged 15 and over by level of qualification and by district in 2009 (in percent)
4
Table 3. Gross output of agriculture at current price in 2010 by sector and by district (in million VND)
5
Table 4. Fisheries gross output (at current price), 2010, by sector, by district (in million VND)
5
Table 5. Inundated area of Ben Tre province according to B2 and A1FI GHG emission schemes
7
Table 6. Number of residents affected by sea level rise 8 Table 7. Historical timeline bio-geophysical impacts in Thua Duc, An Thuy,
and Giao Thanh 15
Table 8. Vulnerable matrix of Thua Duc, An Thuy, and Giao Thanh 16 Table 9 Value of damages from climate hazards 17 Table 10. Cost of measures adopted by households to cope with climate hazards 19 Table 11. Household adaptation measures preferred by respondents
against future climate risks (n = 300) 22
Table 12. CCA measures for implementation as identified by the community 23 Table 13. Investments needed to build a freshwater treatment facility
and sea dike system in Than Phu district 25
Table 14. Comparison between the freshwater factory and the sea dike system 27 Table 15. Distribution of households according to level of vulnerability
and mean VEP estimates 28
Table 16. Distribution of households based on the occupation of household head (percentage distribution)
30
Table 17. Level of knowledge (on climate change) and preparedness (on dealing with future climate change impacts) of households
30
Table 18. Incidence of climate-related impacts based on vulnerability (in percentage)
31
Table 19. Distribution households based on gender of household head (percentage share)
31
Table 20. Incidence of vulnerability for male- vs. female-headed households (in percent)
32
Table 21. CCA programs being considered for implementation 32
LIST OF FIGURES
Figure 1. Maps of Vietnam and Ben Tre province 3
Figure 2. Inundated area (by district) according to B2 and A1FI GHG emission schemes 7
Figure 3. Inundated agricultural area, by crop 8
Figure 4. Inundated aquaculture area 8
Figure 5. Districts suffering from flooding 9
1 Economy and Environment Program for Southeast Asia
CLIMATE CHANGE IMPACT, VULNERABILITY ASSESSMENT, AND ECONOMIC ANALYSIS OF CLIMATE CHANGE ADAPTATION STRATEGIES
IN BEN TRE PROVINCE, VIETNAM
Kim Anh T. Nguyen, Trang T.H. Le, Chuong N.P.T. Bui, Tram Anh T. Nguyen, Curtis M. Jolly
EXECUTIVE SUMMARY
Vietnam is one of the most vulnerable countries to the impacts of climate change. The country’s 10 most vulnerable provinces are among the top 25% most susceptible regions in Southeast Asia, in which eight of these ten provinces are located in the Mekong River Delta, including Ben Tre province. In the past few years, Ben Tre has suffered immensely from saltwater intrusion; unusual typhoons have also caused severe damages to the province. Accordingly, rural households in Ben Tre have been considered as highly vulnerable to the effects of climate change, which prompted the communities to plan and adopt adaptation measures to cope with these changes.
This study identified the impacts of climatic change on the rural households of Ben Tre
province, and subsequently conducted an economic analysis of the planned climate change adaptation (CCA) strategies of the community. Three focus group discussions (FGDs) were conducted in the study in order to identify the vulnerable sectors and households in the chosen sites. A household survey among 300 respondents was also conducted to obtain information on Ben Tre residents’ awareness and knowledge of climate change, and on the autonomous CCA strategies being used by the residents. The researchers subsequently conducted a cost-effectiveness analysis of two CCA strategies planned by the provincial government.
Results of the FGDs showed that community leaders were aware of climate change and
were making adjustments to cope with the changes in climatic patterns. The results of the household survey, on the other hand, showed that the local rural households had little knowledge of climate change; they simply related the phenomenon to certain biological and physical events (e.g., changes in temperature, rainfall, wind patterns, and typhoon occurrence). Meanwhile, data showed that the total damages caused by the most recent typhoons, saltwater intrusion, and erosions in the province were USD 154,155; USD 77,151; and USD 28,492, respectively. However, the total value of the damages caused by these climatic events was actually higher because the cost of the measures undertaken by households to mitigate the effects of these climatic events could also be considered as losses.
In order to prevent damages from sea level rise, the provincial government planned to
build new and upgrade existing sea walls. The residents also requested for desalination water plants for water treatment. The local authorities have already begun designing these two interventions; hence, this study evaluated the investment strategies of the local government considering the limited resources available. Based on the cost-effectiveness ratio, the freshwater treatment plant would be more cost effective than the sea dike system.
Households were also evaluated in terms of their vulnerability to climate change based on
how the phenomenon has affected their livelihoods. The percentage distribution of the vulnerability index showed that 31% of the households in the study sites were highly vulnerable to climatic hazard, while 56% of households were not vulnerable at all.
2 Climate Impact and Vulnerability Assessment and Economic Analysis
of Adaptation Strategies in Ben Tre, Vietnam
1.0 INTRODUCTION AND RATIONALE Climate change is one of the most challenging issues faced by humanity in the 21st
century. Records show that the effects of climate change have been affecting agricultural production, rural livelihoods, and the environment throughout the world. Scientific data on climate change research and mathematical modeling have all shown that Vietnam is one of the most affected countries by climate change.
In Vietnam, temperature increase and sea level rise—which can cause permanent
inundation, increased floods, and saltwater intrusion—have impeded agricultural development and have posed risks to industrial production and socioeconomic systems in the country. Over the past 50 years, Vietnam has experienced an increase of 0.5°C–0.7°C in annual average temperature and a 20-centimeter rise in sea level. Climatic changes have caused hazards like typhoons, floods, and droughts to intensify and to occur more frequently in the past 20 years. Scientific calculations show that average temperature in Vietnam could probably increase by 3°C, and that sea level would likely rise by 1 meter by 2100. In the case of a one-meter sea level rise, approximately 40,000 km2 of coastal plains in Vietnam will suffer from permanent inundation, specifically, 15,116 km2 in the Mekong Delta. This translates to permanent inundation of about 37.8% of the total area of Vietnam (MONRE 2009).
Climate change mapping shows that Vietnam’s 10 most susceptible provinces are among
the top 25% most vulnerable areas in Southeast Asia—and Ben Tre is one of these provinces (Yusuf and Francisco 2010). The Ben Tre region has suffered immensely from saltwater intrusion. In 2003, saltwater intrusion caused agricultural losses amounting to USD 750,000, which affected 16,000 households. The South China Morning Post (April 2008) reported that losses had increased to USD 37 million in 2005. The number of people reportedly not having access to freshwater was estimated to be 110,000 out of a population of 280,000. Salty droughts in 2010 also either destroyed or impeded the productivity of 1,575 ha of rice land and 10,162 ha of farmland for fruits, and resulted in some 4,500 ha of unproductive lands. The total damage and losses was approximated at VND 198 billion (Oxfam 2008). Saltwater intrusion also resulted in decreased freshwater availability, an increase in poverty rate, decrease in land use, and a population shift. Continued rise in sea level is, therefore, bound to have serious negative impacts on an already impoverished region.
Regional governments have noted these climatic changes, and thus have included
strategies in their regional plans to prevent further damages and to assist residents in coping with these changes. However, there have been no studies that have evaluated the economic and financial impacts of these strategic measures, which can be costly to rural poor households, communities, and the society as a whole. It is, therefore, against this backdrop that this study was conducted.
1.1 Local Settings 1.1.1 Geographical location The province of Ben Tre is located in the Mekong Delta and has a complex system of
internal rivers measuring over 382 km in total length. These branches of internal rivers originate from the Mekong River system and then meet in the East Sea (also called the West Philippine Sea) at four big estuaries. Accompanying this system are fertile lands, bordering 65 km of the coastline,

3 Economy and Environment Program for Southeast Asia
and a privileged sea area, which is part of the exclusive economic zone of approximately 20,000 km2. Mekong Delta is a low-lying plain and a major agricultural production area in Vietnam.
In Figure 1, Ben Tre has the shape of a pied fantail; the upstream source divides into
dispersed smaller branches that follow the eastern direction to the sea. The province has an area of about 2,300 km2. It borders Tien Giang province on the north by the Tien River, and by Vinh Long and Tra Vinh provinces on the west, and by Co Chien River on the south. Four big rivers (i.e., Tien Giang, Ba Lai, Ham Luong, and Co Chien Rivers) surround and divide Ben Tre into three separate land areas.
Figure 1. Maps of Vietnam and Ben Tre province
1.1.2 Climate and hydrological features According to the reports and official statistical sources of the Ben Tre Centre for
Hydro-meteorological Forecasting, the rainy season in Ben Tre starts in May and lasts until November; the dry season is from December to April of the next year. The rainy season coincides with the southwest monsoon. Average annual rainfall ranges between 1,300 mm to 1,700 mm. Coastal areas receive the lowest amount of rainfall compared with other areas. The temperature of the province is relatively high, which is favorable for the production of certain crops and livestock. The average temperature recorded is about 27°C. The hottest months are April and May when the average temperature is up to about 29°C. The coolest month is December, with average temperature as low as 25°C (Ben Tre CEHMF 2010).
In terms of hydrology, Ben Tre has a network of interlaced rivers, ditches, and canals that favors irrigation and forms a transportation network. There is a canal or channel in every 1–2 km along the main rivers.
The terrain of Ben Tre is mostly below the average sea level. Most rivers are affected by the
East Sea tidal regime, which enables saltwater to follow the tides into rivers. Many rivers and canals have relatively large width, and the width of estuaries ranges 2–3 km. As a result, the river water is seriously contaminated with salt. In dry seasons, saltwater intrusion occurs in almost every area of the province, causing severe freshwater shortages. Generally, the most serious salinity problem is experienced in April. In areas close to the sea, the level of salinity is never below 2 0/00. On the event of the rainy season, owing to precipitation and freshwater from the upstream of the Mekong River system, the water is less saline (Ben Tre DARD 2007).

4 Climate Impact and Vulnerability Assessment and Economic Analysis
of Adaptation Strategies in Ben Tre, Vietnam
1.1.3 Socioeconomic features The Ben Tre 2010 Statistical Yearbook supplied the socioeconomic data for this study.
The total population of Ben Tre in 2009 was 1,255,946, with households numbering 358,691. The average household size was four. About 90% of the population lived in rural areas (Table 1). The average monthly income per capita in 2008 was VND 891,440 (USD 43) and VND 1,165,390 (USD 56) in rural and urban areas, respectively. The unemployment rate in 2009 was about 11.7%. Most of the residents had little formal education (Table 2). The primary occupations were farming, fishing, labor for manufacturing and construction, petty trade, and motorcycle repairing. Approximately 50% of all employed residents were working in agriculture. Gross output of agriculture in 2010 was VND 12,017,951 million (USD 579,569,396), of which approximately 59% was attributed to cultivation. Of the 178,000 ha cultivated in 2010, paddy accounted for 80,900 ha, with the total production of 364,000 tons (Table 3). The main livestock in 2010 included pig production (431,562); chickens (2,937,969); and ducks (1,764,566). The production of fisheries amounted to 290,585 tons in 2010. The gross output of the fishery sector was VND 7,478,813 million (USD 360,668,065), of which 67.5% was supplied by aquaculture (Table 4). The industrial output value reached VND 9,575,873 million (USD 461,799,430) in 2010, of which 93.6% came from manufacturing. Table 1. Population, number of households, and average persons per household
by district in 2009
Districts Total Population
No. of Households
Ave No. of Persons
per Household
Population
Urban Rural
Ben Tre 116,099 34,583 3.32 61,968 54,131 Chau Thanh 157,216 46,113 3.39 3,538 153,678 Cho Lach 123,538 35,659 3.45 7,632 115,906 Mo Cay 242,642 71,442 3.38 11,330 231,312 Giong Trom 168,744 50,321 3.34 9,857 158,887 Binh Dai 132,193 36,994 3.56 9,859 122,334 Ba Tri 187,398 49,349 3.78 10,813 176,585 Thanh Phu 128,116 34,230 3.73 9,317 118,799 Total 1,255,946 358,691 3.48 124,314 1,131,632 Source: Ben Tre Statistical Office (2011) Table 2. Proportion of population aged 15 and over by level of education and by district in 2009
(in percent)
Districts % Qualification
Short-Term Training
Vocational Degree
College Bachelor and Higher
Ben Tre 81.2 2.6 6.6 2.1 7.4 Chau Thanh 92.7 1.8 2.9 1.1 1.6 Cho Lach 95.5 1.4 1.7 0.8 1.1 Mo Cay 94.9 0.9 1.9 1.1 1.2 Giong Trom 94.9 0.9 2.1 1.0 1.2 Binh Dai 94.8 1.0 1.9 1.0 1.4 Ba Tri 95.7 0.8 1.6 0.9 1.0 Thanh Phu 96.1 0.7 1.5 0.8 0.8 Total 93.5 1.2 2.4 1.1 1.8 Source: Ben Tre Statistical Office (2011)

5 Economy and Environment Program for Southeast Asia
Table 3. Gross output of agriculture at current price in 2010 by sector and by district (in million VND)
Districts Total Value
Of Which Value
of Crop Production
Value of Livestock Production
Value of Services
Ben Tre 364,553 289,892 47,698 26,963 Chau Thanh 1,486,760 1,154,526 210,717 121,517 Cho Lach 1,279,915 969,330 147,446 163,139 Mo Cay South 1,825,118 602,375 957,342 265,401 Mo Cay North 1,374,868 549,096 598,503 227,270 Giong Trom 2,106,453 1,319,775 549,720 236,958 Binh Dai 843,519 598,195 160,352 84,973 Ba Tri 1,845,763 1,086,838 484,613 275,312 Thanh Phu 890,000 571,947 242,825 129,228 Total 12,017,951 7,087,974 3,399,216 1,530,761 Source: Ben Tre Statistical Office (2011) Table 4. Fisheries gross output (at current price), 2010, by sector, by district (in million VND)
Places Total Value Of Which
Value of Capture Fisheries
Value of Aquaculture Value of Services
Ben Tre 62,045 640 5,262 56,143 Chau Thanh 517,950 23,604 485,453 8,911 Cho Lach 402,847 1,734 401,114 – Mo Cay South 330,578 64,715 265,863 – Mo Cay North 63,023 13,885 49,138 – Giong Trom 555,362 26,311 528,041 1,011 Binh Dai 3,085,545 1,052,505 2,012,473 20,567 Ba Tri 1,580,178 953,528 616,972 9,678 Thanh Phu 881,285 180,873 687,443 12,969 Total 7,478,813 2,317,794 5,051,741 109,278 Source: Ben Tre Statistical Office (2011) 1.2 Climate Risks to Address
1.2.1 Saltwater intrusion In the dry season, Ben Tre suffers from saltwater intrusion, which leads to a shortage of
freshwater for domestic and agricultural purposes. A salinity level of 1 0/00 can be detected throughout the entire province when the salinity threshold for drinking water should be <0.25 0/00. This phenomenon happens in the province due to the following reasons:
1. Ben Tre terrain is flat and possesses abundant river and channel systems. Such features make the province prone to saltwater intrusion as saltwater from the sea tend to flow into freshwater bodies inland. Furthermore, 94.2% of the province area is as low as 1–2 meters, and is affected by the East Sea tidal regime.

6 Climate Impact and Vulnerability Assessment and Economic Analysis
of Adaptation Strategies in Ben Tre, Vietnam
2. The water flow and velocity of rivers and channels are not strong enough during the dry season to negate the saltwater that flows in an opposite direction. Sea tides also cause saltwater to penetrate deeper into freshwater bodies.
3. High average temperature, summer solstice, low average rainfall, and monsoon rains during the summer months facilitate severe saltwater intrusion. Moreover, the rapid increase in aquaculture activities in the province has reduced mangrove forests. These factors all help enable sea waves and tides to penetrate deeper inland.
4. In Ben Tre, groundwater is extracted since surface water is contaminated with saltwater. However, population growth and economic activities have led to decreased groundwater reserves, which further aggravates the situation (Ben Tre DARD 2007). Economic damages caused by saltwater intrusion from 1995 to 2008 amounted to
VND 672,325 billion (USD 32,423,080,632). Damages include 15,782 ha of nonproductive paddy; 13,700 ha of shed unripe coconut; 360 ha of less productive aquaculture; and 5,289 tons of dead shrimp. About 132,823 households also suffered from continued water shortage (Ben Tre DPI 2010).
Climate change will lead to higher temperatures, longer dry seasons, and rising sea level.
All of these climate change effects will increase the extent of affected areas and the duration of saltwater intrusion. It is predicted that by 2020, sea level would rise by 11 cm, which would make the 4 0/00-salinity boundary at 15–25 km away from the coastline. The situation would be more serious by 2050 when sea level rises by 30 cm. By this time, the 4 0/00-salinity boundary would be at a distance of 40 km from the coastline. Based on this scenario, areas that are now suffering from the 4 0/00 salinity would experience 8–10 0/00 salinity. Such forecasts do not take into account the effects of droughts, longer dry seasons, and less water flow from upstream (MONRE 2009).
1.2.2 Sea level rise Greenhouse gases (GHG) (e.g., water vapor, CO2, CH4, N2O) are important components of
the earth’s atmosphere. They allow the lower atmosphere to absorb the heat radiated from the earth’s surface, thereby trapping heat within the earth system. The whole process keeps the planet from becoming an icy sphere, with surface temperatures of about 0°F. However, over the past century, the amounts of GHG in the atmosphere have been increasing rapidly, mainly due to the burning of fossil fuels, which release CO2 into the atmosphere. Consequently, in the past 100 years, global temperatures have been increasing more rapidly than the historic record shows. Scientists believe that this accelerated heating of the atmosphere is due to the increasing amounts of these GHG that trap more and more heat. The increase in global temperatures has caused glaciers to melt and for water to expand, which ultimately cause sea level to rise.
Vietnam is one of the countries threatened by sea level rise in terms of land loss, affected
residents, production loss, and decrease in GDP. Sea level rise will affect various economic activities in several regions of Vietnam, especially in the Mekong Delta. Estimates show that sea level in Vietnam would rise 75–100 cm by 2100, in accordance with the high and medium GHG emission schemes, respectively (MONRE 2008).
As one of the provinces located in the Mekong Delta, Ben Tre is definitely vulnerable to the
effects of sea level rise. Based on the scenario for sea level rise of Vietnam compiled by the Ministry of Natural Resources and Environment (MONRE), Ben Tre has actively developed its own scenario. The inundated area is depicted in Table 5 and Figure 2 in accordance with the high (A1FI) and medium (B2) GHG emission schemes.

Tabl
e 5.
Inun
date
d ar
ea o
f Ben
Tre
pro
vinc
e ac
cord
ing
to B
2 an
d A
1FI G
HG
em
issi
on s
chem
es
Indi
cato
r 20
20
2030
20
50
2070
21
00
B2 e
mis
sion
sch
eme
Sea
leve
l ris
e (c
m)
12.0
0 17
.00
30.0
0 46
.00
75.0
0 In
unda
ted
area
(km
2 ) 27
2.09
29
0.45
34
2.10
42
5.67
72
5.50
In
unda
ted
area
(%)
12.2
4 13
.07
15.3
9 19
.15
32.6
2 A
1F1
emis
sion
sch
eme
Sea
leve
l ris
e (c
m)
12.0
0 17
.00
33.0
0 57
.00
100.
00
Inun
date
d ar
ea (k
m2 )
272.
09
290.
45
352.
10
509.
76
1115
.24
Inun
date
d ar
ea (%
) 12
.24
13.0
7 15
.84
22.9
3 50
.17
Sour
ce: B
en T
re P
PC (2
011)
N
ote:
Tot
al a
rea
cons
ider
ed in
the
scen
ario
s is
2,2
23.0
6 km
2
Figu
re 2
. Inu
ndat
ed a
rea
(by
dist
rict)
acc
ordi
ng to
B2
and
A1F
I GH
G e
mis
sion
sch
emes
Sour
ce: B
en T
re P
PC (2
011)

8 Climate Impact and Vulnerability Assessment and Economic Analysis
of Adaptation Strategies in Ben Tre, Vietnam
Sea level rise will decrease the area for agriculture and aquaculture, which will significantly affect the productivity of these sectors. Figure 3 indicates that as the sea level rises, cultivated areas for paddy and for perennial industrial crops and fruit will be inundated. Aquaculture enterprises will also be affected (Figure 4). Likewise, when sea level rises, people who live on low-lying lands will be forced to relocate if no protective structures will be implemented (Ben Tre DONRE 2008). Table 6 specifies the number of residents who live in the forecasted inundated area.
Figure 3. Inundated agricultural area, by crop
Source: Ben Tre PPC (2011)
Figure 4. Inundated aquaculture area
Source: Ben Tre PPC (2011)
Table 6. Number of residents affected by sea level rise
Indicator 2020 2030 2050 2070 2100 B2 emission scenario
Sea level rise (cm) 12.00 17.00 30.00 46.00 75.00 Number of people affected 97,890 102,054 123,365 166,034 356,615
A1F1 emission scenario Sea level rise (cm) 12.00 17.00 33.00 57.00 100.00 Number of people affected 97,890 102,054 127,675 215,574 589,821
Source: Ben Tre PPC (2011)
1.2.3 Typhoons and flooding Generally, Ben Tre suffers from very few typhoons. In 1997, Typhoon Linda had wind
velocity of 120 kph and accounted for damages of about VND 300 billion. Nine years later, Typhoon Durian, with wind velocity of over 133 kph, severely devastated the province, which resulted in 17 deaths, 162 injured people, and 71,340 collapsed or unroofed houses (Ben Tre CEHMF 2010).
Meanwhile, flooding in Ben Tre is mainly attributed to the floodwater from upstream, since
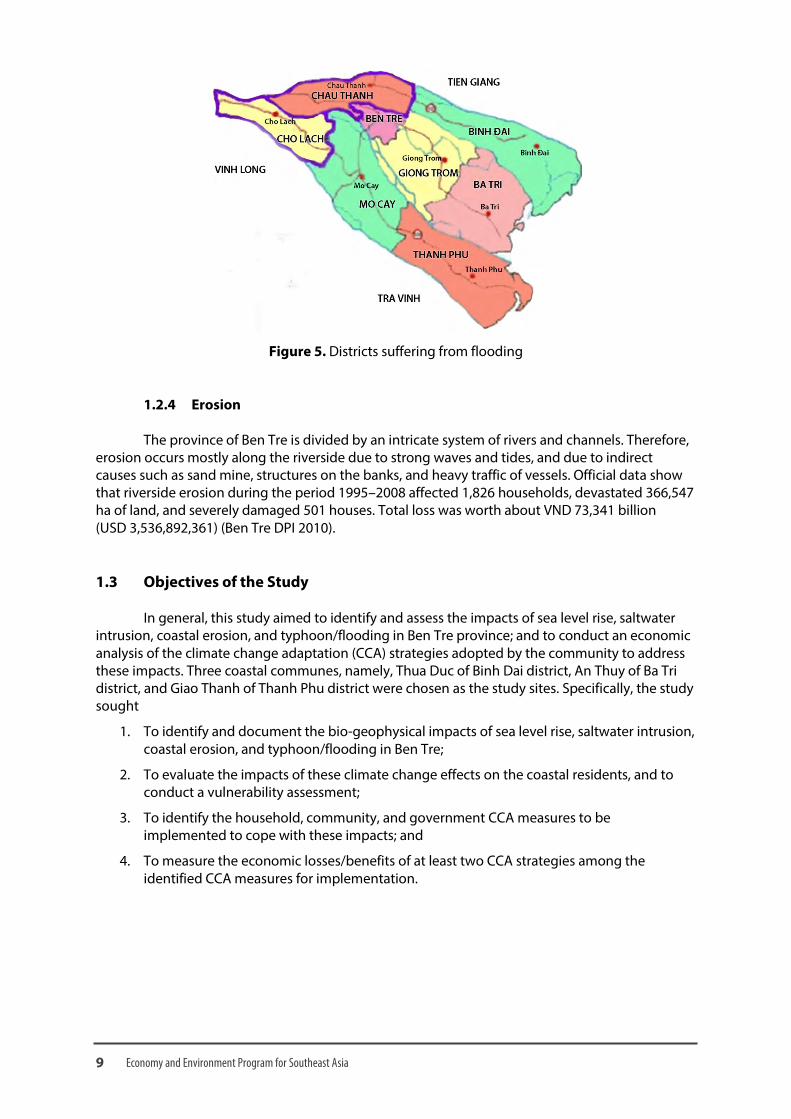
Ben Tre is located in the downstream area of the Mekong River. Therefore, the upper districts of the provinces suffer from flooding. From 1996 to 2008, total damages from flooding amounted to VND 365,635 billion (Ben Tre CEHMF 2010). Figure 5 shows the two districts that mostly suffer from flooding .
9 Economy and Environment Program for Southeast Asia
Figure 5. Districts suffering from flooding
1.2.4 Erosion The province of Ben Tre is divided by an intricate system of rivers and channels. Therefore,
erosion occurs mostly along the riverside due to strong waves and tides, and due to indirect causes such as sand mine, structures on the banks, and heavy traffic of vessels. Official data show that riverside erosion during the period 1995–2008 affected 1,826 households, devastated 366,547 ha of land, and severely damaged 501 houses. Total loss was worth about VND 73,341 billion (USD 3,536,892,361) (Ben Tre DPI 2010). 1.3 Objectives of the Study
In general, this study aimed to identify and assess the impacts of sea level rise, saltwater
intrusion, coastal erosion, and typhoon/flooding in Ben Tre province; and to conduct an economic analysis of the climate change adaptation (CCA) strategies adopted by the community to address these impacts. Three coastal communes, namely, Thua Duc of Binh Dai district, An Thuy of Ba Tri district, and Giao Thanh of Thanh Phu district were chosen as the study sites. Specifically, the study sought
1. To identify and document the bio-geophysical impacts of sea level rise, saltwater intrusion, coastal erosion, and typhoon/flooding in Ben Tre;
2. To evaluate the impacts of these climate change effects on the coastal residents, and to conduct a vulnerability assessment;
3. To identify the household, community, and government CCA measures to be implemented to cope with these impacts; and
4. To measure the economic losses/benefits of at least two CCA strategies among the identified CCA measures for implementation.

10 Climate Impact and Vulnerability Assessment and Economic Analysis
of Adaptation Strategies in Ben Tre, Vietnam
2.0 METHODOLOGY 2.1 Focus Group Discussions and Community-Based Vulnerability Assessment
2.1.1 First focus group discussion
The researchers conducted the first focus group discussion (FGD), which included eight provincial officials, namely, the officials of the Provincial People’s Committee (PPC) of Ben Tre province, Ben Tre Bureau of the National Target Program to Respond to Climate Change, Ben Tre Department of Aquaculture and Rural Development (DARD), Ben Tre Department of Natural Resources and Environment (DONRE), Ben Tre Department of Science and Technology, Ben Tre Department of Plan and Investment, and Ben Tre Department of Finance. This FGD aimed to inform the local authorities of the research objectives, and to provide a forum for discussing the following climate change-related issues in Ben Tre province.
Areas with worst climate change impact. The first FGD illustrated that the three coastal districts Binh Dai, Ba Tri, and Thanh Phu witnessed the worst damage from the effects of climate change impacts, particularly sea level rise. According to the B2 climate change scenarios (estimation of the average sea level rise published by the MONRE in 2009), if sea level would rise by 30 cm by 2050, 16.23% (60.27 km2) of the natural area of Binh Dai district would be covered in water; Thanh Phu, 15.61% (60.01 km2); and Ba Tri, 47.43 km2. About 7.8% (23.19 km2) of the total aquaculture area in Ben Tre would also be submerged, and most of these areas belong to the same three coastal districts.
Indications of climate change in Ben Tre. Climate change has caused fluctuations in weather patterns; typical examples of such are the unusual occurrence of typhoon no. 5 in 1997 and typhoon no. 9 in 2006. In addition, the average annual temperature in the province increased by approximately 0.3°C from 1990 to 2005. Also, the gap between daytime and nighttime temperature has also expanded. The amount and frequency of precipitation varied considerably—from 1990 to 2006, the average amount of rainfall increased by approximately 7.5 mm, which means an annual increase of 0.5 mm in precipitation. Likewise, saltwater intrusions have constantly posed a serious threat to Ben Tre and have had severe impacts on drinking water.
Impacts of climate changes on Ben Tre. According to the B2 climate change scenarios, when sea level ascends to 75 cm, 46.13% of the Binh Dai district land area would be submerged in water; Ba Tri and Thanh Phu districts would also suffer the same situation, albeit with different severity (51.3% and 23.17%, respectively). Aquaculture, forestry, and agriculture are the most vulnerable sectors to climate change, which means productivity in these sectors would decrease. Such a reduction will impose risks to the local residents, who count on agriculture and aquaculture for their livelihoods; this would then cause a decrease in the province’s GDP. Moreover, sea level rise will also worsen the salinity in the province. Coastal areas would be the most affected by saltwater intrusion, which means that coastal communities would further face shortage of freshwater supply for domestic use.
Damage to infrastructure (e.g., buildings, bridges, and roads) is also one of the most problematic climate change-related concerns in the province, considering Ben Tre has the lowest terrain in the Mekong Delta, being the lowest part of the Mekong River Basin. Meanwhile, erosion is a normal occurrence along the coast or riverside due to the strong water currents, tides, waves, and abnormal winds (often during the August to November of the Lunar calendar). However, with the forecasted rise in sea level, coastal erosion is expected to worsen.

11 Economy and Environment Program for Southeast Asia
Ben Tre has a total 3,598 ha of forestland and has a diverse mangrove ecosystem, especially along the three coastal districts. Changes in climatic patterns, nonetheless, have damaged the ecosystem and have adversely affected the livelihoods of the coastal communities. The high temperature, which has changed the natural habitat and processes in the ecosystem, has decreased the number of plants and aquatic species in the coastal areas of the province. Changes in climatic patterns have also affected the coastal ecosystem and distorted the fisheries resources, thereby affecting the coastal fishing communities. Furthermore, fishing activities have been hindered by the risk of typhoons and tropical depression.
Action plans to adapt to the impacts of climate change in Ben Tre province. In the first FGD, the participants were able to sketch a major five-year action plan to address the impacts of climate change. The plan included implementing the following projects:
1. Building irrigation systems, such as the Quoi Dien, Cau Sap irrigation systems and the Ham Luong saltwater prevention dam;
2. Construction of sea walls to bound Binh Dai, Ba Tri, and Thanh Phu coastal districts;
3. Promotion of mangrove-planting project along the sea walls—the chosen species were mainly mangroves, cypress, and other fruit-bearing tress;
4. Construction of freshwater treatment plant to provide piped water for coastal residence; and
5. Information campaign on climate change, its impact, and response techniques. In 2010, the Office of Climate Change program of Ben Tre implemented a wide-scale
information campaign through two consultative courses designed for the communities, three district conferences, and one provincial conference. Mass media were also utilized to assist the people in obtaining information on how to deal with climate change. Twice a month, the website www.baodongkhoi.com.vn was updated with climate change information; once a month, the Ben Tre television station broadcasted news regarding the climate change situation.
Financial resources. The CCA-related activities of the province had been funded by the following NGOs, along with the government budget (central and provincial government):
1. Oxfam (2009–2011) – provided financial support of about USD 25,000 for a project aimed to improve the capability of local communities in managing climate-related risks by diversifying livelihoods;
2. World Wildlife Fund (2011–2012) – supplied financial support of approximately USD 150,000 to provide technical assistance to the local government on how to apply ecosystem-based CCA; and
3. Danish International Development Agency (2009–2013) – provided financial support of USD 8 million for CCA-related initiatives.
2.1.2 Second FGD
The second FGD followed the same design as the first FGD, but included 10 Binh Dai district officials from the People’s Committee, DARD, DONRE, Department of Economic Development; and authority representatives from Thua Duc coastal commune. The participants were mainly chosen based on their experience in and knowledge on agriculture, aquaculture, and climate change. This FGD focused primarily on discussing the objectives of the research project with local officials. At the same time, it served as a platform for people to share their opinions and
12 Climate Impact and Vulnerability Assessment and Economic Analysis
of Adaptation Strategies in Ben Tre, Vietnam
observations on the impacts of climate change (particularly sea level rise) in Binh Dai district. In addition, the research group gained insights and verified the responses of the first FGD.
Shifting climatic patterns, increasing temperature and salinity level, larger difference
between day and night time temperatures, and sea level rise are some of the climate change effects that have been occurring in Binh Dai district. The alternating seasonal wind direction has also caused variation in currents in river valleys, thus exacerbating soil erosion. In Thua Duc commune, productivity of shrimp (extensive) farming within the mangrove forest significantly decreased—from VND 7–10 million per crop prior to 2007 to only VND 5 million per crop after 2007. This is because when the temperature and salinity of the water increases, the exoskeleton of black tiger and white leg shrimp thickens; hence, slowing their growth. Such harsh conditions also lengthen the culture period by an average of one month. Accordingly, aquaculture productivity declines.
In 2010, massive clam deaths (up to 90%) in Ben Tre inflicted enormous income losses on
aquaculture farmers. The clam-culturing areas in the province were assessed to be highly vulnerable to climate change since increased salinity (caused by sea level rise) and temperature in the water change environmental conditions and marine ecology.
Accordingly, Binh Dai district implemented several CCA projects: (1) building a raw
freshwater reservoir and water supply system, (2) evacuating people from eroded and erosion-prone areas, (3) planting 101 ha of mangrove swamps, and (4) implementing 20 saltwater irrigation systems.
2.1.3 Third FGD After the second FGD, the research team, along with the head of the Office of Ben Tre PPC
and representatives of the Ben Tre DONRE, investigated areas in Binh Dai and Ba Tri coastal districts that had been severely impacted by climate change. Specifically, they investigated the following areas and incidents: two clam-culturing cooperatives that had suffered massive clam deaths, three black tiger and white leg shrimp farms, the erosion occurring along the river, damaged constructions and infrastructure in the districts, and the dam in Ba Lai River. The investigations enabled the research team to develop contacts with the residents of the local community before launching the third FGD.
A total of 12 farmers from the different communes of Binh Dai and Ba Tri districts
participated in the third FGD. The participants had been selected by the district authority officials. Some of the participants came from the largest zones of aquaculture and agricultural production in the districts. The researchers aimed to discuss the objectives of the research with the farmer participants and to determine their level of awareness of climate change, particularly of sea level rise.
Several conclusions were drawn during the discussion. The farmers showed initial
awareness of climate change and sea level rise, and initiated actions to cope with climate-related events as follows:
1. Changing seasonal culturing schedule
2. Modifying/upgrading houses and other properties. The local residents had been accustomed to leaving small holes on the walls near the roofs for ventilation. They then realized that these holes were the reason why their houses had been unroofed during typhoon events (especially the one in 2006); thus, they modified their houses to rectify this problem. Likewise, the residents also modified their house basements and the edges of farming ponds by raising them to avoid getting flooded and to prevent saltwater intrusion.

13 Economy and Environment Program for Southeast Asia
3. Buying or building water containers to be used for collecting water during the rainy season; the water collected will then be used during the dry season when water is often salty.
4. Building underground bunks to serve as shelters during strong typhoons.
2.2 Household Analysis
A total of 300 households participated in the survey, equally divided among the three studied coastal districts. The survey covered all villages in each commune with the hope that the sampled households represented the population. The respondents were chosen based on the economic structure of the commune, and involved respondents engaged in as many different occupations as possible, including those in agriculture, aquaculture, and fishing.
The data collected from the household surveys were then analyzed to demonstrate how
harmful each climatic event had been in terms of monetary loss, types of damages, and the number of affected households. Based on the results of the FGDs and on the household surveys, two planned CCA measures were identified and evaluated using cost-effectiveness analysis (CEA). The two CCA projects chosen were building a freshwater treatment plant and building a sea dike. The CEA of the two CCA options were conducted to provide the local government with sound advice on which adaptation should be prioritized considering the high investment cost of each project.
Vulnerability indices of the coastal households were also estimated based on the data
collected from the household surveys. Vulnerability is defined as the probability that a household will fall below a minimum consumption threshold level (or probability that household will move to poverty in the future). The analysis is based on the assumption that climate extremes, climatic shocks, or climate hazards will affect the probability that households’ consumption will fall below a given minimum vulnerability level (Deressa, Hassan and Ringler 2009).
Household consumption function is defined as
lnCh = Xhβ + eh Equation (1)
where: Ch = per capita consumption expenditure of household, Xh = observable household characteristics and climatic shocks, and eh = mean-zero disturbance term.
The three-step feasible generalized least squares procedure was then applied to estimate
E� [ln Ch | Xh] = XhB� and Equation (2)
V� �lnCh | Xh = σ�2e, h = Xhθ��. Equation (3)
Assuming that consumption is log-normally distributed, vulnerability is then estimated as
V�h = P�r (ln Ch < ln | Xh) = Φ�ln z− Xhβ�
�Xh�. Equation (4)
where: z = consumption threshold (the minimum per capita consumption below which
one will be considered vulnerable, USD 1.25 and USD 1.50); and Φ(.) = cumulative density of the standard normal.
The following key variables were then used in the regression:
14 Climate Impact and Vulnerability Assessment and Economic Analysis
of Adaptation Strategies in Ben Tre, Vietnam
• Number of floods that affected the community (over the last 10 years);
• D = 1, if affected by coastal erosion;
• D = 1, if affected by saltwater intrusion;
• Age of head of household;
• Gender of head of household;
• Years of schooling of head of household;
• Dependence ratio = number of members below 15 and above 64 per household;
• D = 1, if house is owned;
• Credit access (number of contacts);
• D = 1, if household is involved in farming;
• D = 1, if household is involved in fishing;
• D = 1, if household is involved in livestock; and
• D = 1, if household is involved in aquaculture.
3.0 COMMUNITY-BASED HAZARD AND PHYSICAL VULNERABILITY MAPPING
3.1. Historical Timeline Analysis of Bio-geophysical Impacts
Ben Tre used to be known as a typhoon-free province until 1997 when it was hit by its first
and worst typhoon called Typhoon Linda. Nine years later, Typhoon Durian devastated the province causing much damage. Nine years of being typhoon-free was quite a long period; thus, almost all of the local residents were surprised and caught unprepared when the local authorities announced that Typhoon Durian would hit the province. As a consequence, the province was badly devastated by the typhoon.
On the other hand, saltwater intrusion has become part of the residents’ daily lives,
especially those living in the coastal area. A large number of residents could not even recall when it first occurred (Table 7). Meanwhile, the local residents believed that the first erosion incident happened in 2005. Due to the endowed, intricate system of rivers and channels, erosion mainly occurs along riverbanks. Strong waves were said to be the cause.
According to the climate change scenarios for Ben Tre, the province is predicted to suffer
from the impacts of sea level rise by 2020 if no CCA strategies will be adopted.
15 Economy and Environment Program for Southeast Asia
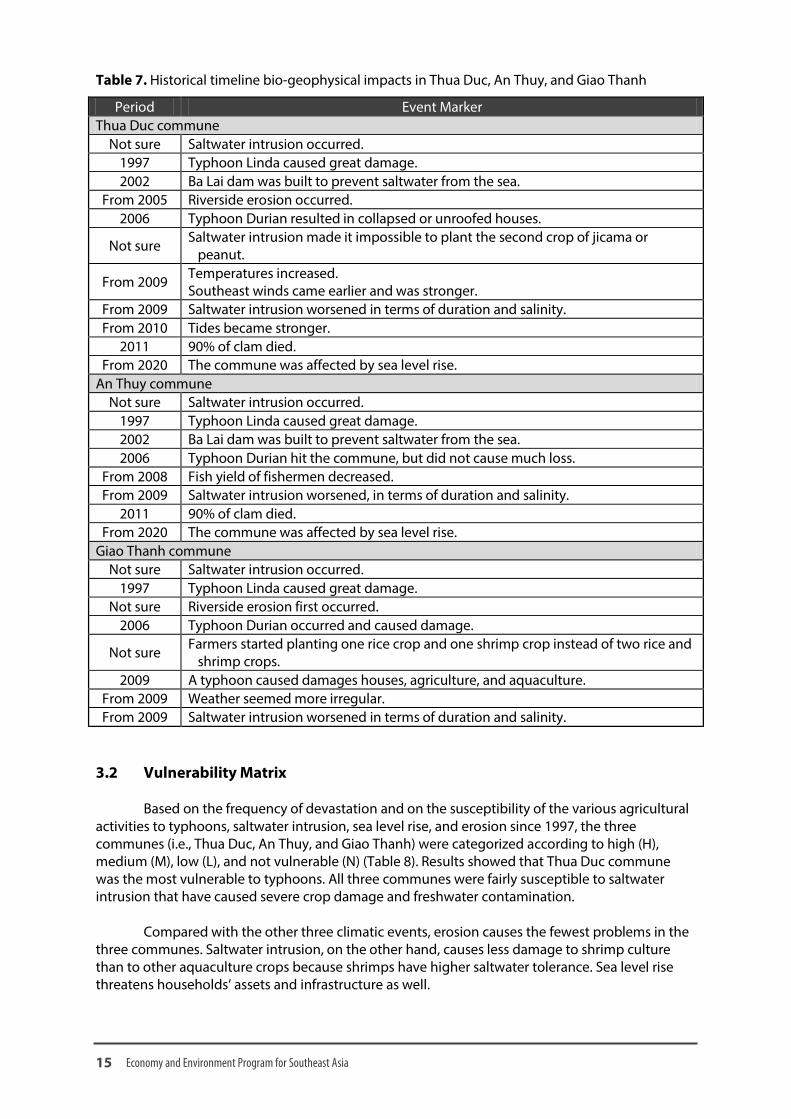
Table 7. Historical timeline bio-geophysical impacts in Thua Duc, An Thuy, and Giao Thanh
Period Event Marker Thua Duc commune
Not sure Saltwater intrusion occurred. 1997 Typhoon Linda caused great damage. 2002 Ba Lai dam was built to prevent saltwater from the sea.
From 2005 Riverside erosion occurred. 2006 Typhoon Durian resulted in collapsed or unroofed houses.
Not sure Saltwater intrusion made it impossible to plant the second crop of jicama or peanut.
From 2009 Temperatures increased. Southeast winds came earlier and was stronger.
From 2009 Saltwater intrusion worsened in terms of duration and salinity. From 2010 Tides became stronger.
2011 90% of clam died. From 2020 The commune was affected by sea level rise.
An Thuy commune Not sure Saltwater intrusion occurred.
1997 Typhoon Linda caused great damage. 2002 Ba Lai dam was built to prevent saltwater from the sea. 2006 Typhoon Durian hit the commune, but did not cause much loss.
From 2008 Fish yield of fishermen decreased. From 2009 Saltwater intrusion worsened, in terms of duration and salinity.
2011 90% of clam died. From 2020 The commune was affected by sea level rise.
Giao Thanh commune Not sure Saltwater intrusion occurred.
1997 Typhoon Linda caused great damage. Not sure Riverside erosion first occurred.
2006 Typhoon Durian occurred and caused damage.
Not sure Farmers started planting one rice crop and one shrimp crop instead of two rice and shrimp crops.
2009 A typhoon caused damages houses, agriculture, and aquaculture. From 2009 Weather seemed more irregular. From 2009 Saltwater intrusion worsened in terms of duration and salinity.
3.2 Vulnerability Matrix
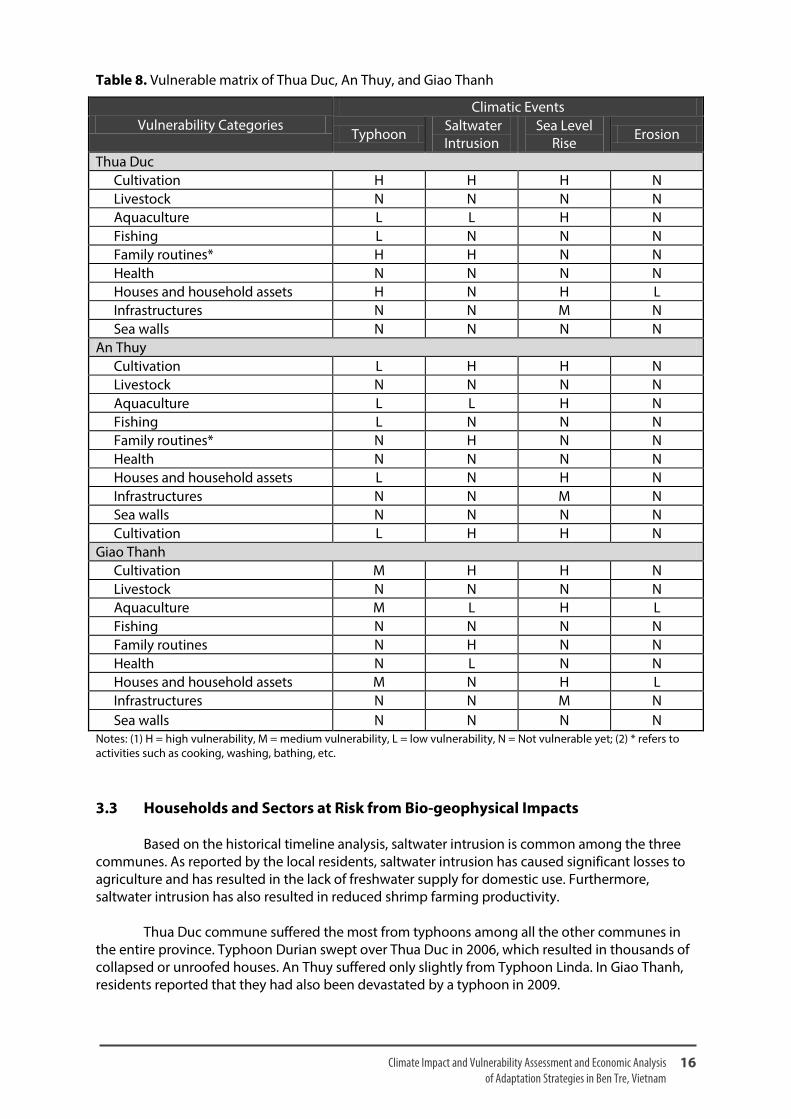
Based on the frequency of devastation and on the susceptibility of the various agricultural
activities to typhoons, saltwater intrusion, sea level rise, and erosion since 1997, the three communes (i.e., Thua Duc, An Thuy, and Giao Thanh) were categorized according to high (H), medium (M), low (L), and not vulnerable (N) (Table 8). Results showed that Thua Duc commune was the most vulnerable to typhoons. All three communes were fairly susceptible to saltwater intrusion that have caused severe crop damage and freshwater contamination.
Compared with the other three climatic events, erosion causes the fewest problems in the
three communes. Saltwater intrusion, on the other hand, causes less damage to shrimp culture than to other aquaculture crops because shrimps have higher saltwater tolerance. Sea level rise threatens households’ assets and infrastructure as well.
16 Climate Impact and Vulnerability Assessment and Economic Analysis
of Adaptation Strategies in Ben Tre, Vietnam
Table 8. Vulnerable matrix of Thua Duc, An Thuy, and Giao Thanh
Vulnerability Categories Climatic Events
Typhoon Saltwater Intrusion
Sea Level Rise
Erosion
Thua Duc Cultivation H H H N Livestock N N N N Aquaculture L L H N Fishing L N N N Family routines* H H N N Health N N N N Houses and household assets H N H L Infrastructures N N M N Sea walls N N N N
An Thuy Cultivation L H H N Livestock N N N N Aquaculture L L H N Fishing L N N N Family routines* N H N N Health N N N N Houses and household assets L N H N Infrastructures N N M N Sea walls N N N N Cultivation L H H N
Giao Thanh Cultivation M H H N Livestock N N N N Aquaculture M L H L Fishing N N N N Family routines N H N N Health N L N N Houses and household assets M N H L Infrastructures N N M N Sea walls N N N N
Notes: (1) H = high vulnerability, M = medium vulnerability, L = low vulnerability, N = Not vulnerable yet; (2) * refers to activities such as cooking, washing, bathing, etc. 3.3 Households and Sectors at Risk from Bio-geophysical Impacts
Based on the historical timeline analysis, saltwater intrusion is common among the three
communes. As reported by the local residents, saltwater intrusion has caused significant losses to agriculture and has resulted in the lack of freshwater supply for domestic use. Furthermore, saltwater intrusion has also resulted in reduced shrimp farming productivity.
Thua Duc commune suffered the most from typhoons among all the other communes in
the entire province. Typhoon Durian swept over Thua Duc in 2006, which resulted in thousands of collapsed or unroofed houses. An Thuy suffered only slightly from Typhoon Linda. In Giao Thanh, residents reported that they had also been devastated by a typhoon in 2009.

17 Economy and Environment Program for Southeast Asia
Although erosion was only slightly mentioned in the historical timeline, it had occurred randomly throughout Giao Thanh commune. Land loss and losses from agriculture and aquaculture were also as a consequence of soil erosion.
Throughout Giao Thanh, the residents have witnessed higher high tides in recent years.
Fortunately, flooding caused by higher high tides last for only a few hours, and therefore, has not created much harm.
4.0 EVALUATING DAMAGES FROM CLIMATE HAZARDS 4.1 Damage Value from Climate Hazards
Table 9 shows the cost of damage incurred by the 300 sample households at the study
sites due to the effects of climate change. Among the 300, 205 reported that they had been affected by typhoons. It had taken them an average of 40 days to recover from financial losses, 27 days to recover from emotional distress, and 33 days to return to their normal lives. Of the 205, 172 respondents reported that they had suffered from damages to their houses, with total damages amounting to more than VND 1 billion (USD 51,000). Losses to agriculture and aquaculture were also significant at VND 348,040,000 (USD 16,784) and VND 1,099,100,000 (USD 53,004), respectively. Total damage costs resulting from the most recent typhoons amounted to more than VND 3 billion (USD 154,000).
Meanwhile, of the 300 households, 271 (90%) reported that they had been affected by saltwater intrusion. The respondents reported that saltwater had started nine years ago, and each occurrence had lasted for 168 days on average. All 271 respondents agreed that salinity has worsened over the years. A total of 65 respondents reported that their agricultural production had been harmed by saltwater intrusion, which resulted in a total loss of VND 710,810,000 (USD 34,279). Aquaculture production of 14 households was impeded by saltwater, which led to VND 644,050,000 (USD 31,060) monetary loss. Saltwater intrusion further caused 146 households to suffer from lack of freshwater for domestic use, which cost them VND 215,343,000 (USD 10,385). Total losses generated by saltwater intrusion amounted to VND 1,599,803,000 or USD 77,151. Table 9. Value of damages from climate hazards
Type of Damage No. of Affected Households
Damage Value VND USD
Typhoons (n = 205) Damage to house 172 1,059,900,000 51,114 Damage to appliance 50 116,510,000 5,619 Damage to livestock 2 3,100,000 149 Damage to assets 15 131,700,000 6,351 Loss in agriculture production 40 348,040,000 16,784 Loss in fishing income 20 389,600,000 18,789 Loss in aquaculture production 39 1,099,100,000 53,004 Income loss due to work stoppage 6 10,600,000 511 Loss in salt production 3 28,000,000 1,350 Land loss 1 10,000,000 482 Total loss 3,196,550,000 154,155
18 Climate Impact and Vulnerability Assessment and Economic Analysis
of Adaptation Strategies in Ben Tre, Vietnam
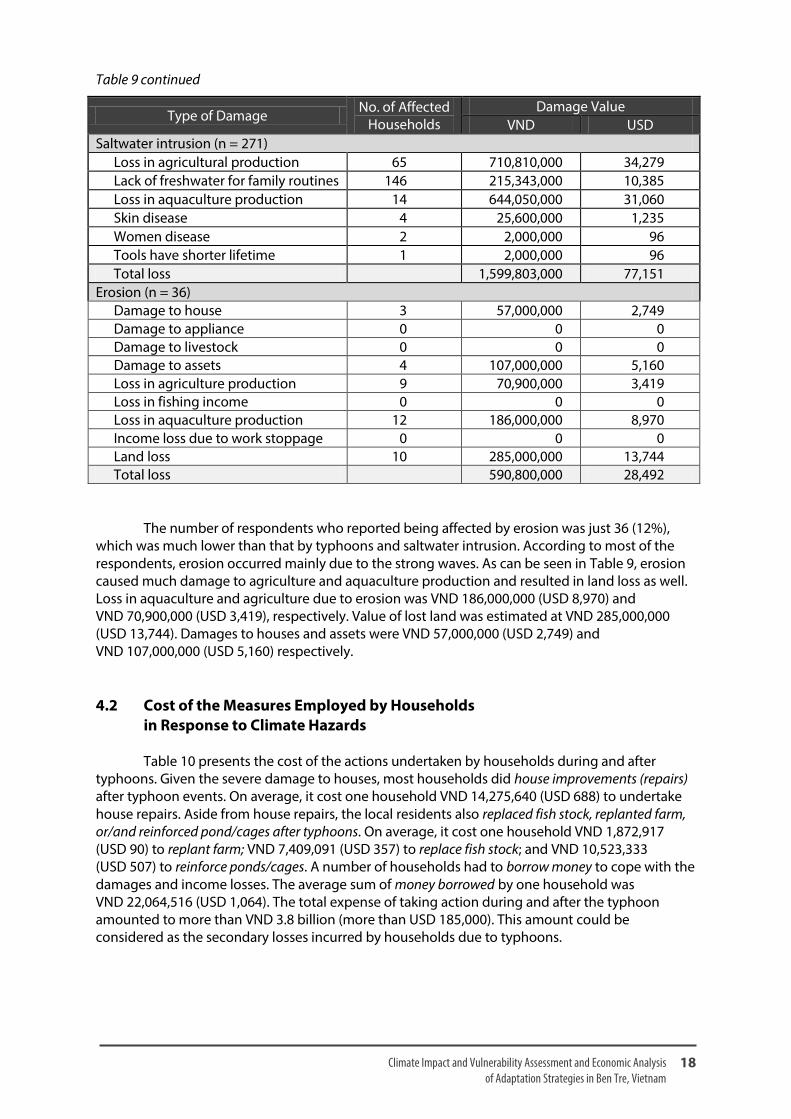
Table 9 continued
Type of Damage No. of Affected Households
Damage Value VND USD
Saltwater intrusion (n = 271) Loss in agricultural production 65 710,810,000 34,279 Lack of freshwater for family routines 146 215,343,000 10,385 Loss in aquaculture production 14 644,050,000 31,060 Skin disease 4 25,600,000 1,235 Women disease 2 2,000,000 96 Tools have shorter lifetime 1 2,000,000 96 Total loss 1,599,803,000 77,151
Erosion (n = 36) Damage to house 3 57,000,000 2,749 Damage to appliance 0 0 0 Damage to livestock 0 0 0 Damage to assets 4 107,000,000 5,160 Loss in agriculture production 9 70,900,000 3,419 Loss in fishing income 0 0 0 Loss in aquaculture production 12 186,000,000 8,970 Income loss due to work stoppage 0 0 0 Land loss 10 285,000,000 13,744 Total loss 590,800,000 28,492
The number of respondents who reported being affected by erosion was just 36 (12%), which was much lower than that by typhoons and saltwater intrusion. According to most of the respondents, erosion occurred mainly due to the strong waves. As can be seen in Table 9, erosion caused much damage to agriculture and aquaculture production and resulted in land loss as well. Loss in aquaculture and agriculture due to erosion was VND 186,000,000 (USD 8,970) and VND 70,900,000 (USD 3,419), respectively. Value of lost land was estimated at VND 285,000,000 (USD 13,744). Damages to houses and assets were VND 57,000,000 (USD 2,749) and VND 107,000,000 (USD 5,160) respectively.
4.2 Cost of the Measures Employed by Households
in Response to Climate Hazards Table 10 presents the cost of the actions undertaken by households during and after
typhoons. Given the severe damage to houses, most households did house improvements (repairs) after typhoon events. On average, it cost one household VND 14,275,640 (USD 688) to undertake house repairs. Aside from house repairs, the local residents also replaced fish stock, replanted farm, or/and reinforced pond/cages after typhoons. On average, it cost one household VND 1,872,917 (USD 90) to replant farm; VND 7,409,091 (USD 357) to replace fish stock; and VND 10,523,333 (USD 507) to reinforce ponds/cages. A number of households had to borrow money to cope with the damages and income losses. The average sum of money borrowed by one household was VND 22,064,516 (USD 1,064). The total expense of taking action during and after the typhoon amounted to more than VND 3.8 billion (more than USD 185,000). This amount could be considered as the secondary losses incurred by households due to typhoons.

Tabl
e 10
. Cos
t of m
easu
res
adop
ted
by h
ouse
hold
s to
cop
e w
ith c
limat
e ha
zard
s
Act
ion
No
of A
ffect
ed
Hou
seho
lds
Ave
rage
Exp
ense
To
tal E
xpen
se
VND
U
SD
VND
U
SD
Typh
oons
(n =
205
) H
ouse
impr
ovem
ent
172
14,2
75,6
40
688
2,45
5,40
9,40
6 11
8,41
3 Ev
acua
tion
60
24,5
61
1 1,
399,
406
67
Plan
ted
tree
s ar
ound
pro
pert
ies
2 25
0,00
0 12
50
0,00
0 24
Re
plan
ted
farm
11
1,
872,
917
90
22,4
74,4
06
1,08
4 Re
plac
ed fi
sh s
tock
11
7,
409,
091
357
81,4
99,4
06
3,93
0 Re
info
rced
cag
es/p
onds
31
10
,523
,333
50
7 31
5,69
9,40
6 15
,225
Jo
ined
sav
ings
gro
ups/
coop
erat
ives
1
600,
000
29
600,
000
29
Purs
ued
othe
r mea
ns o
f add
ition
al in
com
e 1
100,
000,
000
4,82
3 10
0,00
0,00
0 4,
823
Borr
owed
mon
ey
31
22,0
64,5
16
1,06
4 68
3,99
9,40
6 32
,986
Sa
ved
mon
ey
71
NA
NA
NA
NA
Fina
ncia
l aid
from
loca
l gov
ernm
ent
37
3,23
5,00
0 15
6 12
9,40
0,00
0 6,
240
Build
san
d di
ke a
roun
d fa
rm
3 14
,000
,000
67
5 42
,000
,000
2,
025
Incr
ease
floo
r rel
ativ
e to
gro
und
1 5,
000,
000
241
5,00
0,00
0 24
1 Bu
ild u
nder
grou
nd s
helte
r 1
15,0
00,0
00
723
15,0
00,0
00
723
Tota
l exp
ense
3,85
2,98
1,43
6 18
5,81
1 Sa
ltwat
er in
trus
ion
(n =
271
) H
arve
sted
rain
wat
er
270
3,99
4,92
5 19
3 1,
062,
650,
000
51,2
47
Tapp
ed fr
om d
iffer
ent s
ourc
e 32
1,
721,
563
83
55,0
90,0
00
2,65
7 Bu
y fr
eshw
ater
from
ven
dors
14
3 1,
478,
021
71
211,
357,
000
10,1
93
Built
dik
e of
san
d ar
ound
farm
s/po
nds
41
19,8
45,5
00
957
793,
820,
000
38,2
82
Tota
l exp
ense
2,12
2,91
7,00
0 10
2,37
8

Tabl
e 10
cont
inue
d
Act
ion
No.
of A
ffect
ed H
ouse
hold
s A
vera
ge E
xpen
se
Tota
l Exp
ense
VN
D
USD
VN
D
USD
Er
osio
n (n
= 3
6)
Inst
alle
d pe
rman
ent p
rote
ctiv
e st
ruct
ures
3
73,0
00,0
00
3,52
0 21
9,00
0,00
0 10
,561
In
stal
led
tem
pora
ry p
rote
ctiv
e st
ruct
ures
27
17
,151
,852
82
7 46
3,10
0,00
0 22
,333
Pe
rman
ently
eva
cuat
ed
1 30
0,00
0,00
0 14
,468
30
0,00
0,00
0 14
,468
Pl
ante
d m
angr
ove
alon
g th
e sh
orel
ine
6 25
0,00
0 12
1,
500,
000
72
Rein
forc
ed c
ages
/pon
ds
5 59
,300
,000
2,
860
296,
500,
000
14,2
99
Plan
ted
man
grov
e tr
ees
arou
nd h
ouse
s 1
0 0
0 0
Repl
aced
lost
land
1
30,0
00,0
00
1,44
7 30
,000
,000
1,
447
Tota
l exp
ense
1,31
0,10
0,00
0 63
,180
N
ote:
Fig
ures
repo
rted
in th
is ta
ble
are
from
mul
tiple
resp
onse
s.

21 Economy and Environment Program for Southeast Asia
On the other hand, in order to cope with the lack of freshwater caused by saltwater intrusion, rainwater has been used by 271 respondents as an alternative source of drinking water (Table 10). It cost one household VND 3,994,925 (USD 193) to buy or build containers for harvesting rainwater in the rainy seasons. Buying freshwater from vendors was also used as an adaptation. In an effort to prevent saltwater from intruding into farms or ponds, 41 respondents built dikes made of sand. It cost one household an average of VND 19,845,500 (USD 957) to build a sand dike. Total expense spent on action plans to deal with saltwater intrusion was VND 2.1 billion (USD 102,378).
Temporary protective structures were used by 27 households to protect their properties
against erosion, which cost one household VND 17,151,852 (USD 827) (Table 10). Ponds/cages reinforcement cost VND 59,300,000 (USD 2,860), and installing permanent protective structures cost VND 73,000,000 (USD 3,520) on average. Total expense for all activities performed by households was VND 1.3 billion (USD 63,180).
5.0 HOUSEHOLD ADAPTATIONS 5.1 Household Adaptations against Future Climate Risks
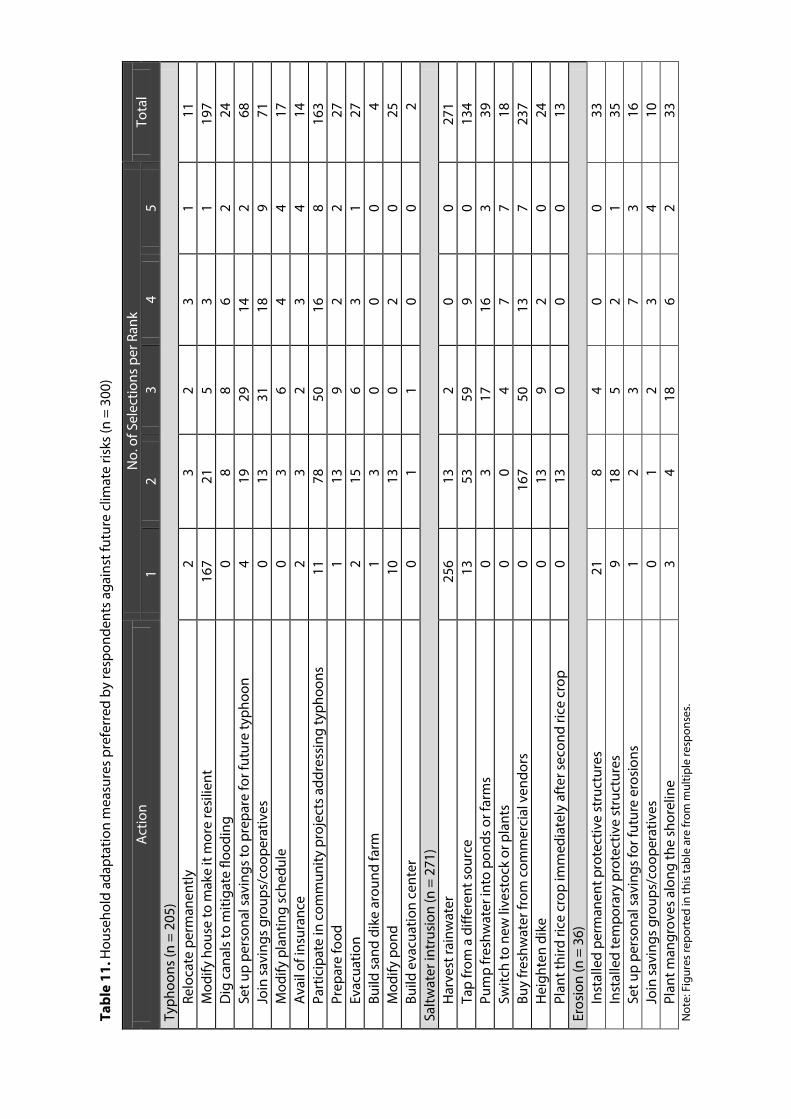
As can be seen from Table 11, modifying house to make it more resilient and participate in
community projects/activities addressing typhoons were the most selected household adaptations against future typhoons. Other household measures that received high rankings were joining savings groups/cooperatives and setting up personal savings to prepare for future typhoon.
In order to deal with the risk of lack of freshwater due to saltwater intrusion, harvesting rainwater was viewed to be the first priority, followed by buying freshwater from commercial vendors, and tapping freshwater from a different source (Table 11). Meanwhile, to reduce the impact of saltwater intrusion on agriculture and aquaculture, the measures pumping freshwater into ponds or farms, dike heightening, and switching to new livestock or crops were considered by the respondents. Those households whose third rice crops were often damaged by saltwater decided to plant the third rice crop immediately after the second crop to avoid the threats posed by saltwater intrusion on crop productivity.
Meanwhile, installing protective structure was prioritized by the respondents to mitigate the impacts of future erosion. Planting mangroves also received high consideration.
6.0 CEA OF PLANNED ADAPTATIONS 6.1 Identifying Planned Adaptation Strategies
In order to address problems associated with typhoons, community evacuation was
identified to be the most needed by the community, followed by providing financial assistance, establishing early warning system, replanting mangroves and forests, and institutionalizing rescue and emergency assistance. Although community evacuation captured the most attention from the respondents, establishing early warning system was actually the first prioritized CCA measure. Table 12 displays the CCA measures expected by the community from the local government.
Tabl
e 11
. Hou
seho
ld a
dapt
atio
n m
easu
res
pref
erre
d by
resp
onde
nts
agai
nst f
utur
e cl
imat
e ris
ks (n
= 3
00)
Act
ion
No.
of S
elec
tions
per
Ran
k To
tal
1 2
3 4
5 Ty
phoo
ns (n
= 2
05)
Relo
cate
per
man
ently
2
3 2
3 1
11
Mod
ify h
ouse
to m
ake
it m
ore
resi
lient
16
7 21
5
3 1
197
Dig
can
als
to m
itiga
te fl
oodi
ng
0 8
8 6
2 24
Se
t up
pers
onal
sav
ings
to p
repa
re fo
r fut
ure
typh
oon
4 19
29
14
2
68
Join
sav
ings
gro
ups/
coop
erat
ives
0
13
31
18
9 71
M
odify
pla
ntin
g sc
hedu
le
0 3
6 4
4 17
A
vail
of in
sura
nce
2 3
2 3
4 14
Pa
rtic
ipat
e in
com
mun
ity p
roje
cts
addr
essi
ng ty
phoo
ns
11
78
50
16
8 16
3 Pr
epar
e fo
od
1 13
9
2 2
27
Evac
uatio
n 2
15
6 3
1 27
Bu
ild s
and
dike
aro
und
farm
1
3 0
0 0
4 M
odify
pon
d 10
13
0
2 0
25
Build
eva
cuat
ion
cent
er
0 1
1 0
0 2
Saltw
ater
intr
usio
n (n
= 2
71)
Har
vest
rain
wat
er
256
13
2 0
0 27
1 Ta
p fr
om a
diff
eren
t sou
rce
13
53
59
9 0
134
Pum
p fr
eshw
ater
into
pon
ds o
r far
ms
0 3
17
16
3 39
Sw
itch
to n
ew li
vest
ock
or p
lant
s 0
0 4
7 7
18
Buy
fres
hwat
er fr
om c
omm
erci
al v
endo
rs
0 16
7 50
13
7
237
Hei
ghte
n di
ke
0 13
9
2 0
24
Plan
t thi
rd ri
ce c
rop
imm
edia
tely
aft
er s
econ
d ric
e cr
op
0 13
0
0 0
13
Eros
ion
(n =
36)
In
stal
led
perm
anen
t pro
tect
ive
stru
ctur
es
21
8 4
0 0
33
Inst
alle
d te
mpo
rary
pro
tect
ive
stru
ctur
es
9 18
5
2 1
35
Set u
p pe
rson
al s
avin
gs fo
r fut
ure
eros
ions
1
2 3
7 3
16
Join
sav
ings
gro
ups/
coop
erat
ives
0
1 2
3 4
10
Plan
t man
grov
es a
long
the
shor
elin
e 3
4 18
6
2 33
N
ote:
Fig
ures
repo
rted
in th
is ta
ble
are
from
mul
tiple
resp
onse
s.

Tabl
e 12
. CCA
mea
sure
s for
impl
emen
tatio
n as
iden
tifie
d by
the
com
mun
ity
Ada
ptat
ions
N
o. o
f ans
wer
s pe
r ran
k (n
= 3
00)
Tota
l 1
2 3
4 5
Typh
oon
Co
mm
unity
eva
cuat
ion
60
63
50
28
20
221
Dis
aste
r pre
pare
dnes
s tr
aini
ng
18
29
26
18
31
122
Info
rmat
ion
diss
emin
atio
n an
d ed
ucat
ion
cam
paig
n 9
28
26
18
22
103
Early
war
ning
sys
tem
10
7 35
26
23
11
20
2 Bu
ild n
ew/s
tren
gthe
n ex
istin
g flo
od m
itiga
tion
infr
astr
uctu
res
20
26
14
11
12
84
Resc
ue a
nd e
mer
genc
y as
sist
ance
9
22
61
37
17
146
Relie
f ope
ratio
n 3
22
18
42
28
113
Repl
ant m
angr
oves
and
fore
sts
16
29
29
47
39
161
Solid
was
te m
anag
emen
t or a
ddre
ssin
g ga
rbag
e pr
oble
ms
0 1
0 5
10
16
Fina
ncia
l ass
ista
nce
40
27
36
50
62
215
Dik
e m
aint
enan
ce
11
4 2
0 8
25
Eros
ion
and
sea
leve
l ris
e
Com
mun
ity e
vacu
atio
n 47
33
21
43
24
16
8 Pe
rman
ent r
eloc
atio
n 21
25
35
21
11
11
3 In
form
atio
n di
ssem
inat
ion
and
educ
atio
n ca
mpa
ign
11
25
45
33
44
158
Early
war
ning
sys
tem
24
15
28
19
20
10
6 In
stal
latio
n of
sea
dik
e 11
3 71
59
21
5
269
Repa
ir of
exi
stin
g se
a di
ke
26
86
30
35
32
209
Man
grov
e re
habi
litat
ion/
cons
erva
tion
24
20
48
47
47
186
Fina
ncia
l ass
ista
nce
29
21
28
68
86
232
Saltw
ater
intr
usio
n Co
mm
unity
eva
cuat
ion
47
33
21
43
24
168
Perm
anen
t rel
ocat
ion
21
25
35
21
11
113
Dis
trib
utio
n of
wat
er tr
eatm
ent d
evic
es/m
edic
ines
to h
ouse
hold
s 33
61
63
54
46
25
7 In
stal
latio
n of
com
mun
ity w
ater
trea
tmen
t fac
ilitie
s 10
40
73
78
32
23
3 In
form
atio
n di
ssem
inat
ion
and
educ
atio
n ca
mpa
ign
11
25
45
33
44
158
Early
war
ning
sys
tem
24
15
28
19
20
10
6 In
stal
latio
n of
sea
dik
e 11
3 71
59
21
5
269
Repa
ir of
exi
stin
g se
a di
ke
26
86
30
35
32
209
Man
grov
e re
habi
litat
ion/
conv
ersa
tion
24
20
48
47
47
186
Fina
ncia
l ass
ista
nce
29
21
28
68
86
232
24 Climate Impact and Vulnerability Assessment and Economic Analysis
of Adaptation Strategies in Ben Tre, Vietnam
On the other hand, mangrove rehabilitation/conservation was highly appreciated by the respondents to deal particularly with erosion and sea level rise (Table 12). To respond to the threats posed by sea level rise, installation of sea dike and repairing existing sea dikes were viewed to be the most appropriate CCA measures. Also recording high priority from respondents was the provision of financial assistance. Only 113 out of the 300 respondents considered permanent relocation as an appropriate adaptation. The community also deemed the construction of a freshwater treatment plant to be highly important. Financial assistance and water treatment facilities/devices were also highly appreciated by the community. 6.2 Selection Method of Planned CCA Strategies
When projects with different cost structures are not expected to produce the same
outcomes, cost-effectiveness analysis (CEA)—in which the costs are compared with the outcomes (measured in natural units)—is an appropriate method to determine which project should be selected for implementation. CEA assumes that a certain benefit or outcome is desired, and that there are several alternative ways to achieve it. CEA is comparative and asks which of the alternative is the cheapest for providing the service.
In this study, CEA was used to evaluate two planned CCA strategy: building a freshwater
treatment plant and building a sea dike system. Given the state of disrepair and the need to improve the existing sea dikes, policy makers should consider the cost effectiveness of building a completely new structure. In this case, physical benefit is measured in terms of the number of households that would benefit from each project. The criterion for decision making is the cost expended to benefit one household. However, it cannot be denied that households would benefit from the freshwater treatment plant and the sea dike in different ways. The water facility would provide households with freshwater while the sea dike, aside from other services, would reduce the saltwater intrusion that harms agricultural production.
Hence, in addition to the physical benefit to households, monetary value is assigned to the
benefits. In the freshwater treatment facility, monetary benefit was estimated based on the unit price multiplied by the amount of freshwater consumed by households. For the sea dike, monetary benefit was measured as the revenue that would be gained from the increase in agricultural productivity, as the dike would help prevent saltwater from damaging agricultural crops. With a monetary value, the benefit-cost ratios (BCR) could be calculated, which somehow resembles the ROI (return over investment) ratio in finance. BCR shows how much dollar returns can be generated from one dollar investment.
A 2007 study by the Asian Development Bank found that developed nations tend to use
real rates between 3% and 7%, whereas developing nations use a higher rate of 8% or more; the higher rate reflects the higher risk and uncertainty of public investments in these nations (Zhuang et al. 2007). In the study, a higher discount rate of 10%, which accounts for risk and uncertainty, was employed to calculate the present value of all costs and monetary benefits of each project. The freshwater treatment plant would be built to supply freshwater for domestic use to four districts, including Thanh Phu district. Meanwhile, the sea dike would be built for Thanh Phu district only. Therefore, the cost of the initial investment had to be adjusted for the latter adaptation measure by dividing the total initial investment of the water plant by 4 to obtain the initial investment for Thanh Phu district.
Here, the study assumed that the four districts would receive the same amount of
investment. Note that this is only a rough estimation. The number of households that would benefit from the water plant would belong to Thanh Phu district only; hence, the annual operating cost was calculated according to the water produced within Thanh Phu district.
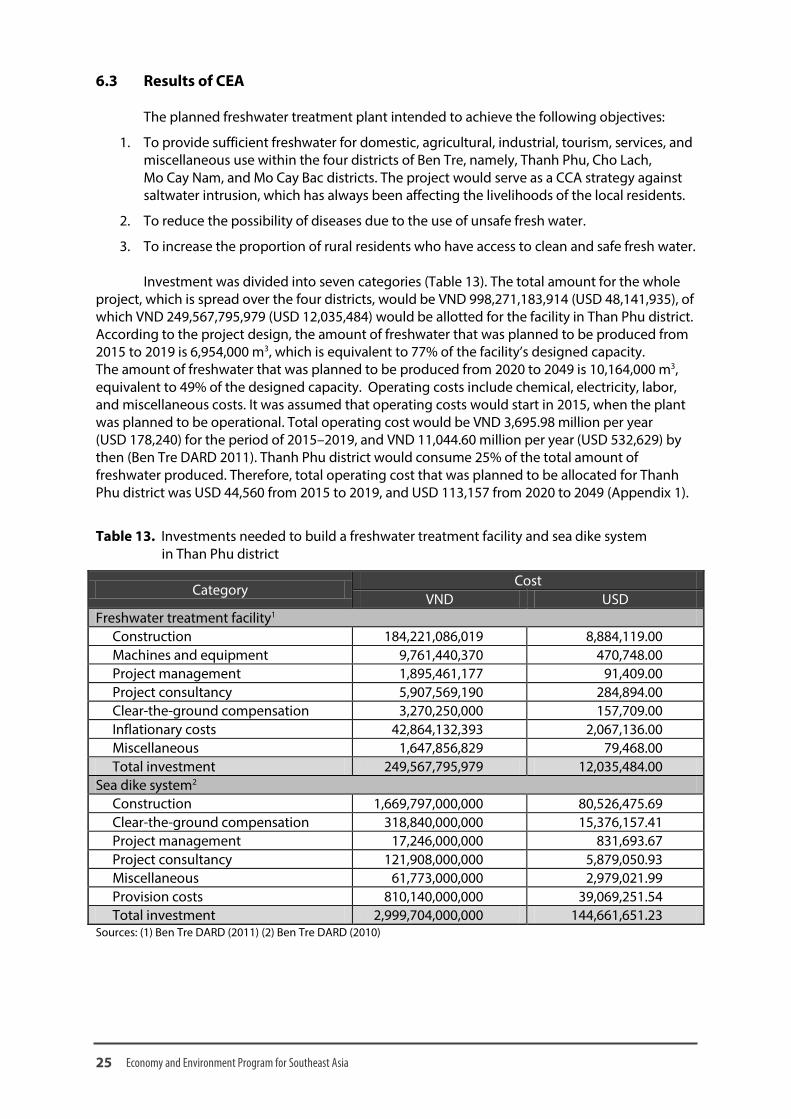
25 Economy and Environment Program for Southeast Asia
6.3 Results of CEA The planned freshwater treatment plant intended to achieve the following objectives:
1. To provide sufficient freshwater for domestic, agricultural, industrial, tourism, services, and miscellaneous use within the four districts of Ben Tre, namely, Thanh Phu, Cho Lach, Mo Cay Nam, and Mo Cay Bac districts. The project would serve as a CCA strategy against saltwater intrusion, which has always been affecting the livelihoods of the local residents.
2. To reduce the possibility of diseases due to the use of unsafe fresh water.
3. To increase the proportion of rural residents who have access to clean and safe fresh water. Investment was divided into seven categories (Table 13). The total amount for the whole
project, which is spread over the four districts, would be VND 998,271,183,914 (USD 48,141,935), of which VND 249,567,795,979 (USD 12,035,484) would be allotted for the facility in Than Phu district. According to the project design, the amount of freshwater that was planned to be produced from 2015 to 2019 is 6,954,000 m3, which is equivalent to 77% of the facility’s designed capacity. The amount of freshwater that was planned to be produced from 2020 to 2049 is 10,164,000 m3, equivalent to 49% of the designed capacity. Operating costs include chemical, electricity, labor, and miscellaneous costs. It was assumed that operating costs would start in 2015, when the plant was planned to be operational. Total operating cost would be VND 3,695.98 million per year (USD 178,240) for the period of 2015–2019, and VND 11,044.60 million per year (USD 532,629) by then (Ben Tre DARD 2011). Thanh Phu district would consume 25% of the total amount of freshwater produced. Therefore, total operating cost that was planned to be allocated for Thanh Phu district was USD 44,560 from 2015 to 2019, and USD 113,157 from 2020 to 2049 (Appendix 1).
Table 13. Investments needed to build a freshwater treatment facility and sea dike system
in Than Phu district
Category Cost
VND USD Freshwater treatment facility1
Construction 184,221,086,019 8,884,119.00 Machines and equipment 9,761,440,370 470,748.00 Project management 1,895,461,177 91,409.00 Project consultancy 5,907,569,190 284,894.00 Clear-the-ground compensation 3,270,250,000 157,709.00 Inflationary costs 42,864,132,393 2,067,136.00 Miscellaneous 1,647,856,829 79,468.00 Total investment 249,567,795,979 12,035,484.00
Sea dike system2 Construction 1,669,797,000,000 80,526,475.69 Clear-the-ground compensation 318,840,000,000 15,376,157.41 Project management 17,246,000,000 831,693.67 Project consultancy 121,908,000,000 5,879,050.93 Miscellaneous 61,773,000,000 2,979,021.99 Provision costs 810,140,000,000 39,069,251.54 Total investment 2,999,704,000,000 144,661,651.23
Sources: (1) Ben Tre DARD (2011) (2) Ben Tre DARD (2010)

26 Climate Impact and Vulnerability Assessment and Economic Analysis
of Adaptation Strategies in Ben Tre, Vietnam
In 2010, the population of Thanh Phu district was 121,902, with the average number of persons per household of 3.73. Population growth rate was assumed to be 1.16% per year. Based on this assumption, the total number of households until 2049 can be easily calculated. In the four years of construction, the project was projected not to generate any benefit. It was then assumed that from 2015 to 2019, the number of benefiting households would be equal to 85% of the total number of households. From 2020 to 2049, this figure would increase to 90%. Such assumptions reflect that a proportion of the total households in the district would not take advantage of the freshwater generated from the project because they would be unable to cover the costs of investment for piped water connection. Likewise, there are a few households in the community that are not affected by saltwater intrusion and may be unwilling to participate.
Monetary benefit was then calculated by multiplying the amount of water consumed
within Thanh Phu district with unit price. Unit price of freshwater was assumed to be constant, that is, VND 3,500/m3. Assume that 95% of freshwater produced would be consumed; the rest of the 5% would be wasted along the pipelines. It was then calculated that from 2015 to 2019, monetary benefit would be VND 5,780,512,500 (USD 287,767) (Ben Tre DARD 2011). From 2020 to 2049, the amount would be VND 8,448,825,000 (USD 407,447) (See Appendix 1).
Based on the costs and the physical benefits from the project, the CE ratio was calculated
using the formula
CE ratio = Present value of costs Total physical benefit.
The costs include initial investment and annual operating costs, which are discounted to
compute the present value. The BCR is equal to the present value of the monetary benefits divided by the present value of costs. Therefore, the CE ratio of the water treatment plant was calculated to be USD 183.281 per benefited household. The benefit-cost ratio was 0.2516 (Appendix 1).
Meanwhile, the planned sea dike system with the dimension of 52.4 km x 7.5 m x 4.0 m had the following objectives:
1. To prevent flooding caused by tides, typhoons, and sea level rise in favor of 10 communes in Thanh Phu district;
2. To reduce saltwater contamination; and
3. To integrate into national defense strategies and transportation development. Total investment for the sea dike system was calculated to be VND 2,999,704,000,000
(USD 144,661,651), which was divided into six categories (Table 13). The construction of the sea dike would last for six years. Operating costs of the sea dike would include maintenance and miscellaneous costs. Operating costs was assumed to start in 2013 (Appendix 2). Replacement cost was projected to occur in 2030, with the amount of VND 302,150,000,000 (USD 14,571,277.01) (Ben Tre DARD 2010).
The population in the area where the sea dike system was planned to be built (10 communes in Thanh Phu district) in 2011 was 66,504 persons, with the average number of persons per household of 3.845 persons. Population growth rate was assumed to be 1.16% per year. With this information, the total number of households until 2049 can be calculated (Appendix 2). The assumption was that households would start benefiting from the sea dike starting 2012, and the number of beneficiaries was projected to continue increasing until 2049 (Ben Tre DARD 2010). Monetary benefit was then measured as the money gained from the increase in agricultural productivity; the dike was expected to prevent saltwater from damaging agricultural production. This value was obtained from the secondary data.
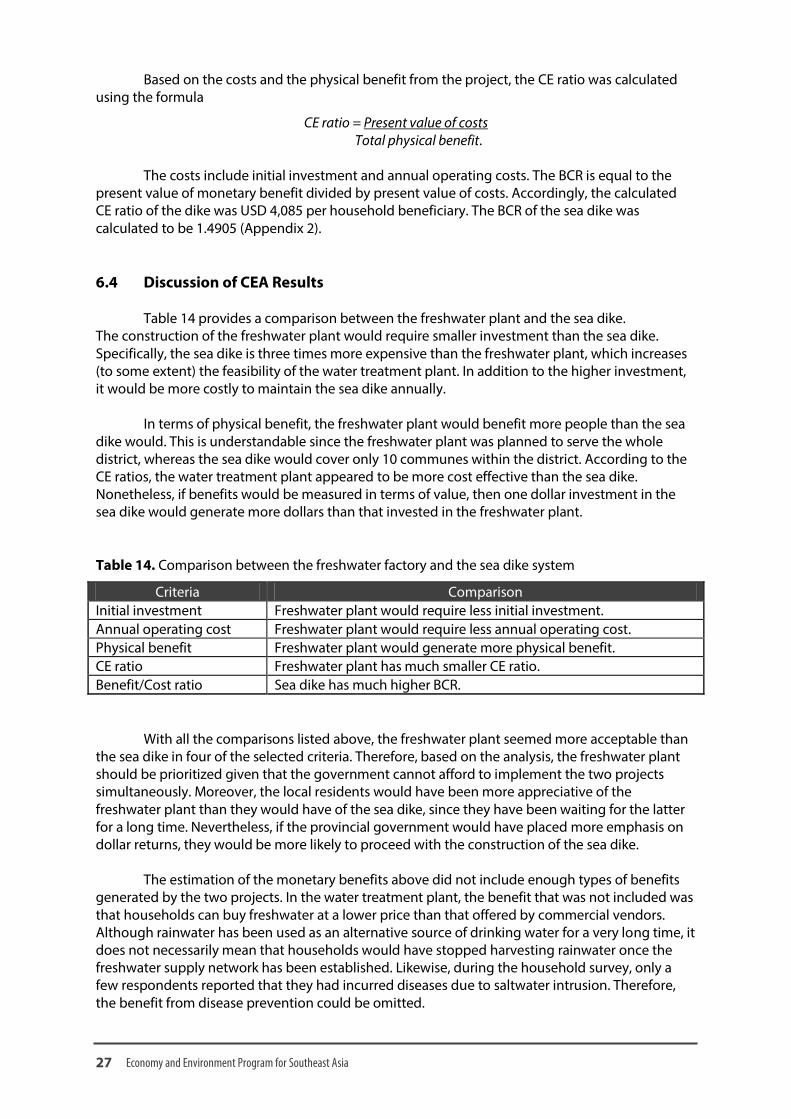
27 Economy and Environment Program for Southeast Asia
Based on the costs and the physical benefit from the project, the CE ratio was calculated using the formula
CE ratio = Present value of costs Total physical benefit.
The costs include initial investment and annual operating costs. The BCR is equal to the
present value of monetary benefit divided by present value of costs. Accordingly, the calculated CE ratio of the dike was USD 4,085 per household beneficiary. The BCR of the sea dike was calculated to be 1.4905 (Appendix 2).
6.4 Discussion of CEA Results
Table 14 provides a comparison between the freshwater plant and the sea dike. The construction of the freshwater plant would require smaller investment than the sea dike. Specifically, the sea dike is three times more expensive than the freshwater plant, which increases (to some extent) the feasibility of the water treatment plant. In addition to the higher investment, it would be more costly to maintain the sea dike annually.
In terms of physical benefit, the freshwater plant would benefit more people than the sea
dike would. This is understandable since the freshwater plant was planned to serve the whole district, whereas the sea dike would cover only 10 communes within the district. According to the CE ratios, the water treatment plant appeared to be more cost effective than the sea dike. Nonetheless, if benefits would be measured in terms of value, then one dollar investment in the sea dike would generate more dollars than that invested in the freshwater plant.
Table 14. Comparison between the freshwater factory and the sea dike system
Criteria Comparison Initial investment Freshwater plant would require less initial investment. Annual operating cost Freshwater plant would require less annual operating cost. Physical benefit Freshwater plant would generate more physical benefit. CE ratio Freshwater plant has much smaller CE ratio. Benefit/Cost ratio Sea dike has much higher BCR.
With all the comparisons listed above, the freshwater plant seemed more acceptable than the sea dike in four of the selected criteria. Therefore, based on the analysis, the freshwater plant should be prioritized given that the government cannot afford to implement the two projects simultaneously. Moreover, the local residents would have been more appreciative of the freshwater plant than they would have of the sea dike, since they have been waiting for the latter for a long time. Nevertheless, if the provincial government would have placed more emphasis on dollar returns, they would be more likely to proceed with the construction of the sea dike.
The estimation of the monetary benefits above did not include enough types of benefits
generated by the two projects. In the water treatment plant, the benefit that was not included was that households can buy freshwater at a lower price than that offered by commercial vendors. Although rainwater has been used as an alternative source of drinking water for a very long time, it does not necessarily mean that households would have stopped harvesting rainwater once the freshwater supply network has been established. Likewise, during the household survey, only a few respondents reported that they had incurred diseases due to saltwater intrusion. Therefore, the benefit from disease prevention could be omitted.

28 Climate Impact and Vulnerability Assessment and Economic Analysis
of Adaptation Strategies in Ben Tre, Vietnam
On the other hand, the omitted benefit from the sea dike was the avoidance of damages caused by sea level rise. However, the “missing” benefit generated by the sea dike would have been much larger than that generated by the water treatment plant. Thus, if these benefits would be included in the computation of the BCR, then the results of the comparison between the two projects would have been still the same.
7.0 HOUSEHOLD VULNERABILITY INDEX
The VEP framework was used in this study to measure household vulnerability. VEP estimates show the probability that a household will fall below the minimum consumption threshold level at which they will be considered as poor. The threshold used in this study was the World Bank minimum of USD 1.25 per capita per day. The estimates have a range of values from 0 to 1, with 0 having the lowest vulnerability and 1 the highest vulnerability.
In this study, households with a VEP estimate of 0.00–0.49 were considered not vulnerable,
those with 0.50–0.79 were considered moderately vulnerable, and those with 0.80–1.0 were highly vulnerable. The variables used in the regression were gender and education of household head; dependency ratio; household assets; number of contacts for credit; percentage of income from agriculture, fishery, and forestry; dummy variables whether household is involved in farming, fishing, gleaning, and livestock raising; number of floods experienced by household; and dummy variables for erosion and saltwater intrusion.
Table 15 summarizes the VEP estimates and the vulnerability incidence of the study sites.
Results showed that 46% of the sample households were vulnerable. Of this, 31% were highly vulnerable, whereas 15% were moderately vulnerable. Mean VEP for the highly vulnerable group was significantly higher than those of the other groups at 0.91. The moderately vulnerable had a mean VEP of 0.67, and the non-vulnerable had a low mean VEP of 0.09.
Table 15. Distribution of households according to level of vulnerability and mean VEP estimates
Vulnerability Level Not Vulnerable Moderately Vulnerable
Highly Vulnerable All
Number of households 156.00 44.00 90.00 290.00 % of households 54.00 15.00 31.00 100.00 Mean VEP 0.09 0.67 0.91 0.43 SD of VEP estimates 0.15 0.08 0.05 0.39

29 Economy and Environment Program for Southeast Asia
It is important to analyze and characterize the profile of those households that were found to be vulnerable. Such information can guide the government, private organizations, and the community on the best implementation strategy for a CCA program. The results of the analysis could also serve as a rough guide in identifying which sectors to prioritize and what possible interventions to carry out. It could also be a means by which CCA planners can roughly assess the adaptation needs of the communities living in the study sites. In this study, the researchers looked at the primary occupation of the household head, their knowledge of climate change, their preparedness to deal with future climate change impacts, and the damages and impacts that they experienced from past climate-related hazards and events. Looking at the role of gender could also provide interesting insights.
In the vulnerable group, about 80% of the household heads were employed as farmers,
fishers, or forestry workers (Table 16). This proportion was lower for the non-vulnerable group at only 63%. Because majority of the vulnerable group relies on agriculture, fishery, and forestry, policy and decision makers should therefore implement interventions that would help the people engaged in these sectors. Such interventions could be in the form of providing alternative livelihoods to augment their income. People whose livelihoods are engaged in these sectors highly depend on natural resources, which are highly sensitive to external shocks, including those that are climate-related.
Knowledge and information are crucial elements in ensuring that households are able to implement adequate preparations to withstand the impacts of climate change. However, results showed that quite a significant proportion of households declared that they had no knowledge about climate change. This proportion was highest for the moderately vulnerable (55%), while 36% and 32% of the non-vulnerable and highly vulnerable groups, respectively, reported that they had no knowledge of climate change (Table 17). The proportions that were not informed about the issue can be considered substantial; hence, implementing an education and information campaign may be relevant in the study sites.
In the survey, household respondents were asked to evaluate their degree of preparedness in dealing with the future impacts of climate change. Gathering such information is relevant as it can give an idea on whether households undertake autonomous adaptations, and whether their stance is proactive or reactive.
Results showed that a high percentage of households thought that they were unprepared
for future calamities (Table 17). In fact, for all groups, more than 50% thought that they were unprepared, with the moderately vulnerable group having the highest proportion at 73%.
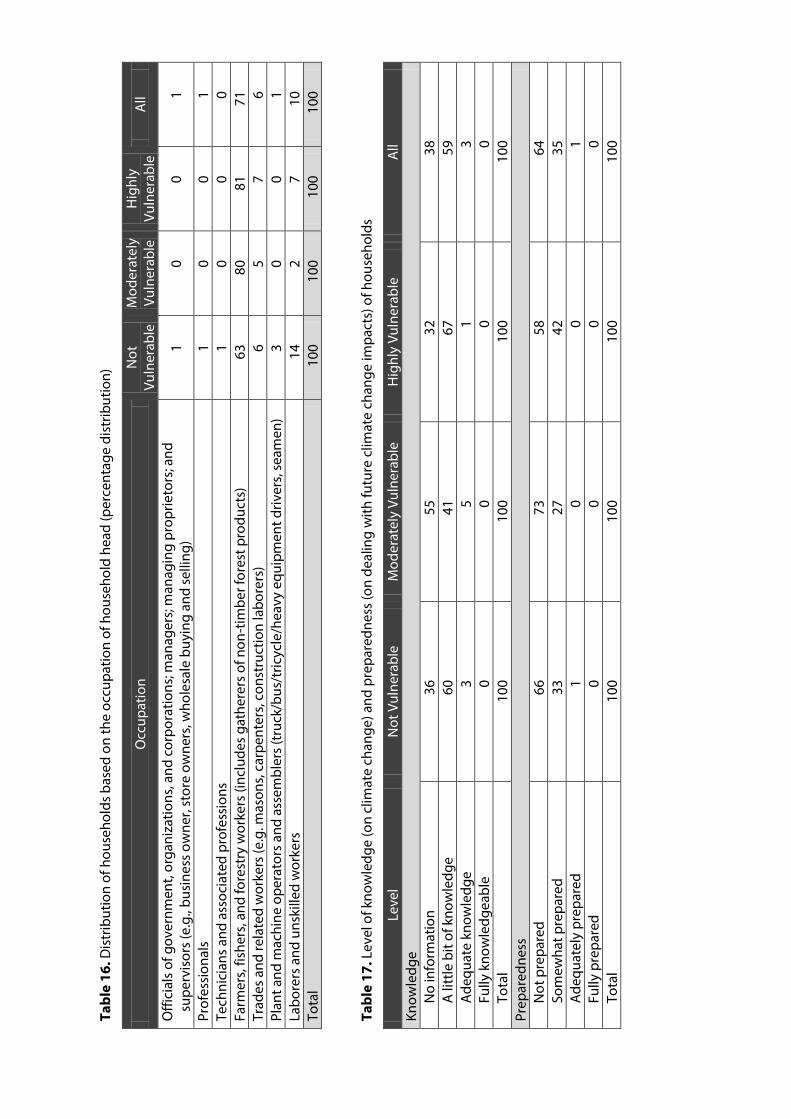
Tabl
e 16
. Dis
trib
utio
n of
hou
seho
lds b
ased
on
the
occu
patio
n of
hou
seho
ld h
ead
(per
cent
age
dist
ribut
ion)
Occ
upat
ion
Not
Vu
lner
able
M
oder
atel
y Vu
lner
able
H
ighl
y Vu
lner
able
A
ll
Offi
cial
s of
gov
ernm
ent,
orga
niza
tions
, and
cor
pora
tions
; man
ager
s; m
anag
ing
prop
rieto
rs; a
nd
supe
rvis
ors
(e.g
., bu
sine
ss o
wne
r, st
ore
owne
rs, w
hole
sale
buy
ing
and
selli
ng)
1 0
0 1
Prof
essi
onal
s 1
0 0
1 Te
chni
cian
s an
d as
soci
ated
pro
fess
ions
1
0 0
0 Fa
rmer
s, fis
hers
, and
fore
stry
wor
kers
(inc
lude
s ga
ther
ers
of n
on-t
imbe
r for
est p
rodu
cts)
63
80
81
71
Tr
ades
and
rela
ted
wor
kers
(e.g
. mas
ons,
carp
ente
rs, c
onst
ruct
ion
labo
rers
) 6
5 7
6 Pl
ant a
nd m
achi
ne o
pera
tors
and
ass
embl
ers
(tru
ck/b
us/t
ricyc
le/h
eavy
equ
ipm
ent d
river
s, se
amen
) 3
0 0
1 La
bore
rs a
nd u
nski
lled
wor
kers
14
2
7 10
To
tal
100
100
100
100
Tabl
e 17
. Lev
el o
f kno
wle
dge
(on
clim
ate
chan
ge) a
nd p
repa
redn
ess
(on
deal
ing
with
futu
re c
limat
e ch
ange
impa
cts)
of h
ouse
hold
s
Leve
l N
ot V
ulne
rabl
e M
oder
atel
y Vu
lner
able
H
ighl
y Vu
lner
able
A
ll Kn
owle
dge
No
info
rmat
ion
36
55
32
38
A li
ttle
bit
of k
now
ledg
e 60
41
67
59
A
dequ
ate
know
ledg
e 3
5 1
3 Fu
lly k
now
ledg
eabl
e 0
0 0
0 To
tal
100
100
100
100
Prep
ared
ness
N
ot p
repa
red
66
73
58
64
Som
ewha
t pre
pare
d 33
27
42
35
A
dequ
atel
y pr
epar
ed
1 0
0 1
Fully
pre
pare
d 0
0 0
0 To
tal
100
100
100
100

31 Economy and Environment Program for Southeast Asia
Looking at the impact of past hazards on the vulnerable households can also guide planners in devising strategic and targeted CCA programs. Table 18 summarizes the incidence of these impacts among the households with different levels of vulnerability. Based on the results, typhoon and flooding and saltwater intrusion had the widest impacts in the study sites. Majority of the respondents reported sustaining damages to their house due to typhoon and flooding, while a large proportion also reported experiencing shortage in freshwater supply and income losses from agricultural and aquaculture production. Thus, CCA options that will help address these problems would be strategic as it can benefit many households, especially the highly vulnerable ones.
It is often asserted that CCA programs and interventions should be gender-sensitive. Thus, the composition of the vulnerable households in terms of gender should also be analyzed. Based on the data gathered from the household survey (Table 19), about 11% of the highly vulnerable households were female-headed, while this percentage increases to 16% in the moderately vulnerable group. In terms of incidence, vulnerability was higher for male-headed households (48%), although this was also substantially high for female-headed households at 36% (Table 20). Table 18. Incidence of climate-related impacts based on vulnerability (in percentage)
Impact Percent Affected
Not Vulnerable
Moderately Vulnerable
Highly Vulnerable
All
Typhoon and flooding Damage to house 60 50 56 57 Damage/loss of appliances 19 11 16 17 Damage to assets (boats, motorcycles) 4 7 6 5 Loss in agricultural production 13 9 18 14 Loss in fishing income 6 7 4 6 Loss in aquaculture production 12 14 16 13 Income loss due to work stoppage 1 0 3 2
Erosion and sea level rise Damage to house 1 2 0 1 Damage to assets (boats, motorcycles) 2 5 0 2 Loss in agricultural production 3 5 4 4 Loss in aquaculture production 4 5 7 5
Saltwater intrusion Loss in agricultural production 19 30 23 22 Household members got sick due to
gastrointestinal diseases 2 0 6 2
Household experienced lack of fresh water for domestic uses 46 50 46 47
Table 19. Distribution households based on gender of household head (percentage share).
Level Male Female Total Not Vulnerable 80 20 100 Moderately Vulnerable 84 16 100 Highly Vulnerable 89 11 100 All 83 17 100

32 Climate Impact and Vulnerability Assessment and Economic Analysis
of Adaptation Strategies in Ben Tre, Vietnam
Table 20. Incidence of vulnerability for male- vs. female-headed households (in percent)
Level Male Female Moderately Vulnerable 15 15 Highly Vulnerable 33 21 All Vulnerable 48 36
8.0 INSTITUTIONAL ANALYSIS 8.1 Decision Making and Planning by LGUs to Deal with Climate Change
Based on the results of the FGDs and meetings with the communities organized by the
local governmental units (LGUs) (mostly funded by NGOs), and on the climate change scenarios (i.e., increase in temperature and precipitation and sea level rise) of Ben Tre province designed in 2010, the provincial government—in cooperation with experts—conducted the following studies:
1. preliminary assessment of the impacts of climate change on natural environment, human, economy, society, vulnerable areas (especially coastal areas); and
2. identification of the areas and economic sectors in the coastal areas most vulnerable to the effects of climate change. Table 21 presents the CCA programs that were being considered for implementation in the
coastal districts. The programs presented were based on the results of the meetings and studies, which helped the provincial government to build CCA action plan in Ben Tre province. Table 21. CCA programs being considered for implementation
Program Project Program on mitigating the
impacts of global warming and sea level rise on marine ecosystems and coastal areas
Applying integrated management of coastal areas and ecosystem based management
Establishing construction-free zones in coastal areas Building permanent coastal routes, taking into account the
height of sea level rise Building permanent coastal routes, taking into account the
height of sea level rise Building new or upgrading existing sea dikes and dikes in
estuaries Developing early warning systems Protecting mangrove ecosystems and coastal wetlands
Program on sustainable development of agriculture under climate change conditions
Conserving the indigenous plants and animals Investing in scientific and technological applications to develop
new varieties of seed with higher productivity and adaptability to water shortage, drought, and salinity
Changing the production structures of plants and animals to adapt to climate change
Improving rainwater drainage in the coastal and riverine lowlands
Applying water-saving irrigation technology and new farming methods to increase yield and reduce greenhouse gases
Building freshwater plants/water treatment plants
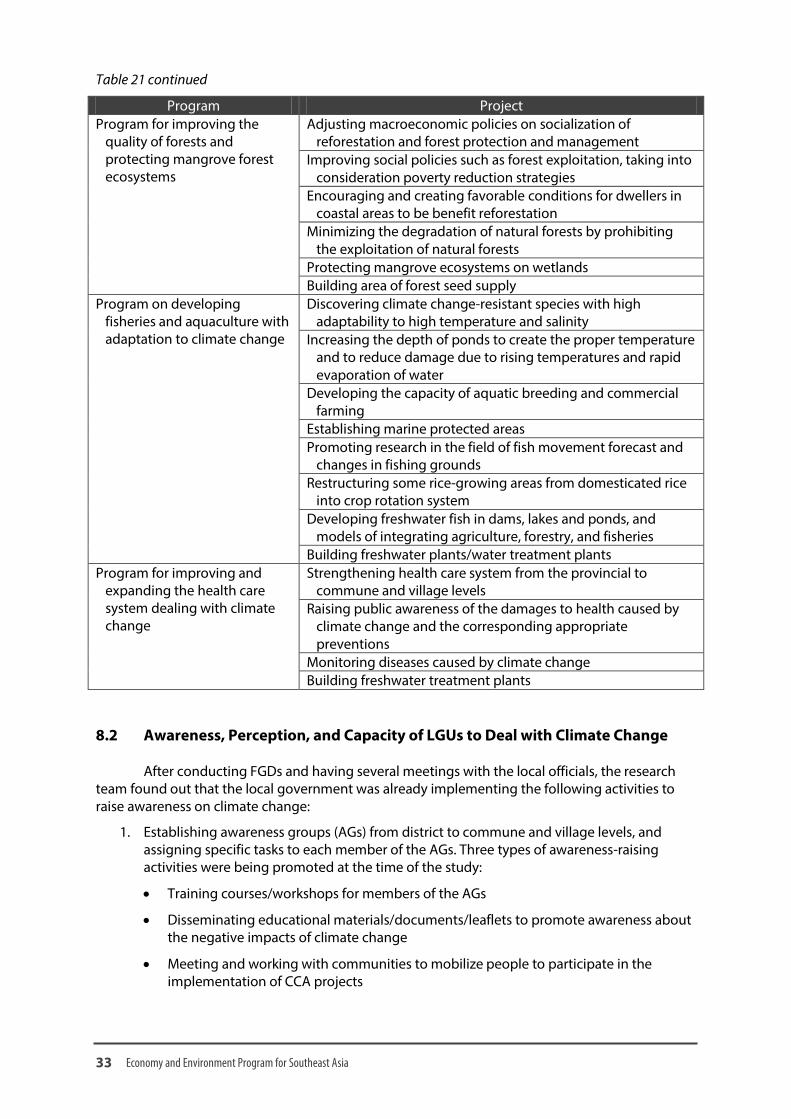
33 Economy and Environment Program for Southeast Asia
Table 21 continued
Program Project Program for improving the
quality of forests and protecting mangrove forest ecosystems
Adjusting macroeconomic policies on socialization of reforestation and forest protection and management
Improving social policies such as forest exploitation, taking into consideration poverty reduction strategies
Encouraging and creating favorable conditions for dwellers in coastal areas to be benefit reforestation
Minimizing the degradation of natural forests by prohibiting the exploitation of natural forests
Protecting mangrove ecosystems on wetlands Building area of forest seed supply
Program on developing fisheries and aquaculture with adaptation to climate change
Discovering climate change-resistant species with high adaptability to high temperature and salinity
Increasing the depth of ponds to create the proper temperature and to reduce damage due to rising temperatures and rapid evaporation of water
Developing the capacity of aquatic breeding and commercial farming
Establishing marine protected areas Promoting research in the field of fish movement forecast and
changes in fishing grounds Restructuring some rice-growing areas from domesticated rice
into crop rotation system Developing freshwater fish in dams, lakes and ponds, and
models of integrating agriculture, forestry, and fisheries Building freshwater plants/water treatment plants
Program for improving and expanding the health care system dealing with climate change
Strengthening health care system from the provincial to commune and village levels
Raising public awareness of the damages to health caused by climate change and the corresponding appropriate preventions
Monitoring diseases caused by climate change Building freshwater treatment plants
8.2 Awareness, Perception, and Capacity of LGUs to Deal with Climate Change
After conducting FGDs and having several meetings with the local officials, the research
team found out that the local government was already implementing the following activities to raise awareness on climate change:
1. Establishing awareness groups (AGs) from district to commune and village levels, and assigning specific tasks to each member of the AGs. Three types of awareness-raising activities were being promoted at the time of the study:
• Training courses/workshops for members of the AGs
• Disseminating educational materials/documents/leaflets to promote awareness about the negative impacts of climate change
• Meeting and working with communities to mobilize people to participate in the implementation of CCA projects

34 Climate Impact and Vulnerability Assessment and Economic Analysis
of Adaptation Strategies in Ben Tre, Vietnam
2. Organizing several events on the occasion of Earth Day, World Meteorological Day, World Water Day, and World Environment Day. However, these activities were not conducted regularly/continuously due to lack of funds. Owing to the support of several NGOs, some of the communes have been applying
community participatory methods to encourage communities to actively participate in addressing the following issues:
1. Preliminary assessment of the impact of climate change on villages on the basis of climate change scenarios;
2. Finding and selecting specific measures to cope with climate change including activities, technical options, and projects; and
3. Raising awareness and responsibility of community in adapting to the effects of climate change. The other communes, however, passively depended on the provincial government’s plans.
Therefore, these LGUs need to be capacitated on climate change adaptation.
9.0 CONCLUSIONS AND RECOMMENDATIONS Climate change mapping shows that Vietnam’s 10 most endangered provinces are among
the top 25% most vulnerable areas in Southeast Asia—Ben Tre is one of these provinces (Yusuf and Francisco 2010).
In the studied sites, data collected from the household survey indicated that serious
damages had been incurred from climatic events. For one, the most recent typhoons resulted in losses worth VND 3,196,550,000 (USD 154,155). For another, recent damages from saltwater intrusion amounted to VND 1,599,803,000 (USD 77,151). Compared to typhoons and saltwater intrusion, erosions have affected fewer numbers of households. Estimated loss from the most recent erosion amounted to VND 590,800,000 (USD 28,492).
The total damages caused by these climatic events actually surpassed those figures listed
above because the cost of the measures undertaken by households after such climatic events can also be considered as losses. Households spent a total of VND 3,852,981,436 (USD 185,811) on essential activities to deal with the after-effects caused by typhoons. Meanwhile, the total cost of establishing measures to mitigate the impacts of saltwater intrusion amounted to VND 2,122,917,000 (USD 102,378). Similarly, households spent a total of VND 1,310,100,000 (USD 63,180) to set up measures to address the after-effects of erosions. Note that these figures were calculated based on a sample of just 300 households. Therefore, the value of damages would be definitely much larger for the whole community.
In order to deal with future typhoons, modifying houses to make them more resilient and
participating in community projects/activities addressing typhoons were two of the measures that were selected by most respondents. Regarding saltwater intrusion, harvesting rainwater was viewed as the first priority, followed by buying freshwater from commercial vendors, and tapping freshwater from a different source. In order to mitigate impacts of future erosions, installing protective structures and mangrove plantation were viewed as priorities by most respondents.
35 Economy and Environment Program for Southeast Asia
Aside from the autonomous measures adopted by households, the community also disclosed their expectations from the local government for support in case such climatic events occur in the future. In order to address problems associated with typhoons, the local residents deemed community evacuation to be the most needed action, followed by financial assistance, establishing early warning system, replanting mangroves and forests, and institutionalizing rescue and emergency assistance. In dealing with erosion, mangrove rehabilitation/conservation was highly appreciated by the respondents. Regarding sea level rise, building new or repairing existing sea dikes were viewed to be the most appropriate adaptation measures. Considering saltwater intrusion, the community highly regarded the construction of a freshwater treatment facility.
Results of the CEA showed that building a freshwater treatment plant would be more cost
effective than building a sea dike system. Nonetheless, the dike had a higher BCR than the treatment plant, although results of the analysis indicated that the investment and operating costs of the dike are much higher.
Based on the results of the study and their implications, the provincial government should
integrate CCA programs/projects into its socioeconomic development plans. Knowledge and awareness of climate change play an important role in determining human actions toward the issue at hand. Hence, the provincial government should implement more activities geared toward raising the awareness and knowledge of the local residents and authorities about climate change. Likewise, the central government should consider the measures taken by the residents to cope with climate change, and should adopt a participatory approach in dealing with the issue.
Prevention is better than cure. In dealing with problems associated with climate change,
the provincial government should emphasize more on preventive adaptations rather than curative measures.
Coping with climate change requires strong financial capability, which is a challenge to the
province itself. Hence, the provincial government should be proactive in seeking national financial support and foreign investments and/or financial aid to deal with effects of climate change.
36 Climate Impact and Vulnerability Assessment and Economic Analysis
of Adaptation Strategies in Ben Tre, Vietnam
LITERATURE CITED Ben Tre CEHMF 9 (Centre for Hydro-Meteorological Forecasting). 2010. Plan for disaster risk
management 2020. Ben Tre Centre for Hydro-Meteorological Forecasting, Ben Tre, Vietnam. Ben Tre DARD (Department of Agriculture and Rural Development). 2007. Water resources strategy
towards the year 2020 of Ben Tre province. Department of Agriculture and Rural Development of Ben Tre, Bentre, Vietnam.
———. 2010. Building a sea dike system in Thanh Phu district. Department of Agriculture
and Rural Development of Ben Tre, Ben Tre, Vietnam. Unpublished document. ———. 2011. Building a freshwater-supplying plant under climate conditions. Department of
Agriculture and Rural Development of Ben Tre, Ben Tre, Vietnam. Unpublished document. Ben Tre DONRE (Department of Natural Resources and Environment). 2008. Report on adjustment
and additional land-use planning in Ben Tre province during 2001–2010. Department of Natural Resources and Environment of Ben Tre, Ben Tre, Vietnam.
Ben Tre DPI (Department of Planning and Investment). 2010. Master plan for
socioeconomic development of Ben Tre Province toward 2020. Department of Planning and Investment of Ben Tre, Ben Tre, Vietnam.
Ben Tre PPC (Provincial People’s Committee). 2011. Climate change, sea level rise scenarios for Ben
Tre. The People Committee of Ben Tre province, Ben Tre, Vietnam. Ben Tre Statistical Office. 2011. Ben Tre Statistical Yearbook 2010. Ben Tre, Vietnam. Deressa, T.T.; R.M. Hassan; and C. Ringler. 2009. Assessing household vulnerability to climate
change: The case of farmers in the Nile Basin of Ethiopia. IFPRI Discussion Paper No. 935. International Food Policy Research Institute, Washington, D.C., VA.
MONRE (Ministry of Natural Resources and Environment). 2008. National target program to
respond to climate change. Ministry of Natural Resources and Environment, Hanoi, Vietnam. ———. 2009. Climate change, sea level rise scenarios for Vietnam. Ministry of Natural Resources
and Environment, Hanoi, Vietnam. Oxfam. 2008. Vietnam: Climate change, adaptation, and poor people. Oxfam International, Oxford,
United Kingdom. Yusuf A.A. and H.A. Francisco. 2010. Hotpots! Mapping climate change vulnerability in Southeast
Asia. Economy and Environment Program for Southeast Asia, Singapore. Zhuang J.; Liang Z.; Lin T.; and F. se Guzman. 2007. Theory and practice in the choice of social
discount rates for cost-benefit analysis: A survey. ERDB Working Paper Series No. 94. Asian Development Bank, Manila, the Philippines.

37 Economy and Environment Program for Southeast Asia
APPENDICES Appendix 1. Activities, Costs, Benefits, Assumptions, and Calculation of CEA for the
Construction of the Freshwater Treatment Plant in Ben Tre Province
A1.1 Calendar of activities Table A1.1. Calendar of activities for the construction of the water treatment plant
Source: Ben Tre DARD (2011)
A1.2 Investment progress Based on the total amount of investment and project progress, the total investment was
planned to be allocated as follows (Ben Tre DARD 2011):
Year 1: VND 6,662,000,000 (USD 321,277)
Year 2: VND 40,539,000,000 (USD 1,955,006)
Year 3: VND 470,825,000,000 (USD 22,705,681)
Year 4: VND 480,245,000,000 (USD 23,159,963)
Period Activities August 2011 to December 2012 Field research for project development
Approval of project Capital preparation Designing and project estimates Approval of design and project estimates Clear-the-ground compensation Calls for tender
January 2013 to December 2014 Construction Test operation Training and technology transfer Acceptance and official operation

A1.
3 Es
tim
ates
on
the
oper
atin
g co
sts
of th
e w
ater
trea
tmen
t pla
nt
Tabl
e A
1.2.
Ope
ratin
g co
sts
of th
e w
ater
trea
tmen
t pla
nt
Cost
Item
A
ssum
ptio
ns
Cost
Bas
ed o
n A
ssum
ptio
ns
Elec
tric
ity, l
abor
, ch
emic
al (C
1)
Elec
tric
ity
Use
of e
lect
ricity
for t
he p
erio
d 20
15–2
019
wou
ld b
e 3,
759,
600
kWh
per y
ear
Use
of e
lect
ricity
from
202
0 w
ould
be
8,11
4,33
3 kW
h pe
r yea
r
Pric
e of
ele
ctric
ity w
ould
be
VND
1,2
50/k
Wh
From
201
5 to
201
9: 3
,759
,600
x 1
,250
= V
ND
4,7
00
mill
ion
per y
ear
From
202
0: 8
,114
,333
x 1
,250
= V
ND
10,
143
mill
ion
per
year
Labo
r
VND
500
mill
ion
per y
ear
Chem
ical
U
se o
f che
mic
als
for t
he p
erio
d 20
15–2
019
wou
ld b
e 4,
000
kg p
er y
ear
Use
of c
hem
ical
s fr
om 2
020
wou
ld b
e 5,
700
kg p
er y
ear
Pric
e of
che
mic
als i
s av
erag
ed a
s VN
D 1
4,00
0/kg
From
201
5 to
201
9: 4
,000
x 1
4,00
0 =
VND
56
mill
ion
per
year
From
202
0: 5
,700
x 1
4,00
0 =
VND
79.
8 m
illio
n pe
r yea
r
Mis
cella
neou
s Eq
ual t
o 3%
of C
1 Fr
om 2
015
to 2
019:
3%
x C
1= V
ND
157
.95
mill
ion
per
year
From
202
0: 3
% x
C1
= VN
D 3
21.6
84 m
illio
n pe
r yea
r
Sour
ce: B
en T
re D
ARD
(201
1)
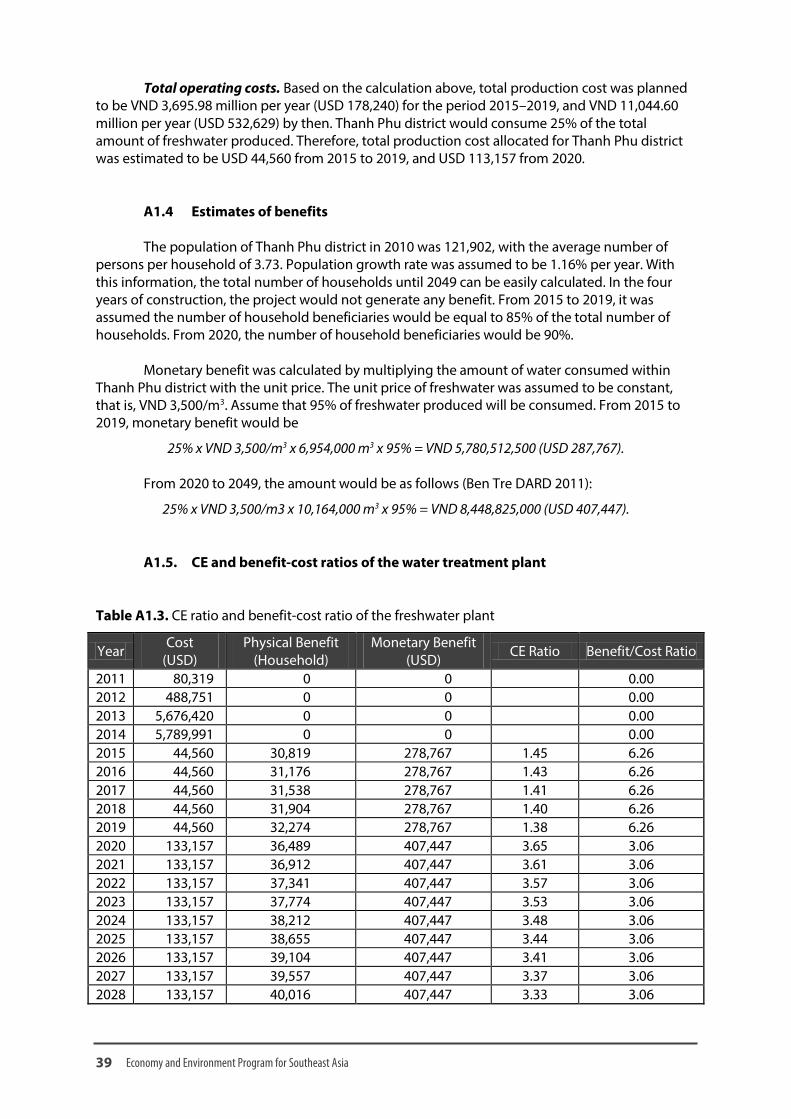
39 Economy and Environment Program for Southeast Asia
Total operating costs. Based on the calculation above, total production cost was planned to be VND 3,695.98 million per year (USD 178,240) for the period 2015–2019, and VND 11,044.60 million per year (USD 532,629) by then. Thanh Phu district would consume 25% of the total amount of freshwater produced. Therefore, total production cost allocated for Thanh Phu district was estimated to be USD 44,560 from 2015 to 2019, and USD 113,157 from 2020.
A1.4 Estimates of benefits The population of Thanh Phu district in 2010 was 121,902, with the average number of
persons per household of 3.73. Population growth rate was assumed to be 1.16% per year. With this information, the total number of households until 2049 can be easily calculated. In the four years of construction, the project would not generate any benefit. From 2015 to 2019, it was assumed the number of household beneficiaries would be equal to 85% of the total number of households. From 2020, the number of household beneficiaries would be 90%.
Monetary benefit was calculated by multiplying the amount of water consumed within
Thanh Phu district with the unit price. The unit price of freshwater was assumed to be constant, that is, VND 3,500/m3. Assume that 95% of freshwater produced will be consumed. From 2015 to 2019, monetary benefit would be
25% x VND 3,500/m3 x 6,954,000 m3 x 95% = VND 5,780,512,500 (USD 287,767). From 2020 to 2049, the amount would be as follows (Ben Tre DARD 2011):
25% x VND 3,500/m3 x 10,164,000 m3 x 95% = VND 8,448,825,000 (USD 407,447). A1.5. CE and benefit-cost ratios of the water treatment plant
Table A1.3. CE ratio and benefit-cost ratio of the freshwater plant
Year Cost (USD)
Physical Benefit (Household)
Monetary Benefit (USD)
CE Ratio Benefit/Cost Ratio
2011 80,319 0 0 0.00 2012 488,751 0 0 0.00 2013 5,676,420 0 0 0.00 2014 5,789,991 0 0 0.00 2015 44,560 30,819 278,767 1.45 6.26 2016 44,560 31,176 278,767 1.43 6.26 2017 44,560 31,538 278,767 1.41 6.26 2018 44,560 31,904 278,767 1.40 6.26 2019 44,560 32,274 278,767 1.38 6.26 2020 133,157 36,489 407,447 3.65 3.06 2021 133,157 36,912 407,447 3.61 3.06 2022 133,157 37,341 407,447 3.57 3.06 2023 133,157 37,774 407,447 3.53 3.06 2024 133,157 38,212 407,447 3.48 3.06 2025 133,157 38,655 407,447 3.44 3.06 2026 133,157 39,104 407,447 3.41 3.06 2027 133,157 39,557 407,447 3.37 3.06 2028 133,157 40,016 407,447 3.33 3.06

40 Climate Impact and Vulnerability Assessment and Economic Analysis
of Adaptation Strategies in Ben Tre, Vietnam
Table A1.3 continued
Year Cost (USD)
Physical Benefit (Household)
Monetary Benefit (USD) CE Ratio Benefit/Cost Ratio
2029 133,157 40,480 407,447 3.29 3.06 2030 133,157 40,950 407,447 3.25 3.06 2031 133,157 41,425 407,447 3.21 3.06 2032 133,157 41,905 407,447 3.18 3.06 2033 133,157 42,392 407,447 3.14 3.06 2034 133,157 42,883 407,447 3.11 3.06 2035 133,157 43,381 407,447 3.07 3.06 2036 133,157 43,884 407,447 3.03 3.06 2037 133,157 44,393 407,447 3.00 3.06 2038 133,157 44,908 407,447 2.97 3.06 2039 133,157 45,429 407,447 2.93 3.06 2040 133,157 45,956 407,447 2.90 3.06 2041 133,157 46,489 407,447 2.86 3.06 2042 133,157 47,028 407,447 2.83 3.06 2043 133,157 47,574 407,447 2.80 3.06 2044 133,157 48,126 407,447 2.77 3.06 2045 133,157 48,684 407,447 2.74 3.06 2046 133,157 49,249 407,447 2.70 3.06 2047 133,157 49,820 407,447 2.67 3.06 2048 133,157 50,398 407,447 2.64 3.06 2049 133,157 50,982 407,447 2.61 3.06
Present value of costs: USD 9,344,091.13
Total physical benefits: 50,982 households
CE ratio: USD 183.281 per benefited household
Present value of monetary benefits: USD 2,350,718.07
Benefit/Cost ratio: 0.2516 Appendix 2: Activities, Costs, Benefits, Assumptions, and Calculation of CEA
for the Construction of the Sea Dike System
A2.1 Investment progress Table A2.1. Investment progress of the sea dike (in USD)
Category 2011–2012 2013–2014 2015–2016 Construction 7,669,994 35,261,429 37,595,052 Clear-the-ground compensation 12,754,871 987,654 1,633,632 Project management 98,524 357,976 375,193 Project consultancy 956,115 2,408,468 2,514,468 Miscellaneous 503,569 1,228,781 1,246,672 Inflationary costs 8,133,729 14,890,432 16,045,091 Total investment 30,116,802 55,134,742 59,410,108 Source: Ben Tre DARD (2010)
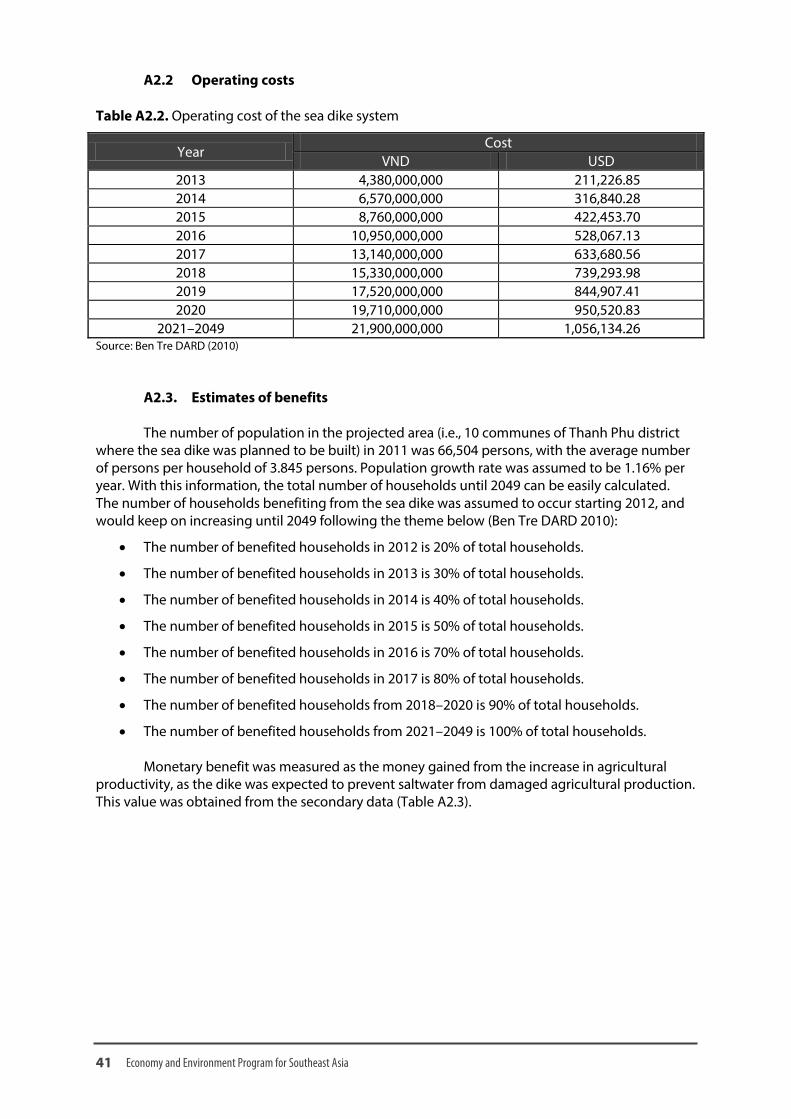
41 Economy and Environment Program for Southeast Asia
A2.2 Operating costs Table A2.2. Operating cost of the sea dike system
Year Cost
VND USD 2013 4,380,000,000 211,226.85 2014 6,570,000,000 316,840.28 2015 8,760,000,000 422,453.70 2016 10,950,000,000 528,067.13 2017 13,140,000,000 633,680.56 2018 15,330,000,000 739,293.98 2019 17,520,000,000 844,907.41 2020 19,710,000,000 950,520.83
2021–2049 21,900,000,000 1,056,134.26 Source: Ben Tre DARD (2010)
A2.3. Estimates of benefits The number of population in the projected area (i.e., 10 communes of Thanh Phu district
where the sea dike was planned to be built) in 2011 was 66,504 persons, with the average number of persons per household of 3.845 persons. Population growth rate was assumed to be 1.16% per year. With this information, the total number of households until 2049 can be easily calculated. The number of households benefiting from the sea dike was assumed to occur starting 2012, and would keep on increasing until 2049 following the theme below (Ben Tre DARD 2010):
• The number of benefited households in 2012 is 20% of total households.
• The number of benefited households in 2013 is 30% of total households.
• The number of benefited households in 2014 is 40% of total households.
• The number of benefited households in 2015 is 50% of total households.
• The number of benefited households in 2016 is 70% of total households.
• The number of benefited households in 2017 is 80% of total households.
• The number of benefited households from 2018–2020 is 90% of total households.
• The number of benefited households from 2021–2049 is 100% of total households. Monetary benefit was measured as the money gained from the increase in agricultural
productivity, as the dike was expected to prevent saltwater from damaged agricultural production. This value was obtained from the secondary data (Table A2.3).
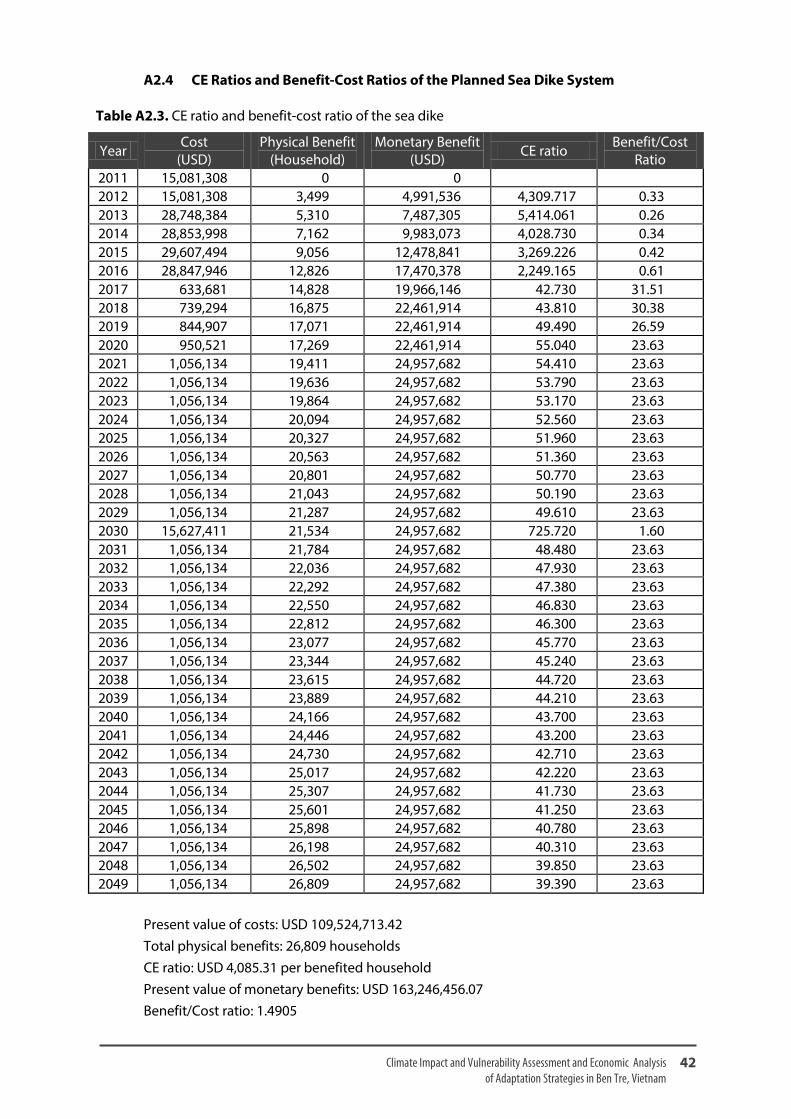
42 Climate Impact and Vulnerability Assessment and Economic Analysis
of Adaptation Strategies in Ben Tre, Vietnam
A2.4 CE Ratios and Benefit-Cost Ratios of the Planned Sea Dike System Table A2.3. CE ratio and benefit-cost ratio of the sea dike
Year Cost
(USD) Physical Benefit
(Household) Monetary Benefit
(USD) CE ratio Benefit/Cost
Ratio 2011 15,081,308 0 0 2012 15,081,308 3,499 4,991,536 4,309.717 0.33 2013 28,748,384 5,310 7,487,305 5,414.061 0.26 2014 28,853,998 7,162 9,983,073 4,028.730 0.34 2015 29,607,494 9,056 12,478,841 3,269.226 0.42 2016 28,847,946 12,826 17,470,378 2,249.165 0.61 2017 633,681 14,828 19,966,146 42.730 31.51 2018 739,294 16,875 22,461,914 43.810 30.38 2019 844,907 17,071 22,461,914 49.490 26.59 2020 950,521 17,269 22,461,914 55.040 23.63 2021 1,056,134 19,411 24,957,682 54.410 23.63 2022 1,056,134 19,636 24,957,682 53.790 23.63 2023 1,056,134 19,864 24,957,682 53.170 23.63 2024 1,056,134 20,094 24,957,682 52.560 23.63 2025 1,056,134 20,327 24,957,682 51.960 23.63 2026 1,056,134 20,563 24,957,682 51.360 23.63 2027 1,056,134 20,801 24,957,682 50.770 23.63 2028 1,056,134 21,043 24,957,682 50.190 23.63 2029 1,056,134 21,287 24,957,682 49.610 23.63 2030 15,627,411 21,534 24,957,682 725.720 1.60 2031 1,056,134 21,784 24,957,682 48.480 23.63 2032 1,056,134 22,036 24,957,682 47.930 23.63 2033 1,056,134 22,292 24,957,682 47.380 23.63 2034 1,056,134 22,550 24,957,682 46.830 23.63 2035 1,056,134 22,812 24,957,682 46.300 23.63 2036 1,056,134 23,077 24,957,682 45.770 23.63 2037 1,056,134 23,344 24,957,682 45.240 23.63 2038 1,056,134 23,615 24,957,682 44.720 23.63 2039 1,056,134 23,889 24,957,682 44.210 23.63 2040 1,056,134 24,166 24,957,682 43.700 23.63 2041 1,056,134 24,446 24,957,682 43.200 23.63 2042 1,056,134 24,730 24,957,682 42.710 23.63 2043 1,056,134 25,017 24,957,682 42.220 23.63 2044 1,056,134 25,307 24,957,682 41.730 23.63 2045 1,056,134 25,601 24,957,682 41.250 23.63 2046 1,056,134 25,898 24,957,682 40.780 23.63 2047 1,056,134 26,198 24,957,682 40.310 23.63 2048 1,056,134 26,502 24,957,682 39.850 23.63 2049 1,056,134 26,809 24,957,682 39.390 23.63
Present value of costs: USD 109,524,713.42 Total physical benefits: 26,809 households CE ratio: USD 4,085.31 per benefited household Present value of monetary benefits: USD 163,246,456.07 Benefit/Cost ratio: 1.4905


![[Nguyen Thi Minh Anh] Curriculum Vitae](https://static.fdocuments.in/doc/165x107/587b653b1a28ab38258b6571/nguyen-thi-minh-anh-curriculum-vitae.jpg)
