EEC SlideDeck 02072013 Public v3 - Hart...
34
Sponsored by: Global Refining: Fueling Profitability in the Turbulent Times Ahead
Transcript of EEC SlideDeck 02072013 Public v3 - Hart...

Sponsored by:
Global Refining: Fueling Profitability in the Turbulent Times Ahead

The Outlook for Energy:A View to 2040
Roland L. MoreauExxonMobil Upstream Research CompanyHart Energy Breakfast ClubFebruary 7, 2013
This presentation includes forward-looking statements. Actual future conditions (including economic conditions, energy demand, and energy supply) could differ materially due to changes in technology, the development of new supply sources, political events, demographic changes, and other factors discussed herein and under the heading "Factors Affecting Future Results" in the Investors section of our website at: www.exxonmobil.com. The information provided includes ExxonMobil's internal estimates and forecasts based upon internal data and analyses as well as publically-available information from external sources including the International Energy Agency. This material is not to be used or reproduced without the permission of Exxon Mobil Corporation. All rights reserved.

0
3
6
9
2010 2020 2030 2040
PopulationBillion
Population Trends Impacts Energy Use
0
1
2
3
4
5
6
7
8
1960 1980 2000 2020 2040
OECDAfricaChinaIndiaSoutheast AsiaLatin America
Fertility Rate*Children per Woman
* Source: World Bank & United Nations
OECD
Other Non OECD
China
India
Africa
0
3
6
9
2010 2020 2030 2040
Global Demographics*Billion
Age 0-14
Age 65+
Age 15-64
ExxonMobil 2013 Outlook for Energy

0
25
50
75
100
125
2000 2020 2040
Energy Demand
Economic Growth Drives Energy DemandGDPTrillion 2005$
China
United States
2010-2040 AAGR %
5.6%
2.3%
1.8%Other OECD
Other Non
OECD
3.9%World2.8%
ExxonMobil 2013 Outlook for Energy
0
250
500
750
1000
1250
2000 2020 2040
Quadrillion BTUs
2010-2040 AAGR %World1.0%
0
250
500
750
1000
1250
2000 2020 2040
Energy DemandQuadrillion BTUs
Energy Saved ~500
2010-2040 AAGR %World1.0%
0
50
100
150
200
250
300
ElectricityGeneration
Industrial Transportation Res/Comm
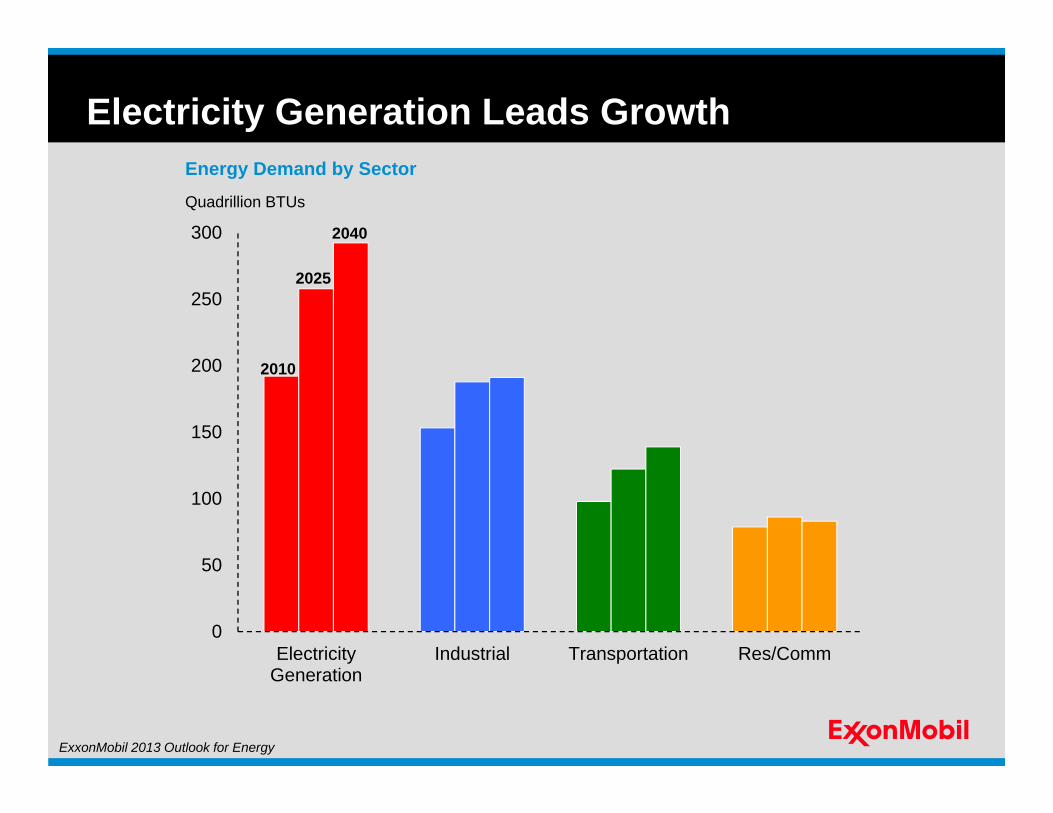
Energy Demand by SectorQuadrillion BTUs
2010
2025
2040
Electricity Generation Leads Growth
ExxonMobil 2013 Outlook for Energy
0
25
50
75
100
125
150
2000 2020 2040
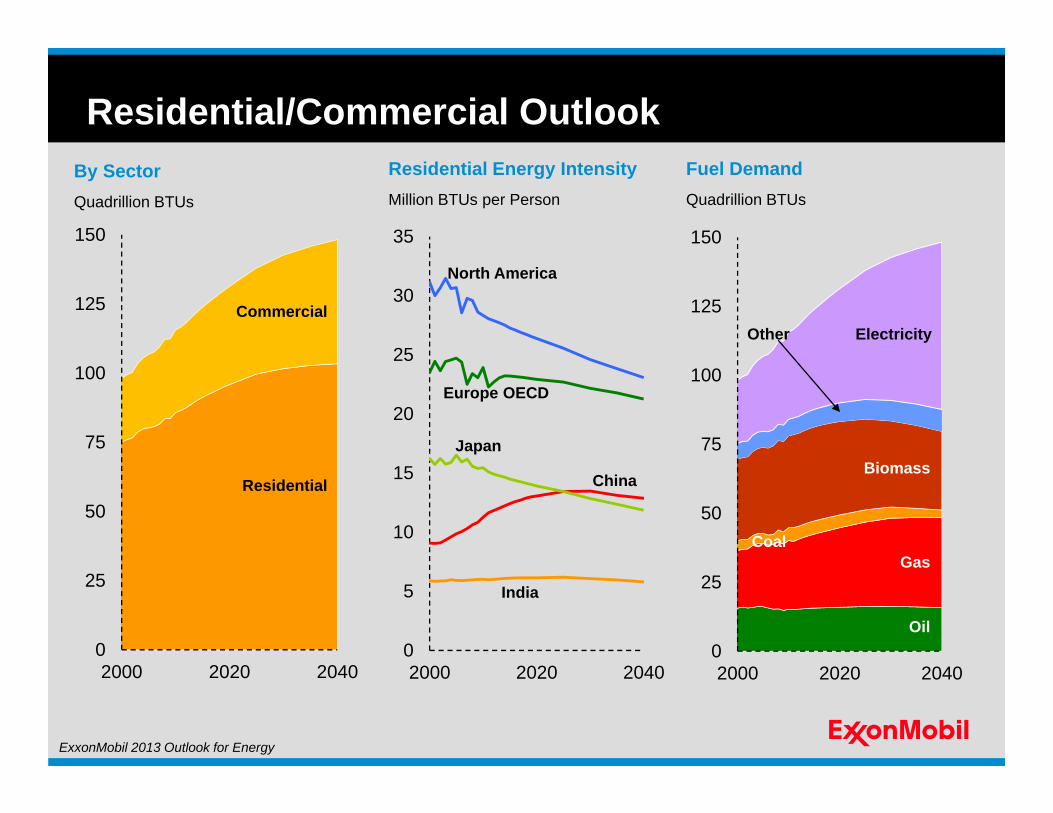
Residential/Commercial Outlook
0
5
10
15
20
25
30
35
2000 2020 2040
Residential Energy IntensityMillion BTUs per Person
Japan
North America
Europe OECD
China
India
By SectorQuadrillion BTUs
Commercial
Residential
0
25
50
75
100
125
150
2000 2020 2040
Fuel DemandQuadrillion BTUs
Electricity
Coal
Oil
Gas
Biomass
Other
ExxonMobil 2013 Outlook for Energy

0
50
100
150
200
250
1990 2015 2040
Industry Energy Demand Increases
Chemicals
Manufacturing & Industry
Energy Industry
Other
PlasticsPlasticsFertilizerFertilizer
PaintPaint
SteelSteel
AutomobilesAutomobiles TextilesTextiles
Liquid FuelsLiquid Fuels
CoalCoalNatural GasNatural Gas
AgricultureAgriculture
LubricantsLubricants AsphaltAsphalt
Quadrillion BTUs
ExxonMobil 2013 Outlook for Energy

Transportation Sectors
Light Duty Vehicles
CarsCars
SUVsSUVs
Pickup TrucksPickup Trucks
Heavy Duty Vehicles
18-wheelers18-wheelers
BusesBuses
Delivery TrucksDelivery Trucks
ExxonMobil 2013 Outlook for Energy

0
15
30
45
60
75
2000 2020 2040
Sector DemandMBDOE
Light Duty
Marine
Rail
Heavy Duty
Aviation
Transportation Demand
ExxonMobil 2013 Outlook for Energy
0
5
10
15
20
25
30
AP NA Europe LA ME ROW
Demand by RegionMBDOE
‘40
‘25
‘10

0
25
50
75
100
125
150
2010 2015 2020 2025 2030 2040
Elec/PHV
Full Hybrid
Natural Gas
Conv. Diesel
Conv. Gasoline
Light Duty Vehicle Sales & Efficiency
0
5
10
15
20
2010 2020 2030 2040
Incremental Vehicle Efficiency GainsMiles per Gallon
Powertrain
Body & Accessories
Vehicle Size
Hybrid
Average27 MPG
47 MPG
Annual New Car Sales by TypeMillion Cars
ExxonMobil 2013 Outlook for Energy
0
4
8
12
16
Coal Gas Nuclear OnshoreWind*
UtilitySolar PV*
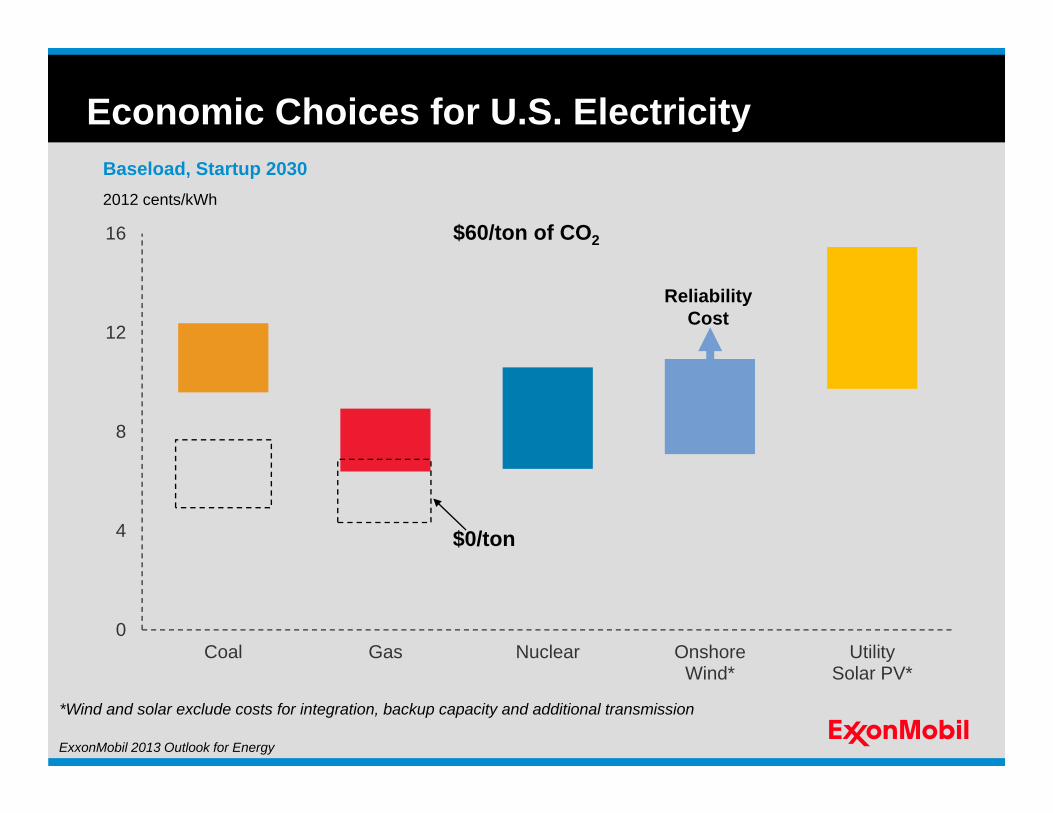
Baseload, Startup 20302012 cents/kWh
*Wind and solar exclude costs for integration, backup capacity and additional transmission
$60/ton of CO2
$0/ton
Economic Choices for U.S. Electricity
Reliability Cost
ExxonMobil 2013 Outlook for Energy

0
25
50
75
100
125
150
175
200
225
Oil Gas Coal Nuclear Biomass Solar / Wind /Biofuels
Hydro / Geo
Energy Mix Continues to EvolveQuadrillion BTUs
Average Growth / Yr. 2010 - 2040
1.0%
2040
2010
0.8%
1.7%
-0.1%
2.4% 0.4%
5.8% 1.8%
ExxonMobil 2013 Outlook for Energy

0
20
40
60
80
100
120
2000 2010 2020 2030 2040
Liquids Supply
MBDOE
Supply by Type
Other LiquidsBiofuels
Conventional Crude & Condensate
Tight OilOil Sands
NGLs
Deepwater
0
1
2
3
4
5
6
2040
Resource*TBO
Remaining Resource
Cumulative Production
* Source: IEAExxonMobil 2013 Outlook for Energy

0
10
20
30
40
50
2010 2025 2040
0
10
20
30
40
50
2010 2025 2040
North America Energy Balance
Oil
Regional Supply
Gas
Quadrillion BTUs
Net ImportsNet Imports
Net Exports
Regional Supply
Net Exports
ExxonMobil 2013 Outlook for Energy
0
25
50
75
100
125
2010 2025 2040
Regional Supply
Total Energy BalanceNet Exports
Net ImportsNet Imports

Conclusions
ExxonMobil 2013 Outlook for Energy


Global Crude, Refining and Clean Fuels Outlook to 2035
Executive Energy Club
Rodrigo FavelaExecutive Director
Refining, Planning and EvaluationHart Energy
February 7, 2013
All rights reserved © 2013
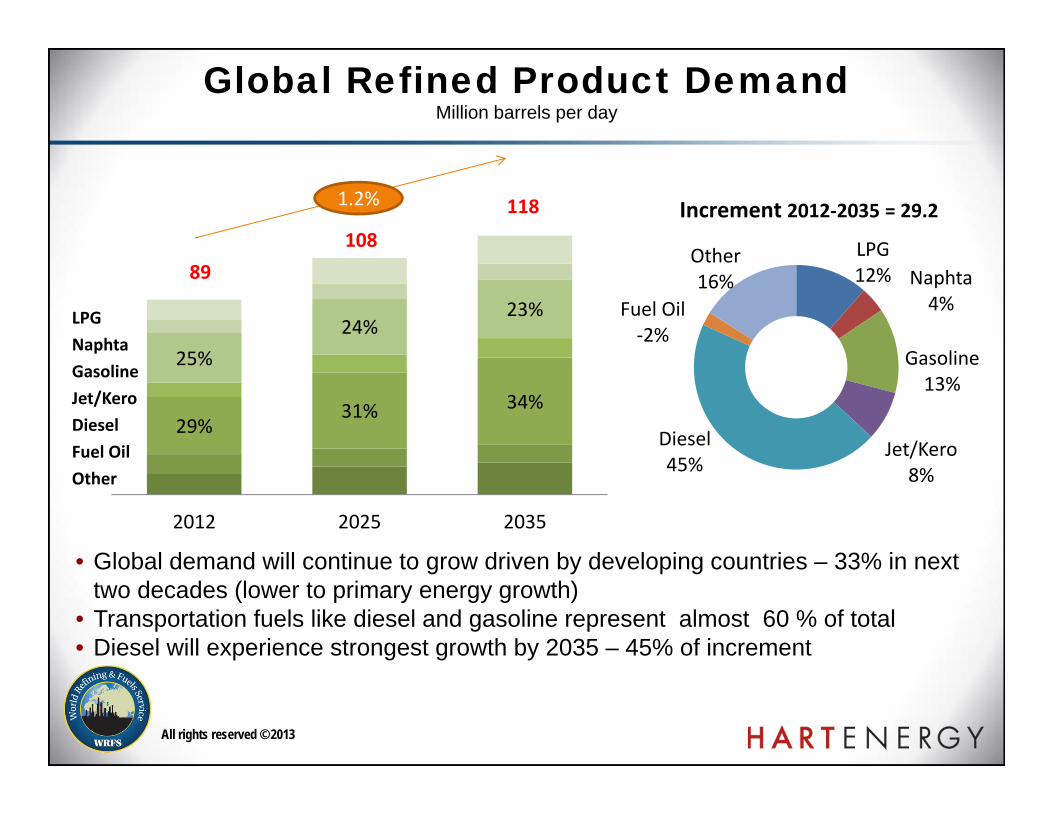
Global Refined Product DemandMillion barrels per day
• Global demand will continue to grow driven by developing countries – 33% in next two decades (lower to primary energy growth)
• Transportation fuels like diesel and gasoline represent almost 60 % of total• Diesel will experience strongest growth by 2035 – 45% of increment
LPGNaphtaGasolineJet/KeroDieselFuel OilOther
Increment 2012‐2035 = 29.2
29%31% 34%
25%24%
23%
2012 2025 2035
LPG12% Naphta
4%
Gasoline13%
Jet/Kero8%
Diesel45%
Fuel Oil‐2%
Other16%89
108
1181.2%

All rights reserved © 2013
Regional Petroleum Product Demand Growth 2012-2035
Source: Hart Energy analysis and forecast (2013)
Asia-Pacific highest volume Middle East highest growth North America will decrease by 0.2%
‐2 0 2 4 6 8 10 12 14 16
North America
Europe
Africa
CIS
Latin America
Middle East
Asia‐Pacific
‐0.2%0.2%
2.0%
1.9%
1.8%
2.6%
1.8%
Million barrels per day
All rights reserved © 2013
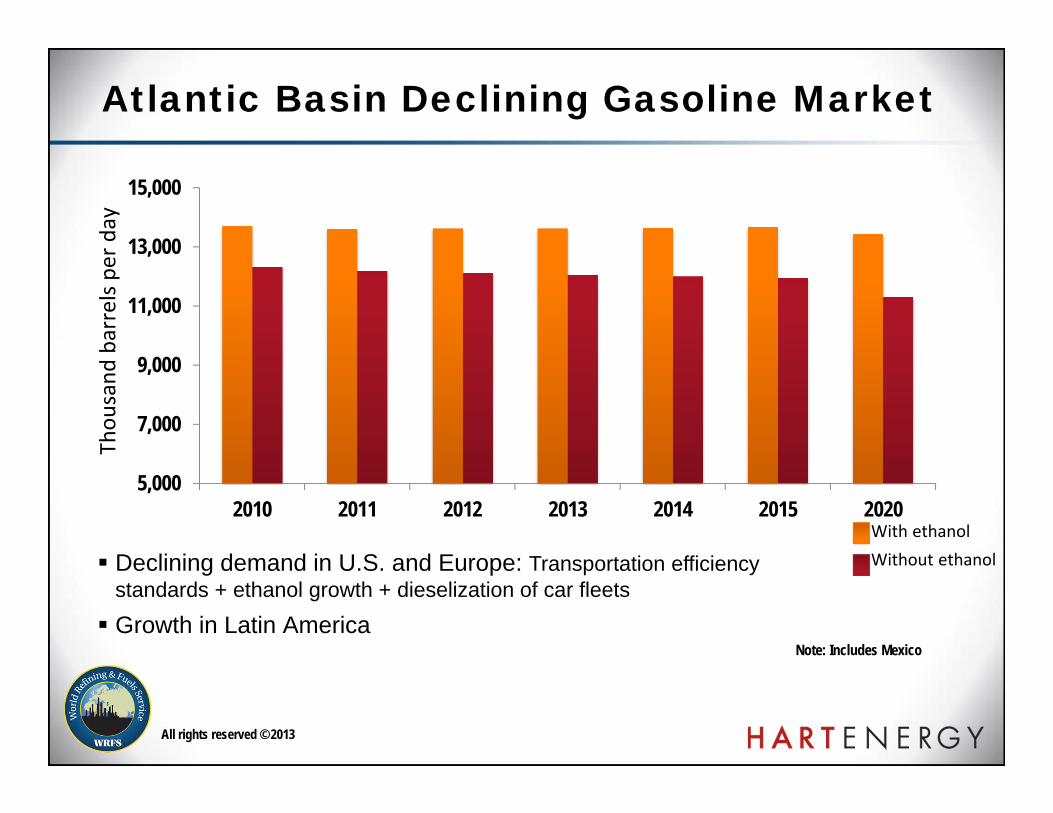
Atlantic Basin Declining Gasoline Market
5,000
7,000
9,000
11,000
13,000
15,000
2010 2011 2012 2013 2014 2015 2020
Note: Includes Mexico
Declining demand in U.S. and Europe: Transportation efficiency standards + ethanol growth + dieselization of car fleets
Growth in Latin America
Thou
sand
barrelsp
er day
With ethanolWithout ethanol
All rights reserved © 2013
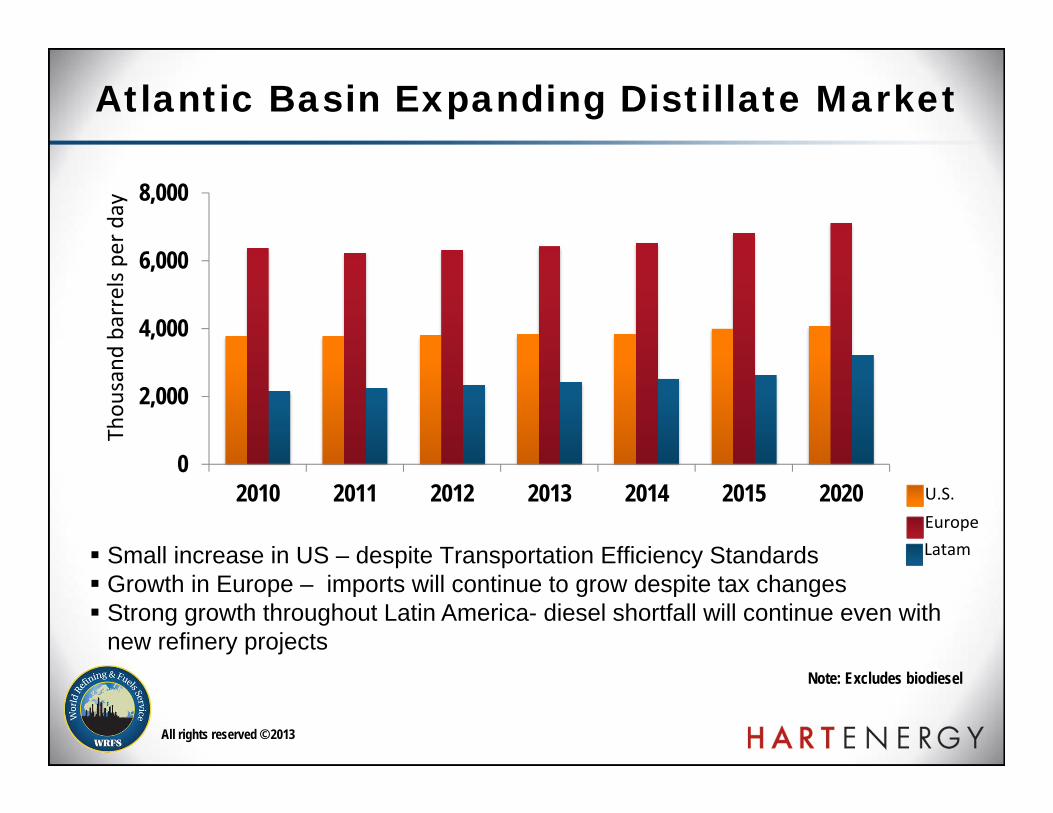
Atlantic Basin Expanding Distillate Market
Note: Excludes biodiesel
0
2,000
4,000
6,000
8,000
2010 2011 2012 2013 2014 2015 2020
Small increase in US – despite Transportation Efficiency Standards Growth in Europe – imports will continue to grow despite tax changes Strong growth throughout Latin America- diesel shortfall will continue even with
new refinery projects
Thou
sand
barrelsp
er day
U.S.EuropeLatam

All rights reserved © 2013
Transportation Fuel Quality
0
5
10
15
20
25
30
2011 2015 2020 2025 2030
<10 ppm 10-50 ppm 51-500 ppm >500 ppm
05
1015202530354045
2011 2015 2020 2025 2030<10 ppm 11-50 ppm 51-500 ppm501-2000 ppm >2000 ppm
Gasoline and on-road diesel markets to less than 10 ppm ULS fuels Lower sulfur in off-road diesel and marine fuels:
500 ppm for on-road diesel by 2015 & below 100 ppm by 2025 500 ppm for marine fuels before middle next decade.
Source: Hart Energy analysis and forecast (2013)
Million barrels per day
Gasoline Diesel

All rights reserved © 2013
0 20 40 60 80 100 120 140
Crude Distillation
Coking
Catalytic Cracking
Hydrocracking +74%
+19%
+66%
+28%
Capacity Expansion, 2012-2035
Million barrels per day
Source: Hart Energy analysis and forecast (2013)
All rights reserved © 2013
Changes in Product Trade Patterns
Escalating gasoline and distillate imbalance in Europe and North America
European gasoline exports to North America will decline by 50%
The distillate shortfall in Europe:
CIS less volume
Middle East and other regions incremental supply
Asia-Pacific will increase gasoline and distillate exports but will fall short in long term due to increased internal demand
Middle East is projected to become the world marginal refined product supply center.

All rights reserved © 2013
Increased Crude/LiquidsGlobal Crude Oil Quality TrendsAPI°, %Sulfur
Global Crude Oil Outlook
Crude quality will remain similar in average …but Heavy crude oil, condensate/NGL, Light/Medium and Unconventional
Oil will have the largest contribution to liquid supply – Impact on dieselyield
1.00
1.10
1.20
1.30
1.40
31.532.032.533.033.534.034.535.0
2011 2015 2025 2035
API
Sulfur
Light/Medium23%
Unconventional15%
SCO6%
Heavy Oil28%
NGL15%
Biofuels8%
GTL/CTL5%
Source: Hart Energy analysis and forecast (2013)

All rights reserved © 2013
North America: Supply Landscape
Unconventional Tight Oil (Shale) will add 4 million b/d. (Sweet light) Logistic constraints – emerging crude-by-rail infrastructure Canadian oil sand
Turn up in production – 2+ million b/d increase 2012 to 2020 Additional 0.8 million b/d 2021- 2025
Increasing supply of condensate and NGL
0%10%20%30%40%50%60%70%
0.01.02.03.04.05.06.07.08.09.0
10.0
2011 2012 2015 2020 2025 2030 2035Tight Oil Oil Sands % of Total
Million barrels per day

All rights reserved © 2013
USGC Natural Gas Prices and Refining Differentials
Source: Hart Energy analysis and forecast (2013)
Light – Heavy Differential (USD/Bbl) Natural gas prices ($/Mcf)
0.0
2.0
4.0
6.0
8.0
10.0
Jul‐0
8De
c‐09
Apr‐11
Sep‐12
Jan‐14
Jun‐15
Oct‐16
Mar‐18
Jul‐1
9
Discounts will depend if USGC exports allowed: ($7‐$8/barrel vs $2‐$3)
Natural gas prices sustained at $4‐$5/Mcf
‐20.0
0.0
20.0
40.0
60.0
80.0
Jun‐08
Jun‐09
Jun‐10
Jun‐11
Jun‐12
Jun‐13
Jun‐14
Jun‐15
Jun‐16
Jun‐17
Jun‐18
Jun‐19
Product – (ULR+DSL)/2‐HSF
LLS – MAY
WTI – MAY

All rights reserved © 2013
U.S.: Favorable Refining Position
US refining with $2‐3 US/bbl advantage over other regions. US Midcontinent / USGC Capacity Additions ‐ surplus capacity with minimal rationalization. Exports to Latin‐American have helped to maintain process Capacity rationalization focused on Europe and to a lesser extent in US East Coast
70
75
80
85
90
95
100Refinery Utilization (%)
0100200300400500600
2008 2009 2010 2011 2012
Gasoline Distillate
US Exports to Latin America(thousand barrels per day)
Source: Hart Energy analysis and forecast (2013)

All rights reserved © 2013
Diesel – Gasoline Differential Outlook
Diesel ‐ Gasoline Differential (USD/bbl)
0
2
4
6
8
10
12
14
16
18
20
2006 2007 2008 2009 2010 2011 2012 2014 2016 2018 2020 2010 2011 2012 2013 2014 2015 2016 2017 2018 2019 2020
Condensate NGL
2,500
1,500
Growth in condensate will depress light naphtha and eventually gasoline market Naphtha/Gasoline market vulnerable to ethanol requirements volatility initiatives. Gasoline prices will decline relative to crude and diesel.
Condensate & NGL (1000 b/d)
Source: Hart Energy analysis and forecast (2013)

All rights reserved © 2013
Latin America: Refined Product Demand
Demand will grow by 52% Diesel and gasoline represent 60% of total demand and contribute 80% of increment LPG and fuel oil participation higher than other regions Brazil and Mexico represent 60% of total demand Major countries will reach less than 30 ppm fuel specs before 2016
LPGNaphthaGasolineJet/KeroDieselFuel OilOther
1.8%MILLION b/d Increment 2012‐2035
02468101214
2012 2025 2035
LPG, 7%Naphta, 2%
Gasoline, 37%
Jet/Kero, 5%
Diesel, 41%
Fuel Oil, 0%
Other, 9%
Source: Hart Energy analysis and forecast (2013)

All rights reserved © 2013
Crude Quality – heavier and sourer than other regions Capacity will increase 42% increment (Brazil, Mexico, Cuba, Argentina and Colombia) Investment in conversion, hydrocracking, and hydroprocessing will increase above
50% (70%,103%,91%)
Latin America: Refining Capacity Expansion
(million barrels per day)
2.53.4
4.23.0
5.26.1
0.8 1.2 1.6
7.79.4
10.9
2012 2020 2030
Conversion Hydroprocessing Light Oil Processing Crude Distillation
Source: Hart Energy analysis and forecast (2013)
All rights reserved © 2013
•Global refining markets have become more volatile, diesel will be the fuel with the strongest growth in all regions
•Gasoline will continue to grow in developing countries but will experience a decline in the US and Europe
•Strong growth in Latin America/Middle East/Asia Pacific. Larger countries will achieve nationwide ultra‐low sulfur fuels quality by 2016.
•Aggressive capacity expansion will be required to keep pace with demand and lower quality indigenous crude.
•Middle East emerging as the marginal producer of diesel. •Unconventional gas and crude will foster US refineries competitiveness in the Atlantic Basin – affecting European refining industry and possibly some Latin American refining projects – new opportunities will arise for petrochemicals based on condensates for the region
Final Remarks
All rights reserved © 2013
Rodrigo FavelaExecutive Director
Refining, Planning and EvaluationHart Energy
Global Crude, Refining and Clean Fuels Outlook to 2035

All rights reserved © 2013