EE xxppeerr iimmeennttaall - Shodhgangashodhganga.inflibnet.ac.in/bitstream/10603/32775/14/14...7...
138
E E x x p p e e r r i i m m e e n n t t a a l l
Transcript of EE xxppeerr iimmeennttaall - Shodhgangashodhganga.inflibnet.ac.in/bitstream/10603/32775/14/14...7...
EExxppeerriimmeennttaall
Improvements of Processing Parameters of APIs Raval MK – PhD Thesis 2012
Department of Pharmaceutical Sciences, Saurashtra University, Rajkot 85
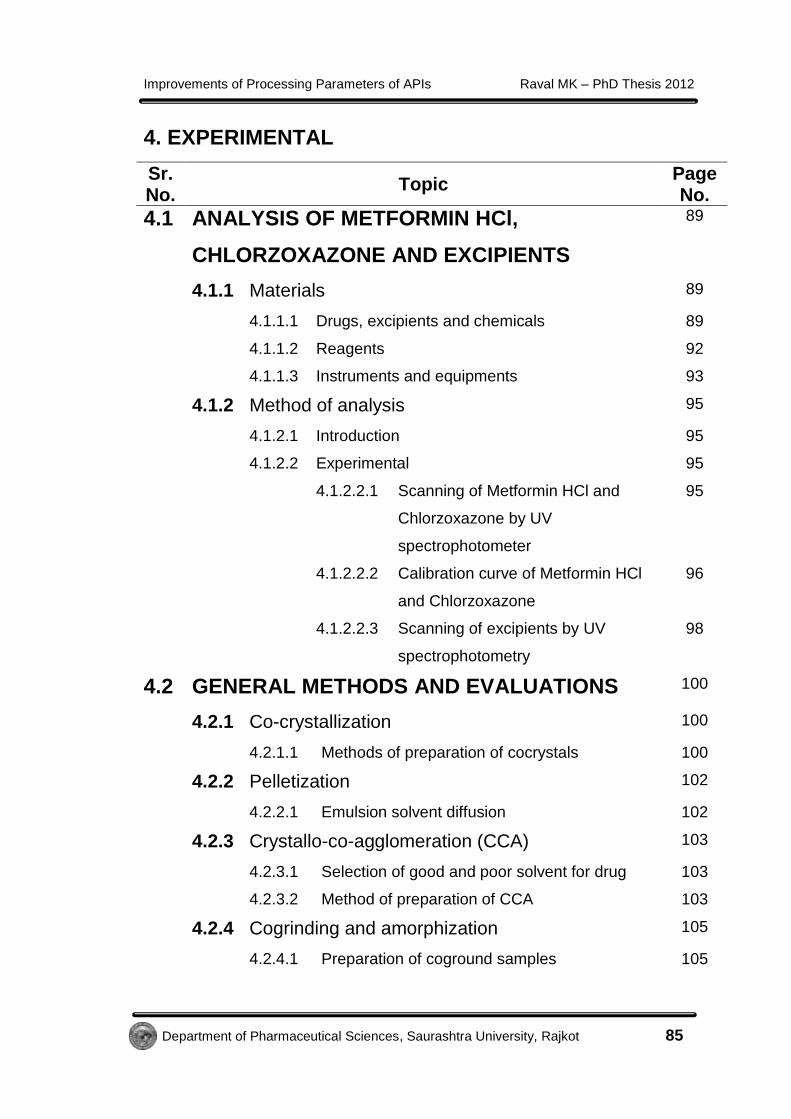
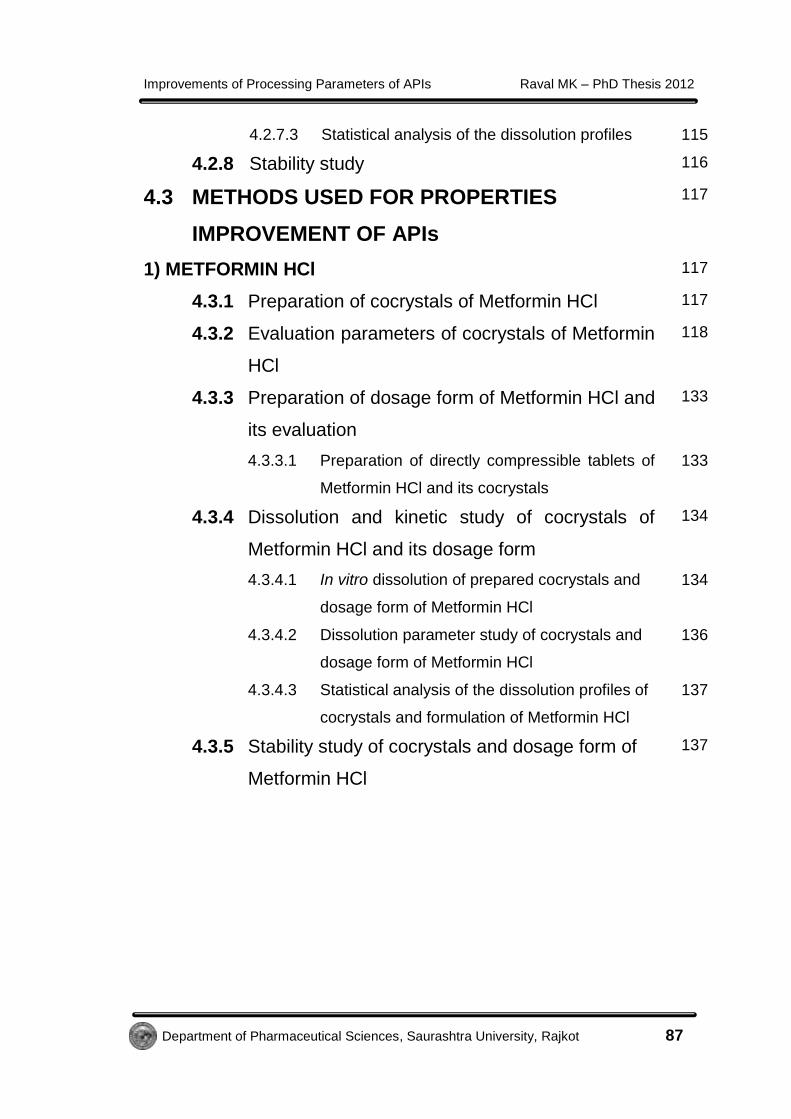
4. EXPERIMENTAL
Sr. No.
Topic Page No.
4.1 ANALYSIS OF METFORMIN HCl,
CHLORZOXAZONE AND EXCIPIENTS
89
4.1.1 Materials 89
4.1.1.1 Drugs, excipients and chemicals 89
4.1.1.2 Reagents 92
4.1.1.3 Instruments and equipments 93
4.1.2 Method of analysis 95
4.1.2.1 Introduction 95
4.1.2.2 Experimental 95
4.1.2.2.1 Scanning of Metformin HCl and
Chlorzoxazone by UV
spectrophotometer
95
4.1.2.2.2 Calibration curve of Metformin HCl
and Chlorzoxazone
96
4.1.2.2.3 Scanning of excipients by UV
spectrophotometry
98
4.2 GENERAL METHODS AND EVALUATIONS 100
4.2.1 Co-crystallization 100
4.2.1.1 Methods of preparation of cocrystals 100
4.2.2 Pelletization 102
4.2.2.1 Emulsion solvent diffusion 102
4.2.3 Crystallo-co-agglomeration (CCA) 103
4.2.3.1 Selection of good and poor solvent for drug 103
4.2.3.2 Method of preparation of CCA 103
4.2.4 Cogrinding and amorphization 105
4.2.4.1 Preparation of coground samples 105

Improvements of Processing Parameters of APIs Raval MK – PhD Thesis 2012
Department of Pharmaceutical Sciences, Saurashtra University, Rajkot 86
4.2.5 Evaluation parameters 106
4.2.5.1 Packability and flow parameters 106
4.2.5.2 Capillary melting point 107
4.2.5.3 Microscopic determination and surface
topography
107
4.2.5.4 Drug loading efficiency and % yield 108
4.2.5.5 Micromeritic study 108
4.2.5.6 Sphericity determination 108
4.2.5.7 Crushing strength 109
4.2.5.8 Heckel plot 109
4.2.5.9 Tensile strength measurement 110
4.2.5.10 Elastic recovery 110
4.2.5.11 Aqueous solubility study 111
4.2.5.12 Differential scanning calorimetry 111
4.2.5.13 Fourier transform infra-red spectroscopy 111
4.2.5.14 Powder x-ray diffractometry 112
4.2.5.15 Scanning electron microscopy 112
4.2.6 Preparation of dosage form and their evaluation 112
4.2.6.1 Preparation of directly compressible tablets of
API and prepared samples
112
4.2.6.2 Evaluation parameters for prepared directly
compressible tablets
113
4.2.6.2.1 Thickness and diameter of tablets 113
4.2.6.2.2 Weight variation test of tablets 113
4.2.6.2.3 Tablet friability test 113
4.2.6.2.4 Tablet hardness test 113
4.2.6.2.5 Tablet disintegration test 113
4.2.7 Dissolution and kinetic study 114
4.2.7.1 In vitro dissolution of prepared samples and
dosage form
114
4.2.7.2 Dissolution parameters 114
Improvements of Processing Parameters of APIs Raval MK – PhD Thesis 2012
Department of Pharmaceutical Sciences, Saurashtra University, Rajkot 87
4.2.7.3 Statistical analysis of the dissolution profiles 115
4.2.8 Stability study 116
4.3 METHODS USED FOR PROPERTIES
IMPROVEMENT OF APIs
117
1) METFORMIN HCl 117
4.3.1 Preparation of cocrystals of Metformin HCl 117
4.3.2 Evaluation parameters of cocrystals of Metformin
HCl
118
4.3.3 Preparation of dosage form of Metformin HCl and
its evaluation
133
4.3.3.1 Preparation of directly compressible tablets of
Metformin HCl and its cocrystals
133
4.3.4 Dissolution and kinetic study of cocrystals of
Metformin HCl and its dosage form
134
4.3.4.1 In vitro dissolution of prepared cocrystals and
dosage form of Metformin HCl
134
4.3.4.2 Dissolution parameter study of cocrystals and
dosage form of Metformin HCl
136
4.3.4.3 Statistical analysis of the dissolution profiles of
cocrystals and formulation of Metformin HCl
137
4.3.5 Stability study of cocrystals and dosage form of
Metformin HCl
137

Improvements of Processing Parameters of APIs Raval MK – PhD Thesis 2012
Department of Pharmaceutical Sciences, Saurashtra University, Rajkot 88
2) CHLORZOXAZONE 140
4.3.6 Preparation of pellets of Chlorzoxazone 141
4.3.6.1 32 full factorial design 141
4.3.7 Preparation of CCA of Chlorzoxazone 145
4.3.7.1 Selection of good and poor solvent for
Chlorzoxazone
145
4.3.7.2 Method of preparation of CCA of
Chlorzoxazone
146
4.3.8 Preparation of co-ground samples of
Chlorzoxazone
149
4.3.9 Evaluation parameters of pellets, CCA,
coground samples of Chlorzoxazone
151
4.3.10 Preparation of dosage forms of
Chlorzoxazone and their evaluation
194
4.3.10.1 Preparation of directly compressible
tablets of CCA and coground sample of
Chlorzoxazone
194
4.3.10.2 Evaluation of tablets of Chlorzoxazone 196
4.3.11 Dissolution and kinetic study of pellets, CCA,
coground samples of Chlorzoxazone and its
dosage forms
196
4.3.11.1 In vitro dissolution of pellets, CCA,
coground samples and dosage forms of
Chlorzoxazone
196
4.3.11.2 Dissolution parameters study of pellets,
CCA, coground samples and dosage
forms of Chlorzoxazone
204
4.3.11.3 Statistical analysis of dissolution profiles
of Chlorzoxazone samples and its
formulations
205
4.3.12 Stability study of CCA, coground samples and
dosage forms of Chlorzoxazone
206
4.4 BIBLIOGRAPHY 210
Improvements of Processing Parameters of APIs Raval MK – PhD Thesis 2012
Department of Pharmaceutical Sciences, Saurashtra University, Rajkot 89
4.1 ANALYSIS OF METFORMIN HCl,
CHLORZOXAZONE AND EXCIPIENTS
4.1.1 MATERIALS
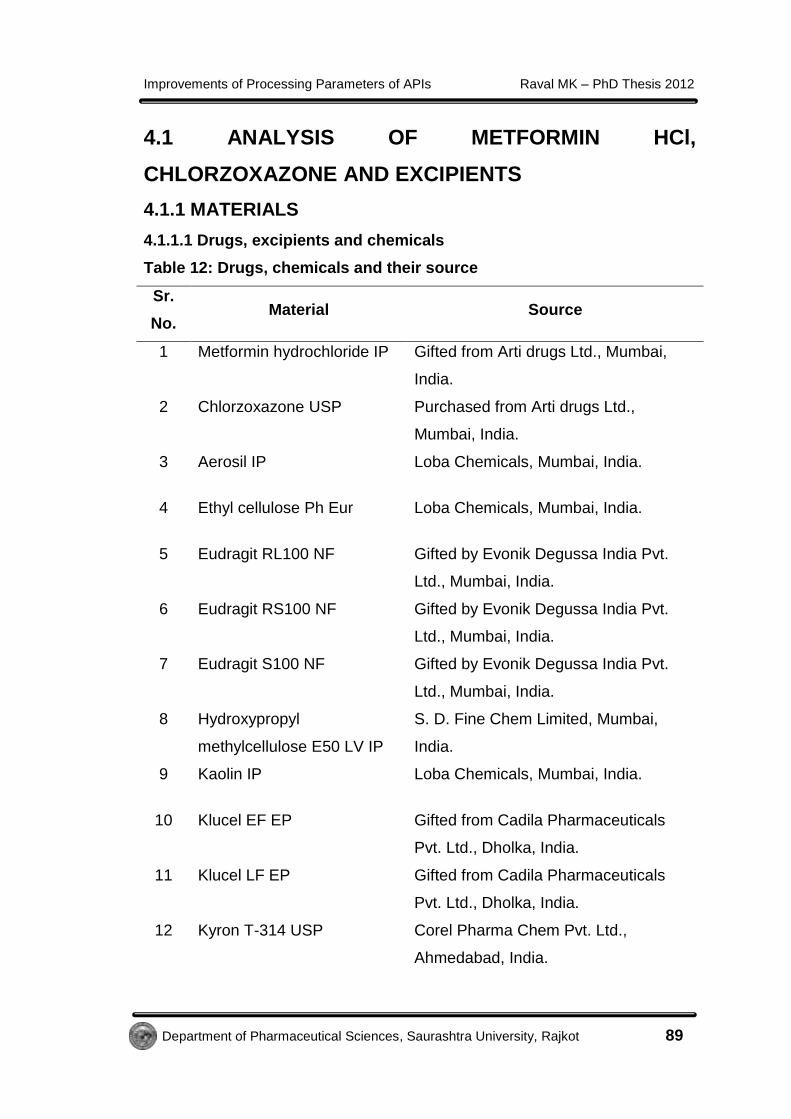
4.1.1.1 Drugs, excipients and chemicals
Table 12: Drugs, chemicals and their source
Sr.
No. Material Source
1 Metformin hydrochloride IP Gifted from Arti drugs Ltd., Mumbai,
India.
2 Chlorzoxazone USP Purchased from Arti drugs Ltd.,
Mumbai, India.
3 Aerosil IP Loba Chemicals, Mumbai, India.
4 Ethyl cellulose Ph Eur Loba Chemicals, Mumbai, India.
5 Eudragit RL100 NF Gifted by Evonik Degussa India Pvt.
Ltd., Mumbai, India.
6 Eudragit RS100 NF Gifted by Evonik Degussa India Pvt.
Ltd., Mumbai, India.
7 Eudragit S100 NF Gifted by Evonik Degussa India Pvt.
Ltd., Mumbai, India.
8 Hydroxypropyl
methylcellulose E50 LV IP
S. D. Fine Chem Limited, Mumbai,
India.
9 Kaolin IP Loba Chemicals, Mumbai, India.
10 Klucel EF EP Gifted from Cadila Pharmaceuticals
Pvt. Ltd., Dholka, India.
11 Klucel LF EP Gifted from Cadila Pharmaceuticals
Pvt. Ltd., Dholka, India.
12 Kyron T-314 USP Corel Pharma Chem Pvt. Ltd.,
Ahmedabad, India.

Improvements of Processing Parameters of APIs Raval MK – PhD Thesis 2012
Department of Pharmaceutical Sciences, Saurashtra University, Rajkot 90
13 Lactose (Anhydrous) Ph Eur Sigma-Aldrich, Mumbai, India.
14 Mannitol IP Himedia Laboratories, Mumbai, India.
15 Magnesium stearate IP Loba Chemicals, Mumbai, India.
16 Microcrystalline cellulose IP Loba Chemicals, Mumbai, India.
17 Neusilin US2 BP Gifted by Gangwal chemicals, Mumbai,
India.
18 Polyethylene glycol 400 NF Merck Pvt. Limited, Mumbai, India.
19 Polyethylene glycol 4000 IP Loba Chemicals, Mumbai, India.
20 Polyvinyl pyrrolidone K30 IP Sisco Research Laboratories Pvt. Ltd.,
Mumbai, India.
21 Purified talc IP S. D. Fine Chem Limited, Mumbai,
India.
22 Sodium chloride IP S. D. Fine Chem Limited, Mumbai,
India.
23 Sodium hydroxide pellets IP Molychem pvt. Ltd., Mumbai, India.
24 Sodium lauryl sulfate IP S. D. Fine Chem Limited, Mumbai,
India.
25 Sodium starch glycolate IP Loba Chemicals, Mumbai, India.
26 Span-80 BP S. D. Fine Chem Limited, Mumbai,
India.
27 Tween – 20 IP S. D. Fine Chem Limited, Mumbai,
India.
28 Acetone AR S. D. Fine Chem Limited, Mumbai,
India.
29 Carbon tetrachloride AR S. D. Fine Chem Limited, Mumbai,
India.

Improvements of Processing Parameters of APIs Raval MK – PhD Thesis 2012
Department of Pharmaceutical Sciences, Saurashtra University, Rajkot 91
30 Chloroform AR S. D. Fine Chem Limited, Mumbai,
India.
31 Dichloromethane AR Merck Pvt. Limited, Mumbai, India.
32 Ethanol (95%) AR Merck Pvt. Limited, Mumbai, India.
33 Ethyl acetate AR Merck Pvt. Limited, Mumbai, India.
34 Hexane AR Merck Pvt. Limited, Mumbai, India.
35 Light liquid paraffin AR Merck Pvt. Limited, Mumbai. India.
36 Methanol AR Merck Pvt. Limited, Mumbai, India.
37 n-Butanol AR Merck Pvt. Limited, Mumbai, India.
38 N, N-Dimethyl formamide
AR
Merck Pvt. Limited, Mumbai, India.
39 Octanol AR S. D. Fine Chem Limited, Mumbai,
India.
40 Petroleum ether AR Merck Pvt. Limited, Mumbai, India.
41 Propyl alcohol AR Merck Pvt. Limited, Mumbai, India.
42 Toluene AR Loba Chemie Pvt. Limited, Mumbai,
India.
Improvements of Processing Parameters of APIs Raval MK – PhD Thesis 2012
Department of Pharmaceutical Sciences, Saurashtra University, Rajkot 92
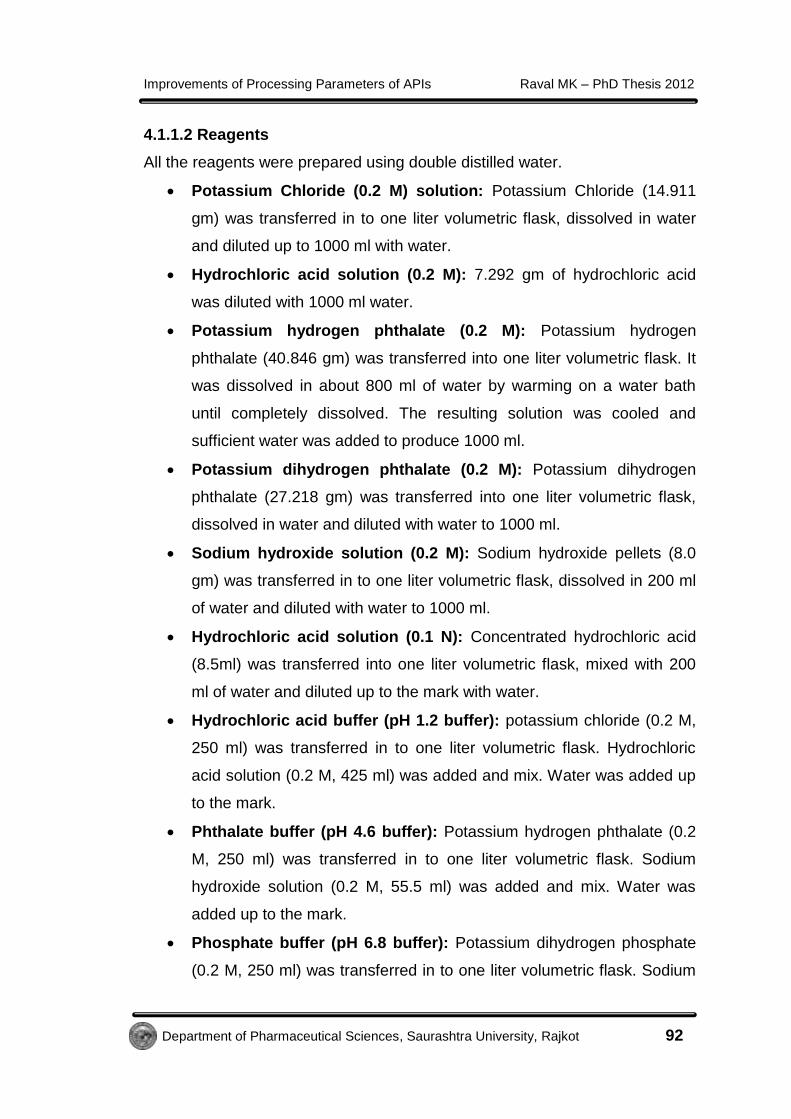
4.1.1.2 Reagents
All the reagents were prepared using double distilled water.
Potassium Chloride (0.2 M) solution: Potassium Chloride (14.911
gm) was transferred in to one liter volumetric flask, dissolved in water
and diluted up to 1000 ml with water.
Hydrochloric acid solution (0.2 M): 7.292 gm of hydrochloric acid
was diluted with 1000 ml water.
Potassium hydrogen phthalate (0.2 M): Potassium hydrogen
phthalate (40.846 gm) was transferred into one liter volumetric flask. It
was dissolved in about 800 ml of water by warming on a water bath
until completely dissolved. The resulting solution was cooled and
sufficient water was added to produce 1000 ml.
Potassium dihydrogen phthalate (0.2 M): Potassium dihydrogen
phthalate (27.218 gm) was transferred into one liter volumetric flask,
dissolved in water and diluted with water to 1000 ml.
Sodium hydroxide solution (0.2 M): Sodium hydroxide pellets (8.0
gm) was transferred in to one liter volumetric flask, dissolved in 200 ml
of water and diluted with water to 1000 ml.
Hydrochloric acid solution (0.1 N): Concentrated hydrochloric acid
(8.5ml) was transferred into one liter volumetric flask, mixed with 200
ml of water and diluted up to the mark with water.
Hydrochloric acid buffer (pH 1.2 buffer): potassium chloride (0.2 M,
250 ml) was transferred in to one liter volumetric flask. Hydrochloric
acid solution (0.2 M, 425 ml) was added and mix. Water was added up
to the mark.
Phthalate buffer (pH 4.6 buffer): Potassium hydrogen phthalate (0.2
M, 250 ml) was transferred in to one liter volumetric flask. Sodium
hydroxide solution (0.2 M, 55.5 ml) was added and mix. Water was
added up to the mark.
Phosphate buffer (pH 6.8 buffer): Potassium dihydrogen phosphate
(0.2 M, 250 ml) was transferred in to one liter volumetric flask. Sodium
Improvements of Processing Parameters of APIs Raval MK – PhD Thesis 2012
Department of Pharmaceutical Sciences, Saurashtra University, Rajkot 93
hydroxide solution (0.2 M, 112 ml) was added and mix. Water was
added up to the mark.
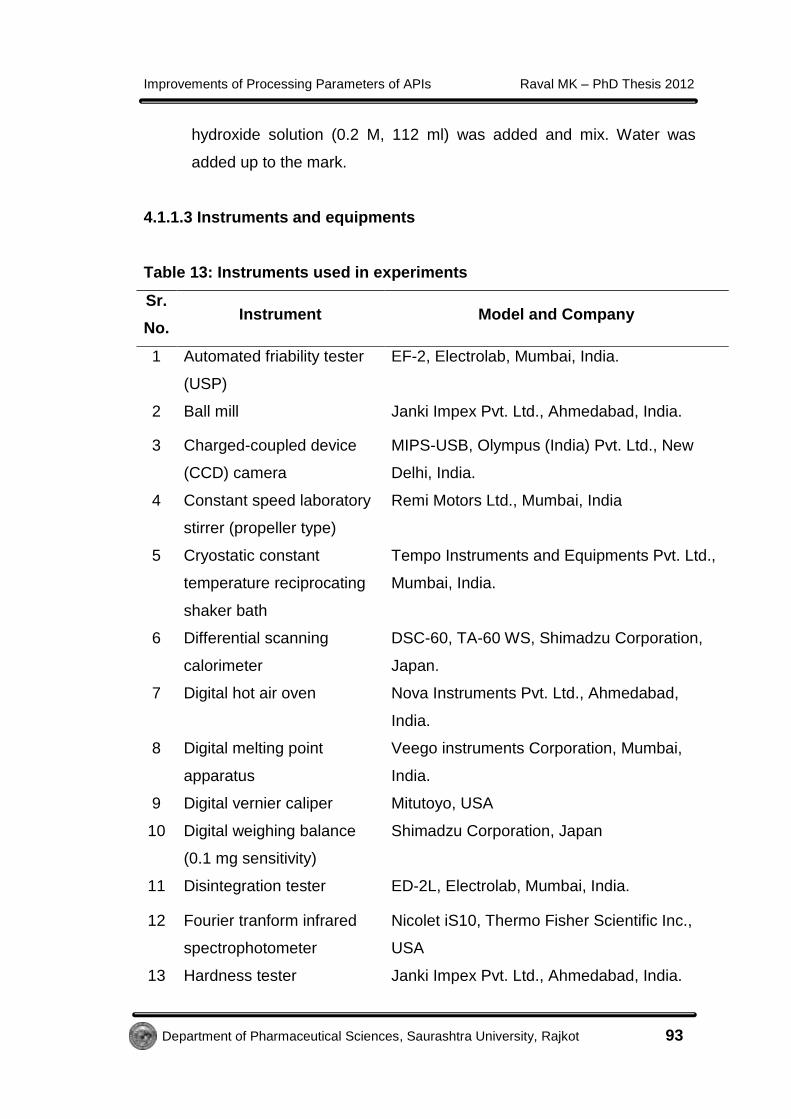
4.1.1.3 Instruments and equipments
Table 13: Instruments used in experiments
Sr.
No. Instrument Model and Company
1 Automated friability tester
(USP)
EF-2, Electrolab, Mumbai, India.
2 Ball mill Janki Impex Pvt. Ltd., Ahmedabad, India.
3 Charged-coupled device
(CCD) camera
MIPS-USB, Olympus (India) Pvt. Ltd., New
Delhi, India.
4 Constant speed laboratory
stirrer (propeller type)
Remi Motors Ltd., Mumbai, India
5 Cryostatic constant
temperature reciprocating
shaker bath
Tempo Instruments and Equipments Pvt. Ltd.,
Mumbai, India.
6 Differential scanning
calorimeter
DSC-60, TA-60 WS, Shimadzu Corporation,
Japan.
7 Digital hot air oven Nova Instruments Pvt. Ltd., Ahmedabad,
India.
8 Digital melting point
apparatus
Veego instruments Corporation, Mumbai,
India.
9 Digital vernier caliper Mitutoyo, USA
10 Digital weighing balance
(0.1 mg sensitivity)
Shimadzu Corporation, Japan
11 Disintegration tester ED-2L, Electrolab, Mumbai, India.
12 Fourier tranform infrared
spectrophotometer
Nicolet iS10, Thermo Fisher Scientific Inc.,
USA
13 Hardness tester Janki Impex Pvt. Ltd., Ahmedabad, India.

Improvements of Processing Parameters of APIs Raval MK – PhD Thesis 2012
Department of Pharmaceutical Sciences, Saurashtra University, Rajkot 94
(Monsanto-type)
14 Hydraulic pellet press/KBr
press
Technosearch Instruments, Mumbai, India.
15 Magnetic stirrer with hot
plate
Remi Laboratory Instruments, Mumbai, India.
16 Optical microscope MLX-DX, Olympus (India) Pvt. Ltd., New
Delhi, India.
17 pH-meter Janki Impex Pvt. Ltd., Ahmedabad, India.
18 Powder x-ray
diffractometer
Pan analytical X-ray Diffractometer, Philips,
Mumbai, India.
19 Scanning electron
microscope
JSM-6380LV Scanning Electron Microscope
and JEOL JFC-1600 Auto Fine Coater, JEOL,
UK.
20 Stability chamber Remi Laboratory Instruments, Mumbai, India.
21 Tap density tester (USP) ETD-1020, Electrolab, Mumbai, India.
22 USP dissolution test
apparatus (Type I and II)
TDT 06P, Electrolab, Mumbai, India.
23 UV-visible
spectrophotometer
Pharmaspec - 1700, Shimadzu Corporation,
Japan.
Improvements of Processing Parameters of APIs Raval MK – PhD Thesis 2012
Department of Pharmaceutical Sciences, Saurashtra University, Rajkot 95
4.1.2 METHOD OF ANALYSIS
4.1.2.1 Introduction
This chapter illustrates development of simple UV spectrophotometric
method for analysis of Metformin HCl and Chlorzoxazone. This chapter also
illustrates the simple UV spectrophotometric analysis of excipients used in the
study in order to confirm their interference in the analysis of drug, if any.
4.1.2.2 Experimental
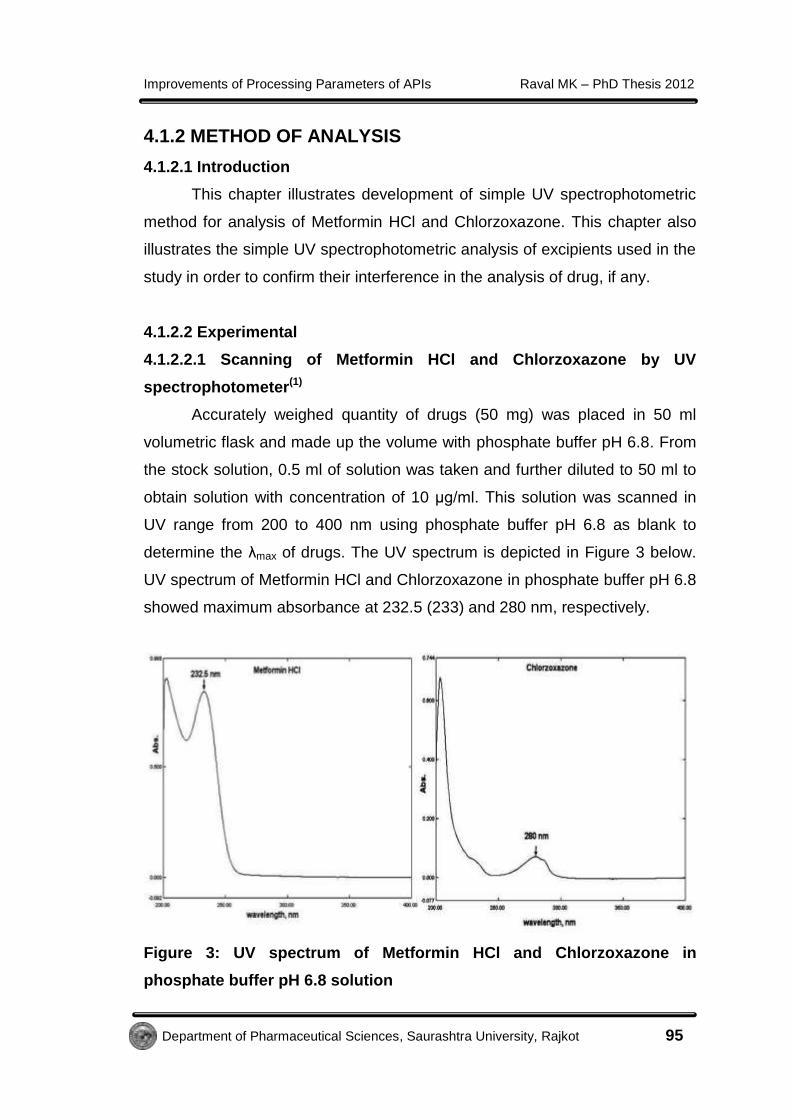
4.1.2.2.1 Scanning of Metformin HCl and Chlorzoxazone by UV
spectrophotometer(1)
Accurately weighed quantity of drugs (50 mg) was placed in 50 ml
volumetric flask and made up the volume with phosphate buffer pH 6.8. From
the stock solution, 0.5 ml of solution was taken and further diluted to 50 ml to
obtain solution with concentration of 10 μg/ml. This solution was scanned in
UV range from 200 to 400 nm using phosphate buffer pH 6.8 as blank to
determine the λmax of drugs. The UV spectrum is depicted in Figure 3 below.
UV spectrum of Metformin HCl and Chlorzoxazone in phosphate buffer pH 6.8
showed maximum absorbance at 232.5 (233) and 280 nm, respectively.
Figure 3: UV spectrum of Metformin HCl and Chlorzoxazone in
phosphate buffer pH 6.8 solution
Improvements of Processing Parameters of APIs Raval MK – PhD Thesis 2012
Department of Pharmaceutical Sciences, Saurashtra University, Rajkot 96
4.1.2.2.2 Calibration curve of Metformin HCl and Chlorzoxazone
From the above stock solution (100 µg/ml), appropriate aliquots were
taken into 10 ml volumetric flasks and made up with phosphate buffer pH 6.8
to obtain the desired concentration range (1 to 5 µg ml-1 for Metformin HCl
and 5 to 25 µg ml-1 for Chlorzoxazone). The absorbance of these solutions
was measured at 233 nm for Metformin HCl and 280 nm for Chlorzoxazone
using phosphate buffer pH 6.8 as blank. This procedure was performed in
triplicate to validate the calibration curve. A calibration graph was constructed
by plotting absorbance at selected wavelength versus concentrations of drug
solutions.
The calibration data for Metformin HCl and Chlorzoxazone are given in
Table 14 and 15, respectively. Calibration curve for Metformin HCl and
Chlorzoxazone in phosphate buffer pH 6.8 is shown in Figure 4 and 5,
respectively. The regression equation from calibration curve for Metformin HCl
and Chlorzoxazone was found to be y=0.200x (R2=0.999) and y=0.040x
(R2=0.998), respectively.

Improvements of Processing Parameters of APIs Raval MK – PhD Thesis 2012
Department of Pharmaceutical Sciences, Saurashtra University, Rajkot 97
Table 14: Data for calibration curve of Metformin HCl in phosphate buffer
pH 6.8 solution
* Each reading is an average of three determinations
0 1 2 3 4 50.0
0.5
1.0 Y=0.200X (R2=0.999)
Conc., g/ml
Ab
s.
Figure 4: Calibration curve of Metformin HCl in phosphate buffer pH 6.8
solution at 233nm
Sr. No. Concentration
(µg/ml)
Absorbance at 233 nm
Abs ± S.D.*
1 0 0.000 ± 0.000
2 1 0.205 ± 0.005
3 2 0.402 ± 0.004
4 3 0.589 ± 0.01
5 4 0.806 ± 0.005
6 5 1.01 ± 0.013

Improvements of Processing Parameters of APIs Raval MK – PhD Thesis 2012
Department of Pharmaceutical Sciences, Saurashtra University, Rajkot 98
Table 15: Data for calibration curve of Chlorzoxazone in phosphate
buffer pH 6.8 solution
* Each reading is an average of three determinations
0 5 10 15 20 250.0
0.2
0.4
0.6
0.8
1.0Y=0.040X (R
2=0.998)
Conc., g/ml
Ab
s.
Figure 5: Calibration curve of Chlorzoxazone in phosphate buffer pH 6.8
solution at 280 nm
4.1.2.2.3 Scanning of excipients by UV spectrophotometry (2)
A standard stock solution of lactose anhydrous, PVP K30, ethyl
cellulose, HPMC E50LV, PEG 400 and PEG 4000 was prepared separately
by accurately dissolving 25 mg of excipients in 25 ml volumetric flask and
volume was made up with phosphate buffer pH 6.8 solution. From this
standard stock solution, aliquote was pipetted and diluted to 10 ml (10 µg/ml).
UV-scan was taken between the wavelengths of 200- 400 nm using
phosphate buffer pH 6.8 solution as blank. This was carried out in order to
establish compatibility with APIs under consideration.
Sr.
No.
Concentration,
(µg/ml)
Absorbance
± S.D.*
Sr.
No.
Concentration,
(µg/ml)
Absorbance
± S.D.*
1 0 0.000 ± 0.000 4 15 0.295 ± 0.006
2 5 0.075 ± 0.005 5 20 0.402 ± 0.004
3 10 0.205 ± 0.005 6 25 0.496 ± 0.008

Improvements of Processing Parameters of APIs Raval MK – PhD Thesis 2012
Department of Pharmaceutical Sciences, Saurashtra University, Rajkot 99
Scan of excipients indicated no interference of any excipients with the
max of Metformin HCl and Chlorzoxazone (Figure 6).
Figure 6: UV spectrum of A) lactose anhydrous, B) PVP K30, C) HPMC
E50LV, D) ethyl cellulose, E) PEG 400 and F) PEG 4000 in phosphate
buffer pH 6.8 solution

Improvements of Processing Parameters of APIs Raval MK – PhD Thesis 2012
Department of Pharmaceutical Sciences, Saurashtra University, Rajkot 100
4.2 GENERAL METHODS AND EVALUATIONS
4.2.1 CO-CRYSTALLIZATION
Pharmaceutical cocrystals made from an active pharmaceutical
ingredient and coformer(s) are solid at ambient conditions. The molecules are
bonded together by interactions which are not covalent or ionic bonds.(3)
Cocrystals results enhancement of physicochemical properties through
modifying the original solid forms.(4, 5) Carbamazepine–saccharin cocrystals
have been one of the best examples for comparison of stability, dissolution
and bioavailability with marketed product. The modification of its melting point,
mechanical properties, stability, solubility and dissolution rate was also
demonstrated.(6-8)
Thus, in the present work, cocrystals of drug have been attempted to
improve their physico-chemical and physico-mechanical properties.
4.2.1.1 Methods of preparation of Cocrystals
Cocrystals can be prepared by solvent and solid based methods. The
solvent-based methods involve slurry conversion, solvent evaporation, cooling
crystallization and precipitation. The solid based methods involve wet
grinding; solvent-assisted grinding and sonication (applied to either to wet or
dry solid mixtures).(9) However, in our experiments, we have utilized solvent
based methods.
Solution co-crystallization
For solution co-crystallization, two components are desired to have similar
solubility; otherwise the least soluble component will precipitate out
exclusively. However similar solubility alone will not guarantee success. The
ability of a molecule to participate in intermolecular interactions obviously
plays a critical role.(10)
Deep freezing: In deep freezing method, co-crystals were prepared in
the presence of coformer(s) by taking the drug: coformer(s) in different ratios
Improvements of Processing Parameters of APIs Raval MK – PhD Thesis 2012
Department of Pharmaceutical Sciences, Saurashtra University, Rajkot 101
in different solvents as well as combination of different polarity solvents. After
dissolving the drug as well as coformer(s) in the solvent(s) and making the
solution clear, it was filled in a glass bottle having screw cap and kept in a
deep freezer at around 4 to 5 C after proper labeling. Slow agitation was
continued to encourage the crystallization. The nuclei were separated and
acted as seeds for further crystal growth. The time for crystallization was long.
The crystals from the solution were separated and dried at room temperature.
The surface moisture was removed by storing the samples in the desiccators
containing self indicating silica crystals for 1-2 weeks. One batch of optimized
sample of cocrystal was also kept for three months stability study in screw
capped container. The drug was also recrystallized from solvent (control
batch) by maintaining the same above experimental conditions without
dissolving coformer(s) in the solution.
Low Temperature Cooling: Samples were prepared by providing
continuous and slow cooling at 12-15 C to the solutions containing API and
coformer(s) in different ratios with slow agitation. The crystals generated were
separated and dried for overnight at room temperature. The surface moisture
was removed by storing the sample in the desiccators containing self
indicating silica crystals for 1 to 2 weeks.
Solvent evaporation: Samples were prepared by providing continuous
and slow heating to the solutions containing drug and coformer(s) in different
ratios. The crystals obtained were dried for overnight at room temperature.
The surface moisture was removed by storing the sample in the desiccators
containing self indicating silica crystals for 1 to 2 weeks.
Anti-solvent: Good solvents and anti-solvents were identified based
on a random solubility study. A crystallization protocol was developed where
the drug was dissolved in the good solvents and then poured into anti-
solvents which were kept either at room temperature or in cold condition
containing coformer(s) in different ratios with stirring to encourage the
Improvements of Processing Parameters of APIs Raval MK – PhD Thesis 2012
Department of Pharmaceutical Sciences, Saurashtra University, Rajkot 102
crystallization. Stirring was continued till the crystals started precipitating out.
The generated crystals from the solution were separated and dried at room
temperature. The surface moisture was removed by storing the samples in the
desiccators containing self indicating silica crystals for 1-2 weeks.
Evaporation at room temperature: In room temperature evaporation
(no stress conditions), samples were prepared by keeping the solutions of
drug and coformer(s) combination in different ratios in different solvents at
room temperature for 8-10 days. The crystals from the solution were
separated and dried at room temperature for two days. The surface moisture
was removed by storing the samples in the desiccators containing self
indicating silica crystals for 1 to 2 weeks.
Preparation of drug-coformer physical mixture: The drug-coformer
physical mixture was prepared simply by admixing both in optimized ratio and
stored in desiccator in a screw cap glass bottle.
4.2.2 PELLETIZATION
Pelletization is an agglomeration process that converts fine powders or
granules of bulk drugs and excipients in to small, free flowing, spherical or
semi-spherical units, referred to as pellets.(11, 12) Pellets ensure improved flow
properties and flexibility in formulation development and manufacture.(13)
4.2.2.1 Emulsion solvent diffusion(14, 15)
The pellets were prepared by non-aqueous emulsion solvent diffusion
technique. The excipients (in different ratios) were co-dissolved/dispersed in
internal or external phase (good solvent) and drug was dissolved in internal
phase. The resulting solution was emulsified within the poor solvent and
continuously agitated using mechanical stirrer. The counter-diffusion of the
poor solvent into the droplet induced crystallization of the drug within the
droplet. The prepared pellets were separated by keeping the filter paper on a
sieve and poured the solution containing pellet on it. The collected pellets
Improvements of Processing Parameters of APIs Raval MK – PhD Thesis 2012
Department of Pharmaceutical Sciences, Saurashtra University, Rajkot 103
were washed three to four times, to remove residual solvent. Finally, pellets
were dried (air dried) for 24 hrs and stored in desiccators. The surface
moisture was removed by storing the samples in desiccators containing self
indicating silica crystals for 1-2 weeks.
4.2.3 CRYSTALLO-CO-AGGLOMERATION (CCA)
Crystallo-co-agglomeration is the particle engineering technique, which
aggregates crystals of drugs in the form of small spherical particles using
excipients and solvents to develop an intermediate material with improved
micromeritic and mechanical properties, solubility and dissolution.(16-19) The
agglomeration is performed using bridging liquid.(20) CCA technique has been
designed to obtain directly compressible agglomerates of low dose, high
dose, single, two, or more drugs in combination with or without diluent drugs
having poor compressibility.(21) The method also enables to formulate
agglomerates containing two drugs or a low dose/poorly compressible drug in
combination with diluent.(16, 17, 22, 23) The rate of dissolution of drug from the
agglomerates or compacts thereof can be improved by using suitable
additives during the process of formation of agglomeration.(18, 24, 25) Moreover,
agglomerates obtained by this technique can be used as directly
compressible tablet intermediates and/or spheres to be encapsulated.
4.2.3.1 Selection of good and poor solvent for drug
It was performed to select good solvent and poor solvent for drug.
Various solvents were selected to cover a range of polarity for this study. 5 ml
of each solvent was taken and the excess amount of drug was dissolved in it.
These saturated solutions were then kept for 24 h in the cryostatic constant
temperature reciprocating shaker bath at room temperature with constant
shaking. The study was repeated for three times in the same manner.
4.2.3.2 Method of preparation of CCA
On the basis of solubility study, good solvent and bad solvent was
identified and selected for the preparation of crystallo-co-agglomerates. A

Improvements of Processing Parameters of APIs Raval MK – PhD Thesis 2012
Department of Pharmaceutical Sciences, Saurashtra University, Rajkot 104
crystallization protocol was designed in which the drug and/or excipient were
dissolved in good solvent and added drop wise to the bad solvent which was
being stirred by using four blade mechanical stirrers. Here, the good solvent
also acted as a bridging liquid. The stirring was continued for some time. The
stirring was stopped when the overall mixture appeared clear at the top and
the particles settled down. The agglomerates generated were filtered and
dried at room temperature. The surface moisture was removed by storing the
samples in the desiccators containing self indicating silica crystals for 1-2
weeks and stored in a air tight screw cap glass bottle. The CCA of drug were
prepared by maintaining the above experimental conditions without adding
any excipient(s) (control batch) in the solution.
Figure 7: Steps for preparing CCA

Improvements of Processing Parameters of APIs Raval MK – PhD Thesis 2012
Department of Pharmaceutical Sciences, Saurashtra University, Rajkot 105
4.2.4 CO-GRINDING AND AMORPHIZATION
The bioavailability of poorly solubility drug is often related to the
primary particle size of the drug. For an orally administered drug, to get into
systemic circulation, it must be sufficiently soluble to dissolve in the gastro-
intestinal fluid.(26) The solubility of a compound in the amorphous form is
higher than in the more stable crystalline form because the Gibbs free energy
is higher.(27) The dissolution rate of an amorphous compound is improved
relative to the crystalline form and it can be further improved if the amorphous
compound is dispersed in a hydrophilic polymer. Particle size reduction by
milling without using any organic solvent is one of the approaches for
improving solubility or dissolution rate of poorly water soluble drug.(28)
Amorphization of drug in co-grinding process has been recognized as one of
the most effective way to improve dissolution behavior.(29, 30) The
pharmaceutical processes like grinding can generate defect (disorder) in the
crystal structure and may improve compression characteristics and
dissolution.(31, 32) Grinding approaches have been shown to potentially result
in formation of regions of drug/excipient miscibility.(33) Hydrogen bonding is
widely recognized as an important mechanism to increase amorphous
stability.(34)
4.2.4.1 Preparation of coground samples(35)
A powder mixture comprising of drug and carrier in specific weight ratio
was milled using a ball mill for an extended period of time till dissolution rate
enhanced. The speed of the cylindrical jar was maintained, in a way to allow
significant attrition with some impact. Milling was performed in cold room to
avoid the effect of heat generation. The milled material was sieved through
mesh no. 30 (600 μm opening).
To ascertain the influence of method or carrier or both on the
dissolution rate, drug alone was ground for extended period of time. All
samples were stored in glass vials at room temperature until used for further
analysis. One batch from optimized sample was also kept for three months
stability study in screw capped container.(36, 37)

Improvements of Processing Parameters of APIs Raval MK – PhD Thesis 2012
Department of Pharmaceutical Sciences, Saurashtra University, Rajkot 106
4.2.5 EVALUATION PARAMETERS
4.2.5.1 Packability and flow parameters
For the rheological characterization of the prepared samples; angle of
repose, carr’s index and hausner’s ratio were measured. Angle of repose was
determined using fixed funnel method.(38, 39) Percentage compressibility (carr’s
Index) and hausner’s ratio were calculated after tapping of fixed amount of
sample using Electrolab tap density tester (USP).(40) Angle of repose () of the
powder material was calculated using formula,
Where, h is height of the pile, and r is radius of the pile(41)
The bulk density (ρb) was the quotient of weight to the volume of the
sample at zero tap. Tapped density (ρt) was determined as the quotient of
weight of the sample to the volume after tapping a measuring cylinder for 500
times from a height of 2 inch. The Carr’s Index (percentage compressibility -
CI) was calculated as one hundred times the ratio of the difference between
tapped density and bulk density to the tapped density.
Hausner’s ratio (HR) was calculated using measured values of bulk density
and tapped density as follows:
Packability parameters like a (compressibility, or amount of
densification due to tapping), 1/b (cohesiveness, or how fast/easily the final
packing state was achieved) and K (Kuno’s constant was determined directly
putting the values of densities) were calculated using Kawakita and Kuno’s
equations at taps 10, 30, 50, 100, 200 and 300.(42-46) The values of ‘a’ and ‘b’
were calculated from the slope and intercept of the linear plot of N/C Vs N,
respectively.

Improvements of Processing Parameters of APIs Raval MK – PhD Thesis 2012
Department of Pharmaceutical Sciences, Saurashtra University, Rajkot 107
Kawakita equation(47):
Here, where, Y = N/C, Slope = N/a and Intercept = 1/ab, Where,
0
0 )(
V
VVC n
Kuno’s equation:
Where, N is number of tapping
V0 and Vn are initial volume and volume after ‘n’ no. of taps
q0, qn and qt are the initial density, density at ‘n’ taps and density at infinite
taps respectively.
a, b and K are the constants representing flowability and packability of powder
under mechanical force.
The smaller values of parameters ‘a’ and ‘1/b’ in Kawakita equation for
the samples indicated higher packabilities of the sample compared to pure
drug. Higher values of parameter ‘K’ in Kuno’s equation for sample, was an
indication of marked improvement in compressibility and packability attributed
to the much higher rate of their packing processes than that of pure drug due
to sphericity of particles.(47)
4.2.5.2 Capillary melting point
Sample was filled in one end sealed capillary and melting range was
determined on digital melting point apparatus (accuracy ± 0.1 C).
4.2.5.3 Microscopic determination and surface topography
Shape and size of the samples were observed under the optical
microscope with 10X magnification and photomicrographs were taken using
CCD camera for comparing morphological changes in prepared samples

Improvements of Processing Parameters of APIs Raval MK – PhD Thesis 2012
Department of Pharmaceutical Sciences, Saurashtra University, Rajkot 108
compared to pure drug. The preliminary observation of the shape and surface
of the prepared samples was done and the batches for the further study were
selected.
4.2.5.4 Drug loading efficiency and % yield(48)
Drug loading efficiency is the ratio of experimentally measured drug
content to the theoretical value, expressed as percentage (%).(46)
Accurately weighed quantity of prepared samples were dissolved in
little quantity of a suitable solvent in which it was easily soluble and made the
volume to 50 ml in a volumetric flask. These solutions were appropriately
diluted and drug content was determined by UV spectrophotometer using the
same solvent as blank. The experimental drug content was calculated using
calibration equation. The % yield of sample was calculated using formula
100% polymeranddrugofweighttotal
sampleofweighttotalYield
4.2.5.5 Micromeritic study
Size analysis was performed using optical microscopy method. The
size and size distribution of particles were counted using eye piece
micrometer which was previously calibrated using stage micrometer. Particle
size was determined by taking longest dimension of the particle for a
minimum of 100 particles. Mean aspect ratio (AR), defined as the ratio of
length (longest dimension from edge to edge of a particle oriented parallel to
the ocular scale) to the width (the longest dimension of the particle measured
at right angles of the length) of the particle, was calculated.(49-51) The size of
300 randomly selected particles from prepared batch was measured and
appropriate geometric mean diameter (dg) was calculated.(41)
4.2.5.6 Sphericity determination
Shape factor (SF) and circularity factor (CF) for the prepared sample
were obtained from the area (A) and perimeter (P’) of the particle.(52) The
photomicrographs of the particles were taken at 40X using CCD camera and

Improvements of Processing Parameters of APIs Raval MK – PhD Thesis 2012
Department of Pharmaceutical Sciences, Saurashtra University, Rajkot 109
tracings of the enlarged photomicrographs were used for the measurement of
area and perimeter.
where P’ = 2π (A/π)½
4.2.5.7 Crushing strength
The crushing strength of the prepared sample was determined by
mercury load cell method using 10 ml hypodermic glass syringe (Figure 8).(53)
The particle was placed inside the syringe and mercury was added through
hollow syringe tube. The total weight of tube with mercury, at the stage where
particle broke, gave the measure of crushing strength of that particle.
Figure 8: Crushing strength measuring device
4.2.5.8 Heckel Plot
Accurately weighed quantity of prepared samples was compressed at
the constant compression at different pressures.(18) The punch and die were
lubricated using 1 % w/v dispersion of magnesium stearate in acetone. The
Improvements of Processing Parameters of APIs Raval MK – PhD Thesis 2012
Department of Pharmaceutical Sciences, Saurashtra University, Rajkot 110
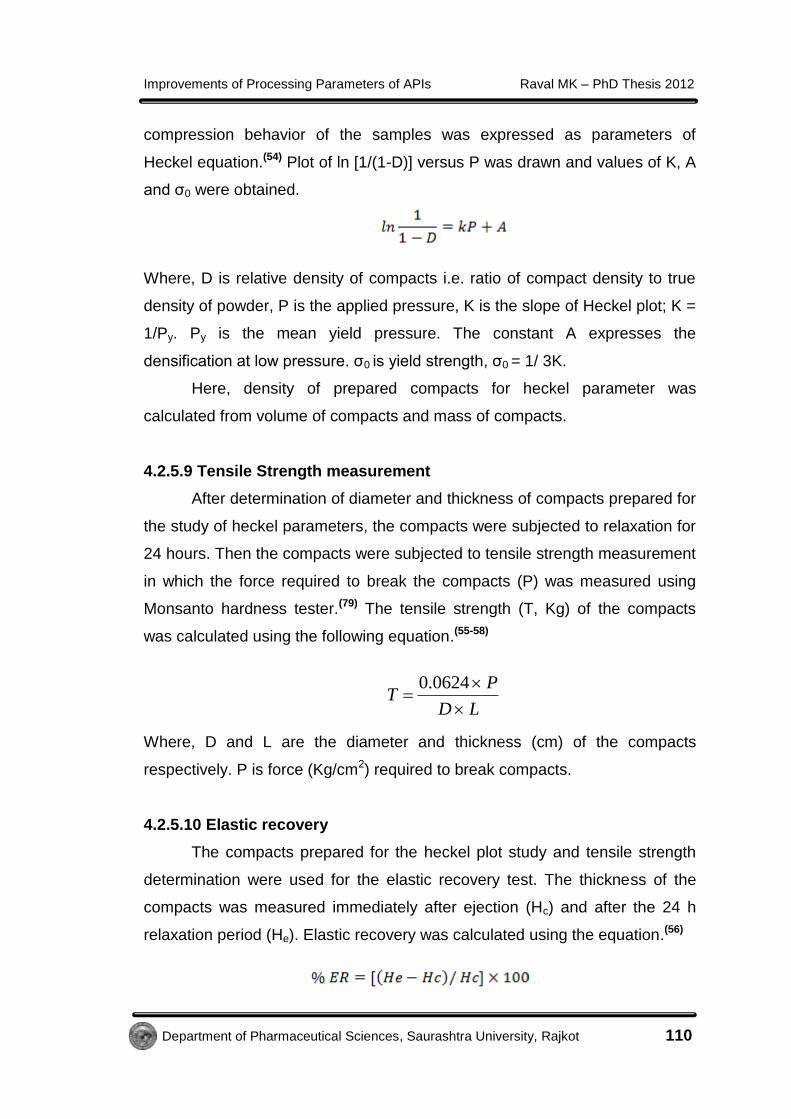
compression behavior of the samples was expressed as parameters of
Heckel equation.(54) Plot of ln [1/(1-D)] versus P was drawn and values of K, A
and σ0 were obtained.
Where, D is relative density of compacts i.e. ratio of compact density to true
density of powder, P is the applied pressure, K is the slope of Heckel plot; K =
1/Py. Py is the mean yield pressure. The constant A expresses the
densification at low pressure. σ0 is yield strength, σ0 = 1/ 3K.
Here, density of prepared compacts for heckel parameter was
calculated from volume of compacts and mass of compacts.
4.2.5.9 Tensile Strength measurement
After determination of diameter and thickness of compacts prepared for
the study of heckel parameters, the compacts were subjected to relaxation for
24 hours. Then the compacts were subjected to tensile strength measurement
in which the force required to break the compacts (P) was measured using
Monsanto hardness tester.(79) The tensile strength (T, Kg) of the compacts
was calculated using the following equation.(55-58)
LD
PT
0624.0
Where, D and L are the diameter and thickness (cm) of the compacts
respectively. P is force (Kg/cm2) required to break compacts.
4.2.5.10 Elastic recovery
The compacts prepared for the heckel plot study and tensile strength
determination were used for the elastic recovery test. The thickness of the
compacts was measured immediately after ejection (Hc) and after the 24 h
relaxation period (He). Elastic recovery was calculated using the equation.(56)

Improvements of Processing Parameters of APIs Raval MK – PhD Thesis 2012
Department of Pharmaceutical Sciences, Saurashtra University, Rajkot 111
4.2.5.11 Aqueous solubility study
The solubility was determined in different solvents(59) to correlate
solubility with dissolution and bioavailability. Solubility studies were performed
by adding an excess amount of samples to 10 ml of solvents in specific
gravity bottles until the solutions became saturated at room temperature.
These specific gravity bottles were shaken for 8 h at 25 ± 1 C by keeping in a
cryostatic constant temperature reciprocating shaker bath. The same
procedure was also followed for control batch from solvent without adding any
excipients. The bottles were then opened and solutions were filtered with the
help of whattman filter paper no. 41. The absorbance of the solution was
measured at max of drug by diluting with suitable solvent using same media
as blank.(47) Concentration of drug was calculated by fitting value of
absorbance read in the linear regression equation for the calibration curve of
API at max of drug. All determinations were performed in triplicate.
4.2.5.12 Differential scanning calorimetry(60)
Thermograms of the pure drug and prepared samples were performed
using DSC-60 (Shimadzu, Tokyo, Japan) calorimeter to study the thermal
behavior of drug and prepared samples. The instrument comprised of
calorimeter (DSC 60), flow controller (FCL60), thermal analyzer (TA 60WS)
and operating software (TA 60). The samples were heated in hermetically
sealed aluminum pans under air atmosphere. Empty aluminum pan was used
as a reference.
4.2.5.13 Fourier transform infra-red (FT-IR) spectroscopy(61)
Infrared spectra of pure drug and prepared samples were recorded
using infrared spectrophotometer (FTIR 8400 spectrophotometer, Shimadzu,
Japan). The samples were dispersed in KBr and compressed into disc/pellet
by application of pressure. The pellets were placed in the light path for
recording the IR spectra. The spectrum was recorded.

Improvements of Processing Parameters of APIs Raval MK – PhD Thesis 2012
Department of Pharmaceutical Sciences, Saurashtra University, Rajkot 112
4.2.5.14 Powder x-ray diffractometry(50, 62, 63)
The x-ray powder diffraction patterns of pure drug and optimized
samples were recorded using PANalytical diffractometer system (Xpert pro
PW 30-40/60) with a copper target and scintillation counter detector (voltage
40 kV; current 30 mA; scanning speed 0.05°/sec). The sample holder was
non-rotating and temperature of acquisition was room temperature. The
diffraction pattern was analyzed in a specific 2 range.(64)
4.2.5.15 Scanning electron microscopy(65)
The shape and surface morphology were observed using scanning
electron microscope (JEOL, JSM 5610 LV). The samples were observed at
various magnifications to have an idea about the effect of various additives on
surface treatment (morphology) and particle size.
4.2.6 PREPARATION OF DOSAGE FORM AND THEIR
EVALUATION
4.2.6.1 Preparation of directly compressible tablets of API and prepared
samples
Formulation excipients were selected on the basis of preliminary tests
which demonstrated no interference of these excipients at the max of API.
Tablets containing equivalent amount of API were made by direct
compression using different formulation excipients of directly compressible
type. Samples used for tableting were having similar size range of particles.
The material for each tablet was weighed (containing equivalent amount of
API), introduced manually into the die and compressed in tablet machine. The
compaction surfaces were lubricated with 2% w/w magnesium stearate in
acetone before compaction. The blend was compressed on an eight-station
rotary tablet machine (Karnawati Engineering Ltd., India) to obtain tablets of
required hardness and thickness. The tablets were studied in three replicates.
The compacts were ejected and stored in screw-capped bottles for 24 h
before using, to allow for possible hardening and elastic recovery. The
Improvements of Processing Parameters of APIs Raval MK – PhD Thesis 2012
Department of Pharmaceutical Sciences, Saurashtra University, Rajkot 113
compacts were also taken for in-process and finished product evaluation
tests. The same technique was applied for preparation of tablets of API as
well as tablets of control batch.
4.2.6.2 Evaluation parameters for prepared directly compressible tablets
4.2.6.2.1 Thickness and diameter of the tablets
The thickness and diameter of individual tablet was measured with a
vernier caliper, which permitted accurate measurements. The study was
conducted for 20 tablets and average result was considered.
4.2.6.2.2 Weight variation test of the tablets
The USP has provided limits for the average weight of uncoated
compressed tablets. Twenty tablets were weighed individually and the
average weight was calculated.
4.2.6.2.3 Tablet friability test
Tablet friability was measured by using Roche friabilator (Electrolab,
Mumbai). Ten tablets were weighed and placed in the apparatus where they
were exposed to rolling and repeated shocks as they fall 6 inches in each turn
within the apparatus. After four minutes of this treatment or 100 revolutions,
tablets were weighed and compared with the initial weight. The loss due to
abrasion was a measure of the tablet friability.
4.2.6.2.4 Tablet hardness test
Tablet hardness was measured using Pfizer hardness tester. The
instrument measured the force required to break the tablet when force
generated by a coil spring was applied diametrally to the tablet. The test was
done for three tablets from each samples and average was considered.
4.2.6.2.5 Tablet disintegration test
The disintegration test is a measure of the time required under a given
set of conditions for a group of tablets to disintegrate into particles which will

Improvements of Processing Parameters of APIs Raval MK – PhD Thesis 2012
Department of Pharmaceutical Sciences, Saurashtra University, Rajkot 114
pass through a 10 # screen. The disintegration test was carried out using the
tablet disintegration tester (Electrolab, Mumbai) which consisted of a basket
rack holding 6 plastic tubes, opened at the top and bottom, the bottom of the
tube was covered by a 10 # screen. The basket was immersed in one liter
beaker containing distilled water held at 37 ± 1 oC. As the basket was moved
up and down, tablets kept in the tubes were started disintegrating. The time
required for disintegration of tablet was measured in accordance with the
United States Pharmacopoeia 29.(66)
4.2.7 DISSOLUTION AND KINETIC STUDY
4.2.7.1 In vitro dissolution of prepared samples and dosage form
A USP dissolution test apparatus were used to monitor the dissolution
profiles to evaluate the influence of process and excipients on drug release.
The dissolution medium was equilibrated to 37 ± 0.5 °C. Peddles/ baskets
were rotated at predetermined RPM. From the dissolution flask, 5 ml samples
were withdrawn at selected time intervals(64) and the concentrations of API in
the samples were determined by UV spectrophotometer at max of drug by
diluting with suitable solvent using same media as blank. The mass of API
dissolved was calculated from the concentration after correcting for the
change in volume of the dissolution medium. Concentration of drug was
calculated by fitting value of absorbance read in the linear regression equation
for the calibration curve of drug at its max. All determinations were performed
in triplicate.
4.2.7.2 Dissolution parameters
The dissolution data was analyzed by model independent parameters
calculated at different time intervals, such as dissolution percent (DP),
dissolution efficiency (%DE) and time to release 50% of the drug (t50%). DP
at different time interval and t50% can be obtained from percent dissolution vs
time profile/data.(67)
The concept of dissolution efficiency (%DE) was proposed by Khan
and Rhodes(67) in 1975. Dissolution efficiency is a parameter for the

Improvements of Processing Parameters of APIs Raval MK – PhD Thesis 2012
Department of Pharmaceutical Sciences, Saurashtra University, Rajkot 115
evaluation of in vitro dissolution data. Dissolution efficiency is defined as the
area under curve (AUC) up to a certain time‘t’ expressed as percentage of the
area of the rectangle described by 100% dissolution in the same time.(68)
100.
%0 100
t
ty
dtyDE
4.2.7.3 Statistical analysis of the dissolution profiles(61)
Model independent mathematical approach proposed by Moore and
Flanner (1996)(69) for calculating a similarity factor ƒ2 was used for comparison
between dissolution profiles of different samples. The similarity factor ƒ2 is a
measure of similarity in the percentage dissolution between two dissolution
curves and is defined by following equation:
1001
1log50
5.0
2
12 ttt
n
t
TRwn
f
Where n is the number of withdrawal points, Rt is the percentage dissolved of
reference at the time point t and T is the percentage dissolved of test at the
time point t. A value of 100% for the similarity factor (f2) suggests that the test
and reference profiles are identical. Values between 50 and 100 indicate that
the dissolution profiles are similar whilst smaller values imply an increase in
dissimilarity between release profiles.
In order to understand difference in dissolution rate of pure drug and
prepared samples, obtained dissolution data were fitted into following
equation. The same calculations were also applied for prepared dosage
forms.
M
MtMDT
n
i
mid
n
i
invitro
1
1
Here, i is dissolution sample number, n is number of dissolution times, t and
tmid is time at the midpoint between times ti and ti-1, and M is the amount of

Improvements of Processing Parameters of APIs Raval MK – PhD Thesis 2012
Department of Pharmaceutical Sciences, Saurashtra University, Rajkot 116
drug dissolved (mcg) between times ti and ti-1. MDT reflects the time for the
drug to dissolve and is the first statistical moment for the cumulative
dissolution process that provides an accurate drug release rate. It is accurate
expression for drug release rate. A higher MDT value indicates greater drug
retarding ability.
4.2.8 STABILITY STUDY(36, 37)
The optimized batch was placed in 20 ml borosilicate glass ampoule.
The mouth of the ampoule was closed tightly with aluminium foil to prevent
the access of air from the atmosphere to the sample inside the ampoules. Six
such samples were stored at 40 °C and 75% relative humidity (RH) for 3
months. The dissolution behavior of samples and dosage forms was
evaluated in triplicate and characterized.

Improvements of Processing Parameters of APIs Raval MK – PhD Thesis 2012
Department of Pharmaceutical Sciences, Saurashtra University, Rajkot 117
4.3 METHODS USED FOR PROPERTY IMPROVEMENT
OF APIs
1) METFORMIN HCL
Metformin HCl show very good water solubility (>310 mg/ml), but flow
property and compressibility is a great problem associated in the
manufacturing of solid dosage form for this drug.
Different techniques like pelletization or CCA (as described in section
4.2.2.1 and 4.2.3.2) were tried to improve the flow property of Metformin HCl,
but all the attempts were failed in converting drug as a sphere. The
polymers/excipients either could not bind the drug in a manner to convert a
spherical particle(13, 70, 71) or might not act as a tailor made additive, in order to
change the habit of drug crystals and to control its growth to bind it in a
spherical manner.(72-74)
4.3.1 PREPARATION OF COCRYSTALS OF METFORMIN HCl
Among various solvents used for crystallization of Metformin HCl, only
few solvents like methanol, ethanol and acetone gave encouraging results.
The other solvents such as hexane, chloroform and other low polarity solvents
did not give crystals, might be due to very poor solubility of either drug or
excipients or both. Several studies on the preparation of co-crystals had
included exaggerated stress conditions such as deep freezing, low
temperature cooling, solvent evaporation, anti-solvent, evaporation at room
temperature, etc as described in section 4.2.1.1.(75) Various excipients like
span-20, tween-80, SLS, PEG 400, PVP K30 (PVP), HPC, HPMC E50LV
(HPMC), eudragit RS100 (eudragit), NaCl, lactose anhydrous (lactose),
mannitol, talc, etc were tried as coformer (s) to prepare cocrystals of
Metformin HCl in various concentrations and combinations. The excipients
were co-dissolved in solvents or in combinations of different polarity solvents
in different weight ratios along with Metformin HCl. In all the trials, cocrystals
were developed with poor flow property and hence omitted from the study.
Only lactose gave encouraging result with deep freezing technique to develop

Improvements of Processing Parameters of APIs Raval MK – PhD Thesis 2012
Department of Pharmaceutical Sciences, Saurashtra University, Rajkot 118
cocrystals of Metformin HCl, where ethanol was used as a solvent and drug:
coformer in various % w/w ratios (0.5 to 3) was applied to generate cocrystals
of desired properties. All other various combinations except drug: lactose
(1:0.5) % w/w imparted very poor flow to cocrystals, hence omitted from the
further study.
In the present study, Metformin HCl: lactose (1:0.5) in % w/w ratio (total
1.5 gm) was dissolved in 25 ml of ethanol at room temperature and stirred to
obtain a clear solution and stored at 4 to 5 C temperature in deep freezer. To
allow adequate amount for subsequent studies including stability, procedure
was then scaled to obtain 30 gm of cocrystals at the same weight ratio in
ethanol at the temperature mentioned above. Time of about 2 to 3 days was
required for obtaining good quantity of crystals. The cocrystals were
separated, dried and stored as described in procedure.
The crystals of Metformin HCl (control batch) were prepared in
absence of lactose anhydrous.
4.3.2 EVALUATION PARAMETERS OF COCRYSTALS OF
METFORMIN HCl
4.3.2.1 Packability and flow parameter study of cocrystals
The packability and flow parameters for Metformin HCl and its
cocrystals were studied as per the procedure described in section 4.2.5.1.
All the combinations of drug: lactose except weight ratio 1:0.5 showed
very poor flow property when measured for angle of repose (29 - 58), carr’s
index (18 - 45) and hausner’s ratio (1.32 - 1.72). Hence, those batches were
omitted from the further study. The result for optimized batch is shown in
Table 16.

Improvements of Processing Parameters of APIs Raval MK – PhD Thesis 2012
Department of Pharmaceutical Sciences, Saurashtra University, Rajkot 119
Table 16: Flow parameters of cocrystals of Metformin HCl
Sr.
No. Sample
Carr’s Index
S.D.*
Hausner’s
Ratio S.D.*
Angle of
Repose S.D.*
1 Pure Metformin
HCl
38.21 0.56
V. Poor
1.56 1.02
V.V. Poor
45.52 0.55
V. Poor
2 Control batch 40.01 0.34
V.V. Poor
1.67 1.23 V.V.
Poor
58.96 0.12
V. Poor
3 Cocrystals 15.00 0.52
Excellent
1.18 0.88
Good flow
28.07 0.51
Good Flow
*Results are mean ± S.D. of three observations.
Table 16 shows that the flow property of cocrystals was improved
compared to pure drug. It was further confirmed with the study of packability
parameters as shown in Table 17. Here, decreased values of a
(compressibility or extent of densification due to tapping) and 1/b
(cohesiveness, or how fast/easily the final packing state was achieved) than
pure drug in Kawakita equation was an indication of improvement in
packability of cocrystals compared to pure drug. Increased values of K
(Kuno’s constant) compared to pure drug, calculated using Kuno’s equation,
showed marked improvement in compressibility and packability of cocrystals
obtained in presence of lactose.
Table 17: Packability parameters study for pure drug and prepared
cocrystals
Sample Kawakita constant (K)
Kuno’s
constant
a Conclusion b 1/b Conclusion K
Pure
Metformin
HCl
0.429 - 0.139 7.179 - 0.046
Control
batch
0.441 Not
Improved
0.124 8.053 Not
Improved
0.052
Cocrystals 0.202 Improved 0.195 5.135 Improved 0.173

Improvements of Processing Parameters of APIs Raval MK – PhD Thesis 2012
Department of Pharmaceutical Sciences, Saurashtra University, Rajkot 120
4.3.2.2 Capillary melting point study of cocrystals of Metformin HCl
The melting range of Metformin HCl and prepared cocrystals was
determined as described in section 4.2.5.2.
A clear melting of cocrystals was observed in the range of 180 to 205
C. This range was below the melting point of pure Metformin HCl (242 to 245
C). The melting point of lactose was found in the range of 240 to 245 C. This
reduction in melting point might be due to weak molecular arrangement within
the crystal lattice and low heat of fusion compared to pure drug or
conformer.(76) The distinct melting behavior of crystals indicated formation a
new solid form.(77)
4.3.2.3 Microscopic determination and surface topography of cocrystals
of Metformin HCl
The crystal morphology and influence of excipient on shape of
Metformin HCl, control batch and cocrystals was observed under optical
microscope as described in section 4.2.5.3.
The optical photomicrographs of pure drug (as received), control batch
and cocrystals are shown in Figure 9. The pure drug crystals were irregular in
shape and clubbed together. Control batch crystals were was elongated and
flattened blade shaped (needle like) with sharp edges. The morphology of
cocrystals was more or less equidimensional which was an indication of its
good flow property.(51)
The shape of control batch crystals and pure drug was responsible for
its poor flow property and stickiness due to electrostatic charge generated on
its surface.(40, 50)
The distinct crystal morphology also indicated the formation of a new
solid form (phase).(78)

Improvements of Processing Parameters of APIs Raval MK – PhD Thesis 2012
Department of Pharmaceutical Sciences, Saurashtra University, Rajkot 121
Figure 9: Photomicrographs of A) Metformin HCl (as received),
B) Metformin HCl crystallized from ethanol, C) Cocrystals
4.3.2.4 Drug loading efficiency and % yield of cocrystals(48)
Accurately weighed 100 mg of cocrystals were dissolved in phosphate
buffer pH 6.8 solution (50 ml). Drug content and % yield were measured as
per the procedure described in section 4.2.5.4 at 233 nm using same pH
solution as a blank.
The percentage yield of cocrystals was 83.33%. The drug content
(loading) in cocrystals was 64.12 ± 0.25 mg Metformin HCl in 100 mg of
cocrystals (96.17%). The results indicated good loading efficiency and %yield.
The rest of the part was made up of lactose anhydrous (35.88 mg).
Hence, the cocrystal stoichiometry was shown to be 1: 0.78 since the
theoretical percentages of the Metformin HCl and lactose anhydrous are
66.67% and 33.33%, respectively.
Improvements of Processing Parameters of APIs Raval MK – PhD Thesis 2012
Department of Pharmaceutical Sciences, Saurashtra University, Rajkot 122
4.3.2.5 Micromeritic study of Metformin HCl cocrystals
Geometric mean diameter (dg) and aspect ratio (AR) determination for
cocrystals was performed using optical microscopy method as per the
procedure described in section 4.2.5.5.
The geometric mean diameter of prepared cocrystals was 0.78 mm.
The AR was measured for the crystals of control batch (10.39 ± 5.23) and
cocrystals (1.88 ± 0.63). This modified habit of cocrystals with least AR was
an indication of better flow property.(51)
4.3.2.6 Heckel plot study for Metformin HCl cocrystals
Accurately weighed quantity of prepared cocrystals (800 ± 5 mg) was
compressed using 8-mm flat-faced punch at the constant compression at
different pressures ranging from 3 to 9 tons by keeping 1 min. dwell time. (18)
Heckel parameters were calculated as per the procedure described in section
4.2.5.8.
True density was considered as the density of compacts when the
highest pressure applied on the powder (here, 9 tons).(79, 80)
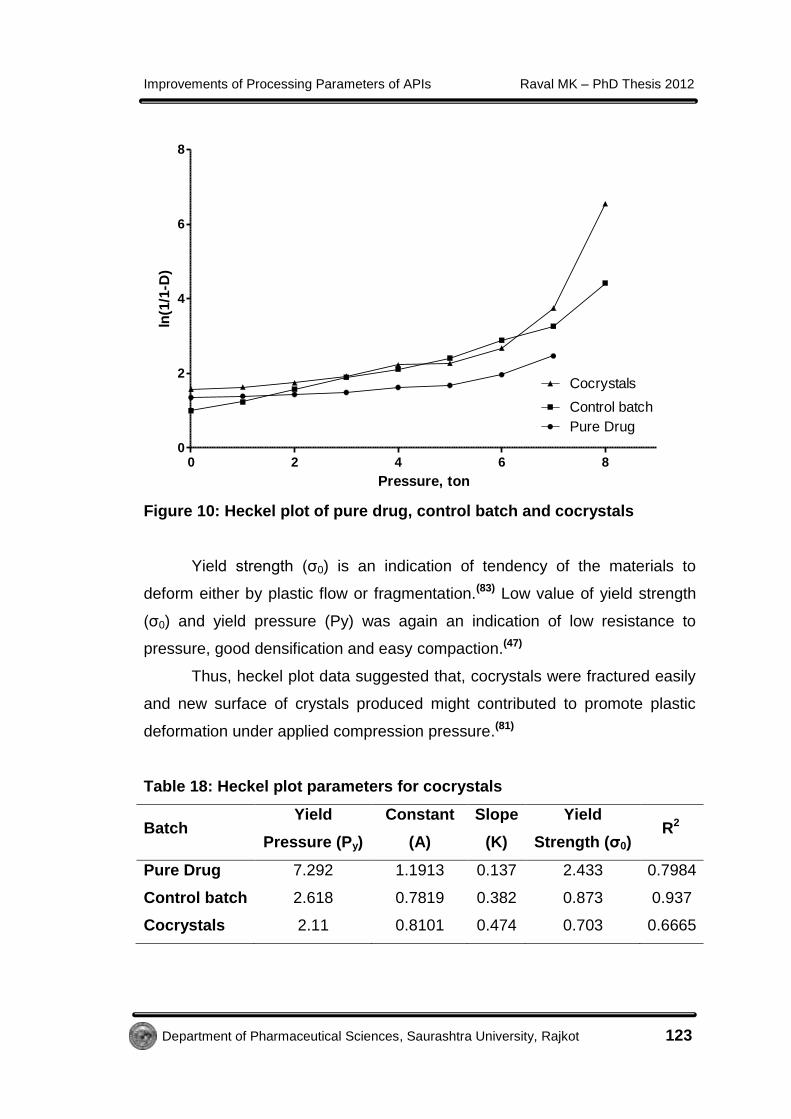
Cocrystals showed remarkable improvement in the packability
compared to pure drug and crystals from control batch (Figure 10). The true
density of cocrystals (2.26 mg/cm3), pure drug (2.17 mg/cm3) and control
batch (2.76 mg/cm3) indicated that, cocrystals were improved in its
compaction properties compared to pure drug (Figure 10).
The constants of heckel plot of pure drug and cocrystals evaluated are
displaced in Table 18.
The slop of heckel plot ‘K’ is an indicative of plastic behavior of the
material. (81) Larger the value of ‘K’, greater is the plasticity in material. The
linearity in the graph (Figure 10) was an indication of plastic deformation.
Table 18 below shows parameters of heckel plot. ‘A’ value of cocrystals was
less than pure drug. This finding suggested that, low compression pressure
was required to obtain closest packing, fracturing its texture and densifying
the fractured particles in case of cocrystals.(82)
Improvements of Processing Parameters of APIs Raval MK – PhD Thesis 2012
Department of Pharmaceutical Sciences, Saurashtra University, Rajkot 123
0 2 4 6 80
2
4
6
8
Pure Drug
Control batch
Cocrystals
Pressure, ton
ln(1
/1-D
)
Figure 10: Heckel plot of pure drug, control batch and cocrystals
Yield strength (σ0) is an indication of tendency of the materials to
deform either by plastic flow or fragmentation.(83) Low value of yield strength
(σ0) and yield pressure (Py) was again an indication of low resistance to
pressure, good densification and easy compaction.(47)
Thus, heckel plot data suggested that, cocrystals were fractured easily
and new surface of crystals produced might contributed to promote plastic
deformation under applied compression pressure.(81)
Table 18: Heckel plot parameters for cocrystals
Batch Yield
Pressure (Py)
Constant
(A)
Slope
(K)
Yield
Strength (σ0) R2
Pure Drug 7.292 1.1913 0.137 2.433 0.7984
Control batch 2.618 0.7819 0.382 0.873 0.937
Cocrystals 2.11 0.8101 0.474 0.703 0.6665

Improvements of Processing Parameters of APIs Raval MK – PhD Thesis 2012
Department of Pharmaceutical Sciences, Saurashtra University, Rajkot 124
4.3.2.7 Tensile strength measurement of pellets prepared from
cocrystals of Metformin HCl
The tensile strength of pellets prepared in heckel study was measured
at 9 ton as per the procedure described in section 4.2.5.9.
Tensile strength of cocrystals was increased with pressure, which
indicated improved mechanical properties of cocrystals (Table 19). The
maximum tensile strength was obtained at compression pressure 9 ton. The
high tensile strength of compacts was an indication of strong interparticulate
bonding between the particles.(62)
Figure 11 shows the tensile strength of the compact compressed at
different compaction pressures. Cocrystals possessed superior strength. In
particular, cocrystals compressed into compacts showed considerable
hardness without capping even at high compaction pressure, where as in pure
drug as well as control batch showed lamination after 6 tons.
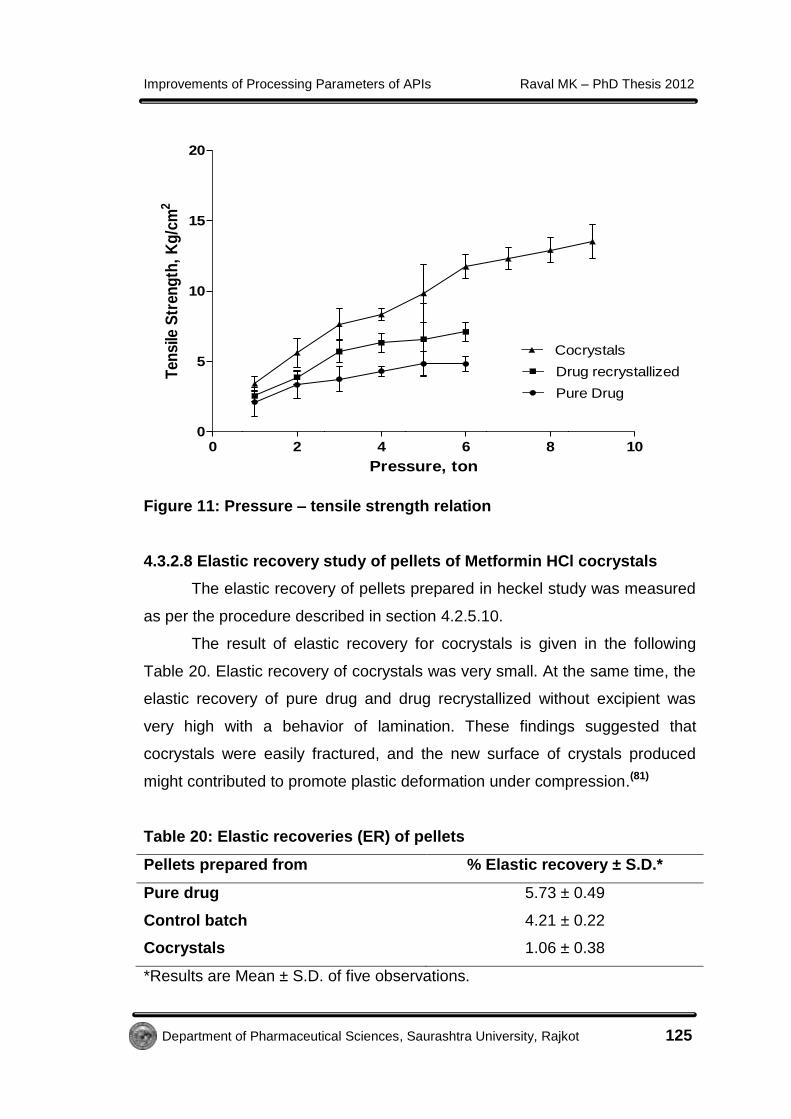
Table 19: Pressure – tensile strength relationship
Batch Slope R2 Tensile strength at 9 tons
(kg/cm2)
Pure drug 0.532 0.9145 4.83 ± 0.56
(After 6 tons)
Control batch 0.9006 0.9039 7.11 ± 0.67
(After 6 tons)
Cocrystals 1.2503 0.9604 13.53 ± 1.21
(After 9 ton)
*Results are Mean ± S.D. of five observations.
There was an increase in tensile strength of compacts as the pressure
was increased. The relation can be depicted in the following Figure 11.
Improvements of Processing Parameters of APIs Raval MK – PhD Thesis 2012
Department of Pharmaceutical Sciences, Saurashtra University, Rajkot 125
0 2 4 6 8 100
5
10
15
20
Pure Drug
Drug recrystallized
Cocrystals
Pressure, ton
Ten
sile
Str
en
gth
, K
g/c
m2
Figure 11: Pressure – tensile strength relation
4.3.2.8 Elastic recovery study of pellets of Metformin HCl cocrystals
The elastic recovery of pellets prepared in heckel study was measured
as per the procedure described in section 4.2.5.10.
The result of elastic recovery for cocrystals is given in the following
Table 20. Elastic recovery of cocrystals was very small. At the same time, the
elastic recovery of pure drug and drug recrystallized without excipient was
very high with a behavior of lamination. These findings suggested that
cocrystals were easily fractured, and the new surface of crystals produced
might contributed to promote plastic deformation under compression.(81)
Table 20: Elastic recoveries (ER) of pellets
Pellets prepared from % Elastic recovery ± S.D.*
Pure drug 5.73 ± 0.49
Control batch 4.21 ± 0.22
Cocrystals 1.06 ± 0.38
*Results are Mean ± S.D. of five observations.

Improvements of Processing Parameters of APIs Raval MK – PhD Thesis 2012
Department of Pharmaceutical Sciences, Saurashtra University, Rajkot 126
4.3.2.9 Sphericity determination of Metformin HCl cocrystals
Shape factor (SF) and circularity factor (CF) for control batch and
prepared cocrystals were measured as per the procedure described in section
4.2.5.6.
Shape factor (SF) and circularity factor (CF) of cocrystals were
calculated using area and perimeter of cocrystals and the average was
considered. Area (A) and perimeter (P’) of cocrystals was calculated using
traced photomicrographs. The results revealed in the shape factor (1.2 ± 0.91)
and circularity factor (0.99 ± 0.02), were near to unity (1). Encouraging results
of sphericity determinations indicated the shape obtained of cocrystals was
towards sphericity and it also participated in packing ability of the powder
mass in comparison to the pure drug. (18) Thus, presence of suitable excipient
was required to produce cocrystals with the shape near to spherical and to
provide excellent flow and compaction.(84)
4.3.2.10 Aqueous solubility study of cocrystals
The solubility of cocrystals was determined in different solvents such
as distilled water, 0.1N HCl, pH 1.2 buffer, pH 4.6 buffer and phosphate buffer
pH 6.8 (59) as per the described procedure in section 4.2.5.11. The
absorbance of the solutions was than measured at 233 nm by diluting with
phosphate buffer pH 6.8 using same media as blank.(1) All the determinations
were performed in triplicate.
Solubility data of Metformin HCl and cocrystals are shown in the Table
21 and represented graphically in Figure 12. The solubility of cocrystals was
found to be high in distilled water, pH 4.6 buffer and pH 6.8 buffer solutions,
where as low in 0.1N HCl and pH 1.2 buffer solutions. The recrystallized drug
also behaved in the similar manner. The extent of effect of excipients on
solubility of Metformin HCl was found to be greater in cocrystals over the
solubility of pure drug as well as control batch too.

Improvements of Processing Parameters of APIs Raval MK – PhD Thesis 2012
Department of Pharmaceutical Sciences, Saurashtra University, Rajkot 127
Table 21: Solubility data of Metformin HCl from pure drug and cocrystals
in different solvents
Solvents
Metformin HCl solubility (mg/ml)
Mean ± S.D.*
% Metformin HCl
solubility
Pure drug Control
batch Cocrystals
Control
batch Cocrystals
Distilled
water
225.12 ±
0.06
339.28 ±
0.12
379.3 ±
0.22 150.71 168.49
0.1 N HCl 184.53 ±
1.05
310 ±
0.61
355.06 ±
1.03 167.99 192.41
pH 1.2
buffer
180.07 ±
0.52
314.31 ±
1.02
351.29 ±
0.02 174.55 195.09
pH 4.6
buffer
217.43 ±
0.01
335.41 ±
0.1
369.8 ±
0.003 154.26 170.08
pH 6.8
buffer
218.21 ±
1.03
338.53 ±
0.17
382.4 ±
0.003 155.14 172.49
* indicates the results are the average of three determinations (n=3)
Figure 12: Solubility of Metformin HCl from pure drug, control batch and
cocrystals in distilled water, 0.1 N HCl and buffer solution of pH 1.2, 4.6
and 6.8 (Mean ± S.D.; n=3)
Improvements of Processing Parameters of APIs Raval MK – PhD Thesis 2012
Department of Pharmaceutical Sciences, Saurashtra University, Rajkot 128
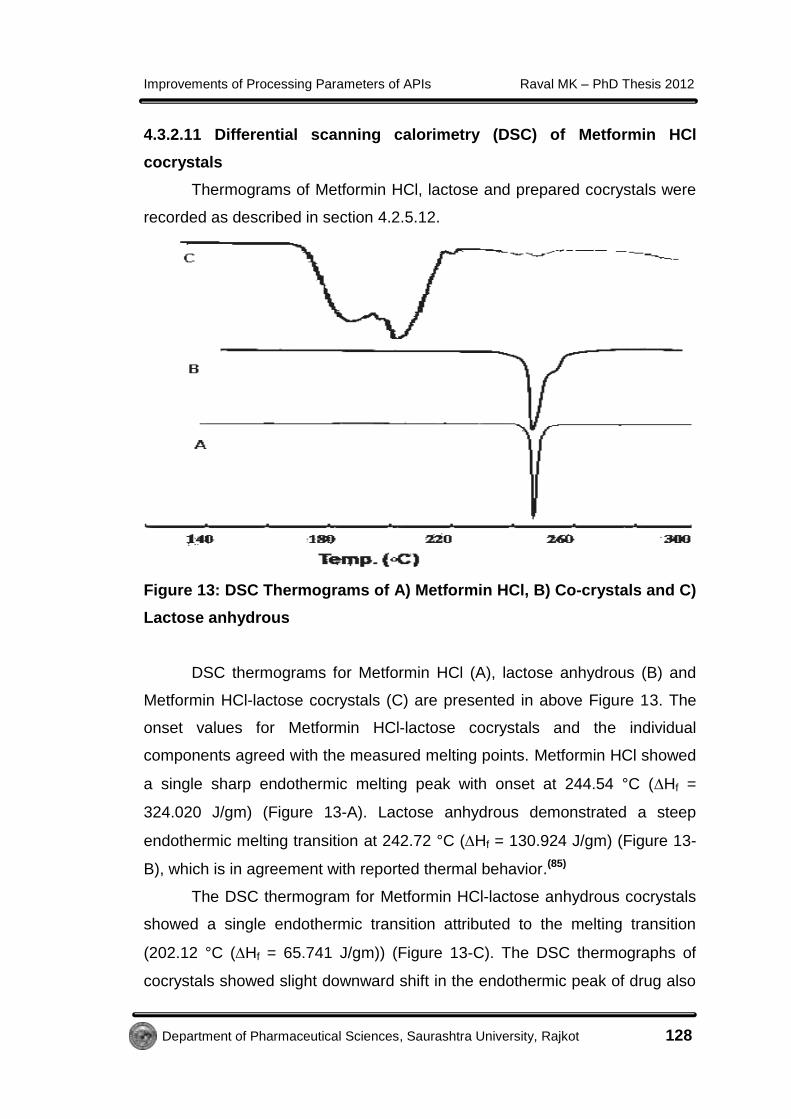
4.3.2.11 Differential scanning calorimetry (DSC) of Metformin HCl
cocrystals
Thermograms of Metformin HCl, lactose and prepared cocrystals were
recorded as described in section 4.2.5.12.
Figure 13: DSC Thermograms of A) Metformin HCl, B) Co-crystals and C)
Lactose anhydrous
DSC thermograms for Metformin HCl (A), lactose anhydrous (B) and
Metformin HCl-lactose cocrystals (C) are presented in above Figure 13. The
onset values for Metformin HCl-lactose cocrystals and the individual
components agreed with the measured melting points. Metformin HCl showed
a single sharp endothermic melting peak with onset at 244.54 °C (Hf =
324.020 J/gm) (Figure 13-A). Lactose anhydrous demonstrated a steep
endothermic melting transition at 242.72 °C (Hf = 130.924 J/gm) (Figure 13-
B), which is in agreement with reported thermal behavior.(85)
The DSC thermogram for Metformin HCl-lactose anhydrous cocrystals
showed a single endothermic transition attributed to the melting transition
(202.12 °C (Hf = 65.741 J/gm)) (Figure 13-C). The DSC thermographs of
cocrystals showed slight downward shift in the endothermic peak of drug also

Improvements of Processing Parameters of APIs Raval MK – PhD Thesis 2012
Department of Pharmaceutical Sciences, Saurashtra University, Rajkot 129
indicated the interaction of drug with lactose.(86) It might possible that, drug
and lactose physically behaved like a two phase system.(78)
The thermal behavior of the cocrystal was distinct and unique from the
individual components; this suggests the formation of a new Metformin HCl-
lactose anhydrous cocrystal phase.(87) A single endothermic transition for the
Metformin HCl-lactose anhydrous cocrystals demonstrates the stability of the
phase until the melting point and indicates the absence of any unbound or
absorbed solvent.
4.3.2.12 Fourier transform infra-red (FT-IR) spectroscopy of Metformin
HCl cocrystals (61)
FT-IR spectra of Metformin HCl, lactose and prepared cocrystals were
recorded as described in section 4.2.5.13.
Figure 14: FT-IR Spectra of A) Metformin HCl, B) Lactose anhydrous and
C) Cocrystals

Improvements of Processing Parameters of APIs Raval MK – PhD Thesis 2012
Department of Pharmaceutical Sciences, Saurashtra University, Rajkot 130
FT-IR spectra of Metformin HCl, lactose anhydrous and cocrystals are
given in Figure 13. The spectrum of Metformin HCl (A) showed characteristic
peaks at 3383.26 cm-1 and 3294 cm-1(-NH2 primary Stretching), 2945.40 cm-1
(-CH3 Stretching), 1630.87 cm-1 (C=N Bending), 1418.69 cm-1 (-NH Bending)
and 1061.85 cm-1 (C-N Bending), respectively. The Spectrum of lactose
anhydrous (B) presented characteristic peaks from 3205.80 cm-1 to 3525.99
cm-1 (Broad, -OH stretching), 2899.11 cm-1 and 1419.66 cm-1 (Strong
stretching of –CH2), 1259.56 cm-1 and 1035.80 cm-1 (Strong Bending of C-O-
C, ether linkage). Broadness of –OH groups depends on no. of hydroxyl
groups and internal H-H boding.
The Spectrum of cocrystals (Figure 14-C) also showed all the
characteristic peaks of drug as well as lactose anhydrous. Furthermore,
broadening of region between 3600 cm-1 to 2800 cm-1 was due to formation of
weak hydrogen bond as well as lower stretching frequencies of primary –NH2
group.(86) This might be due to the weak hydrogen bonding among -NH (NH2
groups of drug) and -OH group of lactose. These findings indicated that,
Metformin HCl and lactose anhydrous did not show interaction by absence of
any additional peak.
4.3.2.13 Powder x-ray diffractometry (pXRD) of cocrystals(50, 62-64)
Powder X-ray diffraction pattern of Metformin HCl and prepared
cocrystals were recorded as described in section 4.2.5.14.
The drug was characterized by distinct 2 values at 28.4156, 22.375,
24.7267, 17.7119, 31.4119, 26.4339, 23.4093 and 37.22 2 (Figure 15). A
shift in peaks was observed in case of crystals generated in presence of
lactose anhydrous. Moreover, as per the XRD spectra, overall peak intensities
are also less in cocrystal spectra compared to pure drug. This was an
indication of decrease in crystallinity.(88) It was assumed that lattice distortions
might had caused deformation of crystals, which had affected peak positions
in powder XRD pattern.(50, 63) Thus, the presence of lactose anhydrous in
crystals might either changed dhkl spacing or loss in periodicity in crystals,
lead to peak shift.(50)

Improvements of Processing Parameters of APIs Raval MK – PhD Thesis 2012
Department of Pharmaceutical Sciences, Saurashtra University, Rajkot 131
Figure 15: pXRD pattern of A) pure drug and B) crystals generated in
presence of lactose anhydrous
4.3.2.14 Scanning electron microscopy (SEM) of cocrystals
The scanning electron microscopy of Metformin HCl, lactose
anhydrous and cocrystals was performed as per the procedure described in
section 4.2.5.15. It is depicted from Figure 16 that Metformin HCl as well as
lactose anhydrous are crystalline in nature.

Improvements of Processing Parameters of APIs Raval MK – PhD Thesis 2012
Department of Pharmaceutical Sciences, Saurashtra University, Rajkot 132
Figure 16: Scanning electron microscope of A1 and A2) Metformin HCl,
B1) lactose anhydrous, C1) physical mixture, D1 and D2) drug
recrystallized from ethanol and E1, E2 and E3) cocrystals
The shape of Metformin HCl crystals is small as well as irregular. But
the particles are agglomerated with each other. This aggregation
(cohesiveness) might have become hurdle in its flow.(40)
Crystals from control batch were needle shaped which might again be
a reason of its poor flow property.(89) But the equidimensional crystal habit
may improve the flow as compared to needle shaped crystals. The crystals in
the presence of lactose anhydrous were smaller in size compared to the

Improvements of Processing Parameters of APIs Raval MK – PhD Thesis 2012
Department of Pharmaceutical Sciences, Saurashtra University, Rajkot 133
recrystallized drug from ethanol. These crystals were near to equidimensional
in shape, which might be the reason in flow property improvement.(65)
Moreover, lactose has tendency to reduce elongation ratio and increase width
of the crystals.(90) The crystals were not cohesive in nature. Thus, the flow
property was improved.
4.3.3 PREPARATION OF DOSAGE FORM OF METFORMIN HCl
AND ITS EVALUATION
4.3.3.1 Preparation of directly compressible tablets of Metformin HCl and
its cocrystals
Tablets containing 250 mg Metformin HCl as well as cocrystals
equivalent to 250 mg Metformin HCl (64.12% drug content in 100 mg of
cocrystals) were prepared by direct compression using different formulation
excipients shown in Table 22. Crystals were ground using a mortar and pestle
to achieve a similar particle size distribution (>250 µm) for each batch and
other formulation excipients were added in it. The material for each tablet was
weighed (250 mg Metformin HCl equivalent), introduced manually into the die
and compressed in tablet machine using 12 mm flat faced punches. The
tablets were prepared and evaluated as per the procedure described in
section 4.2.6.1.
Here, in the preparation of tablets from pure Metformin as well as
control batch, tablets undergone lamination and capping during compaction.
At the same time, tablets prepared from cocrystals, showed no such type of
problem, which was an indication of improvement of compression properties.
Tablets prepared from cocrystals were made similarly but using very
less amount of MCC (Table 22) which was a considerable improvement in the
properties of drug for making directly compressible form. The formulations for
tablet and its evaluations are given in Table 22.
Evaluation of prepared tablets was studied as per the procedure
described in sections from 4.2.6.2.1 to 4.2.6.2.5 and reported in Table 22.
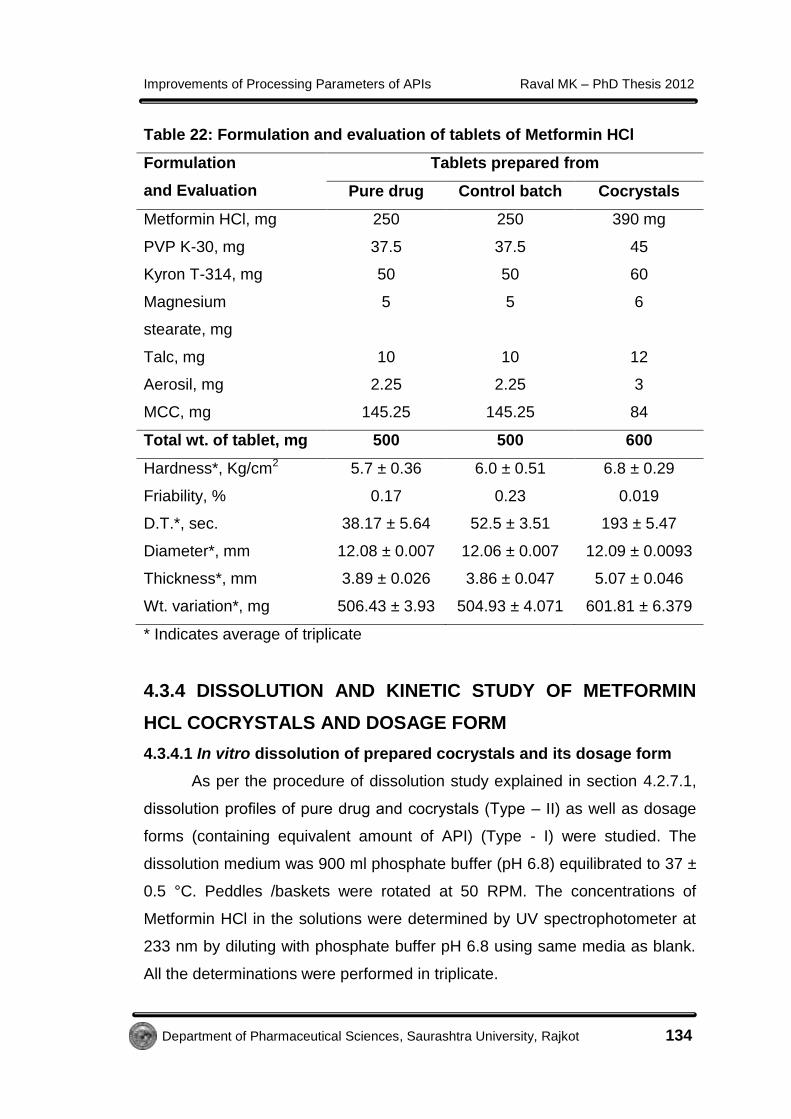
Improvements of Processing Parameters of APIs Raval MK – PhD Thesis 2012
Department of Pharmaceutical Sciences, Saurashtra University, Rajkot 134
Table 22: Formulation and evaluation of tablets of Metformin HCl
Formulation
and Evaluation
Tablets prepared from
Pure drug Control batch Cocrystals
Metformin HCl, mg 250 250 390 mg
PVP K-30, mg 37.5 37.5 45
Kyron T-314, mg 50 50 60
Magnesium
stearate, mg
5 5 6
Talc, mg 10 10 12
Aerosil, mg 2.25 2.25 3
MCC, mg 145.25 145.25 84
Total wt. of tablet, mg 500 500 600
Hardness*, Kg/cm2 5.7 ± 0.36 6.0 ± 0.51 6.8 ± 0.29
Friability, % 0.17 0.23 0.019
D.T.*, sec. 38.17 ± 5.64 52.5 ± 3.51 193 ± 5.47
Diameter*, mm 12.08 ± 0.007 12.06 ± 0.007 12.09 ± 0.0093
Thickness*, mm 3.89 ± 0.026 3.86 ± 0.047 5.07 ± 0.046
Wt. variation*, mg 506.43 ± 3.93 504.93 ± 4.071 601.81 ± 6.379
* Indicates average of triplicate
4.3.4 DISSOLUTION AND KINETIC STUDY OF METFORMIN
HCL COCRYSTALS AND DOSAGE FORM
4.3.4.1 In vitro dissolution of prepared cocrystals and its dosage form
As per the procedure of dissolution study explained in section 4.2.7.1,
dissolution profiles of pure drug and cocrystals (Type – II) as well as dosage
forms (containing equivalent amount of API) (Type - I) were studied. The
dissolution medium was 900 ml phosphate buffer (pH 6.8) equilibrated to 37 ±
0.5 °C. Peddles /baskets were rotated at 50 RPM. The concentrations of
Metformin HCl in the solutions were determined by UV spectrophotometer at
233 nm by diluting with phosphate buffer pH 6.8 using same media as blank.
All the determinations were performed in triplicate.

Improvements of Processing Parameters of APIs Raval MK – PhD Thesis 2012
Department of Pharmaceutical Sciences, Saurashtra University, Rajkot 135
Though the drug Metformin HCl is a salt form, dissolution was not a
rate limiting step due to its higher aqueous solubility. All the crystals showed
more than 95% drug release within 20 min (Figure 17). Cocrystals showed
highest rate of dissolution. All the dosage forms also showed very rich
dissolution profiles. In all the cases, drug release was more than 90% within
one hour (Figure 17).
Table 23: Data of dissolution profiles of cocrystals (Powder)
Powder dissolution from (CPR ± S.D.*)
Time (min.) Pure drug Control batch Cocrystals
0 0.00 ± 0.00 0.00 ± 0.00 0.00 ± 0.00
5 91.69 ± 2.33 88.26 ± 2.68 98.44 ± 0.67
10 94.77 ± 2.21 94.59 ± 0.96 97.84 ± 1.32
15 98.45 ± 1.37 98.70 ± 0.47 99.27 ± 2.02
20 100.10 ± 0.75 100.00 ± 0.80 100.70 ± 0.43
* Indicates the results are the average of three determinations (n=3)
Table 24 below shows drug release from dosage form prepared from
pure drug and cocrystals.
Table 24: Data of dissolution profiles of cocrystals (Tablets)
Tablet dissolution from (CPR ± S.D.*)
Time (min) Pure drug Control batch Cocrystals
0 0.00 ± 0.00 0.00 ± 0.00 0.00 ± 0.00
5 75.58 ± 1.15 72.26 ± 3.58 72.5 ± 2.17
10 90.4 ± 1.95 88.21 ± 1.43 97.93 ± 0.51
15 93.38 ± 2.16 88.21 ± 0.87 95.11 ± 1.53
20 98.05 ± 0.59 88.91 ± 4.17 95.26 ± 1.16
30 101.6 ± 2.38 89.66 ± 4.64 94.15 ± 2.41
40 100.7 ± 1.22 92.3 ± 5.42 94.75 ± 1.05
50 101 ± 1.34 93.97 ± 3.45 94.6 ± 0.79
60 99.88 ± 0.8 96.9 ± 5.47 94.88 ± 3.44
* Indicates the results are the average of three determinations (n=3)

Improvements of Processing Parameters of APIs Raval MK – PhD Thesis 2012
Department of Pharmaceutical Sciences, Saurashtra University, Rajkot 136
Figure 17: Powder and dosage form dissolution profile of pure drug,
control batch and cocrystals
4.3.4.2 Dissolution parameter study of cocrystals and dosage form of
Metformin HCl
Dissolution parameters such as dissolution percent (DP5 min),
dissolution efficiency (%DE10) and time to release 50% of the drug (t50%)
were calculated by taking pH 6.8 (phosphate buffer) using equations
described in section 4.2.7.2.
Table 25: Value of %DE10, DP5 min and t50 for powder as well as formulation
%DE10 DP5 min, % t50, min
Sample P T P T P T
Pure Drug 70.82 64.45 98.75 76.2 2.4 3.25
Cocrystal 68.72 65.55 88.75 78.7 2.5 3.25
Control batch 67.47 63.45 88.75 75 2.6 3.40
P – Powder dissolution, T – Tablet dissolution
The above results showed that, there was a negligible difference in the
dissolution parameters of pure drug and cocrystals as the drug was highly
water soluble.

Improvements of Processing Parameters of APIs Raval MK – PhD Thesis 2012
Department of Pharmaceutical Sciences, Saurashtra University, Rajkot 137
4.3.4.3 Statistical analysis of the dissolution profiles of cocrystals and
formulation of Metformin HCl(61)
Similarity factor (f2) and mean dissolution time (MDT) were calculated
for the comparison of dissolution profiles of cocrystals with pure Metformin
HCl and control batch studied in pH 6.8 (phosphate buffer) as per the
equations mentioned in section 4.2.7.3.
The values are shown in Table 26. From the results of Table 26, it was
seen that there was similarity (f2 > 50) in dissolution profiles of cocrystals with
pure drug or drug recrystallized. Though, the drug was freely soluble in
aqueous media, dissolution rate was also very high. All the results of
dissolution parameters also showed similar results.
Table 26: Value of f2 and MDT for powder as well as formulation
f2 MDT, min.
Sample P T P T
Pure Drug -- -- 4.13 6.57
Cocrystal 81.2* 67.2* 5.16 9.39
Control batch 74.4* 68.2* 3.57 6.82
* Similarity between dissolution profiles
MDT showed higher results for formulation in all the samples. It was so
because the powder was compressed in tablet form which took some time for
drug release from the formulation.(91)
4.3.5 STABILITY STUDY OF COCRYSTALS AND DOSAGE
FORM OF METFORMIN HCl
Stability study of prepared cocrystals was done as per the procedure
described in section 4.2.8.
The amount of Metformin HCl in the cocrystals was found 63.47 ± 0.13
mg after the storage. The reduction in drug content was very negligible
(1.02%). The dissolution profile of stored of cocrystals (Figure 18) was also

Improvements of Processing Parameters of APIs Raval MK – PhD Thesis 2012
Department of Pharmaceutical Sciences, Saurashtra University, Rajkot 138
similar compared to cocrystals soon after the preparation. The statistical
analysis also proved sameness in dissolution profile (f2=94.86).
The dissolution profile (Figure 18) of prepared dosage form in case of
cocrystals was similar to that of the dosage form prepared immediately. The
statistical analysis of dosage form dissolution profile of cocrystals after
stability study also proved sameness (f2=89.35) with their respective dosage
form before stability study.
Figure 18: Dissolution profiles of cocrystals and dosage form before and
after stability testing FTIR analysis
Figure 19: FT-IR study for A) Cocrystals before stability study, B)
Cocrystals after stability study
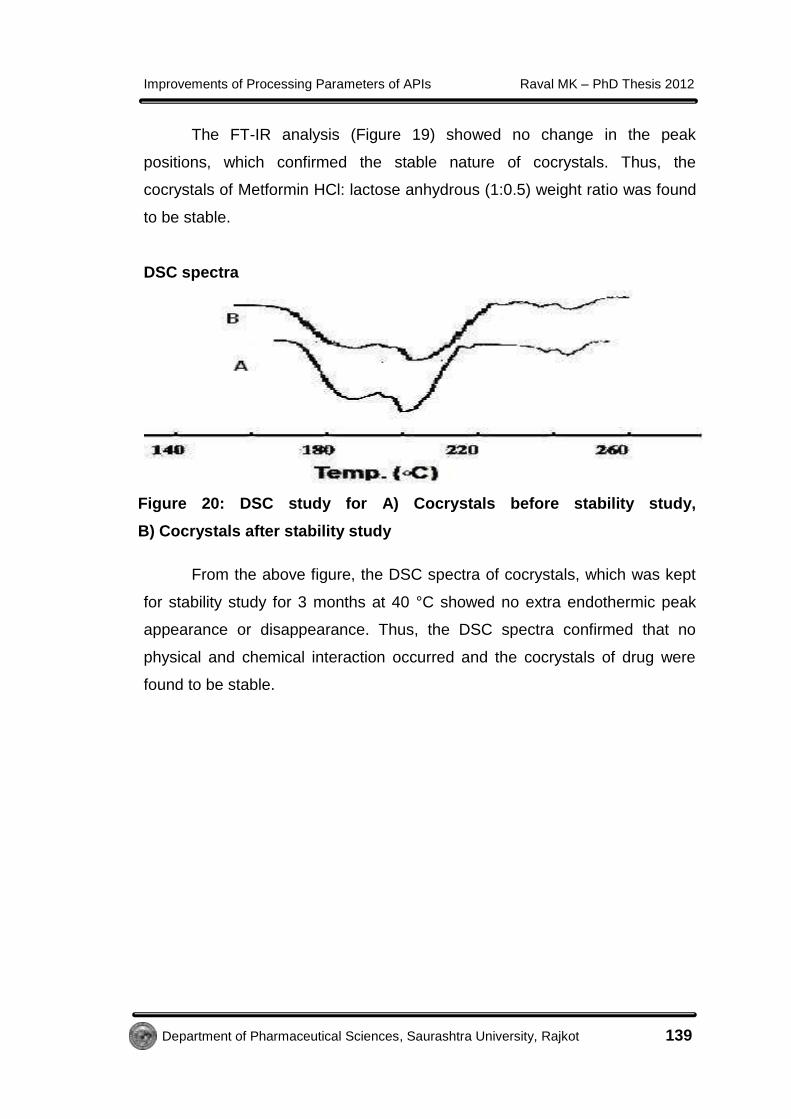
Improvements of Processing Parameters of APIs Raval MK – PhD Thesis 2012
Department of Pharmaceutical Sciences, Saurashtra University, Rajkot 139
The FT-IR analysis (Figure 19) showed no change in the peak
positions, which confirmed the stable nature of cocrystals. Thus, the
cocrystals of Metformin HCl: lactose anhydrous (1:0.5) weight ratio was found
to be stable.
DSC spectra
Figure 20: DSC study for A) Cocrystals before stability study,
B) Cocrystals after stability study
From the above figure, the DSC spectra of cocrystals, which was kept
for stability study for 3 months at 40 °C showed no extra endothermic peak
appearance or disappearance. Thus, the DSC spectra confirmed that no
physical and chemical interaction occurred and the cocrystals of drug were
found to be stable.

Improvements of Processing Parameters of APIs Raval MK – PhD Thesis 2012
Department of Pharmaceutical Sciences, Saurashtra University, Rajkot 140
2) CHLORZOXAZONE
Chlorzoxazone showed poor water solubility, poor flow property and
problems of compressibility in the manufacturing of solid dosage form.
Various techniques of conventional cocrystallization as described in section
4.2.1.1 were adopted using solvent system as alone or in combination with
wide range of polarity in presence of excipient(s). Among various solvents
used for crystallization of drug, only few solvents like methanol, ethanol and
acetone gave encouraging results. The solvents such as hexane, chloroform
and other low polarity solvents did not yield crystals, might be due to very
poor solubility of either drug or excipients or both. Various excipients like
span-20, tween-80, SLS, PEG 400, PVP K30 (PVP), HPC, ethyl cellulose,
HPMC 50LV (HPMC), eudragit RS100 (eudragit), NaCl, lactose anhydrous
(lactose), mannitol, talc, etc were tried, but all resulted in poor yield and poor
flow properties with needle shaped cocrystals.
The probable reason was blocking of some faces by polymers in order
to cease its growth and produced elongated crystals.(73) Moreover, if the
solvent was strongly bonded to drug at specific crystal face by interacting with
specific functional groups, crystal growth was rate limited by the removal of
solvent from that face. As a result, the bonded surface grew slowly leading to
a more elongated crystal.(92) Here, crystallizing solvent might had higher
affinity for the functional groups of Chlorzoxazone and resulted in elongated
crystals.(93) As the supersaturation increased, the rate of nuclei formation was
greater than crystal growth and growth occurred mainly in one direction by
producing elongated crystals.(89)
Cocrystals of Chlorzoxazone: tween-80 (2:1% w/w) by deep freezing
technique and Chlorzoxazone: lactose anhydrous (2:1% w/w) by solvent
evaporation using ethanol as a solvent in both the cases, showed higher
solubility of 0.366 ± 0.02 mg/ml and 0.209 ± 0.12 mg/ml, respectively
compared to pure drug (0.196 ± 0.04 mg/ml). But in both the cases, because
of needle shaped crystals with sticky nature, poor flow property and
compressibility, it was omitted from the further study.
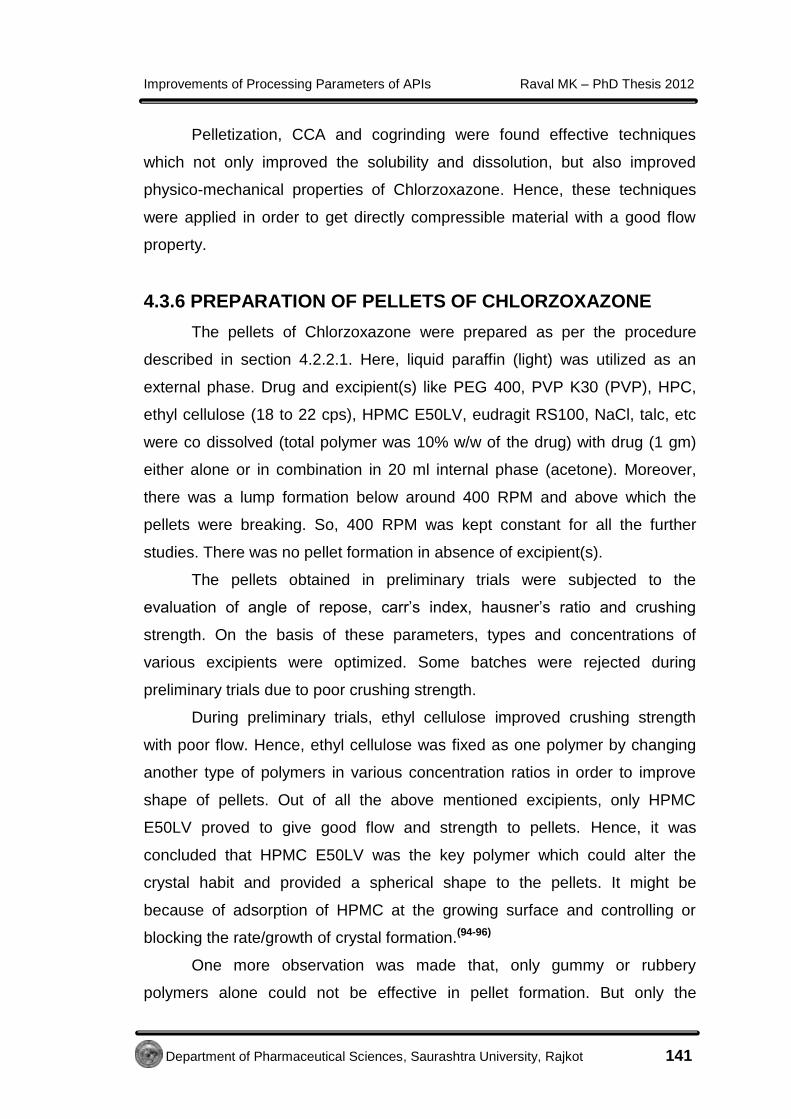
Improvements of Processing Parameters of APIs Raval MK – PhD Thesis 2012
Department of Pharmaceutical Sciences, Saurashtra University, Rajkot 141
Pelletization, CCA and cogrinding were found effective techniques
which not only improved the solubility and dissolution, but also improved
physico-mechanical properties of Chlorzoxazone. Hence, these techniques
were applied in order to get directly compressible material with a good flow
property.
4.3.6 PREPARATION OF PELLETS OF CHLORZOXAZONE
The pellets of Chlorzoxazone were prepared as per the procedure
described in section 4.2.2.1. Here, liquid paraffin (light) was utilized as an
external phase. Drug and excipient(s) like PEG 400, PVP K30 (PVP), HPC,
ethyl cellulose (18 to 22 cps), HPMC E50LV, eudragit RS100, NaCl, talc, etc
were co dissolved (total polymer was 10% w/w of the drug) with drug (1 gm)
either alone or in combination in 20 ml internal phase (acetone). Moreover,
there was a lump formation below around 400 RPM and above which the
pellets were breaking. So, 400 RPM was kept constant for all the further
studies. There was no pellet formation in absence of excipient(s).
The pellets obtained in preliminary trials were subjected to the
evaluation of angle of repose, carr’s index, hausner’s ratio and crushing
strength. On the basis of these parameters, types and concentrations of
various excipients were optimized. Some batches were rejected during
preliminary trials due to poor crushing strength.
During preliminary trials, ethyl cellulose improved crushing strength
with poor flow. Hence, ethyl cellulose was fixed as one polymer by changing
another type of polymers in various concentration ratios in order to improve
shape of pellets. Out of all the above mentioned excipients, only HPMC
E50LV proved to give good flow and strength to pellets. Hence, it was
concluded that HPMC E50LV was the key polymer which could alter the
crystal habit and provided a spherical shape to the pellets. It might be
because of adsorption of HPMC at the growing surface and controlling or
blocking the rate/growth of crystal formation.(94-96)
One more observation was made that, only gummy or rubbery
polymers alone could not be effective in pellet formation. But only the

Improvements of Processing Parameters of APIs Raval MK – PhD Thesis 2012
Department of Pharmaceutical Sciences, Saurashtra University, Rajkot 142
combination of rubbery long chain polymer like HPMC and a rigid polymer like
ethyl cellulose formed pellets of drug.
Further trials were continued by keeping the ethyl cellulose: HPMC
(K4M, K15M and K100M) as a polymer in various weight ratios (0:100 to
100:0) by keeping total quantity of polymer as fixed (10% w/w of drug) to
study the effect of various grades of HPMC on pellet formation, but it was
observed that pellets formation was possible only in the following weight
combinations as shown in Figure 21 below. The results showed that in many
cases, a lump mass was sticking at the bottom of container and hence, HPMC
E50LV was finally decided as a polymer in combination with ethyl cellulose
(18-22 cps).
Following figure shows effect of various viscosity grades of HPMC on
shape of pellets.
Figure 21: Shape of pellets prepared from various grades of HPMC

Improvements of Processing Parameters of APIs Raval MK – PhD Thesis 2012
Department of Pharmaceutical Sciences, Saurashtra University, Rajkot 143
Figure 22: Pellets of Chlorzoxazone using combination of ethyl
cellulose: HPMC E50LV (50: 50)
Figure 22 reveals the formation of pellets prepared from the
combination of ethyl cellulose and HPMC in 50:50 ratio.
In this technique of pellet formation, acetone uniformly diffused out of
the droplet and got miscible with light liquid paraffin. Hence, the dissolved
substances in suspended droplet (drug and excipient) got recrystallized
equally by giving a spherical shape to the particle.(97)
In case of higher grade HPMC, diffusion of acetone into liquid paraffin
could not remain equal from all the directions due to highly viscous drop of
internal phase, resulted in irregular shape of pellet.
After confirming HPMC E50LV, five different combinations of ethyl
cellulose: HPMC in mg (from 50:50 to 90:10) were selected for pellet
formation and evaluated. Based on these evaluation parameters like angle of
repose (20.3 0.03 to 26.6 0.83), percentage carr’s index (16.67 0.45 to
21.34 0.05), hausner’s ratio (1.12 0.21 to 1.26 0.24) and crushing
strength in gram (22.53 0.88 to 41.39 0.47), three levels were selected
from each polymer and applied for 32 full factorial design as shown in Table
27.
4.3.6.1 32 full factorial design for preparing pellets of Chlorzoxazone
After conducting various evaluation studies of pellets by combining
both the polymers, 32 full factorial design was selected. Finally, HPMC E50LV

Improvements of Processing Parameters of APIs Raval MK – PhD Thesis 2012
Department of Pharmaceutical Sciences, Saurashtra University, Rajkot 144
and ethyl cellulose (in different ratios) as per the 32 full factorial design were
co-dissolved in 10 ml acetone and drug (1.0 gm) was dissolved in this
solution. The resulting solution was emulsified within the oil phase, comprising
of light liquid paraffin (500 ml) and continuously agitated using remi magnetic
stirrer at 400 RPM for 25 min. The prepared pellets were separated from
liquid paraffin by keeping the filter paper on a sieve and poured the liquid
containing pellet on it. The collected pellets were washed three to four times
with n-hexane to remove residual organic liquid or liquid paraffin. Finally,
pellets were dried (air dried) for 24 h and stored in desiccators containing self
indicating silica crystals for 1-2 weeks and stored in air tight screw cap glass
bottle. The Table 28 for factorial design containing variables and their levels is
shown.
The design generated by keeping ethyl cellulose (X1) and HPMC
E50LV (X2) as factors and then further levels were also selected. Selection of
linear co-relation with two levels were somewhat confusing, hence three
levels were chosen in order to get linear co-relations. Thus, as per the 32
design, total 9 batches were prepared. The three levels (-1, 0, +1) were
selected for both the factors [EC (X1) and HPMC E50 LV (X2)] by keeping their
concentration different. The levels and design is in following table.
Table 27: Final batches of 32 full factorial design
Batch No. X1 X2 X1 (mg) X2 (mg)
1 -1 -1 50 10
2 -1 0 50 30
3 -1 1 50 50
4 0 -1 70 10
5 0 0 70 30
6 0 1 70 50
7 1 -1 90 10
8 1 0 90 30
9 1 1 90 50
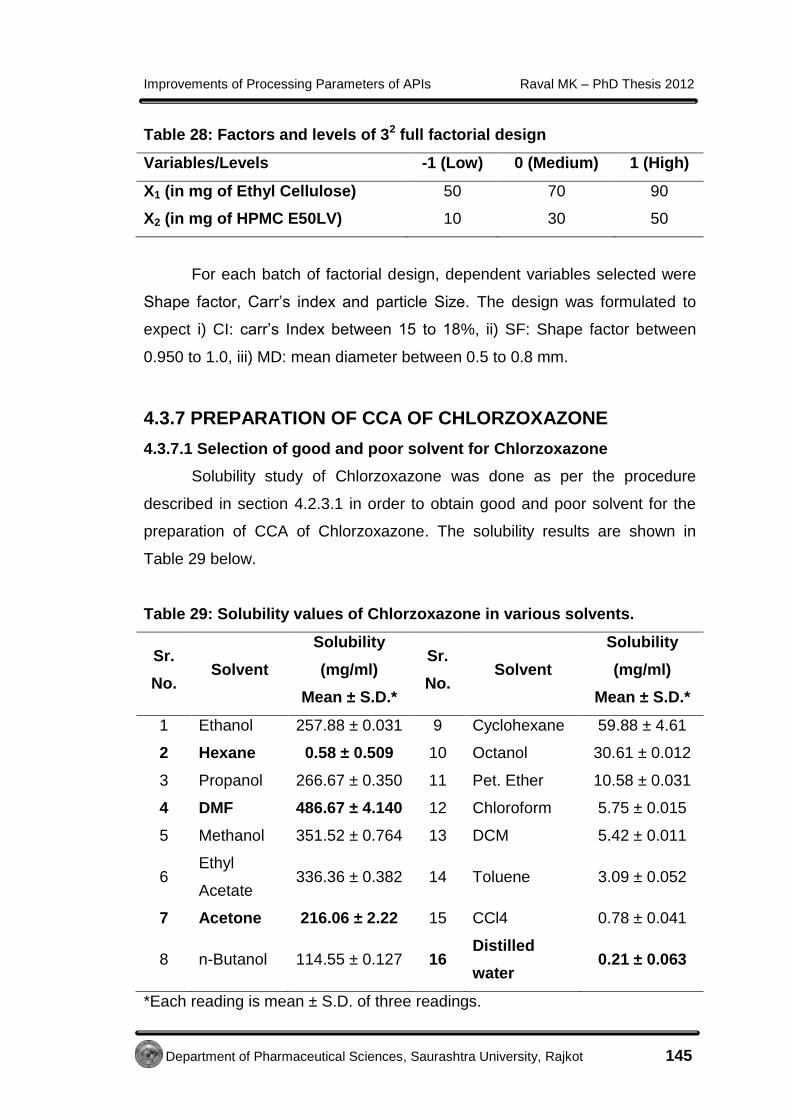
Improvements of Processing Parameters of APIs Raval MK – PhD Thesis 2012
Department of Pharmaceutical Sciences, Saurashtra University, Rajkot 145
Table 28: Factors and levels of 32 full factorial design
Variables/Levels -1 (Low) 0 (Medium) 1 (High)
X1 (in mg of Ethyl Cellulose) 50 70 90
X2 (in mg of HPMC E50LV) 10 30 50
For each batch of factorial design, dependent variables selected were
Shape factor, Carr’s index and particle Size. The design was formulated to
expect i) CI: carr’s Index between 15 to 18%, ii) SF: Shape factor between
0.950 to 1.0, iii) MD: mean diameter between 0.5 to 0.8 mm.
4.3.7 PREPARATION OF CCA OF CHLORZOXAZONE
4.3.7.1 Selection of good and poor solvent for Chlorzoxazone
Solubility study of Chlorzoxazone was done as per the procedure
described in section 4.2.3.1 in order to obtain good and poor solvent for the
preparation of CCA of Chlorzoxazone. The solubility results are shown in
Table 29 below.
Table 29: Solubility values of Chlorzoxazone in various solvents.
Sr.
No. Solvent
Solubility
(mg/ml)
Mean ± S.D.*
Sr.
No. Solvent
Solubility
(mg/ml)
Mean ± S.D.*
1 Ethanol 257.88 ± 0.031 9 Cyclohexane 59.88 ± 4.61
2 Hexane 0.58 ± 0.509 10 Octanol 30.61 ± 0.012
3 Propanol 266.67 ± 0.350 11 Pet. Ether 10.58 ± 0.031
4 DMF 486.67 ± 4.140 12 Chloroform 5.75 ± 0.015
5 Methanol 351.52 ± 0.764 13 DCM 5.42 ± 0.011
6 Ethyl
Acetate 336.36 ± 0.382 14 Toluene 3.09 ± 0.052
7 Acetone 216.06 ± 2.22 15 CCl4 0.78 ± 0.041
8 n-Butanol 114.55 ± 0.127 16 Distilled
water 0.21 ± 0.063
*Each reading is mean ± S.D. of three readings.
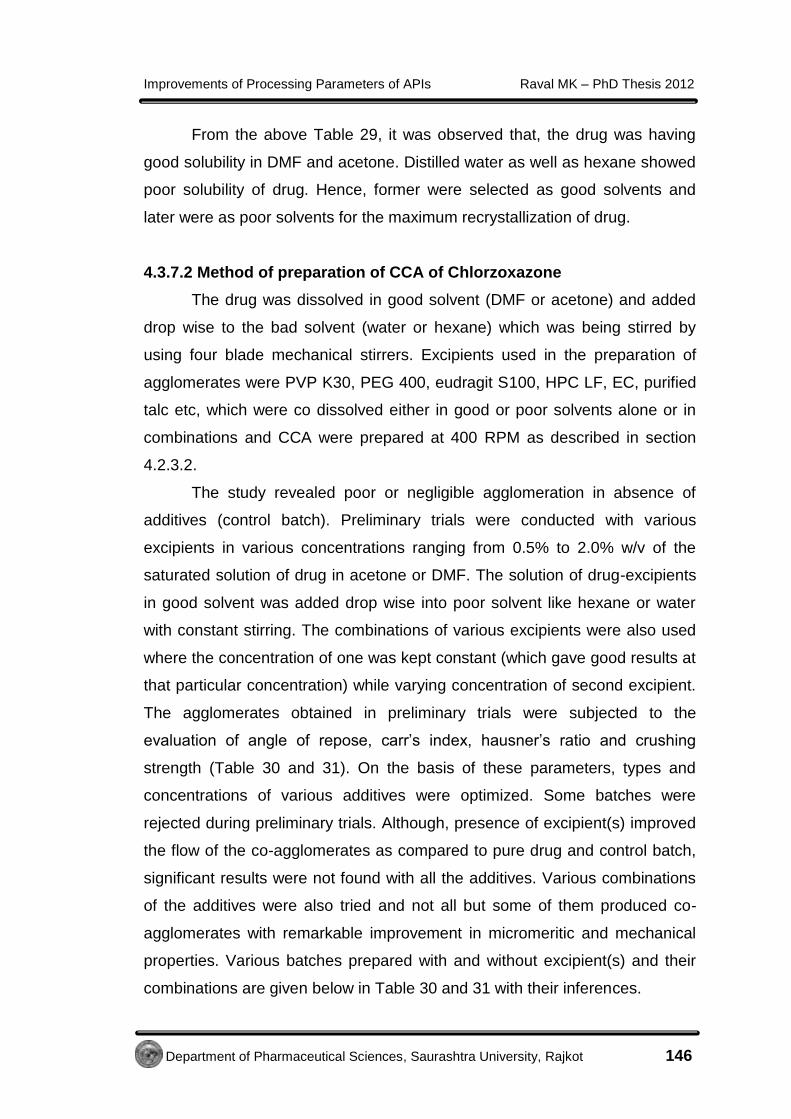
Improvements of Processing Parameters of APIs Raval MK – PhD Thesis 2012
Department of Pharmaceutical Sciences, Saurashtra University, Rajkot 146
From the above Table 29, it was observed that, the drug was having
good solubility in DMF and acetone. Distilled water as well as hexane showed
poor solubility of drug. Hence, former were selected as good solvents and
later were as poor solvents for the maximum recrystallization of drug.
4.3.7.2 Method of preparation of CCA of Chlorzoxazone
The drug was dissolved in good solvent (DMF or acetone) and added
drop wise to the bad solvent (water or hexane) which was being stirred by
using four blade mechanical stirrers. Excipients used in the preparation of
agglomerates were PVP K30, PEG 400, eudragit S100, HPC LF, EC, purified
talc etc, which were co dissolved either in good or poor solvents alone or in
combinations and CCA were prepared at 400 RPM as described in section
4.2.3.2.
The study revealed poor or negligible agglomeration in absence of
additives (control batch). Preliminary trials were conducted with various
excipients in various concentrations ranging from 0.5% to 2.0% w/v of the
saturated solution of drug in acetone or DMF. The solution of drug-excipients
in good solvent was added drop wise into poor solvent like hexane or water
with constant stirring. The combinations of various excipients were also used
where the concentration of one was kept constant (which gave good results at
that particular concentration) while varying concentration of second excipient.
The agglomerates obtained in preliminary trials were subjected to the
evaluation of angle of repose, carr’s index, hausner’s ratio and crushing
strength (Table 30 and 31). On the basis of these parameters, types and
concentrations of various additives were optimized. Some batches were
rejected during preliminary trials. Although, presence of excipient(s) improved
the flow of the co-agglomerates as compared to pure drug and control batch,
significant results were not found with all the additives. Various combinations
of the additives were also tried and not all but some of them produced co-
agglomerates with remarkable improvement in micromeritic and mechanical
properties. Various batches prepared with and without excipient(s) and their
combinations are given below in Table 30 and 31 with their inferences.
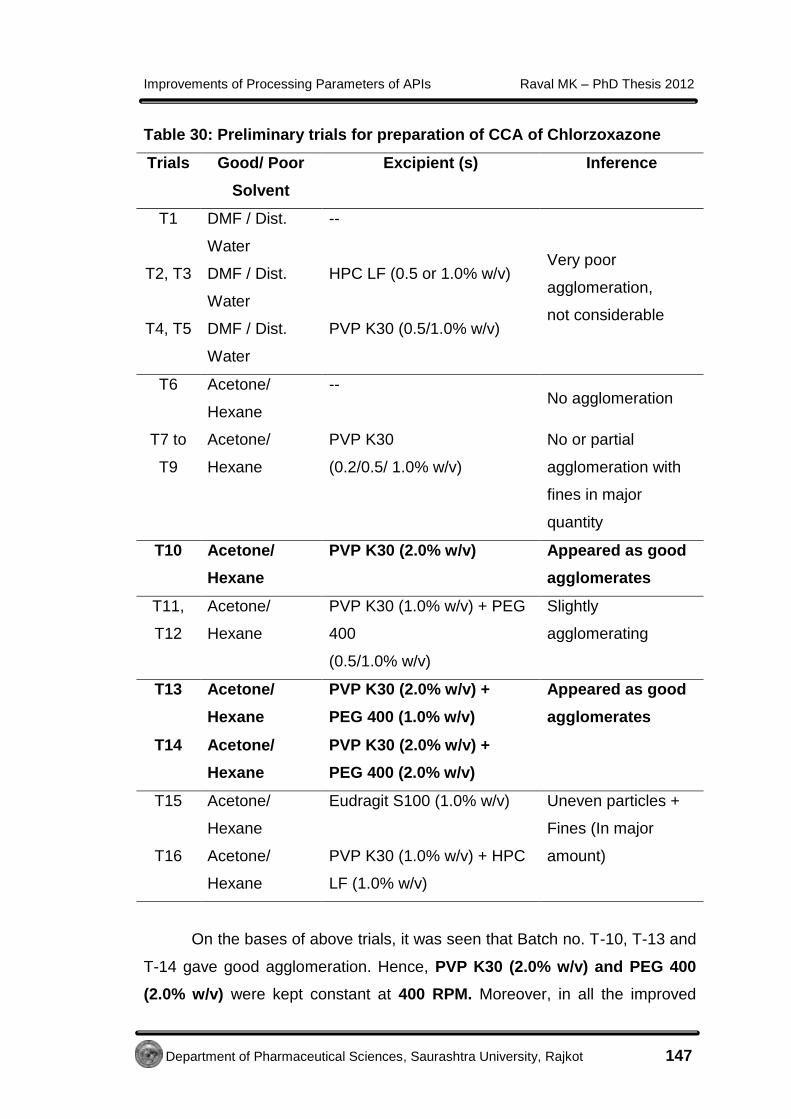
Improvements of Processing Parameters of APIs Raval MK – PhD Thesis 2012
Department of Pharmaceutical Sciences, Saurashtra University, Rajkot 147
Table 30: Preliminary trials for preparation of CCA of Chlorzoxazone
Trials Good/ Poor
Solvent
Excipient (s) Inference
T1 DMF / Dist.
Water
--
Very poor
agglomeration,
not considerable
T2, T3 DMF / Dist.
Water
HPC LF (0.5 or 1.0% w/v)
T4, T5 DMF / Dist.
Water
PVP K30 (0.5/1.0% w/v)
T6 Acetone/
Hexane
-- No agglomeration
T7 to
T9
Acetone/
Hexane
PVP K30
(0.2/0.5/ 1.0% w/v)
No or partial
agglomeration with
fines in major
quantity
T10 Acetone/
Hexane
PVP K30 (2.0% w/v) Appeared as good
agglomerates
T11,
T12
Acetone/
Hexane
PVP K30 (1.0% w/v) + PEG
400
(0.5/1.0% w/v)
Slightly
agglomerating
T13 Acetone/
Hexane
PVP K30 (2.0% w/v) +
PEG 400 (1.0% w/v)
Appeared as good
agglomerates
T14 Acetone/
Hexane
PVP K30 (2.0% w/v) +
PEG 400 (2.0% w/v)
T15 Acetone/
Hexane
Eudragit S100 (1.0% w/v) Uneven particles +
Fines (In major
amount) T16 Acetone/
Hexane
PVP K30 (1.0% w/v) + HPC
LF (1.0% w/v)
On the bases of above trials, it was seen that Batch no. T-10, T-13 and
T-14 gave good agglomeration. Hence, PVP K30 (2.0% w/v) and PEG 400
(2.0% w/v) were kept constant at 400 RPM. Moreover, in all the improved

Improvements of Processing Parameters of APIs Raval MK – PhD Thesis 2012
Department of Pharmaceutical Sciences, Saurashtra University, Rajkot 148
batches, acetone and hexane were kept as good and poor solvents,
respectively. Further addition of another excipient(s) was studied to get more
improved agglomerates with good flow and crushing strength. Here, few
conditions now kept constant for further study were,
Table 31: Optimization of excipients combination for CCA of
Chlorzoxazone
Trials Good/ Poor
Solvent Excipient (s) Inference
T17,
T18
Acetone /
Hexane
PVP K30 (2.0% w/v) + PEG
400 (2.0% w/v) +
EC (0.5 / 1.0% w/v)
Fines obtained in
major proportion
which reduced with
increase in
concentration of
ethyl cellulose
T19
PVP K30 (2.0% w/v) + PEG
400 (2.0% w/v) + EC (2.0%
w/v)
Good
agglomeration
T20
PVP K30 (2.0% w/v) + PEG
400 (2.0% w/v) + Talc (0.5%
w/v)
Lump formation
T21
PVP K30 (2.0% w/v) + PEG
400 (2.0% w/v) + Talc
(1.0/2.0% w/v)
Agglomeration was
found initially. Lump
formation occurred
when stirring was
stopped. T22
PVP K30 (2.0% w/v) + PEG
400 (2.0% w/v) + Talc (2.0%
w/v)
T23,
T24
PVP K30 (2.0% w/v) + PEG
400 (2.0% w/v) + Eudragit
S100 (1.0/2.0% w/v)
Small
agglomerates +
Fines
T25
PVP K30 (2.0% w/v) + PEG
400 (2.0% w/v) + HPC LF
(1.0% w/v)
Uneven
agglomerates

Improvements of Processing Parameters of APIs Raval MK – PhD Thesis 2012
Department of Pharmaceutical Sciences, Saurashtra University, Rajkot 149
On the bases of these preliminary trials, few batches (bold in above
Table 30 and 31) were selected for further evaluation.
4.3.8 PREPARATION OF CO-GROUND SAMPLES OF
CHLORZOXAZONE
In ball mill, the milling intensity i.e. the momentum or the kinetic energy
transferred by the balls to the unit mass of powder per unit time was adjusted
in order to get proper crushing of the powder and improvement in dissolution
of this coground powder might be possible by making it fully or partially
amorphous.(98)
It was found that when the rotation speed of ball mill was kept at lower
RPM, the balls were falling down before powder. Proper mixing and milling
was not observed here. When the speed was kept at higher RPM, the powder
was rotating towards the direction of the shell, causing improper mixing and
grinding. So, the RPM was quite optimized where the powder and balls were
found to fall simultaneously with proper mixing and grinding process together.
The coground samples were prepared as per the procedure described
in section 4.2.4.1. Various excipients like kaolin, HPMC E50LV, neusilin US2,
PVP K30 and PEG 4000 were tried by taking drug: excipient weight ratio 1:1
to 1:5, but the ratio below 1:3 did not show any dissolution improvement in
drug. Five small balls (Outer diameter = 19.04 mm) and five large balls (Outer
diameter = 25.37 mm) made of stainless steel were used to perform the ball
milling operation.
The grinding was done primarily for one hour at 65 RPM to allow
significant attrition with some impact in order to optimize the suitable excipient
for further studies. No increase in the temperature of the milled material was
detected at the end of the process. The cumulative percentage drug release
from pure drug and samples were studied and shown in Figure 23 below. The
pure drug was also ground (control batch) for one hour in order to study the
effect of grinding on crystallinity of drug.

Improvements of Processing Parameters of APIs Raval MK – PhD Thesis 2012
Department of Pharmaceutical Sciences, Saurashtra University, Rajkot 150
0 20 40 600
20
40
60
Pure drug Drug: Kaolin (1:3) Drug: Kaolin (1:5) Drug: HPMC (1:3)
Drug: HPMC (1:5) Drug: PVP K30 (1:3) Drug: PVP K30 (1:5) Drug: Neusilin (1:3)
Drug: Neusilin (1:5) Drug: PEG 4000 (1:5)Drug: PEG 4000 (1:3) Control batch
Time, min.
CP
R
Figure 23: Dissolution profile of Chlorzoxazone after grinding for one h
with different excipients
From the above figure, it was found that the milling of drug with PEG
4000 (1:3 and 1:5 ratios) showed maximum improvement in dissolution profile
(57.55 0.51 and 64.6 0.84%, respectively) compared to pure drug (37.55
0.22%), control batch (42.58 0.53%) and all other carriers as shown in
above figure.
Thus, milling was continued with PEG 4000 by taking ratio of drug to
PEG 4000 in 1:3 for longer period of time and sampling was done at fixed
intervals (at every hour) to test the in-vitro dissolution till the dissolution rate
was improved. The milled material was sieved through sieve no. 30 (600 μm
opening). To ascertain the effect of method or excipient(s)/carrier(s) or both
on the dissolution rate, Chlorzoxazone alone was ground for extended period
of time. All samples were stored in glass vials at room temperature until used
for further analysis. One batch from optimized sample was also kept for three
months stability study in screw capped container.(99) The physical mixture of
Chlorzoxazone and excipient(s)/carrier(s) were obtained by simple blending in
a 1:3 w/w ratio (drug: carrier) in a V-cone blender to ensure the proper mixing

Improvements of Processing Parameters of APIs Raval MK – PhD Thesis 2012
Department of Pharmaceutical Sciences, Saurashtra University, Rajkot 151
of powders. Coground mixture of Chlorzoxazone: PEG 4000 (1:3) was also
evaluated for other parameters to study micromeritic and mechanical
parameters.
4.3.9 EVALUATION PARAMETERS OF PELLETS, CCA AND
COGROUND SAMPLES OF CHLORZOXAZONE
4.3.9.1 Packability and flow parameter study of pellets, CCA and
coground samples of Chlorzoxazone
The packability and flow parameters for pure drug, pellets, CCA and
coground mixtures of Chlorzoxazone were studied as per the procedure
described in section 4.2.5.1. In case of pellets, encouraging results of flow
properties and compressibility parameters attributed to the shape towards
sphericity.(84)
Table 32: Packability and flow parameter study of Chlorzoxazone pellets
Batch No.
X1 X2
Angle of Repose, degree ±
S.D.*
Hausner’s ratio ± S.D.*
Carr’s Index,% ±
S.D.*
Kawakita Constants
Kuno’s Constant
a 1/b K
Pure
drug 43.60 ± 0.45 1.43 ± 0.02
37.14
± 0.2 0.05 1.29 0.32
1 -1 -1 24.68 ± 0.33 1.22 ± 0.33 17.31 ± 2.26 0.03 0.24 0.96
2 -1 0 26.03 ± 0.51 1.25 ± 0.51 18.51 ± 3.32 0.03 0.24 0.96
3 -1 1 22.8 0.23 1.25 0.19 19.23 0.11 0.04 0.09 1.12
4 0 -1 21.84 ± 0.58 1.02 ± 0.58 15.53 ± 3.06 0.04 0.15 0.82
5 0 0 20.3 0.03 1.19 0.04 18.33 0.72 0.02 0.27 0.97
6 0 1 27.29 ± 0.55 1.28 ± 0.55 19.06 ± 2.74 0.05 0.34 0.99
7 1 -1 26.6 0.83 1.12 0.21 16.67 0.45 0.03 0.37 1.09
8 1 0 30.10 ± 1.02 1.19 ± 1.02 19.66 ± 1.43 0.03 0.61 0.99
9 1 1 29.05 ± 0.61 1.24 ± 0.61 20.73 ± 0.96 0.03 0.24 0.76
*Results are mean ± S.D. of three observations.

Improvements of Processing Parameters of APIs Raval MK – PhD Thesis 2012
Department of Pharmaceutical Sciences, Saurashtra University, Rajkot 152
The results of flow property study for pellets in the Table 32 showed a
marked improvement in flow property in all the batches. Thus, presence of
suitable additives was required to produce pellets with spherical shape and
smooth surface to provide excellent flow and compaction. Smaller value of
parameter ‘a’ and ‘1/b’ in kawakita’s equation for the pellets indicated higher
packabilities of the pellets compared to pure drug.(46) The higher the values of
parameter ‘K’ in Kuno’s equation for pellets attributed to the much higher rate
of their packing processes than that of pure drug crystals.(22) The results
indicated remarkable improvement in flowability and packability of pellets
attributed to increased particle size and sphericity.(100, 101)
In case of CCA, some excipients, with their particular concentration,
showed remarkable reduction in carr’s index, hausner’s ratio and angle of
repose of CCA as compared to drug and control batch (Table 33). This was
due to spherical shape and smooth surface impartment to the agglomerates
during the process.(84) These batches were optimized for further study.
Table 33: Packability and flow parameter study of CCA of Chlorzoxazone
Batch Excipients
(w/v)
Angle of
Repose ±
S.D. *
Carr’s
Index (%) ±
S.D. *
Hausner’
s Ratio ±
S.D. *
Kawakita
Constants
Kuno’s
Constant
a b 1/b K
Pure drug 43.6 ±0.45 37.14 ± 0.2 1.43 ±0.02 0.49 0.10 9.9 0.32
Control
batch 38.94 ± 1.0 24.21 ± 0.35 1.39 ±0.12 0.28 0.22 4.52 0.75
T10 PVP K30
(2.0%) 21.2 ±0.31 15.33 ± 0.41 1.17 ±0.26 0.18 0.28 3.52 0.80
T13
PVP K30
(2.0%) +
PEG 400
(1.0%)
18.3 ±0.41 13.51 ± 0.36 1.12 ±0.35 0.19 0.13 7.7 0.76
T14
PVP K30
(2.0%) +
PEG 400
(2.0%)
18.4 ±0.27 15.72 ± 0.61 1.14 ±0.25 0.20 0.55 1.83 0.96
T19 PVP K30
(2.0%) + 19.01±0.63 14.56 ± 0.52 1.10 ±0.31 0.19 0.46 2.18 0.96
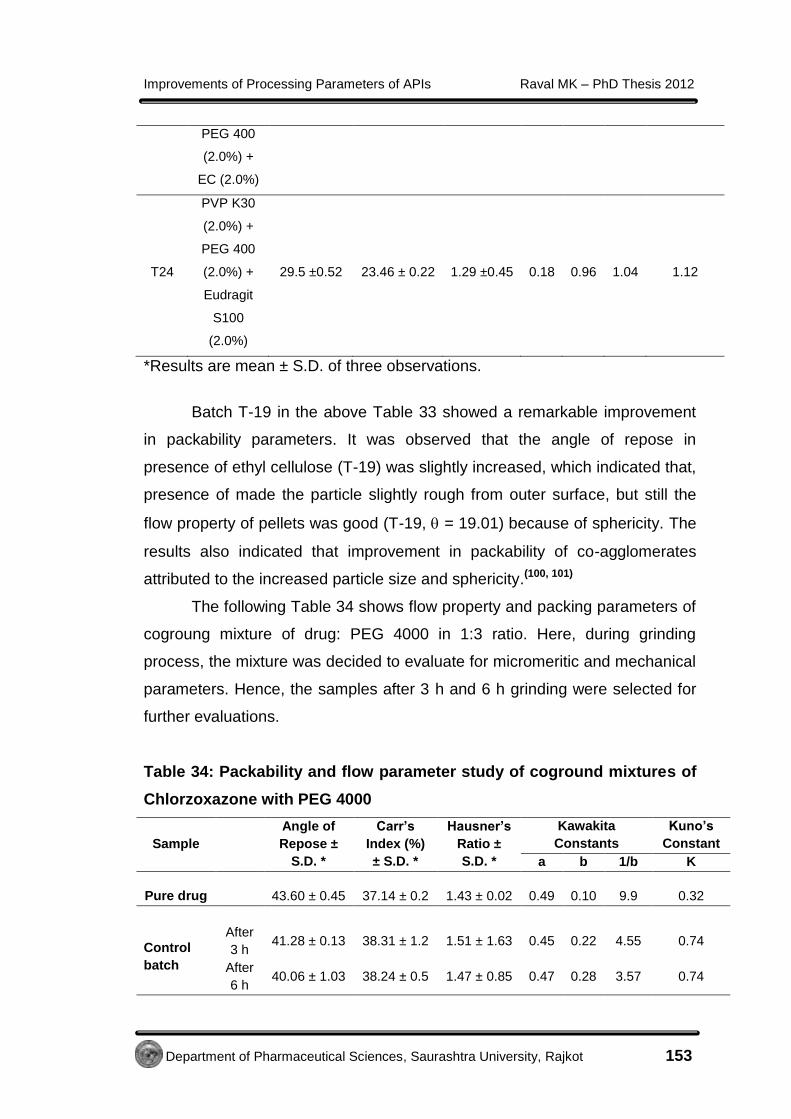
Improvements of Processing Parameters of APIs Raval MK – PhD Thesis 2012
Department of Pharmaceutical Sciences, Saurashtra University, Rajkot 153
PEG 400
(2.0%) +
EC (2.0%)
T24
PVP K30
(2.0%) +
PEG 400
(2.0%) +
Eudragit
S100
(2.0%)
29.5 ±0.52 23.46 ± 0.22 1.29 ±0.45 0.18 0.96 1.04 1.12
*Results are mean ± S.D. of three observations.
Batch T-19 in the above Table 33 showed a remarkable improvement
in packability parameters. It was observed that the angle of repose in
presence of ethyl cellulose (T-19) was slightly increased, which indicated that,
presence of made the particle slightly rough from outer surface, but still the
flow property of pellets was good (T-19, = 19.01) because of sphericity. The
results also indicated that improvement in packability of co-agglomerates
attributed to the increased particle size and sphericity.(100, 101)
The following Table 34 shows flow property and packing parameters of
cogroung mixture of drug: PEG 4000 in 1:3 ratio. Here, during grinding
process, the mixture was decided to evaluate for micromeritic and mechanical
parameters. Hence, the samples after 3 h and 6 h grinding were selected for
further evaluations.
Table 34: Packability and flow parameter study of coground mixtures of
Chlorzoxazone with PEG 4000
Sample
Angle of
Repose ±
S.D. *
Carr’s
Index (%)
± S.D. *
Hausner’s
Ratio ±
S.D. *
Kawakita
Constants
Kuno’s
Constant
a b 1/b K
Pure drug 43.60 ± 0.45 37.14 ± 0.2 1.43 ± 0.02 0.49 0.10 9.9 0.32
Control
batch
After
3 h
41.28 ± 0.13
38.31 ± 1.2
1.51 ± 1.63
0.45
0.22
4.55
0.74
After
6 h 40.06 ± 1.03 38.24 ± 0.5 1.47 ± 0.85 0.47 0.28 3.57 0.74

Improvements of Processing Parameters of APIs Raval MK – PhD Thesis 2012
Department of Pharmaceutical Sciences, Saurashtra University, Rajkot 154
Coground
mixture
Drug:
PEG 4000
(1:3)
weight
ratio
After
3 h 17.04 ± 1.12 13.4 ± 0.32 1.11 ± 0.22 0.26 0.41 2.43 1.08
After
6 h 19.88 ± 1.05
14.96 ±
0.72 1.21 ± 1.05 0.29 0.37 2.7 0.96
*Results are mean ± S.D. of three observations.
Perusal from the above table showed that the flow property and
packability of coground mixture was improved compared to pure drug and
control batch. This was due to the presence of flowable and plastically
deformation behavior of PEG 4000.(102)
4.3.9.2 Capillary melting point study of pellets, CCA and coground
samples of Chlorzoxazone
The melting range of pure drug, pellets, CCA and coground mixture
were determined as described in section 4.2.5.2.
Preliminary characterization of pellets, CCA and coground mixture of
Chlorzoxazone was performed with capillary melting point observation. A
melting range of Chlorzoxazone (197 to 204 C), pellets (196 to 199 C) and
CCA (197 to 200 C) showed almost similar results, which was an indication
of absence of any formation of new phase. The melting range of all the
samples of coground mixtures was observed between 51 to 54 C. This was
due to presence of large proportion of PEG 4000, which might dissolve the
drug in it during heating.(103, 104)
4.3.9.3 Microscopic determination and surface topography of pellets,
CCA and coground samples of Chlorzoxazone
The crystal morphology of pure drug, pellets, CCA, its control batch
and coground mixture was observed under optical microscope as described in
section 4.2.5.3. As shown in Figure 24 below, shape of pure drug crystals was
like needle, plates and rods with more quantity of fines resulting in more
electrostatic charges which ultimately lead to very poor flow.(50)

Improvements of Processing Parameters of APIs Raval MK – PhD Thesis 2012
Department of Pharmaceutical Sciences, Saurashtra University, Rajkot 155
Photomicrographs of various batches of pellets and CCA showed
marked improvement in the surface morphology and sphericity compared to
pure drug. Here, the polymers improved sphericity as well as surface
smoothness. These improvements lead to improved flow of pellets due to
reduced interparticulate friction.(105)
Figure 24: Photomicrograph of all the factorial batches of pellets
CCA prepared without use of additives showed poor aggregation and
more amounts of fines (needles) with fluffy nature (Figure 25) resulted in
hindered flow and poor handling properties.

Improvements of Processing Parameters of APIs Raval MK – PhD Thesis 2012
Department of Pharmaceutical Sciences, Saurashtra University, Rajkot 156
Figure 25: Photomicrographs of optimized batches of CCA and control
batch
The coground mixture of drug: PEG 4000 (1:3 in weight ratio) showed
reduction in particle size compared to pure drug (Figure 26) which might help
the drug to dissolve faster due to larger surface area. At the same time,
sample after grinding for 6 h showed slight aggregation.
Figure 26: Photomicrograph of coground mixture of drug: PEG 4000
4.3.9.4 Drug loading efficiency and % yield of pellets, CCA and coground
samples of Chlorzoxazone(48)
The drug loading efficiency and % yield were measured as per the
procedure described in section 4.2.5.4.

Improvements of Processing Parameters of APIs Raval MK – PhD Thesis 2012
Department of Pharmaceutical Sciences, Saurashtra University, Rajkot 157
The average percentage yield of pellets, CCA and coground mixture
(1:3) obtained was in the range of 93.94%, 91% and 86% (after 6 h),
respectively. The average drug content (loading) in pellets, CCA and
coground mixture (1:3) was 95.26%, 90.84% and 24.43% (after 6 h),
respectively. The results indicated good loading efficiency and %yield.
4.3.9.5 Micromeritic study
Micromeritic parameters study like geometric mean diameter (dg) and
aspect ratio (AR) were performed using optical microscopy method as per the
procedure described in section 4.2.5.5.
Pellets and CCA of Chlorzoxazone showed mean diameter for all the
batches in the range of 0.304 to 0.81 mm and 0.6 to 1.04 mm, respectively. It
showed around 05 to 20 folds increment in the size compared to pure drug
(0.06 mm). It indicated that the original crystals of the drug were uniformly
agglomerated. The aspect ratio (AR) of pellets and CCA was obtained in the
range of 1.15 to 1.35 and 1.14 to 1.9, respectively. This modified habit of
pellets and CCA with least AR was an indication of better flow property.(51)
4.3.9.6 Sphericity determination of Chlorzoxazone pellets and CCA
Shape factor (SF) and circularity factor (CF) for control batch and
prepared samples (Table 35) were measured as per the procedure described
in section 4.2.5.6. It was observed from the shape and circulatory factors that,
in the case of pellets, as the amount of HPMC increased, roundness was also
increased. At the same time, in CCA, presence of ethyl cellulose and eudragit
polymers lowered the value of shape factor and circulatory factors.(17) Overall,
the shape and circularity factors were near to unity (equal to 01). This was an
indication of smooth and spherical surface, which imparted good flow and
compressibility.(51)

Improvements of Processing Parameters of APIs Raval MK – PhD Thesis 2012
Department of Pharmaceutical Sciences, Saurashtra University, Rajkot 158
Table 35: Shape and circularity factors of pellets and CCA
Sr.
No. Sample
Shape factor
(SF)* ± S.D.
Circulatory factor
(CF)* ± S.D.
Pellets
EC HPMC
1 -1 -1 0.978 ± 0.0104 1.032 0.02
2 -1 0 0.989 ± 0.0252 1.035 0.51
3 -1 1 0.993 ± 0.0258 1.041 0.33
4 0 -1 0.963 ± 0.0202 0.997 1.52
5 0 0 0.97 ± 0.0120 1.013 0.06
6 0 1 0.988 ± 0.0328 1.021 0.12
7 1 -1 0.955 ± 0.0365 0.996 0.05
8 1 0 0.972 ± 0.0160 0.998 0.18
9 1 1 0.981 ± 1.5 1.041 0.37
CCA
Control batch 0.786 ± 0.112 0.815 ± 0.0308
T10 PVP K30 (2.0% w/v) 1.013 ± 0.0234 0.997 ±0.0578
T13 PVP K30 (2.0% w/v) +
PEG 400 (1.0% w/v)
0.9722 ± 0.0130 1.020 ± 0.0873
T14 PVP K30 (2.0% w/v) +
PEG 400 (2.0% w/v)
0.9844 ± 0.03612 1.033 ± 0.0551
T19 PVP K30 (2.0% w/v) +
PEG 400 (2.0% w/v) +
EC (2.0% w/v)
0.9571 ± 0.0205 0.995 ± 0.0491
T24 PVP K30 (2.0% w/v) +
PEG 400 (2.0% w/v) +
Eudragit S100 (2.0% w/v)
0.897 ± 0.0494 0.853 ± 0.0629
*Results are mean ± S.D. of three observations.

Improvements of Processing Parameters of APIs Raval MK – PhD Thesis 2012
Department of Pharmaceutical Sciences, Saurashtra University, Rajkot 159
4.3.9.7 Crushing strength of Chlorzoxazone pellets and CCA
The crushing strength of pellets and CCA of Chlorzoxazone was
measured as per the procedure described in section 4.5.6.7. The value of
crushing strength is given in Table 36.
Table 36: Crushing strength of pellets and CCA
Sr. No. Sample Crushing strength ± S.D.*
(gm)
Pellets
EC HPMC
1 -1 -1 39.55 ± 1.5
2 -1 0 36.26 ± 0.49
3 -1 1 39.17 1.05
4 0 -1 43.27 ± 2.33
5 0 0 27.23 0.55
6 0 1 39.39 ± 0.75
7 1 -1 22.53 0.88
8 1 0 38.88 ± 0.87
9 1 1 39.71 ± 0.61
CCA
T10 PVP K30 (2.0% w/v) 51.283 ± 1.833
T13 PVP K30 (2.0% w/v) +
PEG 400 (1.0% w/v)
52.540 ± 1.680
T14 PVP K30 (2.0% w/v) +
PEG 400 (2.0% w/v)
50.312 ± 2.114
T19 PVP K30 (2.0% w/v) +
PEG 400 (2.0% w/v) + EC (2.0% w/v)
55.781 ± 0.943
T24 PVP K30 (2.0% w/v) +
PEG 400 (2.0% w/v) +
Eudragit S100 (2.0% w/v)
40.013 ± 1.199
*Results are mean ± S.D. of three observations.

Improvements of Processing Parameters of APIs Raval MK – PhD Thesis 2012
Department of Pharmaceutical Sciences, Saurashtra University, Rajkot 160
As shown in the above Table 36, the crushing strength of batch no. 4
and T-19 was maximum among all the other batches of pellets and CCA,
respectively. This could be attributed to the increased agglomeration of
crystals with good bridging due to presence of suitable polymers.(106)
Improved crushing strength of the particles revealed the improvement in
mechanical and handling properties.(79) This was due to increased cohesive
interaction between particles caused better binding and close packing
between crystals.(106)
Selection of optimized batch
Here, in case of pellets and CCA, all the batches showed good flow
properties as well as shape parameters. But T-19 in case of CCA showed
excellent crushing strength. It was an indication of good handling property.
Hence, batch T-19 for CCA was selected for the further analysis.
In case of coground sample of drug: PEG 4000 (1:3), mixture after 3 h
grinding showed good flow, packability parameters and morphological
behavior compared to ground sample after 6 h. Hence, drug: PEG 4000 (1:3)
mixture after 3 h grinding was optimized for further evaluations.
Optimization for pellets with desired responses was done using surface
response methodology(107-109) where, amount of ethyl cellulose and HPMC
were chosen as independent variable, where as shape factor, mean diameter
and carr’s index were selected as dependent variables. Data for factorial
batches are shown in Table 37 below.

Improvements of Processing Parameters of APIs Raval MK – PhD Thesis 2012
Department of Pharmaceutical Sciences, Saurashtra University, Rajkot 161
Table 37: Responses of factorial batches of Chlorzoxazone pellets
Batch
No.
Amt. of
ethyl
cellulose,
mg
X1
Amt. of
HPMC
E50LV,
mg
X2
Shape factor,
SF ± S.D.*
Carr’s
Index,
CI ± S.D.*
(%)
Mean
diameter,
mm ± S.D.*
1 -1 (50) -1 (10) 0.978 ± 0.0104 17.31 ± 2.26 0.959 0.12
2 -1 (50) 0 (10) 0.989 ± 0.0252 18.51 ± 3.32 0.987 0.36
3 -1 (50) 1 (10) 0.993 ± 0.0258 19.23 0.11 1.2 0.03
4 0 (70) -1 (30) 0.963 ± 0.0202 15.53 ± 3.06 0.751 0.51
5 0 (70) 0 (30) 0.97 ± 0.0120 18.33 0.72 0.774 0.43
6 0 (70) 1 (30) 0.988 ± 0.0328 19.06 ± 2.74 0.87 0.11
7 1 (90) -1 (50) 0.955 ± 0.0365 16.67 0.45 0.633 0.32
8 1 (90) 0 (50) 0.972 ± 0.0160 19.66 ± 1.43 0.705 0.06
9 1 (90) 1 (50) 0.981 ± 1.5 20.73 ± 0.96 0.785 0.27
*Results are mean ± S.D. of three observations.
A stepwise multivariate linear regression was performed to evaluate
the observations. The statistical evaluation of the results was carried out by
analysis of variance (ANOVA) using Microsoft Excel Version 2007.
The equations representing the quantitative effect of the formulation
variables on the measured responses are shown below:
1. Shape Factor, SF =
0.9741-0.00867X1+0.011X2+0.00433X12-0.0006X2
2+0.0028X1X2
2. Carr’s Index, CI =
18.1367+0.335X1+1.585X2+1.045X12-0.745X2
2+0.535X1X2
3. Mean Diameter, mm =
0.7688-0.1705X1+0.0853X2+0.0798X12+0.0443X2
2-0.022X1X2
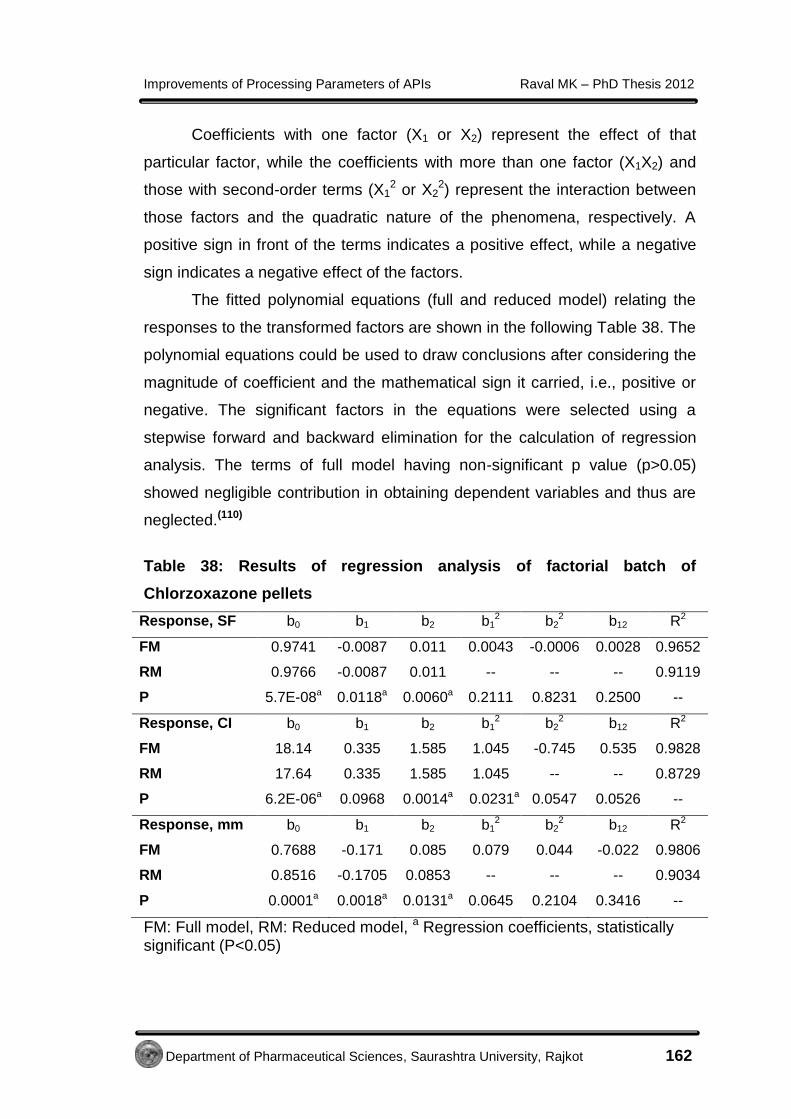
Improvements of Processing Parameters of APIs Raval MK – PhD Thesis 2012
Department of Pharmaceutical Sciences, Saurashtra University, Rajkot 162
Coefficients with one factor (X1 or X2) represent the effect of that
particular factor, while the coefficients with more than one factor (X1X2) and
those with second-order terms (X12 or X2
2) represent the interaction between
those factors and the quadratic nature of the phenomena, respectively. A
positive sign in front of the terms indicates a positive effect, while a negative
sign indicates a negative effect of the factors.
The fitted polynomial equations (full and reduced model) relating the
responses to the transformed factors are shown in the following Table 38. The
polynomial equations could be used to draw conclusions after considering the
magnitude of coefficient and the mathematical sign it carried, i.e., positive or
negative. The significant factors in the equations were selected using a
stepwise forward and backward elimination for the calculation of regression
analysis. The terms of full model having non-significant p value (p>0.05)
showed negligible contribution in obtaining dependent variables and thus are
neglected.(110)
Table 38: Results of regression analysis of factorial batch of
Chlorzoxazone pellets
Response, SF b0 b1 b2 b12 b2
2 b12 R2
FM 0.9741 -0.0087 0.011 0.0043 -0.0006 0.0028 0.9652
RM 0.9766 -0.0087 0.011 -- -- -- 0.9119
P 5.7E-08a 0.0118a 0.0060a 0.2111 0.8231 0.2500 --
Response, CI b0 b1 b2 b12 b2
2 b12 R2
FM 18.14 0.335 1.585 1.045 -0.745 0.535 0.9828
RM 17.64 0.335 1.585 1.045 -- -- 0.8729
P 6.2E-06a 0.0968 0.0014a 0.0231a 0.0547 0.0526 --
Response, mm b0 b1 b2 b12 b2
2 b12 R2
FM 0.7688 -0.171 0.085 0.079 0.044 -0.022 0.9806
RM 0.8516 -0.1705 0.0853 -- -- -- 0.9034
P 0.0001a 0.0018a 0.0131a 0.0645 0.2104 0.3416 --
FM: Full model, RM: Reduced model, a Regression coefficients, statistically significant (P<0.05)

Improvements of Processing Parameters of APIs Raval MK – PhD Thesis 2012
Department of Pharmaceutical Sciences, Saurashtra University, Rajkot 163
Table 39: The results of ANOVA*
Response, SF df(3,3) SS MS F R2
Regression
FM 5 0.0012 0.0002 16.66 0.9652 Fcal = 1.53
RM 2 0.0012 0.0006 31.09 0.9119 Ftab = 9.28
Error
FM 3 4.49 E-05 1.5 E-05
RM 6 0.0001 1.89 E-05
Response, CI df(2,3) SS MS F R2
Regression
FM 5 20.19 4.04 34.20 0.9828 Fcal = 9.12
RM 3 17.94 5.98 11.45 0.8729 Ftab = 9.55
Error
FM 3 0.35 0.12
RM 5 2.61 0.52
Response, mm df(3,3) SS MS F R2
Regression
FM 5 0.24 0.05 30.39 0.9806 Fcal = 3.99
RM 2 0.22 0.11 28.04 0.9034 Ftab = 9.28
Error
FM 3 0.01 0.001
RM 6 0.02 0.004
*ANOVA indicates analysis of variance, df: degrees of freedom, SS: sum of
squares, MS: mean of squares, F: Fischer’s ratio, R: regression coefficient,
FM: full model, RM: reduced model.
Above Table 39 shows the results of analysis of variance (ANOVA),
performed to identify insignificant factors. The critical value (Tabulated) of F
for = 0.05 and the calculated value is shown here where, Ftab is more than
Fcal. This was a conclusion of validation of reduced model.(111) It was
concluded that the interaction terms where P>0.05, did not contribute
significantly to the prediction of desired responses and hence could be
omitted from the full model.
Improvements of Processing Parameters of APIs Raval MK – PhD Thesis 2012
Department of Pharmaceutical Sciences, Saurashtra University, Rajkot 164
After carrying out the ANOVA and finding out the significant factors
which could affect the responses from prepared pellets, the equations
representing quantitative effect of the formulation variables on the measured
responses are shown below:
1. Shape Factor, SF = 0.9766-0.0087X1+0.011X2 (RM)
2. Carr’s Index, CI = 17.64+0.335X1+1.585X2+1.045X12 (RM)
3. Mean Diameter, mm = 0.8516-0.1705X1+0.085X2 (RM)
The change in responses as a function of X1 and X2 is depicted in the
form of contour and response surface plot based on full factorial design. The
data of all the 9 batches of factorial design were used for generating
interpolated values using Design Expert® Software 8.0.5.2 Trial Program
(Stat-Ease, Inc., Minneapolis, MN). Low level of X1 and high level of X2 were
found to be favorable conditions for obtaining good spherical shape, whereas,
High level of X1 and Low level of X2 was favorable for obtaining low particle
size. For Carr’s index (which should be low), X1 was not much effective in
getting low Carr’s index than X2 because of smaller coefficient of X1 (0.335).

Improvements of Processing Parameters of APIs Raval MK – PhD Thesis 2012
Department of Pharmaceutical Sciences, Saurashtra University, Rajkot 165
Shape factor
Figure 27 (a): Contour plot for shape factor of pellets
Figure 27 (b): Surface plot for shape factor of pellets

Improvements of Processing Parameters of APIs Raval MK – PhD Thesis 2012
Department of Pharmaceutical Sciences, Saurashtra University, Rajkot 166
It may be concluded from above Figure 27 (a) and (b) that, by
increasing the amount of HPMC and decreasing the amount of ethyl cellulose
could give good spheres. This might be because, HPMC was the key polymer
which could alter crystal habit and the manner in which drug got recrystallized
by giving a spherical shape. It might be because of adsorption of HPMC at the
growing surface and controlling or blocking the rate/growth of crystal
formation.(94-96)
Carr’s index
Figure 28 (a): Contour plot for carr’s index of pellets

Improvements of Processing Parameters of APIs Raval MK – PhD Thesis 2012
Department of Pharmaceutical Sciences, Saurashtra University, Rajkot 167
Figure 28 (b): Surface plot for carr’s index of pellets
It can be concluded from the above Figure 28 (a) and (b) that, when
both the polymers were at low level, carr’s index was higher. This might be
because the pellets could not become much spherical as HPMC was the key
polymer which could alter the crystal habit and imparted spherical shape by
adsorbing at the growing surface and controlling or blocking the rate/growth of
crystal formation.(94-96)
As the level of polymers increased, carr’s index decreased up to
certain level and afterwards increased again. Also, It might be concluded from
the above figure and equation that, X2 (HPMC) was more significant (2=1.59)
in increment of Carr’s index (ideally it should be low) than X1 (EC) (1=0.34).
Increment in carr’s index with the amount of HPMC was because of
roughness imparted by HPMC to the surface, which leads to poor flow.

Improvements of Processing Parameters of APIs Raval MK – PhD Thesis 2012
Department of Pharmaceutical Sciences, Saurashtra University, Rajkot 168
Different surface roughness affected sliding of the particles against
each other, leading to difference in their packing geometry and thus, carr’s
index also. Hence, inter particle friction (due to roughness of the surface)
appeared to influence the initial particle rearrangement, which might be a
reason of increased carr’s index as X2 (HPMC) increased.(62, 112, 113)
Particle Size
Figure 29 (a): Contour plot for particle size of pellets
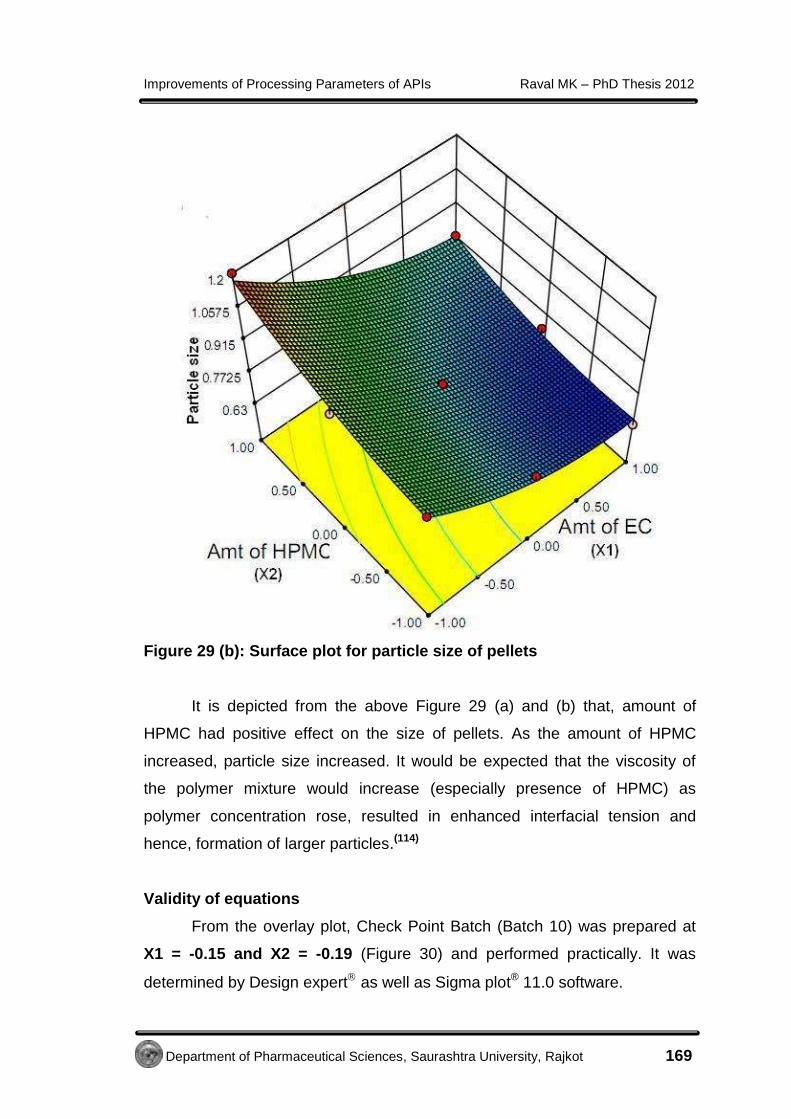
Improvements of Processing Parameters of APIs Raval MK – PhD Thesis 2012
Department of Pharmaceutical Sciences, Saurashtra University, Rajkot 169
Figure 29 (b): Surface plot for particle size of pellets
It is depicted from the above Figure 29 (a) and (b) that, amount of
HPMC had positive effect on the size of pellets. As the amount of HPMC
increased, particle size increased. It would be expected that the viscosity of
the polymer mixture would increase (especially presence of HPMC) as
polymer concentration rose, resulted in enhanced interfacial tension and
hence, formation of larger particles.(114)
Validity of equations
From the overlay plot, Check Point Batch (Batch 10) was prepared at
X1 = -0.15 and X2 = -0.19 (Figure 30) and performed practically. It was
determined by Design expert as well as Sigma plot® 11.0 software.

Improvements of Processing Parameters of APIs Raval MK – PhD Thesis 2012
Department of Pharmaceutical Sciences, Saurashtra University, Rajkot 170
Figure 30 (a): Overlay plot for desirability of responses of pellets
Figure 30 (b): Overlay plot for desirability of responses of pellets

Improvements of Processing Parameters of APIs Raval MK – PhD Thesis 2012
Department of Pharmaceutical Sciences, Saurashtra University, Rajkot 171
On the basis of criteria for desired response, following batch was
formulated to assess the reliability of the evolved equations. The experimental
values and predicted values of each response are shown in Table 40. The
percentage relative error of each response was calculated using the following
equation:
Percentage Relative Error =
100aluePredictedV
alValueExperimentValue Predicted
The percentage relative errors for check point batch were in the range
of acceptance. It was concluded that the experimental values were in good
agreement with theoretical values. This proved the validity of the equations
and selected factorial design.
Table 40: Comparison between predicted and experimental results
Batch No.
Amt. of
ethyl
cellulose,
mg
X1
Amt. of
HPMC
E50LV,
mg
X2
Shape
Factor,
SF ± S.D.*
Carr’s
Index,
CI ± S.D.*
(%)
Mean
Diameter
(mm)
± S.D.*
Predicted
Value -- -- 0.976 17.56 0.861
Experimental
Value
- 0.15
(67)
- 0.19
(26.0)
0.955
1.11
17.02 ±
1.35
0.812
1.03
% Relative
Error -- -- 2.15 3.08 5.69
*Results are Mean ± S.D. of three observations.
The other micromeritic parameters for check point batch (Batch 10)
were also evaluated and are represented in below Table 41.

Improvements of Processing Parameters of APIs Raval MK – PhD Thesis 2012
Department of Pharmaceutical Sciences, Saurashtra University, Rajkot 172
Table 41: Evaluation parameters for check point batch (batch 10) of
Chlorzoxazone pellets
Sr.
No. Parameter Results
Sr.
No. Parameter Results
1 Melting
range, C
197 - 201 6 Drug loading
efficiency ±
S.D.*
94.53 ± 1.04
2 Angle of
repose,
± S.D.*
18.31 ± 0.52 7 % yield± S.D.* 94.06 ± 0.67
3 Hausner’s
ratio
± S.D.*
1.17 ± 0.08 8 Aspect ratio ±
S.D.*
1.12 ± 0.03
4 Kawakita
Constants
a
0.05
b
9.71
1/b
0.103
9 Circularity factor
± S.D.*
0.985 ± 1.02
5 Kuno’s
Constant, K
0.86 10 Crushing
strength
± S.D.#
42.58 ± 2.18
* and # indicates results of Mean ± S.D. for three and five observations,
respectively.
Figure 31 below shows spherical morphology of pellet prepared from
check point batch.
Figure 31: Photomicrograph of checkpoint batch (batch 10) of
Chlorzoxazone pellets
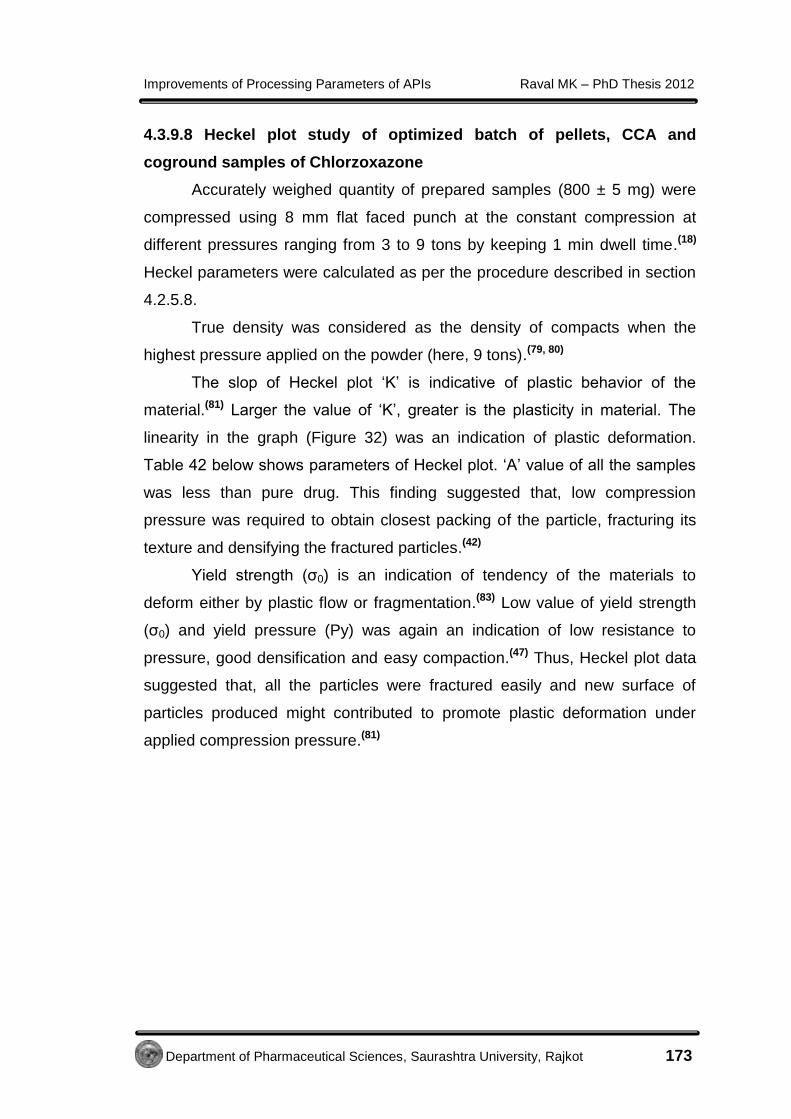
Improvements of Processing Parameters of APIs Raval MK – PhD Thesis 2012
Department of Pharmaceutical Sciences, Saurashtra University, Rajkot 173
4.3.9.8 Heckel plot study of optimized batch of pellets, CCA and
coground samples of Chlorzoxazone
Accurately weighed quantity of prepared samples (800 ± 5 mg) were
compressed using 8 mm flat faced punch at the constant compression at
different pressures ranging from 3 to 9 tons by keeping 1 min dwell time.(18)
Heckel parameters were calculated as per the procedure described in section
4.2.5.8.
True density was considered as the density of compacts when the
highest pressure applied on the powder (here, 9 tons).(79, 80)
The slop of Heckel plot ‘K’ is indicative of plastic behavior of the
material.(81) Larger the value of ‘K’, greater is the plasticity in material. The
linearity in the graph (Figure 32) was an indication of plastic deformation.
Table 42 below shows parameters of Heckel plot. ‘A’ value of all the samples
was less than pure drug. This finding suggested that, low compression
pressure was required to obtain closest packing of the particle, fracturing its
texture and densifying the fractured particles.(42)
Yield strength (σ0) is an indication of tendency of the materials to
deform either by plastic flow or fragmentation.(83) Low value of yield strength
(σ0) and yield pressure (Py) was again an indication of low resistance to
pressure, good densification and easy compaction.(47) Thus, Heckel plot data
suggested that, all the particles were fractured easily and new surface of
particles produced might contributed to promote plastic deformation under
applied compression pressure.(81)

Improvements of Processing Parameters of APIs Raval MK – PhD Thesis 2012
Department of Pharmaceutical Sciences, Saurashtra University, Rajkot 174
Figure 32: Heckel plot for Chlorzoxazone and its optimized samples
The table below gives heckel plot parameters for pure drug, pellets,
CCA and coground samples.
Table 42: Heckel plot parameters of Chlorzoxazone samples
Batch
Yield
Pressure
(Py)
Constant
(A)
Slope
(K)
Yield
Strengt
h (σ0)
R2
Pure Drug 26.09 0.9924 0.038 8.7719 0.9724
Pellets Batch 10 1.747 0.5543 0.573 0.582 0.979
T-19 1.23 0.028 0.8132 0.4099 0.8802
Control batch (CCA) 5.928 1.035 0.179 1.8622 0.9783
Coground mixture
after 3 h 2.082 0.6396 0.4803 0.6940 0.9817

Improvements of Processing Parameters of APIs Raval MK – PhD Thesis 2012
Department of Pharmaceutical Sciences, Saurashtra University, Rajkot 175
Perusal from above Table 42 indicated that, out of all the samples,
CCA (batch T-19) showed maximum compressibility and tableting behavior. In
case of ground sample, effect of PEG 4000 addition (plastic material) on
tableting properties was observed. Densification of this polymer was probably
due to its plastic deformation.(102)
4.3.9.9 Tensile strength measurement of pellets of Chlorzoxazone
samples after heckel analysis
The tensile strength of pellets prepared in heckel study was measured
as per the procedure described in section 4.2.5.9.
The maximum tensile strength was obtained at compression pressure
9 ton. The high tensile strength of compacts was an indication of strong
interparticulate bonding between the particles of optimized batch compared to
pure drug as well as control batch.(62)
Figure 33: Pressure – tensile strength relation between Chlorzoxazone
and its prepared samples

Improvements of Processing Parameters of APIs Raval MK – PhD Thesis 2012
Department of Pharmaceutical Sciences, Saurashtra University, Rajkot 176
The values of tensile strength of pellets (prepared in KBr press)
from Chlorzoxazone pure drug and other samples at 9 ton pressure with 1 min
dwell time is given in Table 43.
Table 43: Tensile strength of Chlorzoxazone pellets after heckel study
Batch Tensile Strength (kg/cm2) ± S.D.*
at 9 ton pressure
Pure Drug 5.708 ± 0.121
Pellets Batch 10 16.498 ± 0.71
T-19 19.256 ± 0.2354
Control batch (CCA) 8.554 ± 0.243
Coground mixture after 3 h 11.689 ± 0.521
*Results are Mean ± S.D. of five observations.
In case of coground mixture, during the compression process, surface
melting of compacts of drug containing PEG 4000 might easily occur,
resulting in greater particle bonding and tensile strength. At higher pressures,
melting of the particles and subsequent surface melting of compact became
probable the predominant mechanism for volume reduction.(102)
4.3.9.10 Elastic recovery of pellets of Chlorzoxazone samples after
heckel analysis
The elastic recovery of pellets prepared in heckel study was measured
as per the procedure described in section 4.2.5.10.
The result for the elastic recovery for optimized batches is given in the
following Table 44. Elastic recoveries of samples were smaller than that of
original drug crystals. These findings suggest that agglomerated crystals are
easily fractured and the new surface of crystals produced might contribute to
promote plastic deformation under compression.(79)

Improvements of Processing Parameters of APIs Raval MK – PhD Thesis 2012
Department of Pharmaceutical Sciences, Saurashtra University, Rajkot 177
Table 44: Elastic recoveries (ER) of Chlorzoxazone pellets after heckel
analysis
Batch % Elastic Recovery ± S.D*
for 9 ton
Pure Drug 5.48 ± 0.79
Pellets Batch 10 2.14 ± 1.03
T-19 0.87 ± 0.32
Control batch (CCA) 1.56 ± 0.52
Coground mixture after 3 h 1.08 ± 0.73
*Results are Mean ± S.D. of five observations.
Above table showed least elastic recovery in case of CCA, which was
negligible.
4.3.9.11 Aqueous solubility study of coground samples of
Chlorzoxazone
CCA and pellets were not studied for aqueous solubility determination
as the primary goal of CCA and pellets was to enhance the flow property by
binding and/or covering the drug with the help of excipients and also
dissolution rate enhancement.(13, 70, 115)
The solubility of coground samples was done as per the described
procedure in section 4.2.5.11.
Solubility data of Chlorzoxazone and ground drug are shown in the
Table 45 and represented graphically in Figure 34. To perform an errorless
study, pure drug and control batch were premixed with PEG 4000 in the
equivalent quantity of drug loading of coground mixture (24.43% drug). The
solubility of ground drug was found to be high in distilled water and pH 6.8
buffer solutions, where as low in 0.1N HCl. pH 1.2 and pH 4.5 buffer solutions.
The control batch also behaved in the similar manner. The extent of effect of
cogrinding in presence of polymers on solubility of Chlorzoxazone was found
to be greater in coground sample over the solubility of pure drug as well as
control batch too.

Improvements of Processing Parameters of APIs Raval MK – PhD Thesis 2012
Department of Pharmaceutical Sciences, Saurashtra University, Rajkot 178
Table 45: Solubility data of Chlorzoxazone from pure drug and ground
drug in different solvents
Solvents
Chlorzoxazone solubility (mg/ml)
Mean ± S.D.*
% Chlorzoxazone
solubility
pure drug control
batch
Coground
drug
control
batch
Coground
drug
Distilled
water
1.008 ± 0.05 2.06 ± 0.018 3.12 ± 0.046 204.7 309.9
0.1 N
HCl
0.542 ± 0.06 0.984 ± 0.05 1.89 ± 0.071 181.5 349.1
pH 1.2
buffer
0.55 ± 0.051 0.968 ± 0.02 1.58 ± 0.091 176.6 287.8
pH 4.6
buffer
0.72 ± 0.051 1.143 ± 0.08 2.14 ± 0.028 159.2 297.6
pH 6.8
buffer
1.018 ± 0.01 2.055 ± 0.06 3.24 ± 0.074 201.9 317.9
* indicates the results are the average of three determinations (n=3),
0
1
2
3
Pure drug
Control batch
Coground mixture
Distilled water 0.1 N HCl pH 1.2 buffer pH 4.6 buffer pH 6.8 buffer
Sol
ubili
ty o
f chl
orzo
xazo
ne, m
g/m
l
Figure 34: Solubility of Chlorzoxazone from pure drug, control batch
and coground mixture after 3 h (ratio, 1:3,%w/w) in distilled water, 0.1 N
HCl and buffer solution of pH 1.2, 4.6 and 6.8 (Mean ± S.D.; n=3)

Improvements of Processing Parameters of APIs Raval MK – PhD Thesis 2012
Department of Pharmaceutical Sciences, Saurashtra University, Rajkot 179
4.3.9.12 Differential scanning calorimetry (DSC) of pellets, CCA and
coground samples of Chlorzoxazone
Thermograms of Chlorzoxazone, excipients and prepared samples
were recorded as described in section 4.2.5.12. Thermal properties of drug
and pellets were studied using DSC (Figure 35). Melting point of drug was
observed at 196.13 oC (Hf= - 431.28 mJ). Melting point peak of drug was
slightly broadened in thermograms of physical mixture as well as pellets. This
might be due to dispersion of crystalline drug into amorphous polymer i.e. EC
and HPMC and was not a sign of pharmaceutical incompatibility.(112, 116, 117)
Partial amorphization of drug in pellets might also be a reason for such
phenomena.(118) Uniformity in crystalline structure was confirmed by
endothermic peaks of drug that remained at almost same temperature in
physical mixture (190.60 oC, Hf= -130.44 mJ) and pellets (190.95 oC, Hf=
-120.86 mJ). One more peak was obtained in pellets at 252.91 oC. This was a
degradation peak of components.
Figure 35: DSC thermogram of A) Chlorzoxazone, B) ethyl Cellulose, C)
HPMC E50LV, D) physical mixture of drug, ethyl cellulose and HPMC
E50LV and E) pellets of Batch 10.

Improvements of Processing Parameters of APIs Raval MK – PhD Thesis 2012
Department of Pharmaceutical Sciences, Saurashtra University, Rajkot 180
In case of CCA, melting point of drug was observed at 196.13 oC. The
CCA from control batch also showed the same melting peak. Melting point
peak of drug was slightly broadened in thermograms of physical mixture as
well as agglomerates. This might be due to dispersion of crystalline drug into
amorphous polymer i.e. PVP K30 and was not a sign of pharmaceutical
incompatibility.(119) Partial amorphization of drug in agglomerates might also
be a reason for it. Uniformity in crystalline structure was confirmed by
endothermic peaks of drug that remained at almost same temperature in
physical mixture (190.40 oC) and agglomerates (201.02 oC).
Figure 36: DSC thermogram of A) Chlorzoxazone, B) control batch, C)
PVP K30, D) ethyl cellulose, E) physical mixture of drug, PVP K-30, ethyl
cellulose and PEG 400 and F) CCA of batch T-19.
From the Figure 36 in coground mixture of drug: PEG 4000 (1:3% w/w)
after 3 h and 6 h grinding, it was seen that there was no much difference in
the melting endotherm of pure drug Chlorzoxazone (196.13 C) and control
batches (188.4 C) ground at 3 and 6 hours. It was an indication of absence of

Improvements of Processing Parameters of APIs Raval MK – PhD Thesis 2012
Department of Pharmaceutical Sciences, Saurashtra University, Rajkot 181
any polymorphic transformation. The heat of fusion in case of pure drug
(-431.28 mJ) with compared to control batch at 3 h (-190.07 mJ) and 6 h (-
162.9 mJ) was higher. This might be a reason of somewhat improved
dissolution of control batch than pure drug.(125)
The DSC curves of pure components in Figure 36 (A) and 36 (D) a
single endothermic melting peak for Chlorzoxazone (196.13 °C) and for PEG
4000 (57.26 °C) was observed. The DSC curve of the milled samples Figure
36 (F) and 36 (G) exhibits a melting endotherm of 48.8 °C and 48.95 C,
which was almost the same melting peak of PEG 4000. It was concluded that
Chlorzoxazone slowly dissolved in the PEG 4000 melt and therefore no
distinct endothermic event could be observed for the active compound in the
drug-polymer milled mixture with DSC. A similar result showed the DSC curve
of the physical mixture in Figure 36 (E) where the melting peak of
Chlorzoxazone could not be recorded either due to the slow dissolution of the
Chlorzoxazone in the melt of the carrier on heating and thereafter the
stabilization of solid drug particles in a metastable form.(103, 104)
The peak of PEG 4000 in the DSC curve of the coground samples was
broadened compared to that of pure PEG 4000, which indicated that the
carrier weakly interacted with Chlorzoxazone. Similar observations were
reported by Rodriguez et al.(103) for diclofenac / PEG 4000 systems. Also in
this system, only a broad endotherm could be observed which corresponded
to the monotectic melting (some degrees below the melting peak of the pure
PEG 4000).(103, 104)
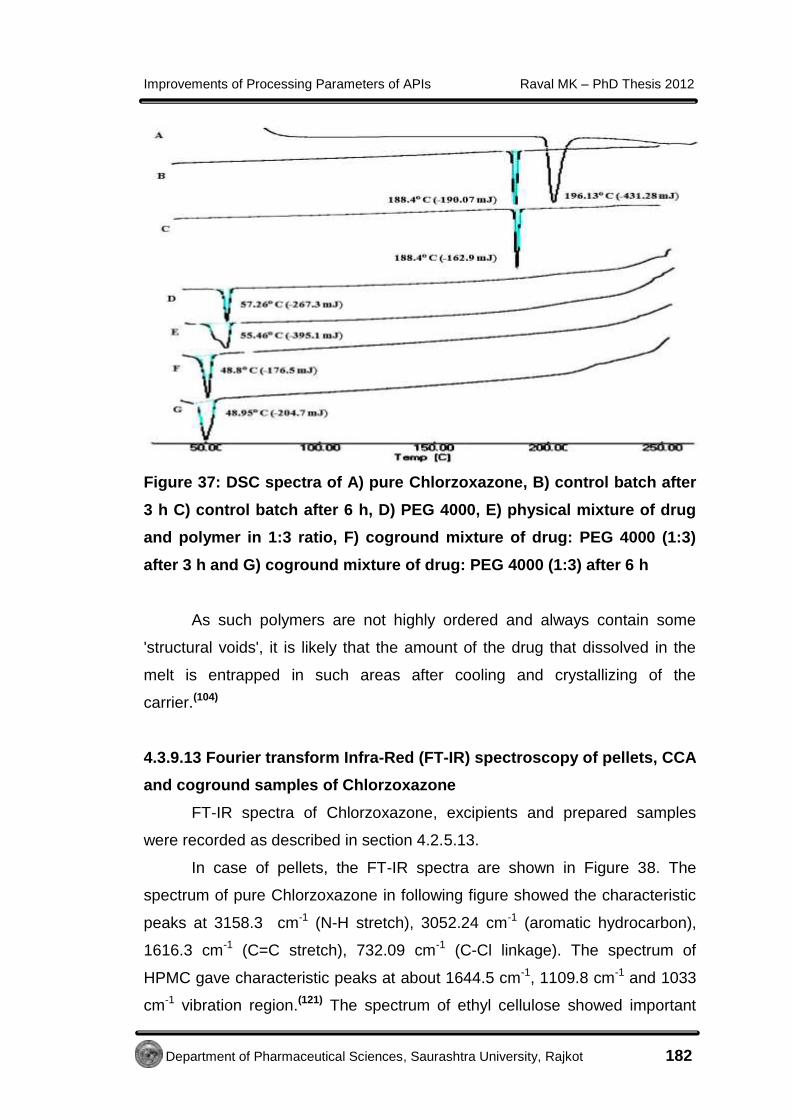
Improvements of Processing Parameters of APIs Raval MK – PhD Thesis 2012
Department of Pharmaceutical Sciences, Saurashtra University, Rajkot 182
Figure 37: DSC spectra of A) pure Chlorzoxazone, B) control batch after
3 h C) control batch after 6 h, D) PEG 4000, E) physical mixture of drug
and polymer in 1:3 ratio, F) coground mixture of drug: PEG 4000 (1:3)
after 3 h and G) coground mixture of drug: PEG 4000 (1:3) after 6 h
As such polymers are not highly ordered and always contain some
'structural voids', it is likely that the amount of the drug that dissolved in the
melt is entrapped in such areas after cooling and crystallizing of the
carrier.(104)
4.3.9.13 Fourier transform Infra-Red (FT-IR) spectroscopy of pellets, CCA
and coground samples of Chlorzoxazone
FT-IR spectra of Chlorzoxazone, excipients and prepared samples
were recorded as described in section 4.2.5.13.
In case of pellets, the FT-IR spectra are shown in Figure 38. The
spectrum of pure Chlorzoxazone in following figure showed the characteristic
peaks at 3158.3 cm-1 (N-H stretch), 3052.24 cm-1 (aromatic hydrocarbon),
1616.3 cm-1 (C=C stretch), 732.09 cm-1 (C-Cl linkage). The spectrum of
HPMC gave characteristic peaks at about 1644.5 cm-1, 1109.8 cm-1 and 1033
cm-1 vibration region.(121) The spectrum of ethyl cellulose showed important
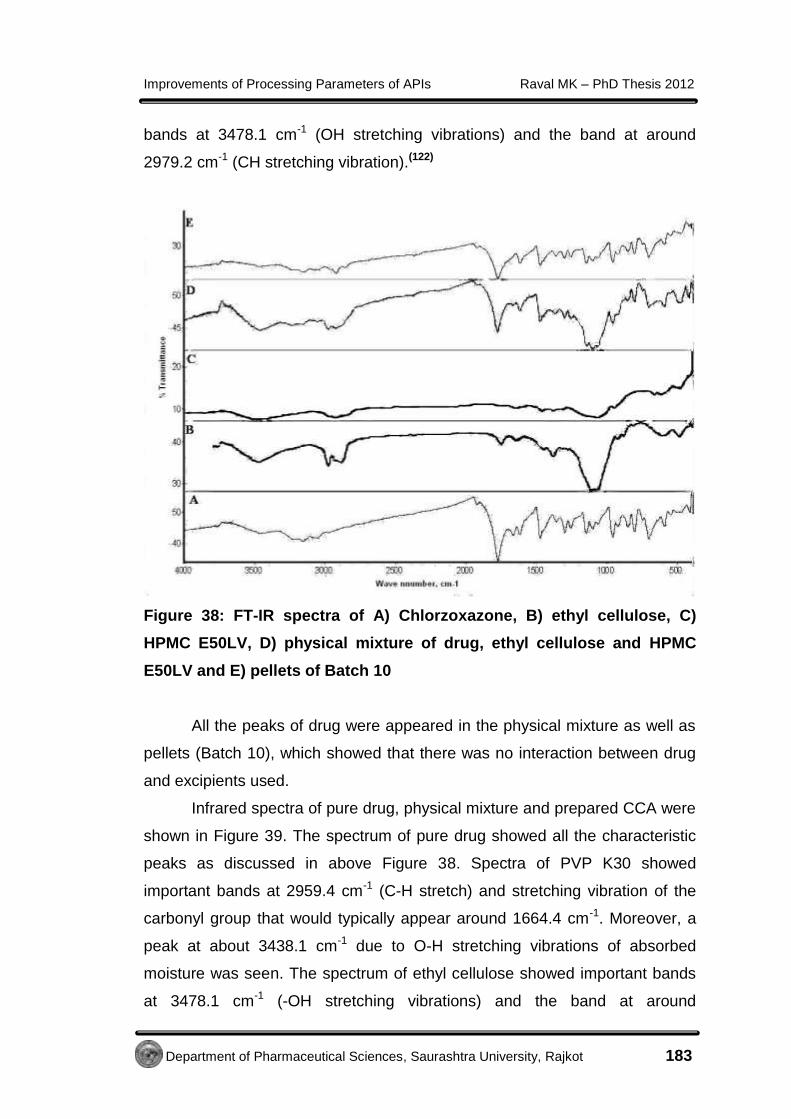
Improvements of Processing Parameters of APIs Raval MK – PhD Thesis 2012
Department of Pharmaceutical Sciences, Saurashtra University, Rajkot 183
bands at 3478.1 cm-1 (OH stretching vibrations) and the band at around
2979.2 cm-1 (CH stretching vibration).(122)
Figure 38: FT-IR spectra of A) Chlorzoxazone, B) ethyl cellulose, C)
HPMC E50LV, D) physical mixture of drug, ethyl cellulose and HPMC
E50LV and E) pellets of Batch 10
All the peaks of drug were appeared in the physical mixture as well as
pellets (Batch 10), which showed that there was no interaction between drug
and excipients used.
Infrared spectra of pure drug, physical mixture and prepared CCA were
shown in Figure 39. The spectrum of pure drug showed all the characteristic
peaks as discussed in above Figure 38. Spectra of PVP K30 showed
important bands at 2959.4 cm-1 (C-H stretch) and stretching vibration of the
carbonyl group that would typically appear around 1664.4 cm-1. Moreover, a
peak at about 3438.1 cm-1 due to O-H stretching vibrations of absorbed
moisture was seen. The spectrum of ethyl cellulose showed important bands
at 3478.1 cm-1 (-OH stretching vibrations) and the band at around

Improvements of Processing Parameters of APIs Raval MK – PhD Thesis 2012
Department of Pharmaceutical Sciences, Saurashtra University, Rajkot 184
2979. 2 cm-1 (-CH stretching vibration). All the peaks of drug were appeared in
the physical mixture as well as agglomerates (T-19), which showed that there
was no interaction between drug and excipients used.
Figure 39: FT-IR spectra of Chlorzoxazone and its CCA (T-19)
In case of coground samples of Chlorzoxazone, FT-IR spectroscopy
study of pure Chlorzoxazone in following Figure 40 showed the characteristic
peaks at 3146.68 cm-1 (N-H stretch), 3052.24 cm-1 (Aromatic Hydrocarbon),
1615.69 cm-1 (C=C Stretch), 732.09 cm-1 (C-Cl linkage). FT-IR spectra of PEG
4000 showed peaks at 2950-2750 cm-1 (C-H stretch) and 1466.34 cm-1 (C-H
bending) and 1350-1000 cm-1 (C-O stretching).

Improvements of Processing Parameters of APIs Raval MK – PhD Thesis 2012
Department of Pharmaceutical Sciences, Saurashtra University, Rajkot 185
Figure 40: FT-IR analysis of A) Chlorzoxazone pure drug, B) ground drug
after 3 h, C) ground drug after 6 h, D) PEG 4000, E) physical mixture of
drug: polymer in 1:3 ratio, F) coground drug with polymer in 1:3 ratio
after 3 h and G) coground drug with polymer in 1:3 ratio after 6 h.
From the above Figure 40, it was seen that all the peaks of
Chlorzoxazone were present in control batch, physical mixture and coground
drug in presence of polymer. Thus, it was concluded that there was no
chemical reaction found between drug and polymer. As well as, there was no
sign of any polymorphic changes.
4.3.9.14 Powder x-ray diffractometry (pXRD) of pellets, CCA and
coground samples of Chlorzoxazone
Powder X-ray diffraction pattern of Chlorzoxazone and prepared
samples were recorded as described in section 4.2.5.14.

Improvements of Processing Parameters of APIs Raval MK – PhD Thesis 2012
Department of Pharmaceutical Sciences, Saurashtra University, Rajkot 186
Pure drug showed its characteristic peaks with decrease in percent
relative intensity at 2 values of 19.92, 27.489, 12.825, 13.815, 25.233,
17.766 and 25.796, respectively. In case of pellets, x-ray powder diffraction
patterns of pure drug and the optimized batch in the 2θ range of 5˚ to 90˚
showed that the characteristic diffraction peaks of Chlorzoxazone were still
detectable in the pellets (Figure 41). This suggests that the particles
crystallized in the presence of excipients did not undergo structural
modifications. Intensities of characteristic peaks of drug were also reduced in
pellets, which might be due to differences in the crystallinity of the drug and
pellets.(123)
As shown in the Figure 41, all XRD peaks of the pellets were
consistent with the pattern of pure drug crystals, indicated that there was no
polymorphic changes or detection of drug-excipients incompatibility after
recrystallization.(124)
Figure 41: X-ray powder diffraction patterns for Chlorzoxazone pellets

Improvements of Processing Parameters of APIs Raval MK – PhD Thesis 2012
Department of Pharmaceutical Sciences, Saurashtra University, Rajkot 187
In CCA of Chlorzoxazone also, all XRD peaks were consistent with the
pattern of pure drug crystals, indicated that there was no polymorphic
changes or detection of drug-excipients incompatibility after
recrystallization.(124)
Figure 42: X-ray powder diffraction patterns for Chlorzoxazone CCA
In case of coground mixture of Chlorzoxazone, XRD of Chlorzoxazone
(CHLOR) revealed high intensity reflections with characteristic sharp peaks at
19.92, 27.49, 12.83, 13.82, 25.23, 17.77 and 25.79 (2). The peak at
19.92 (2) was used to compare the XRD patterns. PEG 4000 exhibited a
distinct pattern with diffraction peaks at 23.35 and 19.23 (2). The physical
mixture showed the characteristic peaks of the pure components at identical
angles, which proved that no interactions took place during mixing. All the
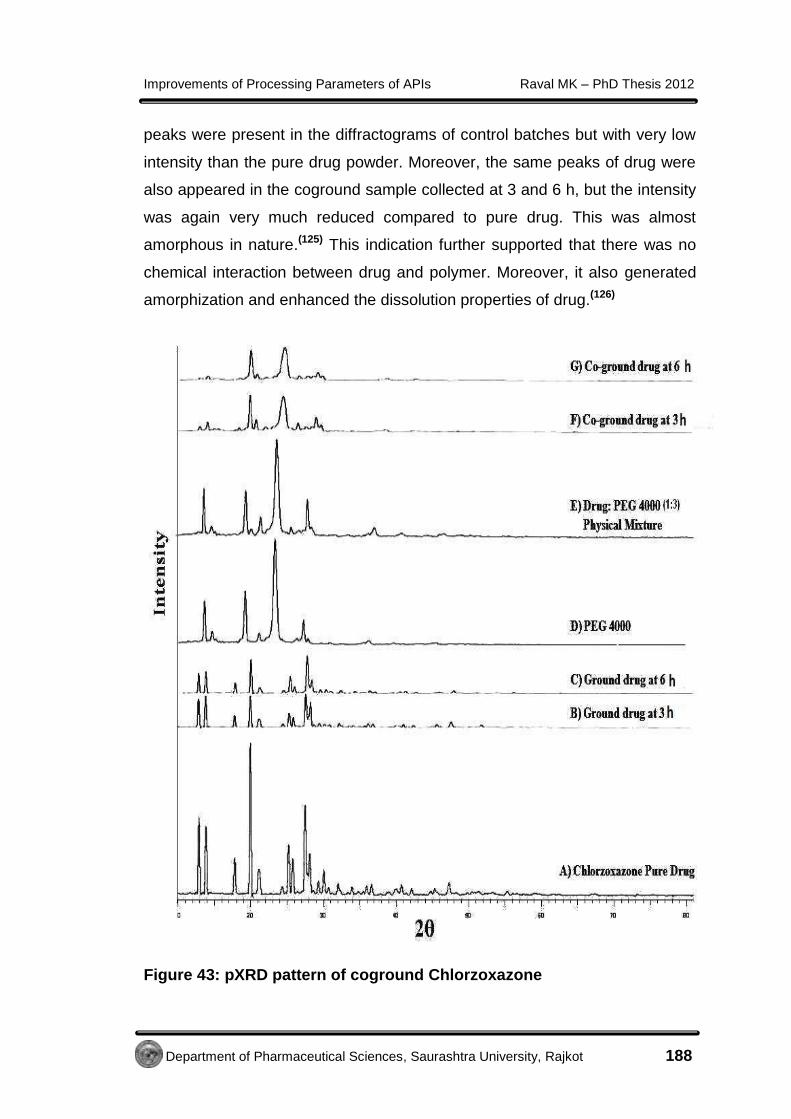
Improvements of Processing Parameters of APIs Raval MK – PhD Thesis 2012
Department of Pharmaceutical Sciences, Saurashtra University, Rajkot 188
peaks were present in the diffractograms of control batches but with very low
intensity than the pure drug powder. Moreover, the same peaks of drug were
also appeared in the coground sample collected at 3 and 6 h, but the intensity
was again very much reduced compared to pure drug. This was almost
amorphous in nature.(125) This indication further supported that there was no
chemical interaction between drug and polymer. Moreover, it also generated
amorphization and enhanced the dissolution properties of drug.(126)
Figure 43: pXRD pattern of coground Chlorzoxazone
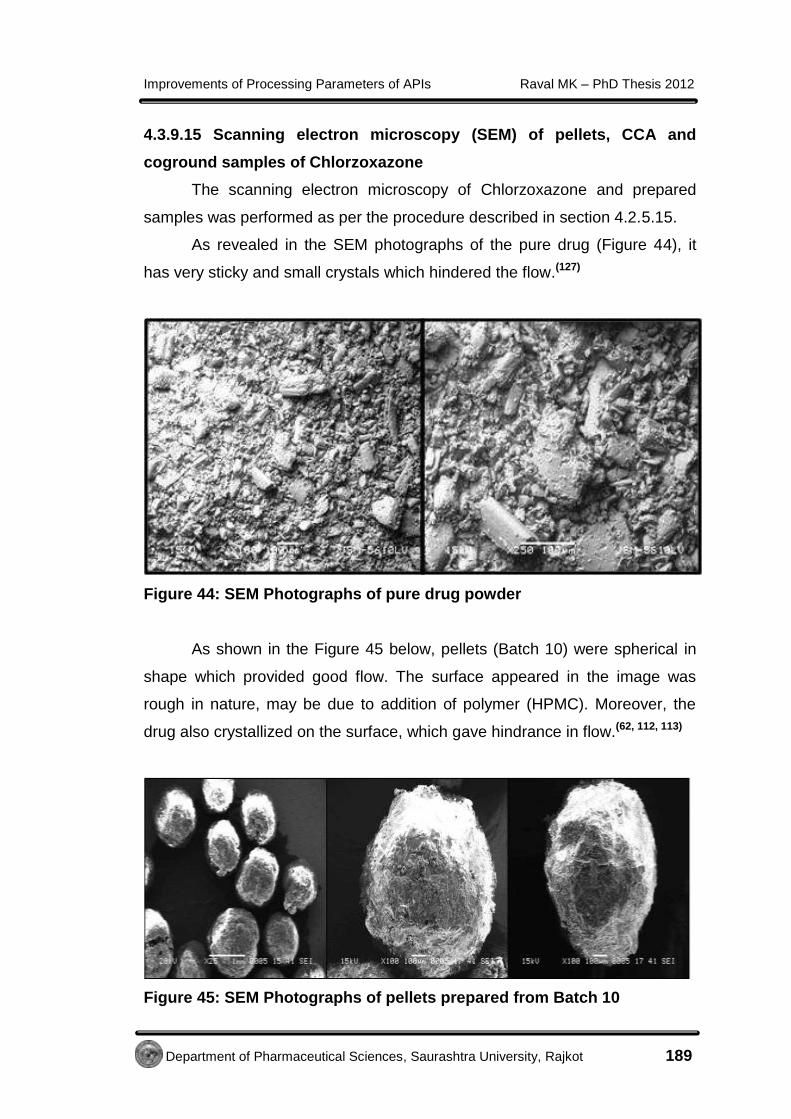
Improvements of Processing Parameters of APIs Raval MK – PhD Thesis 2012
Department of Pharmaceutical Sciences, Saurashtra University, Rajkot 189
4.3.9.15 Scanning electron microscopy (SEM) of pellets, CCA and
coground samples of Chlorzoxazone
The scanning electron microscopy of Chlorzoxazone and prepared
samples was performed as per the procedure described in section 4.2.5.15.
As revealed in the SEM photographs of the pure drug (Figure 44), it
has very sticky and small crystals which hindered the flow.(127)
Figure 44: SEM Photographs of pure drug powder
As shown in the Figure 45 below, pellets (Batch 10) were spherical in
shape which provided good flow. The surface appeared in the image was
rough in nature, may be due to addition of polymer (HPMC). Moreover, the
drug also crystallized on the surface, which gave hindrance in flow.(62, 112, 113)
Figure 45: SEM Photographs of pellets prepared from Batch 10

Improvements of Processing Parameters of APIs Raval MK – PhD Thesis 2012
Department of Pharmaceutical Sciences, Saurashtra University, Rajkot 190
Figure 46: SEM photographs of external surface of pellets prepared from
Batch 10
The major work of the polymer was to cover the external surface of the
pellets which could be seen from the SEM images (Figure 46). Figure 47
below is showing the broken pellet where, outer surface is smooth and inner
side of the pellets, bundles of drug crystals have been deposited.
Figure 47: Bundles of crystals inside the pellet (Batch 10)

Improvements of Processing Parameters of APIs Raval MK – PhD Thesis 2012
Department of Pharmaceutical Sciences, Saurashtra University, Rajkot 191
Figure 47 shows platy crystals inside the pellet, which is also
responsible for good compressibility of pellets.(89)
In case of SEM image of CCA, agglomerates from control batch
(Figure 48) showed very loose aggregation and rough surface with bundles of
needle like crystals, which also had very poor flow and compression
properties. The surfaces were comparatively smooth and aggregation was
good when additives like PVP K30, ethyl cellulose and PEG 400 were used
(Figure 49). Due to good agglomeration of crystals and smooth surface, the
CCA prepared with addition of additives had very good flow and compaction
properties as compared to pure drug as well as control batch. Also, the
agglomerates were very porous in nature, which increased an effective
surface area and exposure of inner surfaces to dissolution fluid and ultimately
improved the dissolution to a greater extent.
Figure 48: SEM photographs of control batch of Chlorzoxazone CCA
As shown in Figure 49, CCA are spherical in shape and uniformly
packed due to presence of polymers.
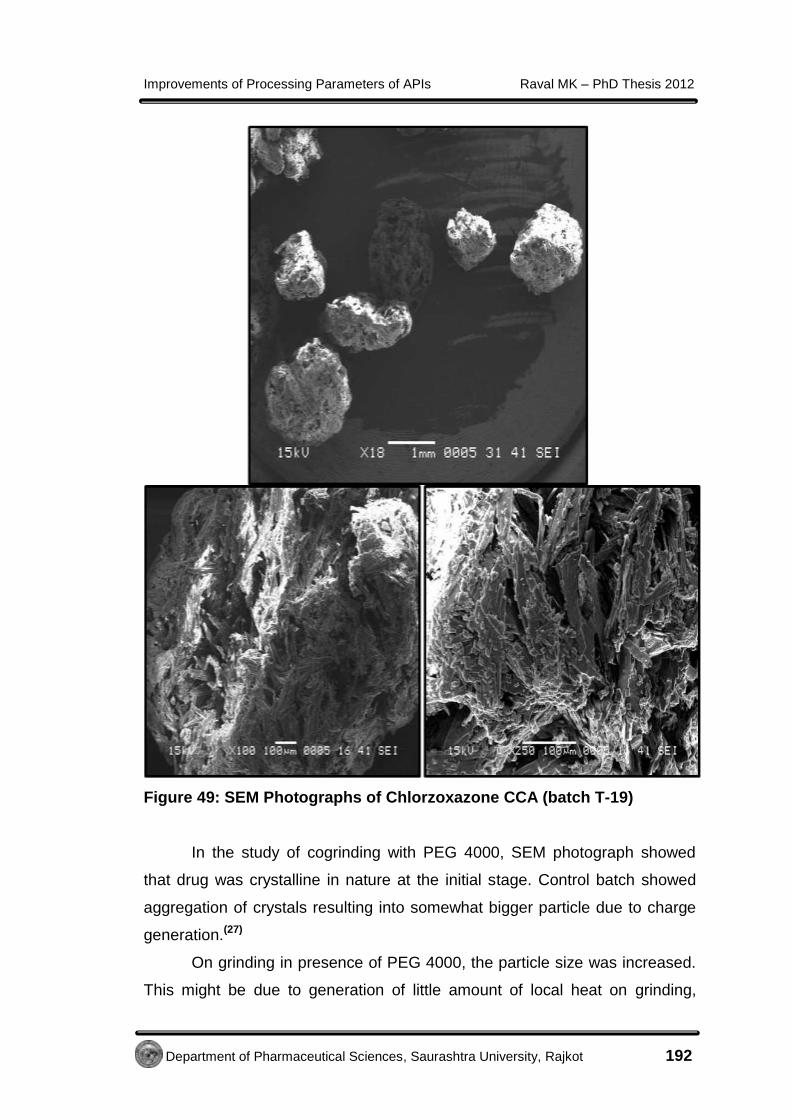
Improvements of Processing Parameters of APIs Raval MK – PhD Thesis 2012
Department of Pharmaceutical Sciences, Saurashtra University, Rajkot 192
Figure 49: SEM Photographs of Chlorzoxazone CCA (batch T-19)
In the study of cogrinding with PEG 4000, SEM photograph showed
that drug was crystalline in nature at the initial stage. Control batch showed
aggregation of crystals resulting into somewhat bigger particle due to charge
generation.(27)
On grinding in presence of PEG 4000, the particle size was increased.
This might be due to generation of little amount of local heat on grinding,
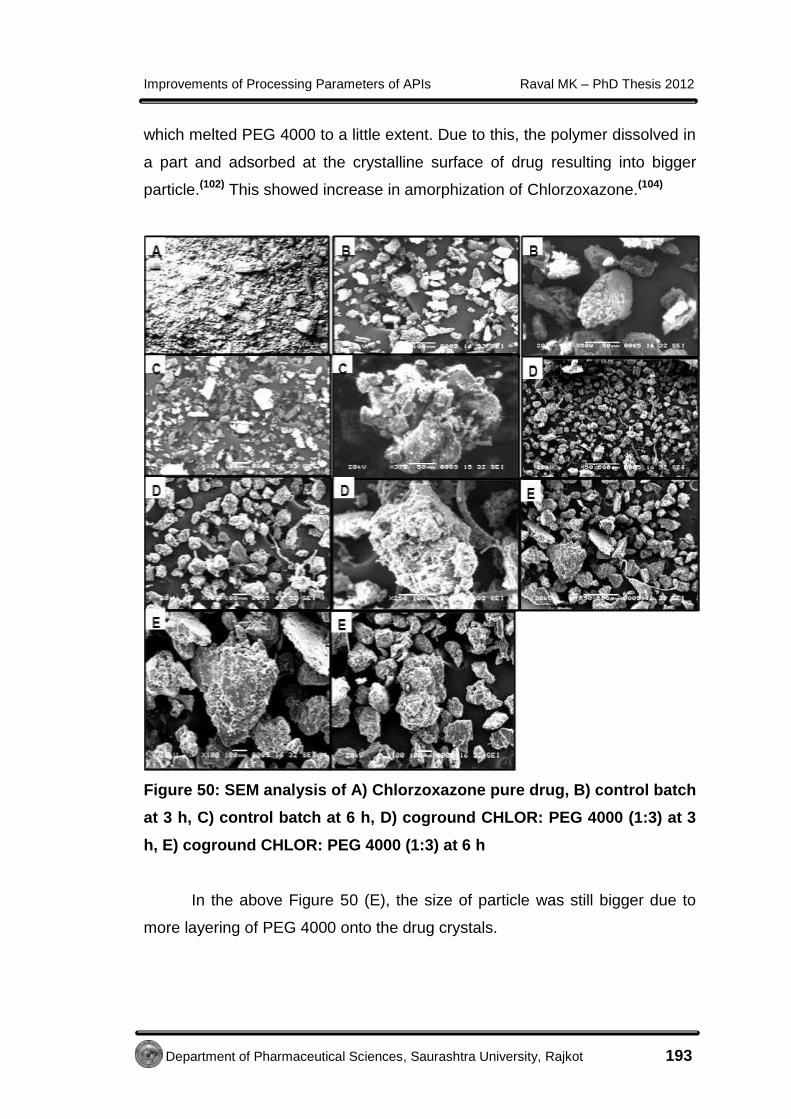
Improvements of Processing Parameters of APIs Raval MK – PhD Thesis 2012
Department of Pharmaceutical Sciences, Saurashtra University, Rajkot 193
which melted PEG 4000 to a little extent. Due to this, the polymer dissolved in
a part and adsorbed at the crystalline surface of drug resulting into bigger
particle.(102) This showed increase in amorphization of Chlorzoxazone.(104)
Figure 50: SEM analysis of A) Chlorzoxazone pure drug, B) control batch
at 3 h, C) control batch at 6 h, D) coground CHLOR: PEG 4000 (1:3) at 3
h, E) coground CHLOR: PEG 4000 (1:3) at 6 h
In the above Figure 50 (E), the size of particle was still bigger due to
more layering of PEG 4000 onto the drug crystals.

Improvements of Processing Parameters of APIs Raval MK – PhD Thesis 2012
Department of Pharmaceutical Sciences, Saurashtra University, Rajkot 194
4.3.10 PREPARATION OF DOSAGE FORM OF
CHLORZOXAZONE AND THEIR EVALUATION
4.3.10.1 Preparation of directly compressible tablets of CCA and
coground samples of Chlorzoxazone
Perusal from Table 42 to 44, it was confirmed that, CCA (batch T-19)
showed excellent tableting properties than pellets of batch 10. Moreover,
CCA showed very high crushing strength compared to pellets, which was an
indication of good handling property. Hence, out of CCA and pellets, CCA
was considered as an ideal to convert into formulation.
In case of coground mixture of drug: PEG 4000 (1:3) after 3 h grinding
also showed good tableting properties.
Hence, CCA from batch T-19 and coground mixture after 3 h were
considered for preparation of dosage form.
Tablets containing 500 mg equivalent to Chlorzoxazone (tablet for pure
drug and CCA) as well as ground mixture equivalent to 125 mg
Chlorzoxazone were prepared by direct compression using different
formulation excipients as shown in Table 45 and 46. CCA and coground
mixture were sieved to achieve similar particle size distribution (# 22 for CCA
and # 80 for coground sample) for each batch and other formulation
excipients were added into it. All the ingredients for tablets prepared from
CCA and coground mixture were weighed separately and mixed properly in
‘V’ cone blender.
The material for each tablet was weighed introduced manually into the
die and compressed in the tablet machine using round-shaped, 15 mm flat,
concave punch for CCA and 6 mm flat, round punch for coground mixture.
The tablets were prepared as per the procedure described in section 4.2.6.1.
Tablets prepared from CCA were containing very less amount of MCC
(Table 45), which was a considerable improvement in the properties of drug
for making directly compressible form. The formulations for tablets and its
evaluations are given in Table 48.

Improvements of Processing Parameters of APIs Raval MK – PhD Thesis 2012
Department of Pharmaceutical Sciences, Saurashtra University, Rajkot 195
Table 46: Formulation of directly compressible tablet of Chlorzoxazone
from CCA (Batch T-19)
Ingredients Pure drug CCA (T-19 Batch)
Chlorzoxazone, mg 500 532 mg (eq. to 500 mg drug)
PVP K-30, mg 16 --
Ethyl cellulose, mg 16 --
Kyron T-314, mg, (10%) 70 65
Magnesium stearate, mg, (1%) 7.0 6.5
Talc, mg, (2%) 14 13
Aerosil, mg, (0.5%) 3.5 3.25
MCC, mg 160 30.25
Total wt. of tablet, mg 780 650
At the same time, tablets from coground mixture were prepared using
ingredients given in Table 47. Here, PEG 4000 was a directly compressible
material undergoing plastic deformation. MCC was required only as a filler. At
the same time, directly compressible tablets of pure drug required a large
quantity of MCC for good hardness without lamination.
Table 47: Formulation of directly compressible tablet of Chlorzoxazone
from coground mixture (1: 3, % w/w)
Formulation Pure drug Coground mixture
(1:3, % w/w)
Chlorzoxazone, mg 125 511.67 mg (equivalent to 125
mg Chlorzoxazone)
Kyron T-314, mg, (10%) 12 65
Magnesium stearate, mg, (1%) 1.3 6.5
Talc, mg, (2%) 2.5 13
Aerosil, mg, (0.5%) 0.6 3.25
MCC, mg 75 50.58
Lactose, anhydrous, mg 33.6 --
Total wt. of tablet, mg 250 650

Improvements of Processing Parameters of APIs Raval MK – PhD Thesis 2012
Department of Pharmaceutical Sciences, Saurashtra University, Rajkot 196
4.3.10.2 Evaluation of tablets of Chlorzoxazone
Evaluation parameters were studied as per the procedure described in
sections from 4.2.6.2.1 to 4.2.6.2.5.
The evaluation parameters of prepared tablets are given in following
Table 48.
Table 48: Evaluation parameters of prepared tablets
Sr.
No. Parameters Tablets equivalent of drug from
Pure drug
(500 mg)
CCA
T-19
Pure drug
(125 mg)
Coground
mixture (1:3)
1 Hardness,
kg/cm2 ±
S.D.*
4.5 ± 0.31 7.6 ± 0.52 5.3 ± 0.67 6.8 ± 0.33
2 Friability, % 0.63 0.017 0.51 0.19
3 D.T., sec. ±
S.D.* 8.3 ± 1.23 19 ± 1.41 4.51 ± 1.33 5.26 ± 1.44
4 Diameter,
mm ± S.D.* 12.08 ± 0.004 12.05 ± 0.006 6.01 ± 0.005 6.07 ± 0.003
5 Thickness,
mm ± S.D.* 3.62 ± 0.055 3.37 ± 0.02 3.21 ± 0.01 3.19 ± 0.03
6 Wt.
variation,
mg ± S.D.*
777.2 ± 3.15 648.3 ± 2.56 248.3 ± 2.17 645.7 ± 3.51
* Indicates average of triplicate
4.3.11 DISSOLUTION AND KINETIC STUDY OF PELLETS, CCA
AND COGROUND SAMPLES OF CHLORZOXAZONE AND ITS
DOSAGE FORMS
4.3.11.1 In vitro dissolution of pellets, CCA and coground samples and
dosage forms of Chlorzoxazone
As per the procedure of dissolution study explained in section 4.2.7.1,
dissolution profiles of pure drug and prepared samples (Type – II) as well as
dosage forms (containing equivalent amount of API) (Type - I) were studied.
The dissolution medium was 900 ml buffer phosphate (pH 6.8) equilibrated to
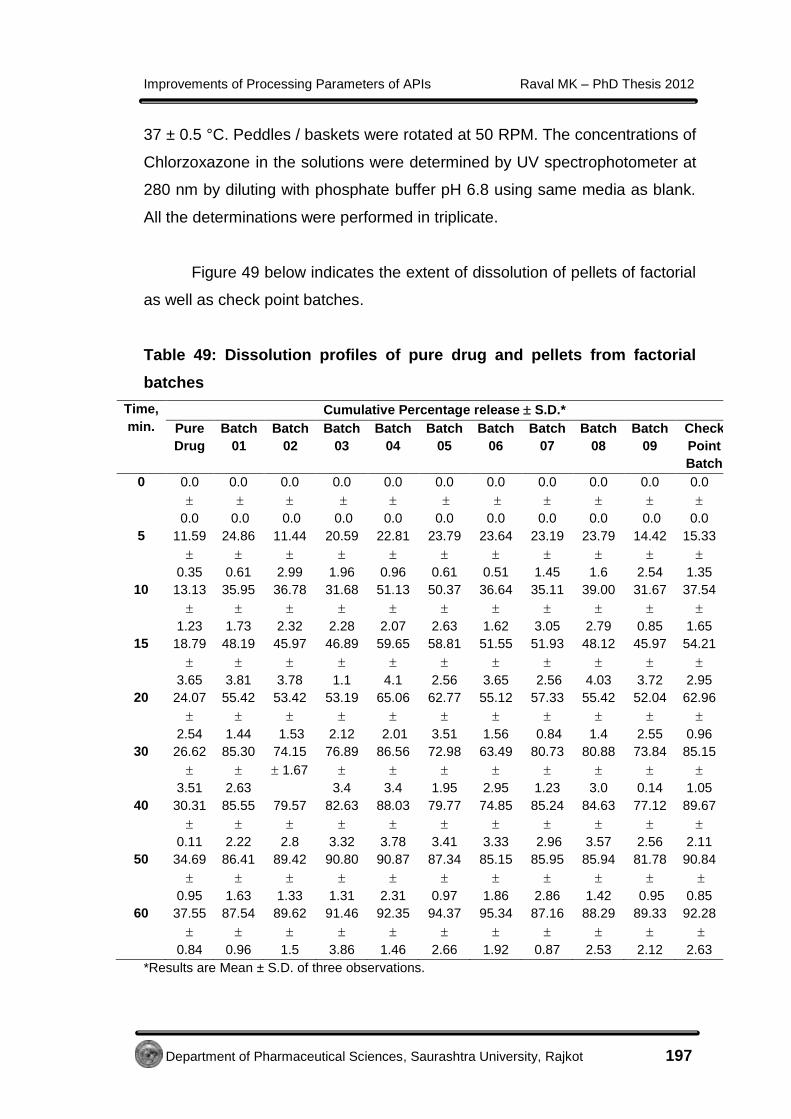
Improvements of Processing Parameters of APIs Raval MK – PhD Thesis 2012
Department of Pharmaceutical Sciences, Saurashtra University, Rajkot 197
37 ± 0.5 °C. Peddles / baskets were rotated at 50 RPM. The concentrations of
Chlorzoxazone in the solutions were determined by UV spectrophotometer at
280 nm by diluting with phosphate buffer pH 6.8 using same media as blank.
All the determinations were performed in triplicate.
Figure 49 below indicates the extent of dissolution of pellets of factorial
as well as check point batches.
Table 49: Dissolution profiles of pure drug and pellets from factorial
batches
Time,
min.
Cumulative Percentage release S.D.*
Pure
Drug
Batch
01
Batch
02
Batch
03
Batch
04
Batch
05
Batch
06
Batch
07
Batch
08
Batch
09
Check
Point
Batch
0 0.0
0.0
0.0
0.0
0.0
0.0
0.0
0.0
0.0
0.0
0.0
0.0
0.0
0.0
0.0
0.0
0.0
0.0
0.0
0.0
0.0
0.0
5 11.59
0.35
24.86
0.61
11.44
2.99
20.59
1.96
22.81
0.96
23.79
0.61
23.64
0.51
23.19
1.45
23.79
1.6
14.42
2.54
15.33
1.35
10 13.13
1.23
35.95
1.73
36.78
2.32
31.68
2.28
51.13
2.07
50.37
2.63
36.64
1.62
35.11
3.05
39.00
2.79
31.67
0.85
37.54
1.65
15 18.79
3.65
48.19
3.81
45.97
3.78
46.89
1.1
59.65
4.1
58.81
2.56
51.55
3.65
51.93
2.56
48.12
4.03
45.97
3.72
54.21
2.95
20 24.07
2.54
55.42
1.44
53.42
1.53
53.19
2.12
65.06
2.01
62.77
3.51
55.12
1.56
57.33
0.84
55.42
1.4
52.04
2.55
62.96
0.96
30 26.62
3.51
85.30
2.63
74.15
1.67
76.89
3.4
86.56
3.4
72.98
1.95
63.49
2.95
80.73
1.23
80.88
3.0
73.84
0.14
85.15
1.05
40 30.31
0.11
85.55
2.22
79.57
2.8
82.63
3.32
88.03
3.78
79.77
3.41
74.85
3.33
85.24
2.96
84.63
3.57
77.12
2.56
89.67
2.11
50 34.69
0.95
86.41
1.63
89.42
1.33
90.80
1.31
90.87
2.31
87.34
0.97
85.15
1.86
85.95
2.86
85.94
1.42
81.78
0.95
90.84
0.85
60 37.55
0.84
87.54
0.96
89.62
1.5
91.46
3.86
92.35
1.46
94.37
2.66
95.34
1.92
87.16
0.87
88.29
2.53
89.33
2.12
92.28
2.63
*Results are Mean ± S.D. of three observations.

Improvements of Processing Parameters of APIs Raval MK – PhD Thesis 2012
Department of Pharmaceutical Sciences, Saurashtra University, Rajkot 198
0 20 40 600
20
40
60
80
100
Pure Drug
Batch 01
Batch 02
Batch 03
Batch 04
Batch 05
Batch 06
Batch 07
Batch 08
Batch 09
Check point batch(batch 10)
Time, min.
CP
R
Figure 51: Cumulative percentage release for all factorial batches of
pellets, pure drug and check point batch
Perusal from the above Figure 51, it was shown that, all the batches of
pellets showed more than 85% drug release within one hour where as pure
drug showed only 37.55% drug release within one h. Reduced crystallinity
might be a reason for higher dissolution rate.(126) Check point batch showed
92.28% drug release after one hour.
In vitro dissolution study for the prepared CCA and pure drug was
performed using USP type II apparatus. Dissolution profile given in Figure 52
showed large improvement in the rate of drug release. Agglomerates from
batch T-19 showed more than 85% drug release within 30 min (Table 50).
This might be due to hydrophilic polymer inclusion in the formulation. The

Improvements of Processing Parameters of APIs Raval MK – PhD Thesis 2012
Department of Pharmaceutical Sciences, Saurashtra University, Rajkot 199
greater porosity of prepared CCA (as shown in SEM photos) was also
responsible for providing greater effective surface area and exposure of a
large surface to the dissolution media.(128) The solvent evaporation during
formation of CCA and attrition with the stirrer might attributed towards greater
porosity in the CCA.
The control batch of CCA could not show much improvement in
dissolution compared to pure drug.
Table 50: Dissolution profile data of Chlorzoxazone, CCA and its dosage
form
Time,
min.
Cumulative Percentage release S.D.*
Pure drug Control
batch
Batch
T-19
Tablet prepared from
(500 mg drug)
Pure drug T-19
0 0.0 0.0 0.0 0.0 0.0 0.0 0.0 0.0 0.0 0.0
5 11.59 0.35 13.81 1.37 20.21 0.96 12.91 2.35 34.58 0.89
10 13.13 1.23 18.72 2.56 35.12 2.07 16.51 4.18 60.57 2.56
15 18.79 3.65 22.61 0.98 51.93 4.1 21.89 3.08 75.35 2.28
20 24.07 2.54 29.43 2.64 54.65 2.01 25.12 2.53 87.94 4.79
30 26.62 3.51 34.64 1.59 88.04 3.4 31.95 0.57 91.59 0.51
40 30.31 0.11 44.98 3.22 91.96 3.78 34.56 1.78 93.09 0.69
50 34.69 0.95 47.09 1.02 96.79 2.31 35.75 0.37 96.52 0.99
60 37.55 0.84 51.11 1.21 98.27 2.99 36.71 0.72 98.89 0.74
*Results are Mean ± S.D. of three observations.

Improvements of Processing Parameters of APIs Raval MK – PhD Thesis 2012
Department of Pharmaceutical Sciences, Saurashtra University, Rajkot 200
0 20 40 600
20
40
60
80
100
Pure Drug
T-19 CCA Control batch
Pure drug tablet
T-19 tablet
Time, min.
CP
R
Figure 52: Dissolution profile of Chlorzoxazone, optimized CCA and
dosage form
In case of cogrinding of drug with PEG 4000 (1:3), dissolution profile
was studied every hour while grinding till the constant rate of dissolution
achieved. From the dissolution profile, it was seen that, after 3 h grinding, an
increment in rate of dissolution was almost negligible. Hence, dissolution after
3 h and 6 h were selected for further calculations.
The results are given in following Table 51.
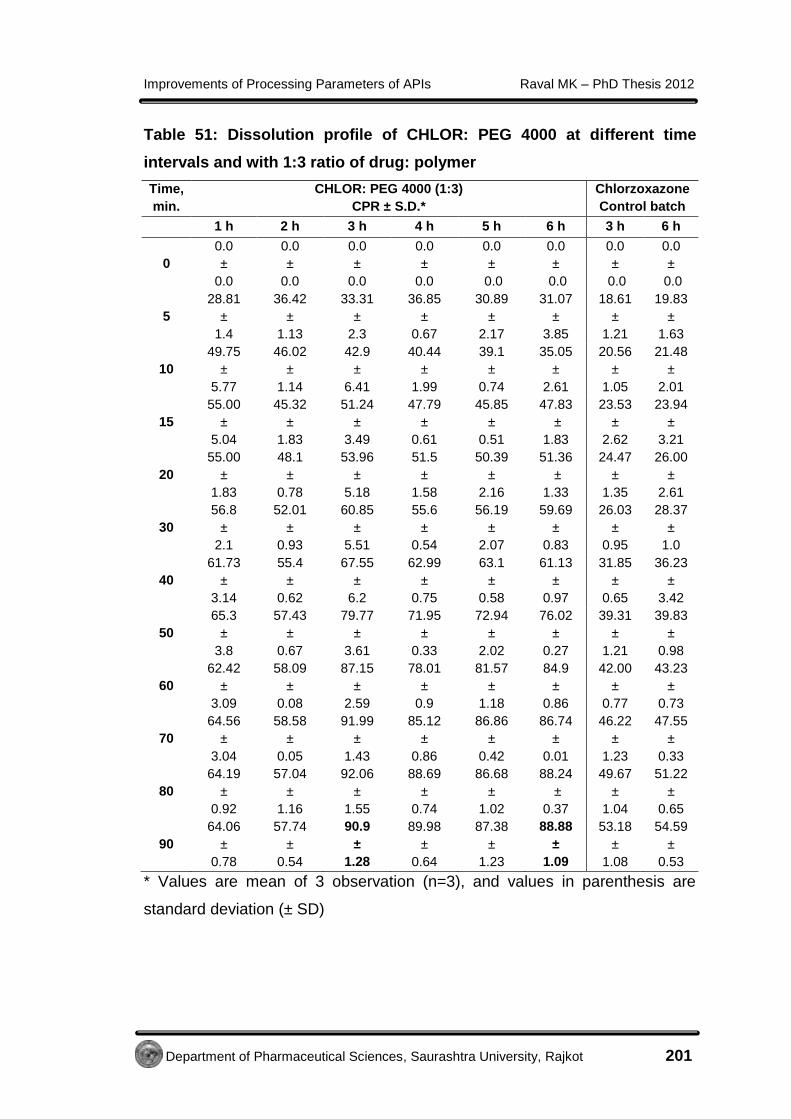
Improvements of Processing Parameters of APIs Raval MK – PhD Thesis 2012
Department of Pharmaceutical Sciences, Saurashtra University, Rajkot 201
Table 51: Dissolution profile of CHLOR: PEG 4000 at different time
intervals and with 1:3 ratio of drug: polymer
Time,
min.
CHLOR: PEG 4000 (1:3)
CPR ± S.D.*
Chlorzoxazone
Control batch
1 h 2 h 3 h 4 h 5 h 6 h 3 h 6 h
0
0.0
±
0.0
0.0
±
0.0
0.0
±
0.0
0.0
±
0.0
0.0
±
0.0
0.0
±
0.0
0.0
±
0.0
0.0
±
0.0
5
28.81
±
1.4
36.42
±
1.13
33.31
±
2.3
36.85
±
0.67
30.89
±
2.17
31.07
±
3.85
18.61
±
1.21
19.83
±
1.63
10
49.75
±
5.77
46.02
±
1.14
42.9
±
6.41
40.44
±
1.99
39.1
±
0.74
35.05
±
2.61
20.56
±
1.05
21.48
±
2.01
15
55.00
±
5.04
45.32
±
1.83
51.24
±
3.49
47.79
±
0.61
45.85
±
0.51
47.83
±
1.83
23.53
±
2.62
23.94
±
3.21
20
55.00
±
1.83
48.1
±
0.78
53.96
±
5.18
51.5
±
1.58
50.39
±
2.16
51.36
±
1.33
24.47
±
1.35
26.00
±
2.61
30
56.8
±
2.1
52.01
±
0.93
60.85
±
5.51
55.6
±
0.54
56.19
±
2.07
59.69
±
0.83
26.03
±
0.95
28.37
±
1.0
40
61.73
±
3.14
55.4
±
0.62
67.55
±
6.2
62.99
±
0.75
63.1
±
0.58
61.13
±
0.97
31.85
±
0.65
36.23
±
3.42
50
65.3
±
3.8
57.43
±
0.67
79.77
±
3.61
71.95
±
0.33
72.94
±
2.02
76.02
±
0.27
39.31
±
1.21
39.83
±
0.98
60
62.42
±
3.09
58.09
±
0.08
87.15
±
2.59
78.01
±
0.9
81.57
±
1.18
84.9
±
0.86
42.00
±
0.77
43.23
±
0.73
70
64.56
±
3.04
58.58
±
0.05
91.99
±
1.43
85.12
±
0.86
86.86
±
0.42
86.74
±
0.01
46.22
±
1.23
47.55
±
0.33
80
64.19
±
0.92
57.04
±
1.16
92.06
±
1.55
88.69
±
0.74
86.68
±
1.02
88.24
±
0.37
49.67
±
1.04
51.22
±
0.65
90
64.06
±
0.78
57.74
±
0.54
90.9
±
1.28
89.98
±
0.64
87.38
±
1.23
88.88
±
1.09
53.18
±
1.08
54.59
±
0.53
* Values are mean of 3 observation (n=3), and values in parenthesis are
standard deviation (± SD)

Improvements of Processing Parameters of APIs Raval MK – PhD Thesis 2012
Department of Pharmaceutical Sciences, Saurashtra University, Rajkot 202
0 20 40 60 800
20
40
60
80
100
Pure drug 1 hr 2 hr 3 hr 4 hr
5 hr 6 hr Control batch 3 hr Control batch 6 hr
Time, min.
CP
R
Figure 53: Comparative In-vitro drug release profile at different time
intervals of pure drug, control batch and coground sample
The above Figure 53 indicat that, dissolution rate was enhanced to
90% within an hour from the sample collected after 3 h grinding with PEG
4000. Further grinding did not increase the rate of drug dissolution, hence,
grinding of drug with PEG 4000 for 3 h was considered the best sample for
formulation as it also showed good physico-mechanical properties.

Improvements of Processing Parameters of APIs Raval MK – PhD Thesis 2012
Department of Pharmaceutical Sciences, Saurashtra University, Rajkot 203
Table 52: Dissolution profile of pure drug, ground mixture (1:3) after 3 h
and its dosage form
Time,
min.
Cumulative Percentage release S.D.*
Pure drug
Physical
mixture
(1:3 ratio)
Grinding for
3 h
Tablet prepared from
(125 mg drug)
Pure drug Grinding for
3 h
0 0.0 0.0 0.0 0.0 0.0 ± 0.0 0.0 ± 0.0 0.0 0.0
5 11.59 0.35 12.36 0.45 33.31 ± 2.3 10.29 ± 0.21 26.85 ± 0.35
10 13.13 1.23 14.20 0.96 42.9 ± 6.41 11.15 ± 0.52 55.86 ± 1.23
15 18.79 3.65 19.48 3.55 51.24 ± 3.49 14.44 ± 1.25 70.87 ± 3.65
20 24.07 2.54 29.49 1.54 53.96 ± 5.18 16.13 ± 1.04 82.09 ± 2.54
30 26.62 3.51 32.27 3.75 60.85 ± 5.51 21.79 ± 0.15 86.60 ± 3.51
40 30.31 0.11 36.65 2.11 67.55 ± 6.2 24.41 ± 0.56 91.58 ± 0.11
50 34.69 0.95 39.13 1.55 79.77 ± 3.61 30.46 ± 1.06 93.36 ± 0.95
60 37.55 0.84 45.20 1.84 87.15 ± 2.59 32.25 ± 1.03 93.77 ± 0.84
*Results are Mean ± S.D. of three observations.
The above Table 52 suggest that, tablets prepared from coground
mixture also showed more than 90% drug release within one hour. Whereas,
tablets prepared from pure drug showed only 32% drug release at the end of
one hour. Moreover, physical mixture of drug and PEG 4000 showed only
45% drug release after one hour. It indicated that, drug was influenced by
cogrinding with polymer and converted into amorphous form, which resulted in
a higher release rate.(129)
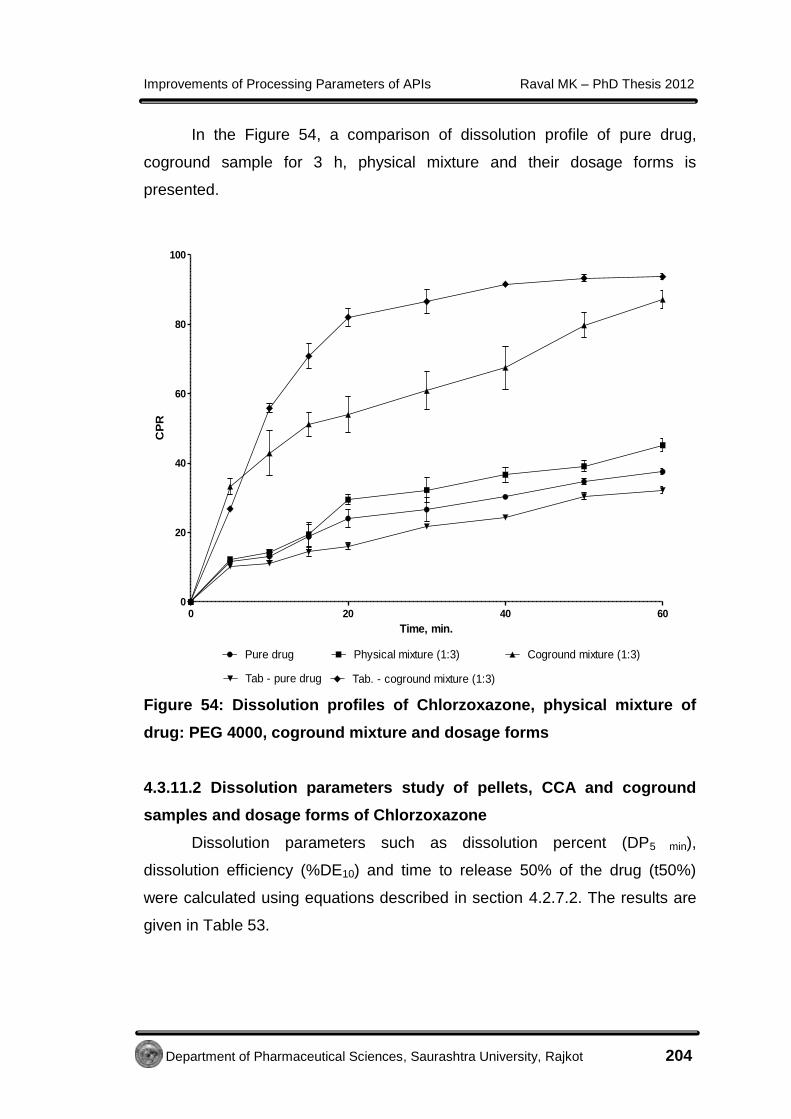
Improvements of Processing Parameters of APIs Raval MK – PhD Thesis 2012
Department of Pharmaceutical Sciences, Saurashtra University, Rajkot 204
In the Figure 54, a comparison of dissolution profile of pure drug,
coground sample for 3 h, physical mixture and their dosage forms is
presented.
0 20 40 600
20
40
60
80
100
Pure drug Physical mixture (1:3) Coground mixture (1:3)
Tab - pure drug Tab. - coground mixture (1:3)
Time, min.
CP
R
Figure 54: Dissolution profiles of Chlorzoxazone, physical mixture of
drug: PEG 4000, coground mixture and dosage forms
4.3.11.2 Dissolution parameters study of pellets, CCA and coground
samples and dosage forms of Chlorzoxazone
Dissolution parameters such as dissolution percent (DP5 min),
dissolution efficiency (%DE10) and time to release 50% of the drug (t50%)
were calculated using equations described in section 4.2.7.2. The results are
given in Table 53.
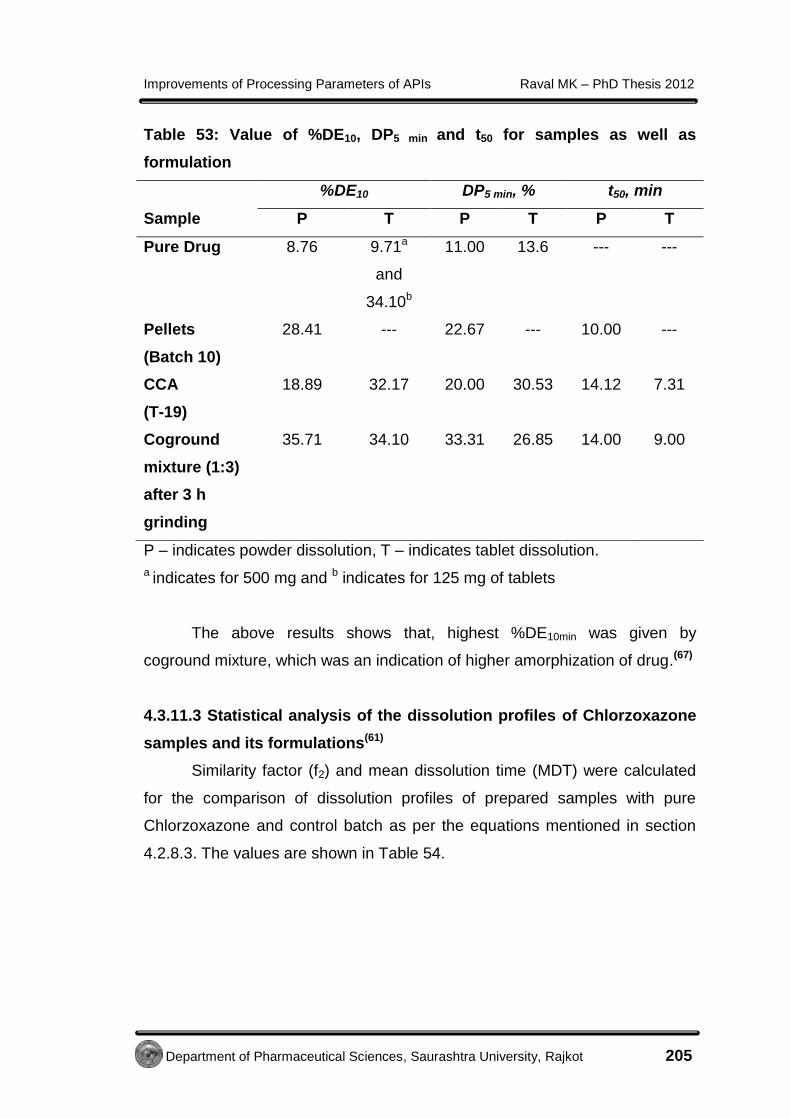
Improvements of Processing Parameters of APIs Raval MK – PhD Thesis 2012
Department of Pharmaceutical Sciences, Saurashtra University, Rajkot 205
Table 53: Value of %DE10, DP5 min and t50 for samples as well as
formulation
%DE10 DP5 min, % t50, min
Sample P T P T P T
Pure Drug 8.76 9.71a
and
34.10b
11.00 13.6 --- ---
Pellets
(Batch 10)
28.41 --- 22.67 --- 10.00 ---
CCA
(T-19)
18.89 32.17 20.00 30.53 14.12 7.31
Coground
mixture (1:3)
after 3 h
grinding
35.71 34.10 33.31 26.85 14.00 9.00
P – indicates powder dissolution, T – indicates tablet dissolution.
a indicates for 500 mg and b indicates for 125 mg of tablets
The above results shows that, highest %DE10min was given by
coground mixture, which was an indication of higher amorphization of drug.(67)
4.3.11.3 Statistical analysis of the dissolution profiles of Chlorzoxazone
samples and its formulations(61)
Similarity factor (f2) and mean dissolution time (MDT) were calculated
for the comparison of dissolution profiles of prepared samples with pure
Chlorzoxazone and control batch as per the equations mentioned in section
4.2.8.3. The values are shown in Table 54.
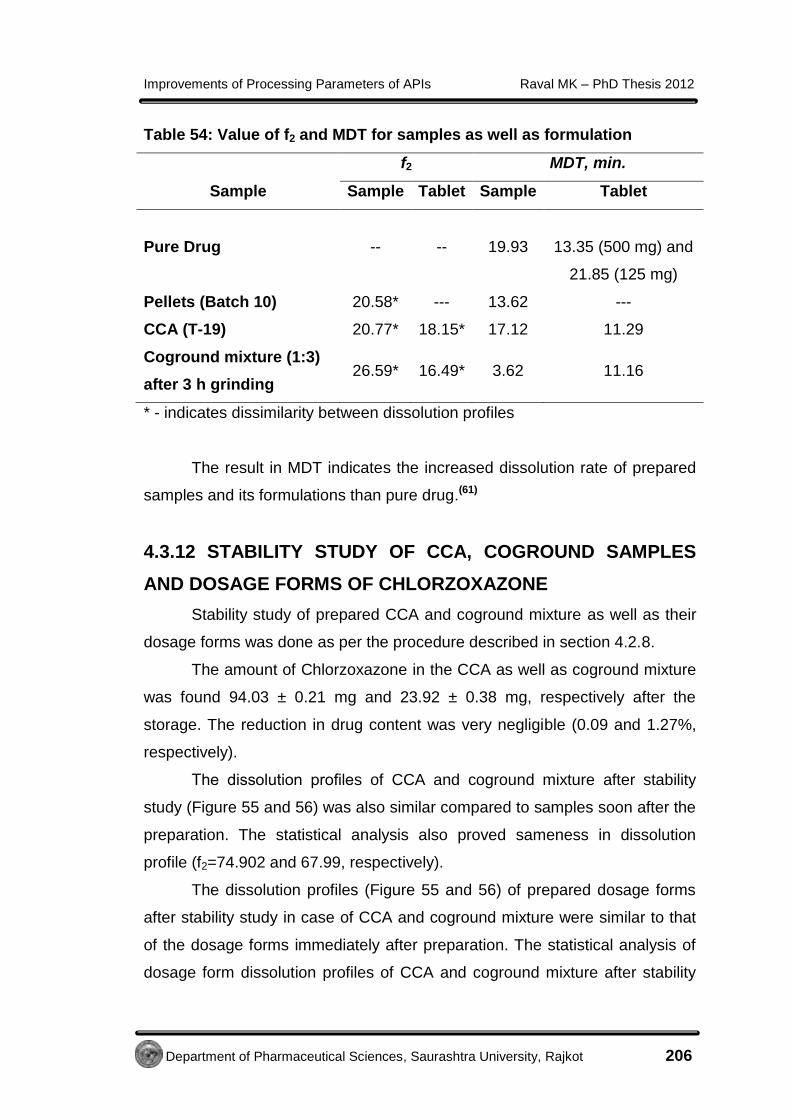
Improvements of Processing Parameters of APIs Raval MK – PhD Thesis 2012
Department of Pharmaceutical Sciences, Saurashtra University, Rajkot 206
Table 54: Value of f2 and MDT for samples as well as formulation
f2 MDT, min.
Sample Sample Tablet Sample Tablet
Pure Drug -- -- 19.93
13.35 (500 mg) and
21.85 (125 mg)
Pellets (Batch 10) 20.58* --- 13.62 ---
CCA (T-19) 20.77* 18.15* 17.12 11.29
Coground mixture (1:3)
after 3 h grinding 26.59* 16.49* 3.62 11.16
* - indicates dissimilarity between dissolution profiles
The result in MDT indicates the increased dissolution rate of prepared
samples and its formulations than pure drug.(61)
4.3.12 STABILITY STUDY OF CCA, COGROUND SAMPLES
AND DOSAGE FORMS OF CHLORZOXAZONE
Stability study of prepared CCA and coground mixture as well as their
dosage forms was done as per the procedure described in section 4.2.8.
The amount of Chlorzoxazone in the CCA as well as coground mixture
was found 94.03 ± 0.21 mg and 23.92 ± 0.38 mg, respectively after the
storage. The reduction in drug content was very negligible (0.09 and 1.27%,
respectively).
The dissolution profiles of CCA and coground mixture after stability
study (Figure 55 and 56) was also similar compared to samples soon after the
preparation. The statistical analysis also proved sameness in dissolution
profile (f2=74.902 and 67.99, respectively).
The dissolution profiles (Figure 55 and 56) of prepared dosage forms
after stability study in case of CCA and coground mixture were similar to that
of the dosage forms immediately after preparation. The statistical analysis of
dosage form dissolution profiles of CCA and coground mixture after stability

Improvements of Processing Parameters of APIs Raval MK – PhD Thesis 2012
Department of Pharmaceutical Sciences, Saurashtra University, Rajkot 207
study also proved sameness (f2=84.28 and 88.16, respectively) with their
respective dosage forms before stability study.
Figure 55: Dissolution profiles of batch T-19 and its formulation before
and after stability testing
Figure 56: Dissolution profiles of coground sample and its formulation
before and after stability testing
FTIR Analysis

Improvements of Processing Parameters of APIs Raval MK – PhD Thesis 2012
Department of Pharmaceutical Sciences, Saurashtra University, Rajkot 208
Figure 57: FT-IR study (CCA) for stability after 3 months of storage at 40
°C/ 75% RH
From the Figure 57 and 58, it is observed that there is no significant
difference in the FT-IR spectra before and after stability study of CCA as well
as coground mixture, respectively. Thus, it is confirmed that no physical and
chemical interaction occurred during the stability study in the samples.
Figure 58: FT-IR study (coground mixture) for stability after 3 months of
storage at 40 °C/ 75% RH
DSC spectra
DSC spectra of CCA and coground mixture further proved that, there
was no interaction occurred between drug and polymers during stability
periods. Figure 59 shows DSC spectra before and after stability study of CCA.

Improvements of Processing Parameters of APIs Raval MK – PhD Thesis 2012
Department of Pharmaceutical Sciences, Saurashtra University, Rajkot 209
Figure 59: DSC spectra of CCA for stability after 3 months of storage at
40 °C/ 75% RH
Figure 60 below is the comparison of DSC of coground mixture before
and after stability study.
Figure 60: DSC Spectra of Co-ground mixture before and after stability
testing after 3 months of storage at 40 °C/ 75% RH
From the above findings for CCA (Batch 19) and coground mixture of
drug: PEG 4000 (1:3, % w/w), it was suggested that, drug was in a stable
form into the prepared samples as well as dosage forms too.

Improvements of Processing Parameters of APIs Raval MK – PhD Thesis 2012
Department of Pharmaceutical Sciences, Saurashtra University, Rajkot 210
4.4 BIBLIOGRAPHY
1. Patel RP, Dave BS, Amin AF, Patel MM, Patel JK, Patel JR, Patel SR.
(2005). Modeling and comparison of dissolution profiles of commercial
Metformin HCL sustained release tablets. Drug Del Tech, 5. Available
through electronic version.
2. Raval MK, Bagda AA, Patel JM, Paun JS, Chaudhari KR, Sheth NR.
(2010). Preparation and evaluation of sustained release nimesulide
microspheres using response surface methodology. J Pharm Res, 3 581-
586.
3. Zhang GZ, Zhou D. (2009). In Developing Solid Oral Dosage Forms:
Pharmaceutical Theory and Practice. Burlington: Academic Press, pp 1-
403.
4. Shan N, Zaworotko MJ. (2008). The role of cocrystals in pharmaceutical
science. Drug Discovery Today, 13, 440–446.
5. Gao Y. (2010). Pharmaceutical cocrystals. ChemProg, 22, 829–836.
6. Fleischman SG, Kuduva SS, McMahon JA, Moulton B, Walsh RDB,
Rodriguez-Hornedo N, Zaworotko MJ. (2003). Crystal engineering of the
composition of pharmaceutical phases: multiple component crystalline
solids involving carbamazepine. Cryst Growth Des, 3, 909-919.
7. Hickey MB. (2007). Performance comparison of a co-crystal of
carbamazepine with marketed product. Eur J Pharm Biopharm, 67, 112–
119.
8. Rodriguez-Hornedo N. (2007) Cocrystals: Design, Properties, and
Formation Mechanisms. Encyclopedia of Pharmaceutical Technology,
New York: Informa Healthcare, USA, pp. 615–635.
9. Ibrahim AY, Forbes RT, Blagden N. (2011). Spontaneous crystal growth
of co-crystals: the contribution of particle size reduction and convection
mixing of the co-formers. Cryst Eng Commun, 13, 1141-1152. 10. Blagden N, Matas M, Gavan PT, York P. (2007). Crystal engineering of
active pharmaceutical ingredients to improve solubility and dissolution
rates. Adv Drug Delivery Rev, 59, 617-630.

Improvements of Processing Parameters of APIs Raval MK – PhD Thesis 2012
Department of Pharmaceutical Sciences, Saurashtra University, Rajkot 211
11. Elchidana PA, Deshpande SG. (1999). Microporous membrane drug
delivery system for indomethacin. J Controlled Release, 59, 279-285.
12. Chatlapalli R, Rohera BD. (1998). Physical characterization of HPMC
and HEC and investigation of their use as pelletization aids. Int J Pharm,
161, 179-193.
13. Prabakaran L, Prushothaman M, Sriganesan P. (2009). Pharmaceutical
micropellets: an overview, Pharmainfo.net, 7(4).
14. Harris MR, Sellassie IG. Formulation Variables. In: Pharmaceutical
Pelletization Technology, New York, Marcel Dekker Inc., 1989, pp 218.
15. Gupta BK, Pal R, Chakraborty M, Debnath R. (2009). Design, evaluation
and optimization of microcapsules of leflunomide with eudragit® RL100
and eudragit® RS100 by solvent evaporation technique. Asian J Pharm,
3, 309-313.
16. Pawar AP, Paradkar AR, Kadam SS, Mahadik KR. (2004a).
Agglomeration of ibuprofen with talc by novel crystallo-co-agglomeration
technique. AAPSPharmSciTech, 5, 30-35.
17. Pawar AP, Paradkar AR, Kadam SS, Mahadik KR. (2004b). Crystallo-co-
agglomeration: a novel process to obtain ibuprofen-paracetamol
agglomerates. AAPS PharmSciTech, 5, 57-64.
18. Maghsoodi M, Taghizadeh O, Martin GP, Nokhodchi A. (2008). Particle
design of naproxen-disintegrant agglomerates for direct compression by
a crystallo-co-agglomeration technique. Int J Pharm, 351, 45–54.
19. Jadhav NR. (1998). Studies on agglomerates of bromhexine
hydrochloride loaded talc prepared by crystallo-co-agglomeration
[master’s thesis], University of Pune.
20. Kale VV, Gadekar S, Ittadwar AM. (2011). Particle size enlargement:
making and understanding of the behavior of powder (particle) system.
Systematic Reviews in Pharmacy, 2, 79-85.
21. Kadam SS, Mahadik KR, Paradkar AR. (1997). A process for making
agglomerates for use as or in a drug delivery system. Indian Patent
183036.

Improvements of Processing Parameters of APIs Raval MK – PhD Thesis 2012
Department of Pharmaceutical Sciences, Saurashtra University, Rajkot 212
22. Nokhodchi A, Maghsoodi M, Hassan-zadeh D, Barzegar-Jalali M. (2007).
Preparation of agglomerated crystals for improving flowability and
compactibility of poorly flowable and compactable drugs and excipients.
Powder Technol, 175, 73–81.
23. Jadhav NR, Pawar AP, Paradkar AR. (2007). Design and evaluation of
deformable talc agglomerates prepared by crystallo-co-agglomeration
technique for generating heterogenous matrix. AAPS PharmSciTech, 8,
E61-E67.
24. Dinh LQ, Van LN. (2008). Formulation of rapid-released tablets
containing paracetamol and ibuprofen. Tap Chi Duoc Hoc, 48, 10-13.
25. Muatlik S, Usha AN, Reddy MS, Ranjith AK, Pandey S. (2007). Improved
bioavailability of aceclofenac from spherical agglomerates: development,
in vitro and preclinical studies. Pak J Pharm Sci, 20, 218-226.
26. Patterson JE, James MB, Forster AH, Lancaster RW, Butler JM, Rades
T. (2007). Preparation of glass solutions of three poorly water soluble
drugs by spray drying, melt extrusion and ball milling. Int J Pharm, 336,
22–34.
27. Subrahmanyam CVS. (2010). Essentials of Physical Pharmacy. 1st Edn.,
Vallabh Prakashan, New Delhi, pp. 127.
28. Choil WS, Kwak SS, Kim HI. (2006). Improvement of bioavailability of
water insoluble drugs: potential of nano-sized grinding technique. Asian J
Pharm Sci, 1, 27-30.
29. Yamamoto K, Nakano M, Arita T, Nakai Y. (1974). Dissolution rate and
bioavailability of griseofulvin a ground mixture with microcrystalline
cellulose. J Pharmacokinet Biopharm, 2, 487-493.
30. Morita M, Nakai Y, Fukuoka E, Nakajima S. (1984). Physicochemical
properties of crystalline lactose. II. Effect of crystallinity on mechanical
and structural properties. Chem Pharm Bull, 32, 4076-4083.
31. Pirttimaki J, laine E, Ketolainen J, Paranen P. (1993). Effect of grinding
and compression on crystal structure of anhydrous caffeine. Int J Pharm,
95, 93-99.

Improvements of Processing Parameters of APIs Raval MK – PhD Thesis 2012
Department of Pharmaceutical Sciences, Saurashtra University, Rajkot 213
32. Piyarom S, Yonemochi E, Oguchi T, Yamamoto K. (1997). Effect of
grinding and humidification on transformation of conglomerate to recemic
compound in optically active compounds. J Pharm Pharmcol, 49, 384-
389.
33. Friedrich H, Nada A, Bodmeier R. (2005). Solid state and dissolution rate
characterization of co-ground mixtures of nifedipine and hydrophilic
carriers. Drug Dev Ind Pharm, 31, 719–728.
34. Matsumoto T, Zografi G. (1999). Physical properties of solid molecular
dispersions of indomethacin with poly (vinylpyrrolidone) and poly(vinyl
pyrrolidone-co-vinyl-acetate) in relation to indomethacin crystallization.
Pharm Res,16, 1722–1728.
35. Vadher AM, Parikh JR, Parikh RH, Solanki AB. (2009). Preparation and
characterization of co-grinded mixtures of aceclofenac and neusilin US2
for dissolution enhancement of aceclofenac. AAPS PharmSciTech, 10,
606-614.
36. Zhang L, Chai G, Zeng X, He H, Xu H, Tang X. (2010). Preparation of
fenofibrate immediate-release tablets involving wet grinding for improved
bioavailability. Drug Dev Ind Pharm, 36, 1054–1063.
37. Basalious EB, Shawky N, Badr-Eldin SM. (2010). SNEDDS containing
bioenhancers for improvement of dissolution and oral absorption of
lacidipine. I: development and optimization. Int J Pharm, 391, 203–211.
38. Aulton’s ME. (2007). Pharmaceutics: the design and manufacture of
medicines. 3rd Edn., Churchill Livingstone, London, 13, p176.
39. Vela MT, Fernandes AM, Rabasco AM. (1990). Rheological study of
lactose coated with acrylic resins. Drug Dev Ind Pharm, 16, 295-300.
40. Lachman L, Libermann HA, Kanig JL. (1991). The Theory and Practice
of Industrial Pharmacy, 3rd Edn., Varghese Publishing House, Bombay,
480-481.
41. Martin A, Swarbrick J, Cammarata A. (1991). Physical Pharmacy:
Physical Chemical Principles in The Pharmaceutical Sciences. 3rd Edn,
Varghese Publishing House, Bombay, pp. 447-448.
Improvements of Processing Parameters of APIs Raval MK – PhD Thesis 2012
Department of Pharmaceutical Sciences, Saurashtra University, Rajkot 214
42. Kawashima Y. (1984). Development of spherical crystallization technique
and its application to pharmaceutical systems. Arch Pharm Res, 7, 145-
151.
43. Ueda M, Nakamura Y, Makita H, Imasato Y, Kawashima Y. (1991).
Particle design of enoxacin by spherical crystallization technique II,
characteristics of agglomerated crystals, Chem Pharm Bull, 39, 1277-
1281.
44. Denny P. (2002). Compaction equations: a comparison of the heckel and
kawakita equations. Powder Technol, 127, 162–172.
45. Kawakita K, Ludde KH. (1970). Some considerations on powder
equations. Powder Technol, 4, 61–68.
46. Chavda V, Maheshwari RK. (2008). Tailoring of ketoprofen particle
morphology via novel crystallo-co-agglomeration technique to obtain a
directly compressible material. Asian J Pharm, 2, 61-67.
47. Patra N, Singh SP, HamdP, Vimladevi M. (2007). A sysyematic study on
micromeritic properties and consolidation behavior of the terminaliya
arjuna bark powder for processing into tablet dosage from. Int J Pharma
Excip, 6, 6-7.
48. Chaulang G, Patil K, Ghodke D, Khan S. (2008). Preparation and
characterization of solid dispersion tablet of furosemide with
crospovidone. Research J Pharm Technol, 1, 386-389.
49. Brittain G. (2001). Particle size distribution, representations of particle
shape, size, and distribution. Pharm Technol, 38–45.
50. Kumar S, Chawla G, Bansal AK. (2008). Role of additives like polymers
and surfactants in the crystallization of mebendazole. Yakugaku Zasshi,
128, 281-289.
51. Banga S, Chawla G, Varandani D, Mehta BR, Bansal AK. (2007).
Modification of the crystal habit of celecoxib for improved processibility. J
Pharm Pharmcol, 59, 1-11.
52. Pawar AP. (1999). Studies on spherical crystallization of various
pharmaceuticals [doctoral thesis]. University of Pune.
Improvements of Processing Parameters of APIs Raval MK – PhD Thesis 2012
Department of Pharmaceutical Sciences, Saurashtra University, Rajkot 215
53. Jarosz PJ, Parrot EJ. (1983). Comparison of granule strength and tablet
strength. J Pharm Sci, 72, 530-535.
54. Heckel RW. (1961). An analysis of powder compaction phenomena.
Trans Metall Soc. AIME, 221, 671–675.
55. Rundick A, Hunter AR, Holden FC. (1963). An analysis of the diametral
compression test. Mater Res Stand, 3, 283–289.
56. Armstrong NA, Haines-Nutt RF. (1974). Elastic recovery and surface
area changes in compacted powder systems. Powder Technol, 9, 287-
290.
57. Armstrong NA, Palfrey LP. (1989). The Effect of machine speed on the
consolidation of four directly compressible tablet diluents. J Pharm
Pharmcol, 41,149-151.
58. Gohel MC, Jogani PD. (1999). An Investigation of the direct compression
characteristics of co processed lactose microcrystalline cellulose using
statistical design. Pharm Technol, 23, 54-62.
59. Shivakumar HG, Ramalingaraju G. (1999). Influence of solvents on
crystal habit and properties of paracetamol crystals, Ind J Pharm Sci, 61,
100-104.
60. Vyazovkin S. (2008). Thermal analysis. Anal Chem, 80, 4301–4316.
61. Patel R, Bhimani D, Patel J, Patel D. (2008). Solid-state characterization
and dissolution properties of ezetimibe–cyclodextrins inclusion
complexes. J Incl Phenom Macrocyclic Chem, 60, 241–251.
62. Maghsoodi M, Hassan-Zadeh D, Barzegar-Jalali M. (2007). Improved
compaction and packing properties of naproxen agglomerated crystals
obtained by spherical crystallization technique. Drug Dev Ind Pharma,
33, 1216–1224,
63. Bandyopadhyay R, Selbo J, Amidon GE, Hawley M. (2005). Application
of powder x-ray diffraction in studying the compaction behavior of bulk
pharmaceutical powders. J Pharm Sci, 94, 2520-2530.
64. Hector NA, Anailien BR, Rolando GH, Dulce MCE, Marilo VL. (2000).
Physico-chemical and solid-state characterization of secnidazole. Il
Farmaco, 55, 700–707.

Improvements of Processing Parameters of APIs Raval MK – PhD Thesis 2012
Department of Pharmaceutical Sciences, Saurashtra University, Rajkot 216
65. Mallick S. (2004). Effect of solvent and polymer additives on
crystallization. Indian J Pharm Sci, 66, 142-147.
66. United States Pharmacopoeia 29 / NF-24. (2006). United States
Pharmacopoeial Convention Inc, pp. 576.
67. Dahiya S. (2010). Studies on formulation development of a poorly water-
soluble drug through solid dispersion technique. Thai J Pharm Sci, 34,
77-87.
68. Anderson NH, Bauer M, Boussac N, Khan-Malek R, Munden P, Sardaro
M. (1998). An evaluation of fit factors and dissolution efficiency for the
comparison of in vitro dissolution profiles. J Pharm Biomed Anal, 17,
811–822.
69. Moore JW, Flanner HH. (1996). Mathematical comparison of curves with
an emphasis on in vitro dissolution profiles. Pharm Technol, 20, 64-74.
70. Paradkar AR, Pawar AP, Jadhav NR. (2010). Crystallo-co-
agglomeration: a novel particle engineering technique. Asian J Pharma,
4, 4-10.
71. Kachrimanis K, Ktistis G, Malamataris S. (1998). Crystallization
conditions and physico-mechanical properties of ibuprofen–eudragit
S100 spherical crystal agglomerates prepared by the solvent-change
technique. Int J Pharm, 173, 61–74.
72. Markmana O, Roha C, Robertsa MF, Martha MT. (1996). Designed
additives for controlled growth of crystals of phospholipid interacting
proteins: Short chain phospholipids. J Cryst Growth, 160, 382-388.
73. Raghavan SL, Trividic A, Davis AF, Hadgraft J. (2001). Crystallization of
hydrocortisone acetate: influence of polymers. Int J Pharm, 212, 213–
221.
74. Black SN, Davey RJ, Halcrow M. (1986). The kinetics of crystal growth in
the presence of tailor-made additives. J Cryst Growth, 79, 765-774.
75. Otsuka M, Matsuda Y. (1995). Polymorphism, Pharmaceutical Aspects.
Encyclopedia of Pharmaceutical Technology. New York, Marcel Dekker,
pp. 305–326.

Improvements of Processing Parameters of APIs Raval MK – PhD Thesis 2012
Department of Pharmaceutical Sciences, Saurashtra University, Rajkot 217
76. Schultheiss N, Newman A. (2009). Pharmaceutical cocrystals and their
physicochemical properties. Cryst Growth Des, 9, 2950–2967.
77. Yuan G, Hui Z, Jianjun Z. (2011). Enhanced dissolution and stability of
adefovir dipivoxil by cocrystal formation. J Pharm Pharmacol, 63, 483-
490.
78. Parmar VK. (2010). Studies of physicochemical properties of active
pharmaceutical ingredient and its modification for improvement of its
functionality. [Master’s thesis], The Gujarat University.
79. Raval MK, Sorathiya KR, Chauhan NP, Patel JM, Parikh RK, Sheth NR.
(2012). Influence of polymers/excipients on development of
agglomerated crystals of secnidazole by crystallo-co-agglomeration
technique to improve processability. Drug Dev Ind Pharm, Electronic
version, March 2’ 2012, doi: 10.3109/03639045.2012.662508.
80. Barot BS, Parejiya PB, Patel TM, Parikh RK, Gohel MC. (2010).
Development of directly compressible Metformin hydrochloride by the
spray-drying technique. Acta Pharm, 60,165–175.
81. Kawashima Y, Imai M, Takeuchi H, Yamamoto H, Kamiya K, Hino T.
(2003). Improved flowability and compactibility of spherically
agglomerated crystals of ascorbic acid for direct tableting designed by
spherical crystallization process. Powder Technol, 130, 283-289.
82. Kawashima Y, Takenaka H, Okumura M, Kojma K. (1984). Direct
preparation of spherically agglomerated Salicylic acid crystals using
crystallization. J Pharm Sci, 73, 1534-1538.
83. Paroren P, Juslin M. (1983). Compressional characteristics of four
starches. J Pharm Pharmacol, 35, 627-635.
84. Joshi A, Shah SP, Misra AP. (2003). Preparation and evaluation of
directly compressible forms of rifampicin and ibuprofen. Ind J Pharm Sci,
65, 232-238.
85. Monajjemzadeh F, Hassanzadeh D, Valizadeh H, Siahi-Shadbad MR,
Mojarrad JS, Robertson TA, Roberts MS. (2009). Compatibility studies of
acyclovir and lactose in physical mixtures and commercial tablets.
Eur J Pharm Biopharm, 73, 404-413.
Improvements of Processing Parameters of APIs Raval MK – PhD Thesis 2012
Department of Pharmaceutical Sciences, Saurashtra University, Rajkot 218
86. Patil SA, Kuchekar BS, Chabukswar AR, Jagdale SC. (2010).
Formulation and evaluation of extended-release solid dispersion of
Metformin Hydrochloride. J Young Pharm, 2, 121–129.
87. Gao Y, Zu H, Zhang J. (2011). Enhanced dissolution and stability of
adefovir dipivoxil by cocrystal formation. J Pharm Pharmacol, 63, 483-
490.
88. Shah PP, Mashru RC. (2008). Development and evaluation of
artemether taste masked rapid disintegrating tablets with improved
dissolution using solid dispersion technique. AAPS PharmSciTech, 9,
494-500.
89. Tiwari AK. (2001). Modification of crystal habit and its role in dosage
form performance. Drug Dev Ind Pharm, 27, 699-709.
90. Kaialy W, Larhrib H, Martin GP, Nokhodchi A. (2012). The Effect of Engineered
mannitol-lactose mixture on dry powder inhaler performance. Pharm Res,
Electronic version.
91. Subrahmanyam CVS. (2010). Textbook of Biopharmaceutics and
Pharmacokinetics. 1st Edn., Vallabh Prakashan, New Delhi, pp. 37.
92. Brittain HG. (1999). Polymorphism in Pharmaceutical Solids. Vol. 95.
New York, Marcel Dekker, pp. 227–278.
93. Sarkar M, Perumal OP, Panchagnula R. (2008). Solid-state
characterization of Nevirapine. Ind J Pharm Sci, 70, 619-630.
94. Sekikawa H, Nakano M, Arita T. (1978). Inhibitory effect of polyvinyl
pyrollidone on the crystallization of drugs, Chem Pharm Bull, 26, 118-
126.
95. Ribardiere P, Tchoreloff G, Puisieux F. (1996). Modification of ketoprofen
bead structure produced by the spherical crystallization technique with a
two-solvent system, Int J Pharm, 144, 195-207.
96. Ring TA. (1991). Kinetic effects on particle morphology and size
distribution during batch precipitation. Powder Technol, 95, 195-206.
97. Nocent M, Bertocchi L, Espitalier F, Baron M, Couarraze G. (2001).
Defination of a solvent system for spherical crystallization of salbutamol

Improvements of Processing Parameters of APIs Raval MK – PhD Thesis 2012
Department of Pharmaceutical Sciences, Saurashtra University, Rajkot 219
sulfate by quasi-emulsion solvent diffusion (QESD) method. J Pharm Sci,
90, 1620-1627.
98. Willart JF, Descamps M. (2008). Solid state amorphization of
pharmaceuticals. Mol Pharmaceutics. 5, 905-920.
99. Yamashita K, Nakate T, Okimoto K, Ohike A, Tokunaga Y, Ibuki R,
Higaki K, Kimura T. (2003). Establishment of new preparation method for
solid dispersion formulation of tacrolimus. Int J Pharm, 267, 79–91.
100. Kawakita, K. (1956). Compression of powder. Kagaku, 26, 149–150.
101. Kuno H, in: G. Jimbo, et al. (Ed.), Funtai (Powder theory and
application), Maruzen, Tokyo, 1979, p 342.
102. Lin CW, Chain TM. (1995). Compression behavior and tensile strength of
heat-treated polyethylene glycols. Int J Pharm, 118, 169-179.
103. Rodriguez L, Cavallari C, Passerini N, Albertini B, Gonzalez-Rodriguez
ML, Fini A. (2002). Preparation and characterization by morphological
analysis of diclofenac/ PEG 4000 granules obtained using three different
techniques. Int J Pharm, 242, 285–289.
104. Bartsch SE, Griesser UJ. (2004). Physicochemical properties of the
binary system glibenclamide and polyethylene glycol 4000. J Therm Anal
Calorim, 77, 555–569.
105. Yadav VB, Yadav AV. (2009). Polymeric recrystallized agglomerates of
cefuroxime axetil prepared by emulsion solvent diffusion technique.
Tropical J Pharm Res, 8, 361-369.
106. Pawar AP, Paradkar AR, Kadam SS, Mahadik KR. (2007) Effect of
polymers on crystallo-co-agglomeration of Ibuprofen-Paracetamol:
factorial design. J Pharm Sci, 69, 658-664.
107. Mashru RC, Sutariya VB, Sankalia MG, Parikh PP. (2005). Development
and evaluation of fast-dissolving film of salbutamol sulphate. Drug Dev
Ind Pharm, 31, 25–34.
108. Derringer G, Suich R. (1980). Simultaneous optimization of several
responses variables. J Quality Technol, 12, 214–219.

Improvements of Processing Parameters of APIs Raval MK – PhD Thesis 2012
Department of Pharmaceutical Sciences, Saurashtra University, Rajkot 220
109. Gohel MC, Amin AF. (1998). Formulation optimization of controlled
release diclofenac sodium microspheres using factorial design, J
Controlled Release, 51, 115–122.
110. Gohel MC, Panchal MK. (2002). Novel use of similarity factor f2 and Sd
for the development of diltiazem HCl modified-release tablets using a 32
factorial design. Drug Dev Ind Pharm, 28, 77–87.
111. Shah TJ, Amin AF, Parikh JR, Parikh RH. (2007). Process optimization
and characterization of poloxamer solid dispersions of a poorly water-
soluble Drug, AAPS Pharm SciTech, 8, 29, E1- E7.
112. Nighute AB, Bhise SB. (2009). Preparation and evaluation of rifabutin
loaded polymeric microspheres, Res J Pharm Tech, 2, 371-374.
113. Mahmoodi F, Alderborn G, Frenning G. (2010). Effect of lubrication on
the distribution of force between spherical agglomerates during
compression, Powder Technol, 198, 69 –74.
114. Garg R, Gupta GD. (2010). Gastro retentive floating microspheres of
Silymarin: preparation and In vitro evaluation. Tropical J Pharm Res, 9,
59-66.
115. Kibria G, Jalil R. (2007). In vitro release kinetics study of diltiazem
hydrochloride from pellets using an ethyl cellulose pseudo latex coating
system, J Pharm Sci, 6, 87-92.
116. Palanisamy M, Khanam J. (2011). Cellulose-based matrix microspheres
of prednisolone inclusion complex: preparation and characterization.
AAPS PharmSciTech, 12, 388-400.
117. Das MK, Rao KR. (2007). Microencapsulation of zidovudine by double
emulsion solvent diffusion technique using ethyl cellulose. Ind J Pharm
Sci, 69, 244-250.
118. Tayade PT, Kale RD. (2004). Encapsulation of water-insoluble drug by a
cross-linking technique: effect of process and formulation variables on
encapsulation efficiency, particle size, and In vitro dissolution rate. AAPS
PharmSciTech, 6, 112-119.
119. Modi A, Tayade P. (2005). Enhancement of dissolution profile by solid
dispersion (kneading) technique. AAPS PharmSciTech, 7, E1-E6.
Improvements of Processing Parameters of APIs Raval MK – PhD Thesis 2012
Department of Pharmaceutical Sciences, Saurashtra University, Rajkot 221
120. Yoshihashi Y, Kitano H, Yonemochi E, Terada K. (2000). Quantitative
correlation between initial dissolution rate and heat of fusion of drug
substance. Int J Pharm, 204, 1-6.
121. Chandak AR, Verma PRP. (2008). Design and development of HPMC
based polymeric film of methotrexate-physicochemical and
pharmacokinetic evaluation. Yakugaku zasshi, 128, 1057-1066.
122. Bonet M, Quijada C, Cases F. (2004). Characterization of ethyl cellulose
with different degrees of substitution: a diffuse-reflectance infrared study.
Can J Anal Sci Spectros, 49, 234-239.
123. Jbilou M, Ettabia A, Guyot-Hermann A, Guyot JC. (1999). Ibuprofen
agglomerates preparation by phase separation. Drug Dev Ind Pharm, 25,
297–305.
124. Gupta VR, Mutalik S, Patel MM, Jani GK. (2007). Spherical crystals of
celecoxib to improve solubility, dissolution rate and micromeritic
properties. Acta Pharm, 57, 173–184.
125. Wang Q, Sanming Li, Che X, Fan X, Chaojie Li. (2010). Dissolution
improvement and stabilization of ibuprofen by co-grinding in a β-
cyclodextrin ground complex. Asian J Pharm Sci, 5, 188-193.
126. Bhole PG, Patil VR. (2009). Enhancement of water solubility of felodipine
by preparing solid dispersion using poly-ethylene glycol 6000 and poly-
alcohol. Asian J Pharm, 3, 240-244.
127. Lachman L, Liberman HA, Kanig JL. (1976) Theory and Practice of
Industrial Pharmacy. 2nd edn., Philadelphia, USA, pp. 338-339.
128. Vazquez D, Takagi S, Frukhtbeyn S, Chow LC. (2010). Effects of
addition of mannitol crystallization the porosity and dissolution rate of a
calcium phosphate cement. J Res Natl Inst Stand Technol, 115, 225-
232.
129. Vogt M, Kunath K, Dressman JB. (2008). Dissolution enhancement of
fenofibrate by micronisation, cogrinding and spray-drying: comparison
with commercial preparations. Eur J Pharm Biopharm, 68, 283–288.