Edward B. Cole Academy · PDF fileEdward B. Cole Academy View Larger Map ... California. EBC...
26
Edward B. Cole Academy View Larger Map Mr. John Norton, Principal Principal, Edward B. Cole Academy My name is John G. Norton and I am the Principal and Director of Edward B. Cole, Sr. Academy. I have 13 years of experience working as an educator in both California and Spain. I have been a teacher in grades K-12, a resource teacher, an ELL redesignator, a Department Head, a Dean of Curriculum and Instruction, and an administrator. I have two master degrees in education and will pursue my Ph.D. shortly. This is my ninth year at EBC and I love EBC Academy! EBC will celebrate it's 11th year of service throughout the 2013-14 school year. EBC was started by Templo Calvario CDC to honor an administrator in Santa Ana who passed away early. Mr. Cole and his family believed in family, school, and community as the three pillars to sustaining positive change. His willingness to better the lives of students is perpetuated at EBC daily. I am very proud of EBC Academy! We have an amazing staff who are dedicated to the success of all EBC Academy students. They work diligently and creatively to bring a rigorous, exciting, and meaningful educational experience to our students. They engage parents as valued partners in the educational journey of their child. The staff at EBC Academy is excited about educating the whole child and celebrate the progress that our students have made. I invite EBC families to get involved and seek out opportunities to partner with the school in the creation of a life changing educational experience for their child. Come to our campus, take a tour, and see EBC Academy first hand. Go COUGARS!!! Mr. J. G. Norton, M.S. Ed. & M.A. Ed. Principal / Director 333 East Walnut St. Santa Ana, CA 92701-5928 Phone: 714-836-9023 E-mail: [email protected] About Our School About Our School Contact Contact
Transcript of Edward B. Cole Academy · PDF fileEdward B. Cole Academy View Larger Map ... California. EBC...

Edward B. Cole Academy
View Larger Map
Mr. John Norton, PrincipalPrincipal, Edward B. Cole Academy
My name is John G. Norton and I am the Principal and Director of Edward B. Cole, Sr. Academy. I have 13 years ofexperience working as an educator in both California and Spain. I have been a teacher in grades K-12, a resource teacher,an ELL redesignator, a Department Head, a Dean of Curriculum and Instruct ion, and an administrator. I have two masterdegrees in educat ion and w ill pursue my Ph.D. short ly. This is my ninth year at EBC and I love EBC Academy!
EBC w ill celebrate it 's 11th year of service throughout the 2013-14 school year. EBC was started by Templo Calvario CDCto honor an administrator in Santa Ana who passed away early. Mr. Cole and his family believed in family, school, andcommunity as the three pillars to sustaining posit ive change. His w illingness to better the lives of students is perpetuatedat EBC daily.
I am very proud of EBC Academy! We have an amazing staff who are dedicated to the success of all EBC Academystudents. They work diligent ly and creat ively to bring a rigorous, excit ing, and meaningful educat ional experience to ourstudents. They engage parents as valued partners in the educat ional journey of their child. The staff at EBC Academy isexcited about educat ing the whole child and celebrate the progress that our students have made. I invite EBC families toget involved and seek out opportunit ies to partner w ith the school in the creat ion of a life changing educat ionalexperience for their child.
Come to our campus, take a tour, and see EBC Academy first hand. Go COUGARS!!!
Mr. J. G. Norton, M.S. Ed. & M.A. Ed.
Principal / Director
333 East Walnut St. Santa Ana, CA92701-5928
Phone: 714-836-9023E-mail: [email protected]
About Our SchoolAbout Our School
ContactContact

Data and AccessEvery school in California is required by state law to publish a School Accountability Report Card (SARC), by February 1 of each year. The SARC contains information aboutthe condit ion and performance of each California public school.
For more information about SARC requirements, see the California Department of Educat ion (CDE) SARC Web page.For addit ional information about the school, parents and community members should contact the school principal or the district office.
DataQuest
Internet Access
Additional Information
DataQuest is an online data tool located on the CDE DataQuest Web page that contains addit ional information about this school and comparisons of the school tothe district , the county, and the state. Specifically, DataQuest is a dynamic system that provides reports for accountability (e.g., state Academic PerformanceIndex [API], federal Adequate Yearly Progress [AYP]), test data, enrollment, high school graduates, dropouts, course enrollments, staffing, and data regardingEnglish learners.
Internet access is available at public libraries and other locat ions that are publicly accessible (e.g., the California State Library). Access to the Internet at librariesand public locat ions is generally provided on a first-come, first-served basis. Other use restrict ions may include the hours of operat ion, the length of t ime that aworkstat ion may be used (depending on availability), the types of software programs available on a workstat ion, and the ability to print documents.
For further information regarding the data elements and terms used in the SARC see the 2012-13 Academic Performance Index Reports Information Guidelocated on the CDE API Web page.
2012-13 SARC - Edward B. Cole Academy
Page 2 of 26
Last updated: 1/29/2014
Last updated: 1/31/2014
About This School
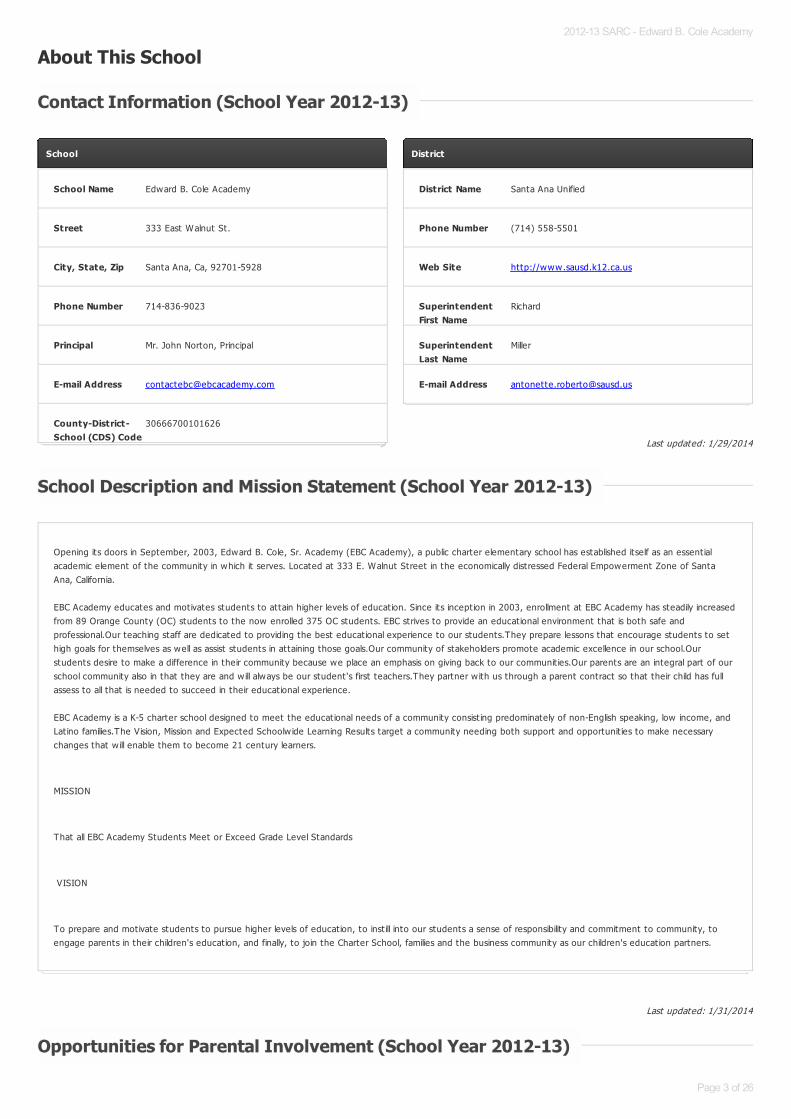
Contact Information (School Year 2012-13)Contact Information (School Year 2012-13)
School
School Name Edward B. Cole Academy
Street 333 East Walnut St.
City, State, Zip Santa Ana, Ca, 92701-5928
Phone Number 714-836-9023
Principal Mr. John Norton, Principal
E-mail Address [email protected]
County-District-School (CDS) Code
30666700101626
District
District Name Santa Ana Unified
Phone Number (714) 558-5501
Web Site http://www.sausd.k12.ca.us
SuperintendentFirst Name
Richard
SuperintendentLast Name
Miller
E-mail Address [email protected]
School Description and Mission Statement (School Year 2012-13)School Description and Mission Statement (School Year 2012-13)
Opening its doors in September, 2003, Edward B. Cole, Sr. Academy (EBC Academy), a public charter elementary school has established itself as an essent ialacademic element of the community in which it serves. Located at 333 E. Walnut Street in the economically distressed Federal Empowerment Zone of SantaAna, California.
EBC Academy educates and motivates students to attain higher levels of educat ion. Since its incept ion in 2003, enrollment at EBC Academy has steadily increasedfrom 89 Orange County (OC) students to the now enrolled 375 OC students. EBC strives to provide an educat ional environment that is both safe andprofessional.Our teaching staff are dedicated to providing the best educat ional experience to our students.They prepare lessons that encourage students to sethigh goals for themselves as well as assist students in attaining those goals.Our community of stakeholders promote academic excellence in our school.Ourstudents desire to make a difference in their community because we place an emphasis on giving back to our communit ies.Our parents are an integral part of ourschool community also in that they are and w ill always be our student 's first teachers.They partner w ith us through a parent contract so that their child has fullassess to all that is needed to succeed in their educat ional experience.
EBC Academy is a K-5 charter school designed to meet the educat ional needs of a community consist ing predominately of non-English speaking, low income, andLat ino families.The Vision, Mission and Expected Schoolw ide Learning Results target a community needing both support and opportunit ies to make necessarychanges that w ill enable them to become 21 century learners.
MISSION
That all EBC Academy Students Meet or Exceed Grade Level Standards
VISION
To prepare and motivate students to pursue higher levels of educat ion, to inst ill into our students a sense of responsibility and commitment to community, toengage parents in their children's educat ion, and finally, to join the Charter School, families and the business community as our children's educat ion partners.
Opportunities for Parental Involvement (School Year 2012-13)Opportunities for Parental Involvement (School Year 2012-13)
2012-13 SARC - Edward B. Cole Academy
Page 3 of 26

Last updated: 1/29/2014
Parent involvement is encougaged and supported. Parents are invited to attend class part ies, school events, and assemblies. Parents are encouraged to volunteeron campus in numerous capacit ies. Throughout the year, EBC offers many parent educat ion programs designed to inform and empower parents and sharpenparent ing skills. Information about how to part icipate in act ivit ies as well as dates and t imes are given through school site posts, the EBC website, and social mediaout lets.
www.ebcacademy.com
www.facebook.com/ebcacademy
2012-13 SARC - Edward B. Cole Academy
Page 4 of 26
Student Performance
Standardized Testing and Reporting Program
The Standardized Test ing and Report ing (STAR) Program consists of several key components, including:
California Standards Tests (CSTs), which include English-language arts (ELA) and mathematics in grades two through eleven; science in grades five, eight, andnine through eleven; and history-social science in grades eight, and nine through eleven.California Modified Assessment (CMA), an alternate assessment that is based on modified achievement standards in ELA for grades three through eleven;mathematics for grades three through seven, Algebra I, and Geometry; and science in grades five and eight, and Life Science in grade ten. The CMA is designedto assess those students whose disabilit ies preclude them from achieving grade-level proficiency on an assessment of the California content standards w ith orw ithout accommodations.Alternate Performance Assessment (CAPA), includes ELA and mathematics in grades two through eleven, and science for grades five, eight, and ten. TheCAPA is given to those students w ith significant cognit ive disabilit ies whose disabilit ies prevent them from taking either the CSTs w ith accommodations ormodificat ions or the CMA w ith accommodations.
The assessments under the STAR Program show how well students are doing in relat ion to the state content standards. On each of these assessments, student scoresare reported as performance levels.
For detailed information regarding the STAR Program results for each grade and performance level, including the percent of students not tested, see the CDE STARResults Web site.
Note: Scores are not shown when the number of students tested is ten or less, either because the number of students in this category is too small for stat ist icalaccuracy or to protect student privacy.
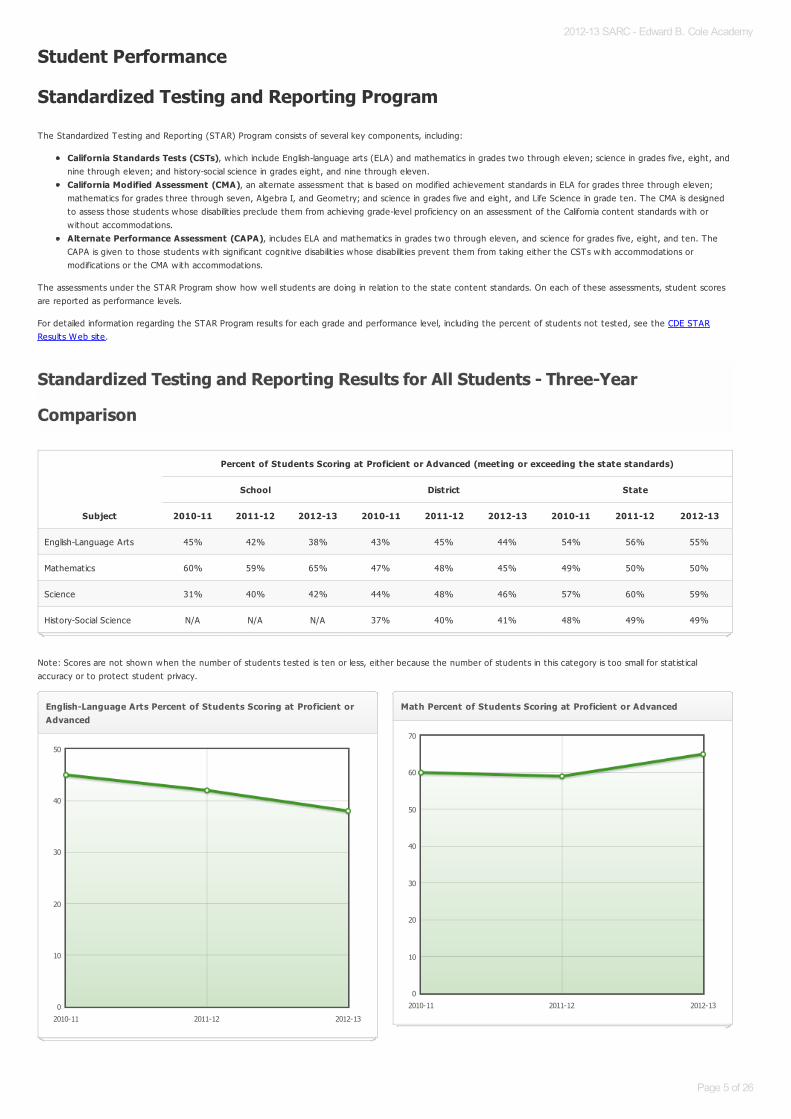
Standardized Testing and Reporting Results for All Students - Three-YearStandardized Testing and Reporting Results for All Students - Three-Year
ComparisonComparison
Subject
Percent of Students Scoring at Proficient or Advanced (meeting or exceeding the state standards)
School District State
2010-11 2011-12 2012-13 2010-11 2011-12 2012-13 2010-11 2011-12 2012-13
English-Language Arts 45% 42% 38% 43% 45% 44% 54% 56% 55%
Mathematics 60% 59% 65% 47% 48% 45% 49% 50% 50%
Science 31% 40% 42% 44% 48% 46% 57% 60% 59%
History-Social Science N/A N/A N/A 37% 40% 41% 48% 49% 49%
English-Language Arts Percent of Students Scoring at Proficient orAdvanced
2010-11 2011-12 2012-13
0
10
20
30
40
50
Math Percent of Students Scoring at Proficient or Advanced
2010-11 2011-12 2012-13
0
10
20
30
40
50
60
70
2012-13 SARC - Edward B. Cole Academy
Page 5 of 26

Last updated: 1/29/2014
Last updated: 1/29/2014
Note: Scores are not shown when the number of students tested is ten or less, either because the number of students in this category is too small for stat ist icalaccuracy or to protect student privacy.
Science Percent of Students Scoring at Proficient or Advanced
2010-11 2011-12 2012-13
0
5
10
15
20
25
30
35
40
45
History Percent of Students Scoring at Proficient or Advanced
2010-11 2011-12 2012-13
-1.0
-0.5
0.0
0.5
1.0
Standardized Testing and Reporting Results by Student Group – Most Recent YearStandardized Testing and Reporting Results by Student Group – Most Recent Year
Group
Percent of Students Scoring at Proficient or Advanced
English-Language Arts Mathematics Science History-Social Science
All Students in the LEA 44% 45% 47% 41%
All Students at the School 38% 65% 42% N/A
Male 35% 67% 48% N/A
Female 40% 63% 33% N/A
Black or African American N/A N/A N/A N/A
American Indian or Alaska Nat ive N/A N/A N/A N/A
Asian N/A N/A N/A N/A
Filipino N/A N/A N/A N/A
Hispanic or Lat ino 37% 64% 38% N/A
Native Hawaiian or Pacific Islander N/A N/A N/A N/A
White N/A N/A N/A N/A
Two or More Races N/A N/A N/A N/A
Socioeconomically Disadvantaged 37% 63% 41% N/A
English Learners 17% 51% 22% N/A
Students w ith Disabilit ies N/A N/A N/A N/A
Students Receiving Migrant Educat ion Services N/A N/A N/A N/A
2012-13 SARC - Edward B. Cole Academy
Page 6 of 26

Last updated: 1/29/2014
The California High School Exit Examinat ion (CAHSEE) is primarily used as a graduat ion requirement. However, the grade ten results of this exam are also used to establishthe percentages of students at three proficiency levels (not proficient, proficient, or advanced) in ELA and mathematics to compute AYP designat ions required by thefederal ESEA, also known as NCLB. For detailed information regarding CAHSEE results, see the CDE CAHSEE Web site at http://cahsee.cde.ca.gov/.
Note: Scores are not shown when the number of students tested is ten or less, either because the number of students in this category is too small for stat ist icalaccuracy or to protect student privacy.
California High School Exit Examination Results for All Grade Ten Students –California High School Exit Examination Results for All Grade Ten Students –
Three-Year ComparisonThree-Year Comparison
Subject
Percent of Students Scoring at Proficient or Advanced
School District State
2010-11 2011-12 2012-13 2010-11 2011-12 2012-13 2010-11 2011-12 2012-13
English-Language Arts N/A N/A N/A 54% 48% 52% 59% 56% 57%
Mathematics N/A N/A N/A 56% 58% 57% 56% 58% 60%
English-Language Arts Percent of Students Scoring at Proficient orAdvanced
2010-11 2011-12 2012-13
-1.0
-0.5
0.0
0.5
1.0
Mathematics Percent of Students Scoring at Proficient or Advanced
2010-11 2011-12 2012-13
-1.0
-0.5
0.0
0.5
1.0
2012-13 SARC - Edward B. Cole Academy
Page 7 of 26

Last updated: 1/29/2014
Note: Scores are not shown when the number of students tested is ten or less, either because the number of students in this category is too small for stat ist icalaccuracy or to protect student privacy.
California High School Exit Examination Grade Ten Results by Student GroupCalifornia High School Exit Examination Grade Ten Results by Student Group
Group
English-Language Arts Mathematics
Not Proficient Proficient Advanced Not Proficient Proficient Advanced
All Students in the LEA 48% 22% 30% 43% 36% 21%
All Students at the School N/A N/A N/A N/A N/A N/A
Male N/A N/A N/A N/A N/A N/A
Female N/A N/A N/A N/A N/A N/A
Black or African American N/A N/A N/A N/A N/A N/A
American Indian or Alaska Nat ive N/A N/A N/A N/A N/A N/A
Asian N/A N/A N/A N/A N/A N/A
Filipino N/A N/A N/A N/A N/A N/A
Hispanic or Lat ino N/A N/A N/A N/A N/A N/A
Native Hawaiian or Pacific Islander N/A N/A N/A N/A N/A N/A
White N/A N/A N/A N/A N/A N/A
Two or More Races N/A N/A N/A N/A N/A N/A
Socioeconomically Disadvantaged N/A N/A N/A N/A N/A N/A
English Learners N/A N/A N/A N/A N/A N/A
Students w ith Disabilit ies N/A N/A N/A N/A N/A N/A
Students Receiving Migrant Educat ion Services N/A N/A N/A N/A N/A N/A
2012-13 SARC - Edward B. Cole Academy
Page 8 of 26

Last updated: 1/29/2014
The California Physical Fitness Test (PFT) is administered to students in grades five, seven, and nine only. This table displays by grade level the percent of studentsmeeting the fitness standards for the most recent test ing period. For detailed information regarding this test, and comparisons of a school’s test results to the district andstate, see the CDE PFT Web page.
Note: Scores are not shown when the number of students tested is ten or less, either because the number of students in this category is too small for stat ist icalaccuracy or to protect student privacy.
California Physical Fitness Test Results (School Year 2012-13)California Physical Fitness Test Results (School Year 2012-13)
Grade level
Percent of Students Meeting Fitness Standards
Four of Six Standards Five of Six Standards Six of Six Standards
5 28.9% 21.1% 15.8%
2012-13 SARC - Edward B. Cole Academy
Page 9 of 26
Last updated: 1/29/2014
Last updated: 1/29/2014
Accountability
Academic Performance Index
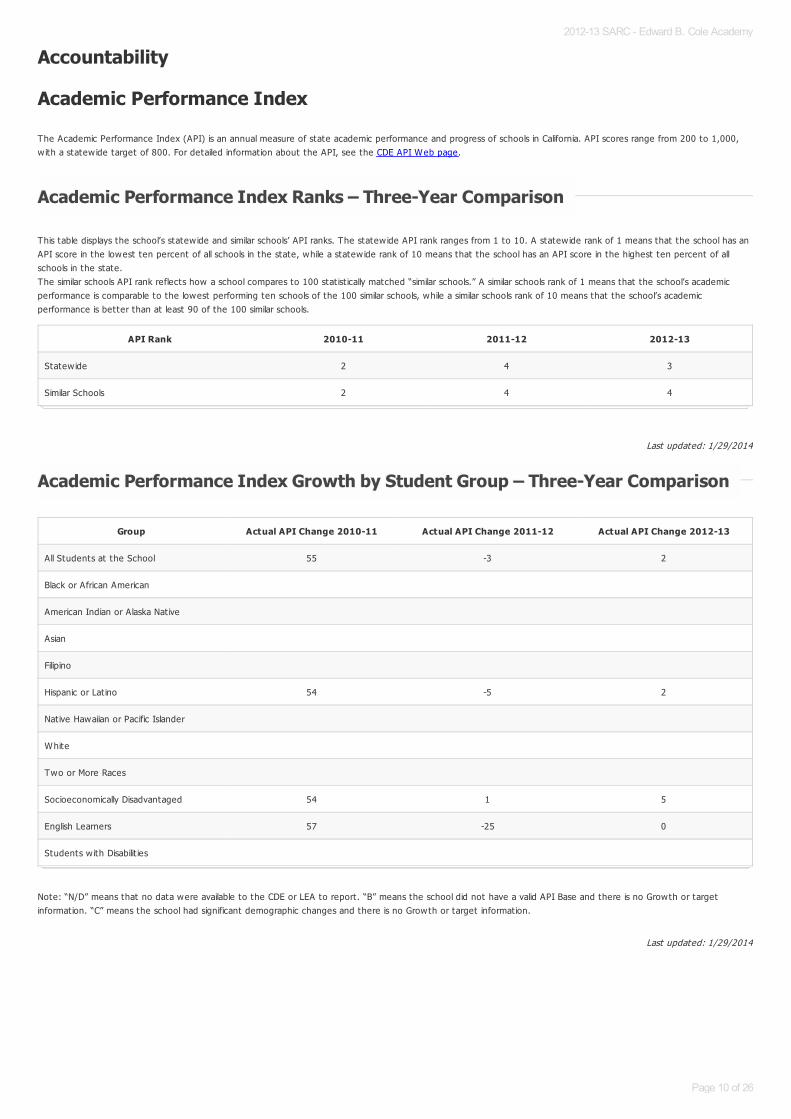
The Academic Performance Index (API) is an annual measure of state academic performance and progress of schools in California. API scores range from 200 to 1,000,w ith a statew ide target of 800. For detailed information about the API, see the CDE API Web page.
This table displays the school’s statew ide and similar schools’ API ranks. The statew ide API rank ranges from 1 to 10. A statew ide rank of 1 means that the school has anAPI score in the lowest ten percent of all schools in the state, while a statew ide rank of 10 means that the school has an API score in the highest ten percent of allschools in the state. The similar schools API rank reflects how a school compares to 100 stat ist ically matched “similar schools.” A similar schools rank of 1 means that the school’s academicperformance is comparable to the lowest performing ten schools of the 100 similar schools, while a similar schools rank of 10 means that the school’s academicperformance is better than at least 90 of the 100 similar schools.
Note: “N/D” means that no data were available to the CDE or LEA to report. “B” means the school did not have a valid API Base and there is no Growth or targetinformation. “C” means the school had significant demographic changes and there is no Growth or target information.
Academic Performance Index Ranks – Three-Year ComparisonAcademic Performance Index Ranks – Three-Year Comparison
API Rank 2010-11 2011-12 2012-13
Statew ide 2 4 3
Similar Schools 2 4 4
Academic Performance Index Growth by Student Group – Three-Year ComparisonAcademic Performance Index Growth by Student Group – Three-Year Comparison
Group Actual API Change 2010-11 Actual API Change 2011-12 Actual API Change 2012-13
All Students at the School 55 -3 2
Black or African American
American Indian or Alaska Nat ive
Asian
Filipino
Hispanic or Lat ino 54 -5 2
Native Hawaiian or Pacific Islander
White
Two or More Races
Socioeconomically Disadvantaged 54 1 5
English Learners 57 -25 0
Students w ith Disabilit ies
2012-13 SARC - Edward B. Cole Academy
Page 10 of 26

Last updated: 1/29/2014
Last updated: 1/29/2014
This table displays, by student group, the number of students included in the API and the Growth API at the school, LEA, and state level.
The federal ESEA requires that all schools and districts meet the follow ing Adequate Yearly Progress (AYP) criteria:
• Part icipat ion rate on the state’s standards-based assessments in ELA and mathematics • Percent proficient on the state’s standards-based assessments in ELA and mathematics• API as an addit ional indicator• Graduat ion rate (for secondary schools)
For detailed information about AYP, including part icipat ion rates and percent proficient results by student group, see the CDE AYP Web page.
Academic Performance Index Growth by Student Group – 2012-13 Growth APIAcademic Performance Index Growth by Student Group – 2012-13 Growth API
ComparisonComparison
Group Number of Students School Number of Students LEA Number of Students State
All Students at the School 203 779 38,934 743 4,655,989 790
Black or African American 0 131 793 296,463 708
American Indian or Alaska Nat ive 0 30 782 30,394 743
Asian 0 887 893 406,527 906
Filipino 1 83 877 121,054 867
Hispanic or Lat ino 198 775 37,188 737 2,438,951 744
Native Hawaiian or Pacific Islander 0 36 788 25,351 774
White 1 393 843 1,200,127 853
Two or More Races 3 185 719 125,025 824
Socioeconomically Disadvantaged 203 779 36,543 737 2,774,640 743
English Learners 110 722 21,622 674 1,482,316 721
Students w ith Disabilit ies 4 4,584 615 527,476 615
Adequate Yearly Progress Overall and by Criteria (School Year 2012-13)Adequate Yearly Progress Overall and by Criteria (School Year 2012-13)
AYP Criteria School District
Made AYP Overall No
Met Part icipat ion Rate - English-Language Arts Yes
Met Part icipat ion Rate - Mathematics Yes
Met Percent Proficient - English-Language Arts No
Met Percent Proficient - Mathematics No
Met API Criteria Yes
Met Graduat ion Rate N/A
2012-13 SARC - Edward B. Cole Academy
Page 11 of 26

Last updated: 1/29/2014
Schools and districts receiving federal T it le I funding enter Program Improvement (PI) if they do not make AYP for two consecut ive years in the same content area (ELAor mathematics) or on the same indicator (API or graduat ion rate). After entering PI, schools and districts advance to the next level of intervent ion w ith each addit ionalyear that they do not make AYP. For detailed information about PI ident ificat ion, see the CDE PI Status Determinat ions Web page .
Note: Cells shaded in black or w ith N/A values do not require data.
Federal Intervention Program (School Year 2013-14)Federal Intervention Program (School Year 2013-14)
Indicator School District
Program Improvement Status In PI In PI
First Year of Program Improvement 2006-2007 2004-2005
Year in Program Improvement Year 5 Year 3
Number of Schools Current ly in Program Improvement N/A 54
Percent of Schools Current ly in Program Improvement N/A 90.0%
2012-13 SARC - Edward B. Cole Academy
Page 12 of 26

Last updated: 1/29/2014
Last updated: 1/29/2014
School Climate
Student Enrollment by Grade Level (School Year 2012-13)Student Enrollment by Grade Level (School Year 2012-13)
Grade Level Number of Students
Kindergarten 75
Grade 1 68
Grade 2 66
Grade 3 65
Grade 4 46
Grade 5 39
Total Enrollment 359
Kindergarten Grade 1 Grade 2 Grade 3 Grade 4 Grade 50
10
20
30
40
50
60
70
80
Student Enrollment by Student Group (School Year 2012-13)Student Enrollment by Student Group (School Year 2012-13)
Group Percent of Total Enrollment
Black or African American 0.0
American Indian or Alaska Nat ive 0.0
Asian 0.3
Filipino 0.3
Hispanic or Lat ino 98.3
Native Hawaiian or Pacific Islander 0.0
White 0.3
Two or More Races 0.8
Socioeconomically Disadvantaged 99.4
English Learners 67.7
Students w ith Disabilit ies 2.8
Black or African American
American Indian or A laska Native
Asian
Filipino
Hispanic or Latino
Native Hawaiian or Pacific Islander
White
Two or More Races
100%
2012-13 SARC - Edward B. Cole Academy
Page 13 of 26

Last updated: 1/29/2014
Last updated: 1/29/2014
Last updated: 1/31/2014
* Number of classes indicates how many classes fall into each size category (a range of total students per class).
* Number of classes indicates how many classrooms fall into each size category (a range of total students per classroom). At the secondary school level, this information isreported by subject area rather than grade level.
Average Class Size and Class Size Distribution (Elementary)Average Class Size and Class Size Distribution (Elementary)
2010-11 2011-12 2012-13
Grade Level Average Class Size
Number of Classes *
Average Class Size
Number of Classes *
Average Class Size
Number of Classes *
1-20 21-32 33+ 1-20 21-32 33+ 1-20 21-32 33+
K 23.7 0 3 0 21.0 2 1 0 25.0 3
1 23.3 1 2 0 0.0 3 0 0 23.0 3
2 22.7 2 1 0 0.0 4 0 0 17.0 1 3
3 24.5 1 1 0 0.3 3 0 0 21.0 3
4 43.5 0 1 1 0.0 1 0 0 23.0 1 1
5 32.0 0 1 0 0.5 2 0 0 20.0 1 1
6 1.0 1 0 0
Other
Average Class Size and Class Size Distribution (Secondary)Average Class Size and Class Size Distribution (Secondary)
2010-11 2011-12 2012-13
Subject Average Class Size
Number of Classes *
Average Class Size
Number of Classes *
Average Class Size
Number of Classes *
1-22 23-32 33+ 1-22 23-32 33+ 1-22 23-32 33+
English
Mathematics
Science
Social Science
School Safety Plan (School Year 2012-13)School Safety Plan (School Year 2012-13)
EBC Academy part icpated in a federal funded Emergency Response grant for three years before the grant lost funding. This federal grant enhanced the safetymeasures already in place at EBC in the areas of fire, earthquake, lock down response, and lock down no response drills. It also focused on emergencypreparedness supplies in case of a major disaster so that the school could be ready to act as a shelter-in-place. These pract ices and emergency response drillshave been cont inued at EBC beyond the grant to ensure we are prepared for any and all emergencies.
The safety plan is reviewed and discussed w ith faculty at the beginning of each year in August. The safety team meets monthly to address the school climateand surrounding community to address any issues that arise. Staff is trained and cert ified in the areas of first aid and CPR every two years. EBC regularly pract icesemergency drills (fire, earthquake, and lock down) each month to ensure students and staff are prepared in these matters.
2012-13 SARC - Edward B. Cole Academy
Page 14 of 26

Last updated: 1/29/2014
Suspensions and Expulsions
* The rate of suspensions and expulsions is calculated by dividing the total number of incidents by the total enrollment.
School District
Rate * 2010-11 2011-12 2012-13 2010-11 2011-12 2012-13
Suspensions 20.00 1.00
Expulsions 0.00 0.00 0.00
Suspensions
2010-11 2011-12 2012-130
5
10
15
20
25School Suspensions
District Suspensions
Expulsions
2010-11 2011-12 2012-13-1.0
-0.5
0.0
0.5
1.0School Expulsions
District Expulsions
2012-13 SARC - Edward B. Cole Academy
Page 15 of 26

Last updated: 1/29/2014
Last updated: 1/29/2014
School Facilities
School Facility Good Repair Status (School Year 2013-14)
Overall Facility Rate (School Year 2012-13)
School Facility Conditions and Planned Improvements (School Year 2013-14)School Facility Conditions and Planned Improvements (School Year 2013-14)
The school grounds and buildings are inspected annualy and are deemed adequate and safe. The campus is clean and well groomed. During summer months largegrass areas are t illed and replanted. A recent plant ing project has provided colorful flower beds w ith various flowers, plants and vines. Parents organize work daysto come on campus to sweep, rake, and clean. Planned facility improvements include replacement of playground equipment, playground shock-absorbing material,and carpet replacement.
System InspectedRepairStatus
Repair Needed andAction Taken or Planned
Systems: Gas Leaks, Mechanical/HVAC,Sewer
Good
Interior: Interior Surfaces Good
Cleanliness: Overall Cleanliness, Pest/Vermin Infestat ion
Good
Electrical: Electrical Good
Restrooms/Fountains: Restrooms,Sinks/ Fountains
Fair
Safety: Fire Safety, Hazardous Materials Good
Structural: Structural Damage, Roofs Good
External: Playground/School Grounds,W indows/ Doors/Gates/Fences
Good
Overall Rat ing Good
2012-13 SARC - Edward B. Cole Academy
Page 16 of 26

Last updated: 1/29/2014
Last updated: 1/29/2014
Teachers
Note: “Misassignments” refers to the number of posit ions filled by teachers who lack legal authorizat ion to teach that grade level, subject area, student group, etc.
* Total Teacher Misassignments includes the number of Misassignments of Teachers of English Learners.
Teacher CredentialsTeacher Credentials
Teachers School District
2010-11
2011-12
2012-13
2012-13
With Full Credent ial 15 15 15
Without Full Credent ial 0 0 0
Teachers Teaching Outside SubjectArea of Competence (w ith fullcredent ial)
0 0 0
2010-11 2011-12 2012-130.0
2.5
5.0
7.5
10.0
12.5
15.0
17.5Teachers with Full Credential
Teachers without Full Credential
Teachers Teaching Outside Subject Area of Competence
Teacher Misassignments and Vacant Teacher PositionsTeacher Misassignments and Vacant Teacher Positions
Indicator2011-
122012-
132013-
14
Misassignments of Teachers of EnglishLearners
0 0 0
Total Teacher Misassignments* 0 0 0
Vacant Teacher Posit ions 0 0 0
2011-12 2012-13 2013-14-1.0
-0.5
0.0
0.5
1.0Misassignments of Teachers of English Learners
Total Teacher Misassignments
Vacant Teacher Positions
2012-13 SARC - Edward B. Cole Academy
Page 17 of 26

Last updated: 1/29/2014
The federal ESEA, also known as NCLB, requires that core academic subjects be taught by Highly Qualified Teachers, defined as having at least a bachelor’s degree, anappropriate California teaching credent ial, and demonstrated core academic subject area competence. For more information, see the CDE Improving Teacher and PrincipalQuality Web page.
Note: High-poverty schools are defined as those schools w ith student eligibility of approximately 40 percent or more in the free and reduced price meals program. Low-poverty schools are those w ith student eligibility of approximately 39 percent or less in the free and reduced price meals program.
Core Academic Classes Taught by Highly Qualified Teachers (School Year 2012-13)Core Academic Classes Taught by Highly Qualified Teachers (School Year 2012-13)
Location of ClassesPercent of Classes In Core Academic Subjects Taught by
Highly Qualified TeachersPercent of Classes In Core Academic Subjects Not Taught by
Highly Qualified Teachers
This School 100 0
All Schools in District 100 0
High-Poverty Schoolsin District
100 0
Low-Poverty Schoolsin District
0 0
2012-13 SARC - Edward B. Cole Academy
Page 18 of 26

Last updated: 1/31/2014
Support Staff
Note: Cells shaded in black or w ith N/A values do not require data.
* One Full-T ime Equivalent (FTE) equals one staff member working full-t ime; one FTE could also represent two staff members who each work 50 percent of full-t ime.
Academic Counselors and Other Support Staff (School Year 2012-13)Academic Counselors and Other Support Staff (School Year 2012-13)
Title Number of FTE* Assigned to School Average Number of Students per Academic Counselor
Academic Counselor
Counselor (Social/Behavioral or Career Development) N/A
Library Media Teacher (librarian) N/A
Library Media Services Staff (paraprofessional) 0.5 N/A
Psychologist 0.2 N/A
Social Worker N/A
Nurse 0.5 N/A
Speech/Language/Hearing Specialist 0.5 N/A
Resource Specialist (non-teaching) N/A
Other N/A
2012-13 SARC - Edward B. Cole Academy
Page 19 of 26

Last updated: 1/31/2014
Curriculum and Instructional Materials
This sect ion describes whether the textbooks and instruct ional materials used at the school are from the most recent adopt ion; whether there are sufficient textbooksand instruct ion materials for each student; and information about the school’s use of any supplemental curriculum or non-adopted textbooks or instruct ional materials.
Year and month in which data were collected:
Quality, Currency, Availability of Textbooks and Instructional Materials (FiscalQuality, Currency, Availability of Textbooks and Instructional Materials (Fiscal
Year 2013-14)Year 2013-14)
Core CurriculumArea Textbooks and instructional materials
Frommost
recentadoption?
Percentstudentslacking
ownassigned
copy
Reading/LanguageArts California Treasures textbooks and support materials are state-adopted and consistent w ith the curriculum
content frameworks adopted by the State Board of Educat ion. The school has purchased and provided eachstudent w ith textbooks and materials in this subject area that are aligned to state standards.
Supplemental textbooks and materials are used for English Language Learners.
0.0
MathematicsSingapore Math textbooks and support materials are state-adopted and consistent w ith the curriculum content
frameworks adopted by the State Board of Educat ion. The school has purchased and provided each student w ithtextbooks and materials in this subject area that are aligned to state standards.
Orange County Math Init iat ive- Spacial Temporal (ST) Math is a web-based mathematics program consistent w ithcurriculum content frameworks adopted by the State Board of Educat ion.
0.0
ScienceCalifornia Treasures textbooks and support materials are state-adopted and consistent w ith the curriculum contentframeworks adopted by the State Board of Educat ion. The school has purchased and provided each student w ith
textbooks and materials in this subject area that are aligned to state standards.
0.0
History-SocialScience Supplemental materials are used.
0.0
Foreign Language 0.0
HealthCalifornia Treasures textbooks and support materials are state-adopted and consistent w ith the curriculum contentframeworks adopted by the State Board of Educat ion. The school has purchased and provided each student w ithtextbooks and materials in this subject area that are aligned to state standards. Health curriculum is integrated in
science texts.
Physical health program includes: physical educat ion w ith emphasis on exercise and fundamental body movement,physiology, and nutrit ion.
0.0
Visual andPerforming Arts N/A
0.0
ScienceLaboratoryEquipment(grades 9-12)
N/A0.0
2012-13 SARC - Edward B. Cole Academy
Page 20 of 26

Last updated: 2/1/2014
Last updated: 2/1/2014
School Finances
Note: Cells shaded in black or w ith N/A values do not require data.
Supplemental/Restricted expenditures come from money whose use is controlled by law or by a donor. Money that is designated for specific purposes by the district orgoverning board is not considered restricted. Basic/unrestricted expenditures are from money whose use, except for general guidelines, is not controlled by law or by adonor.
For detailed information on school expenditures for all districts in California, see the CDE Current Expense of Educat ion & Per-pupil Spending Web page. For information onteacher salaries for all districts in California, see the CDE Cert ificated Salaries & Benefits Web page. To look up expenditures and salaries for a specific school district , seethe Ed-Data Web site.
Expenditures Per Pupil and School Site Teacher Salaries (Fiscal Year 2011-12)Expenditures Per Pupil and School Site Teacher Salaries (Fiscal Year 2011-12)
LevelTotal Expenditures
Per PupilExpenditures Per Pupil (Supplemental
/ Restricted)Expenditures Per Pupil (Basic /
Unrestricted)Average Teacher
Salary
School Site $8,431 $1,261 $7,170 $54,433
District N/A N/A N/A $78,135
Percent Difference – School Siteand District
N/A N/A N/A N/A
State N/A N/A $5,537 $69,704
Percent Difference – School Siteand State
N/A N/A N/A N/A
Types of Services Funded (Fiscal Year 2012-13)Types of Services Funded (Fiscal Year 2012-13)
EBC ut ilizes SES funds to provide tutoring to students as well as provide in-house grade level tutoring afterschool. EBC also uses a Student Success Team(SST)intervent ion process to help students in the areas of academics, attendance, and behavior. EBC also provides afterschool homework help in our after schoolprogram. EBC also partners w ith community organizat ions that provide mentoring and family support in the areas of counseling. EBC partners w ith our authorizingdistrict in the area of special educat ion (speech, RSP, and psychology).
Teacher and Administrative Salaries (Fiscal Year 2011-12)Teacher and Administrative Salaries (Fiscal Year 2011-12)
Category District Amount State Average For Districts In Same Category
Beginning Teacher Salary $48,660 $41,462
Mid-Range Teacher Salary $74,308 $66,133
Highest Teacher Salary $94,284 $85,735
Average Principal Salary (Elementary) $115,509 $107,206
Average Principal Salary (Middle) $115,544 $111,641
Average Principal Salary (High) $121,341 $122,628
Superintendent Salary $265,000 $225,176
Percent of Budget for Teacher Salaries 41.0% 38.0%
Percent of Budget for Administrat ive Salaries 4.0% 5.0%
2012-13 SARC - Edward B. Cole Academy
Page 21 of 26

Last updated: 1/29/2014
For detailed information on salaries, see the CDE Cert ificated Salaries & Benefits Web page.
Teacher Salary Chart
Beginning Teacher Salary Mid-Range Teacher Salary Highest Teacher Salary0
20000
40000
60000
80000
100000
Principal Salary Chart
Average Principal Salary
(Elementary)
Average Principal Salary
(Middle)
Average Principal Salary
(High)
0
20000
40000
60000
80000
100000
120000
140000
2012-13 SARC - Edward B. Cole Academy
Page 22 of 26

Last updated: 1/29/2014
School Completion and Postsecondary Preparation
Admission Requirements for California’s Public Universities
University of California
Admission requirements for the University of California (UC) follow guidelines set forth in the Master Plan, which requires that the top one-eighth of the state’s highschool graduates, as well as those transfer students who have successfully completed specified college course work, be eligible for admission to the UC. Theserequirements are designed to ensure that all eligible students are adequately prepared for University-level work.
For general admissions requirements, please visit the UC Admissions Information Web page.
California State University
Eligibility for admission to the California State University (CSU) is determined by three factors:
Specific high school coursesGrades in specified courses and test scoresGraduat ion from high school
Some campuses have higher standards for part icular majors or students who live outside the local campus area. Because of the number of students who apply, a fewcampuses have higher standards (supplementary admission criteria) for all applicants. Most CSU campuses have local admission guarantee policies for students whograduate or transfer from high schools and colleges that are historically served by a CSU campus in that region. For admission, applicat ion, and fee information see the CSUWeb page.
Dropout Rate and Graduation RateDropout Rate and Graduation Rate
Indicator
School District State
2009-10 2010-11 2011-12 2009-10 2010-11 2011-12 2009-10 2010-11 2011-12
Dropout Rate 16.6 14.7 13.1
Graduat ion Rate 80.10 82.60 85.22 74.72 77.14 78.73
Dropout/Graduation Rate Chart
2009-10 2010-11 2011-12-1.0
-0.5
0.0
0.5
1.0Dropout Rate (1 year)
Graduation Rate
2012-13 SARC - Edward B. Cole Academy
Page 23 of 26

Last updated: 1/29/2014
Last updated: 1/29/2014
Last updated: 1/29/2014
This table displays, by student group, the percent of students who began the 2011-12 school year in grade twelve and were a part of the school’s most recentgraduat ing class, meeting all state and local graduat ion requirements for grade twelve complet ion, including having passed both the ELA and mathematics port ions of theCAHSEE or received a local waiver or state exemption.
Note: “N/D” means that no data were available to the CDE or LEA to report.
Completion of High School Graduation RequirementsCompletion of High School Graduation Requirements
Group
Graduating Class of 2012
School District State
All Students
Black or African American
American Indian or Alaska Nat ive
Asian
Filipino
Hispanic or Lat ino
Native Hawaiian or Pacific Islander
White
Two or More Races
Socioeconomically Disadvantaged
English Learners
Students w ith Disabilit ies
Career Technical Education Participation (School Year 2012-13)Career Technical Education Participation (School Year 2012-13)
Measure CTE Program Participation
Number of pupils part icipat ing in CTE 0
Percent of pupils complet ing a CTE program and earning a high school diploma 0.0
Percent of CTE courses sequenced or art iculated between the school and inst itut ions of postsecondary educat ion 0.0
Courses for University of California and/or California State University AdmissionCourses for University of California and/or California State University Admission
UC/CSU Course Measure Percent
2012-13 Students Enrolled in Courses Required for UC/CSU Admission
2011-12 Graduates Who Completed All Courses Required for UC/CSU Admission
2012-13 SARC - Edward B. Cole Academy
Page 24 of 26

Last updated: 1/29/2014
Note: Cells shaded in black or w ith N/A values do not require data.
*Where there are student course enrollments.
Advanced Placement Courses (School Year 2012-13)Advanced Placement Courses (School Year 2012-13)
Subject Number of AP Courses Offered* Percent of Students In AP Courses
Computer Science N/A
English N/A
Fine and Performing Arts N/A
Foreign Language N/A
Mathematics N/A
Science N/A
Social Science N/A
All Courses
2012-13 SARC - Edward B. Cole Academy
Page 25 of 26

Last updated: 1/29/2014
Instructional Planning and Scheduling
This sect ion provides information on the annual number of school days dedicated to staff development for the most recent three-year period.
Professional DevelopmentProfessional Development
Teachers have 12 non-instruct ional days per year for professional development training. In addit ion to professional development, specific monthly staff meetingsare allocated for sharing and collaborat ion between teachers and paraprofessionals. Meet ing topics are determined by teachers based on individual classroominterests and needs.
Primary areas of focus for professional development include, English Language Development strategies, common core readiness and principles, studentintervent ions, benchmark test ing and technology.
Professional development training methods include grade level training and collaborat ion, conference attendance, workshops, contractor training, and Departmentof Educat ion mentors. Teachers are supported w ith grade level collaborat ion meetings and peer assistance from colleagues.
2012-13 SARC - Edward B. Cole Academy
Page 26 of 26