EDVO-Kit · EDVO-Kit # 284 Plant Pigment Chromatography and Photosynthesis ... Separation of...
28
The Biotechnology Education Company ® ® The Biotechnology Education Company ® • 1-800-EDVOTEK • www.edvotek.com 284.091017 284 EDVO-Kit # Storage: See page 3 for specific storage requirements. Plant Pigment Chromatography and Photosynthesis EXPERIMENT OBJECTIVE The purpose of this experiment is to demonstrate light dependent reactions of photosynthesis by colorimetric assay and to gain an understanding of the biochemical processes by which they work. Through use of thin layer chromatography to separate plant pigments, students will gain an understanding of the theory and applica- tions of chromatography. SAMPLE LITERATURE Please refer to included weblink for correct version.
Transcript of EDVO-Kit · EDVO-Kit # 284 Plant Pigment Chromatography and Photosynthesis ... Separation of...

The Biotechnology Education Company®
®
The Biotechnology Education Company ® • 1-800-EDVOTEK • www.edvotek.com
284.091017
284EDVO-Kit #
Storage: See page 3 for specifi c storage
requirements.
Plant Pigment Chromatographyand Photosynthesis
EXPERIMENT OBJECTIVE
The purpose of this experiment is to demonstrate light dependent reactions of photosynthesis by colorimetric assay and to gain an understanding of the biochemical
processes by which they work. Through use of thin layer chromatography to separate plant pigments, students will gain an understanding of the theory and applica-
tions of chromatography. SAMPLE LITERATURE
Please
refer
to in
cluded
weblin
k for c
orrect
versi
on.

The Biotechnology Education Company ® • 1-800-EDVOTEK • www.edvotek.com284.091017
EDVO-Kit # 284 Plant Pigment Chromatography and Photosynthesis2
Table of Contents
Page
Experiment Components 3
Experiment Requirements 3
Background Information 4
Experiment Procedures
Experiment Overview 9
Part One: Thin Layer Chromatography of Plant Pigments 10
Part Two: Photosynthesis 12
Experiment Analysis 15
Study Questions 16
Instructor's Guidelines
Notes to the Instructor 17
Pre-Lab Preparations 18
Expected Results 24
Analysis of Results 26
Answers to Study Questions 27
Safety Data Sheets can be found on our website:
www.edvotek.com/safety-data-sheets

EDVOTEK • The Biotechnology Education Company ®1.800.EDVOTEK • www.edvotek.com
24-hour FAX: 202.370.1501 • email: [email protected]
3
284.091017
EDVO-Kit # 284 Plant Pigment Chromatography and Photosynthesis
Store Components A - G in the Freezer
A Chloroplast Extraction Buffer, concentrate, contains sorbitol, magnesium salts and is buffered at pH 7.6
B Reducing Reagent C Chloroplast Dilution Buffer, concentrate, contains phosphate buffer, sorbitol and stabilizers D DPIP (2,6-dichlorophenol-indophenol), concentrate E Standard pigments (chlorophylls a+b, xanthophylls, β-carotene)F Chromatography solvent (A mixture of ethanol, isopropanol, and water with non-ionic polymer additives) G Sarkosyl, concentrated ionic detergent
Store Remaining Components at Room Temperature
• Thin layer cellulose chromatography plate • Capillary pipets (5 µl)• Plastic transfer pipets• Microtest tubes with attached lids• Plastic centrifuge tubes (15 ml)
Experiment Components
• Visible wavelength spectrophotometer • Pencils• Clinical bench top centrifuge• Metric rulers • Test tube racks• Flood light or small portable lamps (60 watt bulb is suffi cient)• Pipette pumps or bulbs • Distilled water• 13 x 100 mm (10 ml) test tubes • 100 ml beakers• 1 ml and 5 ml pipets • Ice• Cheesecloth • 95-100% isopropanol* (2-propanol)• Aluminum foil • Fresh spinach• Graph paper
*Rubbing alcohol will not work since it is only 70% isopropanol.
Requirements
This experiment is designed for 10 lab groups
All components are intended for educational research only. They are not to be used for diagnostic or drug purposes, nor administered to or consumed by humans or animals.
EDVOTEK, The Biotechnology Education Company, and InstaStain are registered trademarks of EDVOTEK, Inc.
The Biotechnology Education Company ® • 1-800-EDVOTEK • www.edvotek.com
4B
ackg
rou
nd
Info
rmat
ion
EDVO-Kit # 284 Plant Pigment Chromatography and Photosynthesis
Duplication of any part of this document is permitted for non-profi t educational purposes only. Copyright © 1991-2009 EDVOTEK, Inc., all rights reserved. 284.091017
Background Information
Photosynthesis is the process by which plant cells use light energy for the biosynthesis of cellular components. Photosynthetic organisms form the basis of the food chain. These life forms include higher plants, algae, dinofl agellates, euglenoids, diatoms and certain bacteria. Photosynthesis consists of two biochemical phases. The general equation for the fi rst phase is:
H2O + NADP+ + Pi + ADP + Light → O2 + NADPH + H+ + ATP
The fi rst phase is light dependent. NADP+ and NADPH are oxidized and reduced forms, respectively, of nicotinamide adenine dinucleotide phosphate. The reduced form is an essential cofactor in the biosynthesis of many types of molecules such as carbohydrates. Chemical energy of ATP is required for many biochemical reactions and for maintenance of cellular integrity and function. ATP is generated from ADP and inorganic phosphate (Pi). The reaction also generates protons (H+) and molecular oxygen from water. The second phase of photosynthesis can be gener-ally written as:
CO2 + NADPH + H+ + ATP → glucose + NADP+ + ADP + Pi
The second phase is not light dependent. The reaction fi xes atmospheric carbon dioxide into organic linkage (glucose). Each phase consists of many separate chemical steps. First phase steps are called light reactions and second phase steps are called dark reactions.
Light reactions in eukaryotic cells occur in organelles called chloroplasts. Chloroplasts contain DNA and are self-replicating. These organelles con-sist of an outer membrane and a folded inner membrane. Stacked, disk-like structures called thylakoids form part of the inner membrane and it is here that light dependent photosynthetic systems are found.
The primary photosynthetic pigments are green chlorophylls. Chloro-plasts contain chlorophyll ‘a’ and ‘b’, magnesium-porphyrin complexes, and are specifi cally bound to proteins that reside on and within the inner membrane. Pure chlorophyll ‘a’ maximally absorbs light at wavelengths of around 420 and 660 nm. Chlorophyll ‘b’ absorbs primarily at approxi-mately 480 and 640 nm.
The absorption spectrum of chlorophylls can be shifted depending on with which type of protein they are associated. Other pigments found in chloroplasts include ß-carotene and xanthophylls. These pigments have an accessory light harvesting function and absorb at wavelengths in between the maxima of the chlorophylls. They all capture light energy and transfer it to the chlorophyll a at the reaction center. All these pig-ments are sensitive to light and oxygen in the purifi ed state and eventu-ally breakdown. Extremely pure preparations required for chemical and biological studies are stored under vacuum, in the dark, at -20° C.

The Biotechnology Education Company ® • 1-800-EDVOTEK • www.edvotek.com
5B
ackgro
un
d In
form
ation
EDVO-Kit # 284 Plant Pigment Chromatography and Photosynthesis
Duplication of any part of this document is permitted for non-profi t educational purposes only. Copyright © 1991-2009 EDVOTEK, Inc., all rights reserved. 284.091017
Background Information
PHOTOSYNTHETIC SYSTEMS
There are two photosynthetic systems in chloroplasts, termed Photosystem I and II. These physically distinct systems contain different proteins and ratios of chlorophylls and accessory pigments. Photosystem I is not responsible for oxygen evolution and is activated by longer wavelengths of light. Photosys-tem II is activated by shorter wavelengths of light and is required for oxygen and ATP production. Both systems contribute high energy electrons for the reduction of NADP+. Both photosystems are required for maximal photosyn-thetic activity. When light is absorbed by the chlorophyll-protein complex of photosystem I, chlorophyll becomes excited and enters a higher energy state. During return from high energy to ground state, an electron is boosted to a higher energy level and is sequentially transferred, via several membrane associated protein transport molecules, to the fi nal electron acceptor NADP+. The NADP+ is reduced to NADPH through the action of a reductase enzyme. Since this is not normally a spontaneous (energetically favorable) reaction, input of light energy is required to convert NADP+ to NADPH.
Electron transport proteins containing iron and sulfur are called ferredoxins. Other transporters are called cytochromes. A high energy electron gener-ated by light absorption in photosystem II is donated, via a specifi c sequence of transporters, to the electron defi cient photosystem I. Photosystem II then receives an electron through a series of transport proteins from H20. Water is oxidized to molecular oxygen during this process. Water is the electron donor in photosynthesis. Conversion of water, a very stable molecule, to oxygen is energetically unfavorable and would not occur to any signifi cant extent without input of light energy at photosystem II. Production of ATP occurs along the sequence of electron transfer steps. ATP is a high energy compound and requires energy for its synthesis. This energy is siphoned from the high energy electrons through a complex series of events involving membrane proteins and formation of pH gradients across chloroplast mem-branes to drive ATP synthesis.
The dark reactions of photosynthesis occur simultaneously with the light reactions in plant cells. The dark reactions are a set of seven enzyme cata-lyzed metabolic steps that synthesize glucose. The key metabolic step in plant glucose synthesis is catalyzed by the abundant enzyme ribulose diphosphate carboxylase. The majority of these reactions take place outside the chloro-plast in the cytoplasm. Most of the glucose is polymerized into starch and cellulose. The reaction involves the fi xation of carbon dioxide.

The Biotechnology Education Company ® • 1-800-EDVOTEK • www.edvotek.com
6B
ackg
rou
nd
Info
rmat
ion
EDVO-Kit # 284 Plant Pigment Chromatography and Photosynthesis
Duplication of any part of this document is permitted for non-profi t educational purposes only. Copyright © 1991-2009 EDVOTEK, Inc., all rights reserved. 284.091017
Background Information
CHROMATOGRAPHIC BASICS
Thin layer chromatography (TLC) is a valuable method used for the sepa-ration and analysis of a wide variety of biological molecules. Separation of mixtures of lipids, amino acids, sugars, nucleotides or plant pigments is often accomplished with TLC methods. The separation procedure is generally very sensitive to small differences in chemical structure. The structure affects the strength and type of interactions between sample and adsorbent. The stronger the interaction, the slower the migration rate. In addition, different sample molecules will have different solubili-ties in a given solvent system based on their chemical structure. The sepa-ration of the pigments by TLC has many advantages over using paper chromatography. It is faster, it shows better resolving power and greater sensitivity, and it is more convenient to use.
The TLC plate typically consists of a very thin layer of adsorbent material bound to a glass or plastic support. The adsorbent consists of many mi-croscopic edges, corners or fi bers. These surfaces provide a large area for chromatographic separation. After a small volume of sample solution is applied to the adsorbent surface and allowed to dry, the plate is placed in a beaker or tank containing the appropriate solvent. Only the edge
solvent
of the plate below the samples is in contact with the solvent. The solvent is drawn by capillary action into the dry adsorbent material and travels up the plate through the samples. The mi-gration rate of the sample components through the adsorbent depends on their chemical structure.
An understanding of TLC fi rst requires an introduction to ad-sorption chromatography which was discovered by the bota-nist Tswett in 1903. He observed that mixtures of plant pig-ments could be separated into different colored zones by pass-ing them through a column of calcium carbonate. Signifi cant development of adsorption chromatography occurred in the 1930's when it was used in the preparative chemistry of pig-ments. Other common adsorption chromatography materials include magnesium carbonate, silica gel, alumina and activated charcoal. Most adsorption materials are oxides, hydrated ox-ides or salts and can have surface charges. Substances that are adsorbed to these materials are polar or polarizable molecules. An example of a highly polar molecule is water. The unionized water molecule has no net charge. However, the oxygen atom has slightly more negative charge than the hydrogen atoms (which have slightly more positive charge). This is because the oxygen nucleus attracts the negatively charged electrons in the chemical bonds more strongly than the hydrogen nuclei.
Water molecules are overall electrically neutral but the indi-vidual atoms within a water molecule possess partial negative
Solvent
Front
Xanthophyl
Chlorophyll b
Chlorophyll a
β-carotene
Pigments at the origin
The Biotechnology Education Company ® • 1-800-EDVOTEK • www.edvotek.com
7B
ackgro
un
d In
form
ation
EDVO-Kit # 284 Plant Pigment Chromatography and Photosynthesis
Duplication of any part of this document is permitted for non-profi t educational purposes only. Copyright © 1991-2009 EDVOTEK, Inc., all rights reserved. 284.091017
Background Information
(the oxygen) or positive charge (the hydrogens) Molecules that exhibit par-tial or net charge possess a dipole. Adsorbent materials are polar and fully possess charged chemical groups on their surface that can interact with these groups by dipole-dipole and hydrogen bond interactions. These interactions basically involve the electrical attraction between regions of opposite partial charges. By contrast hydrogen bonding involves the attraction of hydrogen atoms that form ionic bonds with sulfur, oxygen, nitrogen, or fl uorine, to other electronegative atoms (typically oxygen or nitrogen atoms that make up other molecules or more distal regions of the same molecule). Many mol-ecules have a net negative or positive charge and can interact with groups having the net opposite charge on the adsorbent surface. These electrostatic attractions are ion-ion interactions and form the basis of ion-exchange chro-matography.
Partition chromatography is based on solubility differences exhibited by sample molecules between two liquid phases. An example of a two-phase liquid system is oil and water. In TLC, the solvent is called the mobile phase. In partition TLC, there are molecular layers of fl uid associated with the ad-sorbent surface. This fl uid represents the stationary phase. Molecules to be separated will have a preferred solubility distribution between the mobile and stationary phases depending on their structure. Molecules that have little or no solubility in the mobile phase and high solubility in the station-ary phase will migrate slowly. Conversely, sample molecules that have little solubility in the stationary phase but have high solubility in the mobile phase migrate the fastest.
Partition TLC plates are made of cellulose where the stationary phase consists of water molecules hydrating the cellulose fi bers. This hydration water does not behave like free water and is analogous to a gel-like phase. In almost all cases, both partition and adsorption processes operate simultaneously in the same TLC experiment. For instance, certain pigment molecules could directly interact with the cellulose fi bers and would be involved in an adsorption process.
OVERVIEW OF THE EXPERIMENT
Pigments travel at different rates because they are not equally soluble in the solvent. The chlorophylls are only slightly soluble in water. These molecules consist mostly of hydrogen and carbon, with some groups containing nitro-gen and oxygen. The magnesium atom is tightly bonded to the nitrogen’s in a central cavity. Chlorophyll a, located in the reaction center of photo-systems, is the primary photosynthetic pigment in plants. Chlorophyll ‘a’ and ‘b’ are structurally identical except chlorophyll ‘a’ contains a methyl group (-CH3), while ‘b’ contains an aldehyde group (-CHO). The aldehyde makes chlorophyll ‘b’ more polar and slightly more soluble in polar solvents, such as ethanol and water, than chlorophyll ‘a’. β-carotene has very low polarity since it consists only of hydrogen and carbon. Vitamin A is a derivative of

The Biotechnology Education Company ® • 1-800-EDVOTEK • www.edvotek.com
8B
ackg
rou
nd
Info
rmat
ion
EDVO-Kit # 284 Plant Pigment Chromatography and Photosynthesis
Duplication of any part of this document is permitted for non-profi t educational purposes only. Copyright © 1991-2009 EDVOTEK, Inc., all rights reserved. 284.091017
ß-carotene. Xanthophyll has a very similar structure to ß-carotene, but also contains two hydroxyl groups (-OH) that are polar and make xan-thophyll and its derivatives considerably more water and alcohol soluble than the chlorophylls and β-carotene. The chloroplast pigments are gen-erally prepared by extracting plant leaves with organic solvents such as ether and acetone which are much less polar than water. For example, ether is not soluble in water.
This laboratory consists of two experiments. In the fi rst experiment, a plant pigment mixture is prepared and resolved into its major compo-nents by cellulose TLC. Pigments from leaf tissue (spinach) are disrupted by the use of extraction buffer and are extracted from their protein-membrane complexes. The pigments preferentially partition into the organic phase, forming a mixture making possible the separation of the mixture by TLC. The pigments from spinach leaves should not be extract-ed by blending in ether or acetone. This procedure is dangerous because of the extremely fl ammable nature of these solvents. A spark from the electric motor of the blender can violently ignite the solvents. EDVOTEK® has developed an alternate solvent which avoids the use of ether or acetone systems to produce concentrated pigment samples. EDVOTEK® has developed a safe TLC solvent which primarily contains a mixture of alcohols that is safe. It will separate the mixture of ß-carotene, chloro-phyll a, chlorophyll b and xanthophylls. The Rf values when using this solvent will vary from the results obtained for that where either ether or acetone solvent is used.
The second experiment involves the assay of the light reactions of photo-synthesis using intact chloroplasts and the dye DPIP. DPIP will substitute for NADP+ as the electron acceptor in chloroplast preparations. DPIP is blue in its oxidized state and becomes colorless when reduced. Since in-tact chloroplasts produce reducing equivalents (electrons) when exposed to light, the assay preparation will lose its blue color with time. A spec-trophotometer is used to measure the resultant increase in light transmit-tance over a period to time.
Chloroplasts are fragile and remain most active if kept in ice cold, isoton-ic, buffered solutions. The ionic detergent, sarkosyl, denatures proteins and dissolves biological membranes. Solutions containing sarkosyl will disrupt chloroplast structure and destroy the photosynthetic process. This reagent will be used as a more convenient alternative to boiling which destroys chloroplast activity as a control for the photosynthesis assay.
Background Information

The Biotechnology Education Company ® • 1-800-EDVOTEK • www.edvotek.com
9EDVO-Kit # 284 Plant Pigment Chromatography and Photosynthesis
Experim
ent Pro
cedu
re
Duplication of any part of this document is permitted for non-profi t educational purposes only. Copyright © 1991-2009 EDVOTEK, Inc., all rights reserved. 284.091017
Experiment Overview
EXPERIMENT OBJECTIVE
1. To understand how thin layer chromatography separates a mixture of plant pigments.
2. To understand and calculate Rf values of plant pigments.
3. To demonstrate light dependent reactions of photosynthesis by colori-metric assay.
4. To gain an understanding of the relationship between light wave-length, light intensity and photosynthetic rate.
WORKING HYPOTHESIS
1. If leaf tissue consists of a number of different pigments, then chroma-tography can be used to separate and identify them.
2. If living chloroplasts and light energy are necessary requirements of photosynthesis, then intact chloroplasts exposed to light produce elec-trons that are accepted by DPIP resulting in a decrease in color intensity as DPIP is reduced and the percent of light transmittance will increase with time.
3. If living chloroplasts and light energy are necessary requirements of photosynthesis, then chloroplasts in either an ionic detergent or dark conditions will result in a decrease in photosynthesis, DPIP will not be reduced, and the percent of light transmittance will stay the same over time.
LABORATORY SAFETY
Gloves and safety goggles should be worn routinely as good laboratory practice.
Wear gloves and safety goggles

The Biotechnology Education Company ® • 1-800-EDVOTEK • www.edvotek.com
10EDVO-Kit # 284 Plant Pigment Chromatography and Photosynthesis
Exp
erim
ent
Pro
ced
ure
Duplication of any part of this document is permitted for non-profi t educational purposes only. Copyright © 1991-2009 EDVOTEK, Inc., all rights reserved. 284.091017
Part One: Thin Layer Chromatography of Plant Pigments
IN THIS EXPERIMENT:
• A mixture of chloroplast pigments in isopropanol has been prepared from spinach leaves. The mixture contains chlorophylls, xanthophyll and its derivatives and small amounts of ß-carotene. These pigments can be separated from one another on a cellulose thin layer chro-matography plate that will be developed in an alcohol-water based solvent system.
• A standard mixture of pigments containing chlorophylls a and b, xan-thophyll, epoxide derivatives of xanthophyll, and ß-carotene is also provided for the chromatography to aid in identifying the compo-nents of your pigment sample.
• After the experiment has been run, a wavy line can be observed at the last location of the solvent’s leading edge on the white adsorbent plate (unless the solvent was allowed to run all the way up to the top of the plate). This line is called the solvent front.
• The distance traveled by the sample from the origin divided by the distance traveled by the solvent front from the origin is defi ned as the Rf of the particular component. A sample that does not migrate from the origin has a Rf = 0 while one that has not adsorbed at all and has migrated with the front has Rf = 1. Rf is a characteristic value for a substance chromatographed on a specifi c adsorbent in a given solvent system. Rf values can be dramatically changed by changing the solvent system.
1. Measure 1 cm up from a short side (2 cm) of the TLC plate and LIGHTLY draw a straight line across the white, adsorbent side of the plate with a pencil. This is the sample origin line. If you press too hard, you will scrape adsorbent from backing.
2. Place the end of the capillary pipette nearest a graduation mark, just below surface of the pigment solution in the micro test tube labeled ‘Sample’. Watch carefully and allow the liquid to reach a graduation mark, then withdraw the pipette from the tube.
3. One microliter of the sample will be applied towards the left side of the plate. Hold the pipette vertically and straight. Touch the end of the pipette to the sample origin line until the level of the sample drops to the next graduation mark. Then quickly lift the pipette away from the adsorbent plate.
4. Using another capillary pipette, withdraw pigment solution from the microtest tube labeled ‘Standard’ as described in Step 2.
5. Apply 1 microliter of standard pigments, as described in Step 3, to the right of the sample.
6. Allow pigments to dry on plate for approximately 3 minutes.
The capillary pipets are delicate, handle them carefully.
Each graduation mark on the capillary pipets corresponds to 1 microliter. The total calibrated volume is 5 microliters.
The exact volume withdrawn is not critical as long as the level of pigment is even with a graduation mark. If more than 5 microliters is withdrawn, touch the pipet’s tip to a tissue or paper towel just long enough to allow the level of pigment go down to a graduation mark.

The Biotechnology Education Company ® • 1-800-EDVOTEK • www.edvotek.com
11EDVO-Kit # 284 Plant Pigment Chromatography and Photosynthesis
Experim
ent Pro
cedu
re
Duplication of any part of this document is permitted for non-profi t educational purposes only. Copyright © 1991-2009 EDVOTEK, Inc., all rights reserved. 284.091017
Part One: Thin Layer Chromatography of Plant Pigments
Distance Solvent Front Moved____ (millimeters)
Rf = distance pigment migrated (mm)__ distance solvent front migrated (mm)
Analysis of Pigment Bands (millimeters) Band Distance Band Pigment Rf Number (mm) Color Name Value
1
2
3
4
5
6
Quick Reference:
Since these pigments are sensitive to oxygen, they will eventually fade.
7. Place short edge of plate that is below sample origin line into the bea-ker containing solvent. Be sure the level of solvent is lower than the samples.
8. Stand the plate up by using the wall of the beaker as a support. Cover the beaker with plastic wrap.
9. Stand the plate in the solvent for approximately 30 to 40 minutes, as time allows.
10. Remove the plate and lay it fl at, adsorbent side up, on a paper towel to dry. The plate can be left for several days at room temperature IN THE DARK. Identify your plate by marking your group number or initials on the plastic back.
11. Calculate Rf for each of the spots you observe in the sample and stan-dards.
• Measure from the sample origin line to the center of the spots. • The standards used in this separation are, in order starting from the
sample origin line, ß-carotene, chlorophyll a, chlorophyll b, xantho-phyll, and epoxide derivatives of xanthophyll.
• The chlorophylls will probably be very close to each other ( ‘b’ will appear as a partially resolved zone emerging from ‘a’).

The Biotechnology Education Company ® • 1-800-EDVOTEK • www.edvotek.com
12EDVO-Kit # 284 Plant Pigment Chromatography and Photosynthesis
Exp
erim
ent
Pro
ced
ure
Duplication of any part of this document is permitted for non-profi t educational purposes only. Copyright © 1991-2009 EDVOTEK, Inc., all rights reserved. 284.091017
TUBE DISTILLED CHLOROPLASTS DPIP SARKOSYL WATER
1 (blank, no DPIP) 1.3 ml 0.2 ml - - MIX
2 (no chloroplasts) 0.5 ml - 1 ml - MIX
3 (in light) 0.3 ml 0.2 ml 1 ml - MIX
4 (in dark) 0.3 ml 0.2 ml 1 ml - MIX
5 (in sarkosyl) - 0.2 ml 1 ml 0.3 ml MIX
Part Two: Photosynthesis
A suspension of active chloroplasts in phosphate buffered sorbitol has been prepared. You will monitor the light dependent reactions of pho-tosynthesis in the chloroplasts by using the dye DPIP:
• This dye will substitute for NADP+, the natural substrate that is used at the end of the photosynthetic sequence of oxidation-reduction reactions.
• DPIP is blue in its oxidized form. When the dye is reduced (has re-ceived an electron and a proton), it becomes colorless.
• Since photosynthesis normally generates reducing equivalents used for converting NADP+ to NADPH, the dye can be used as an indicator for the photosynthetic reactions. The absorption of light energy by chlorophyll initiates these reactions.
1. Label fi ve 13 x 100 mm (10 ml) test tubes 1 through 6 at their tops.
2. Wrap Tube 4 in foil.
3. Using a 5 or 10 ml pipet, add 2.5 ml of ‘Student Chloroplast Dilution Buffer’’ to each of the six test tubes.
4. The following chart describes the pipeting of reagents to each of the tubes. Use a designated pipet for each reagent. For example, use the same pipet for only the chloroplasts, and a different pipet only for the DPIP dye, etc.
Tube 4 is wrapped in foil (including covering the top with the foil).
Mix the tubes thoroughly, since the dilution buffer is denser than the other reagents. Pipet the sarkosyl in Tube 5 after ALL other pipet-ings have been completed. If there is an inadvertent cross-contami-nation of the sarkosyl into the other tubes, it will ruin the experi-ment. Use 1 ml pipets for volumes of 1 ml or less.
The Biotechnology Education Company ® • 1-800-EDVOTEK • www.edvotek.com
13EDVO-Kit # 284 Plant Pigment Chromatography and Photosynthesis
Experim
ent Pro
cedu
re
Duplication of any part of this document is permitted for non-profi t educational purposes only. Copyright © 1991-2009 EDVOTEK, Inc., all rights reserved. 284.091017
Part Two: Photosynthesis
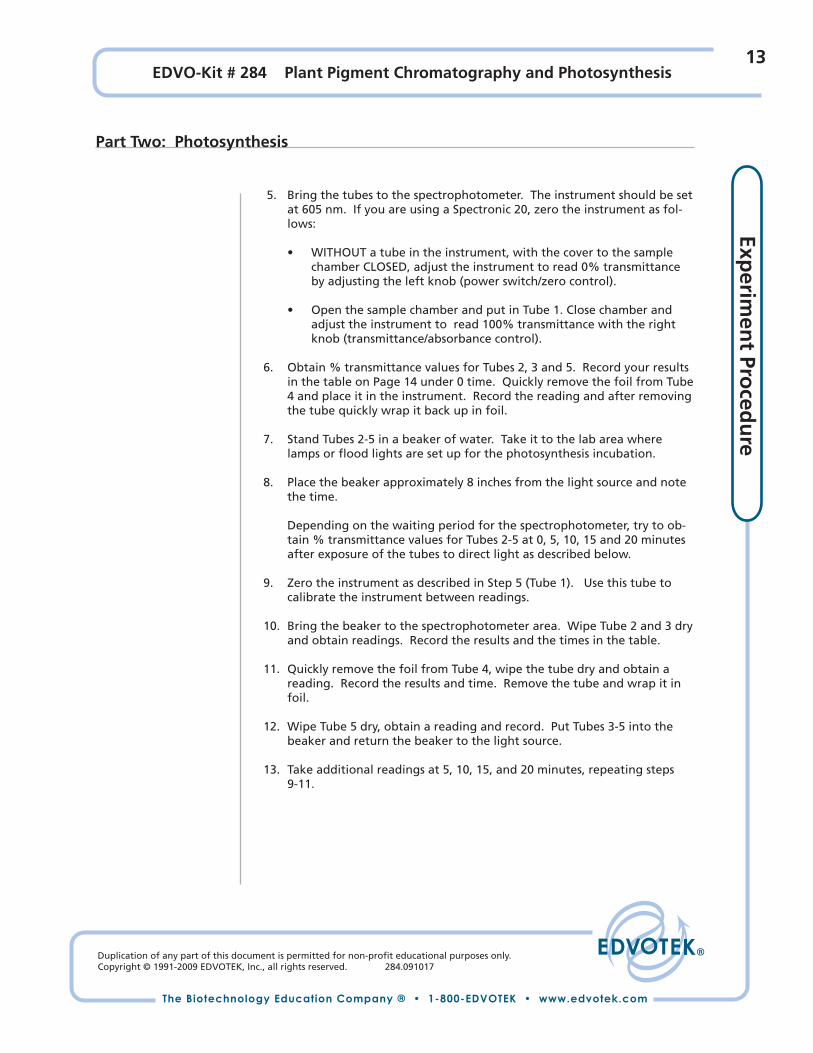
5. Bring the tubes to the spectrophotometer. The instrument should be set at 605 nm. If you are using a Spectronic 20, zero the instrument as fol-lows:
• WITHOUT a tube in the instrument, with the cover to the sample chamber CLOSED, adjust the instrument to read 0% transmittance by adjusting the left knob (power switch/zero control).
• Open the sample chamber and put in Tube 1. Close chamber and adjust the instrument to read 100% transmittance with the right knob (transmittance/absorbance control).
6. Obtain % transmittance values for Tubes 2, 3 and 5. Record your results in the table on Page 14 under 0 time. Quickly remove the foil from Tube 4 and place it in the instrument. Record the reading and after removing the tube quickly wrap it back up in foil.
7. Stand Tubes 2-5 in a beaker of water. Take it to the lab area where lamps or fl ood lights are set up for the photosynthesis incubation.
8. Place the beaker approximately 8 inches from the light source and note the time.
Depending on the waiting period for the spectrophotometer, try to ob-tain % transmittance values for Tubes 2-5 at 0, 5, 10, 15 and 20 minutes after exposure of the tubes to direct light as described below.
9. Zero the instrument as described in Step 5 (Tube 1). Use this tube to calibrate the instrument between readings.
10. Bring the beaker to the spectrophotometer area. Wipe Tube 2 and 3 dry and obtain readings. Record the results and the times in the table.
11. Quickly remove the foil from Tube 4, wipe the tube dry and obtain a reading. Record the results and time. Remove the tube and wrap it in foil.
12. Wipe Tube 5 dry, obtain a reading and record. Put Tubes 3-5 into the beaker and return the beaker to the light source.
13. Take additional readings at 5, 10, 15, and 20 minutes, repeating steps 9-11.

The Biotechnology Education Company ® • 1-800-EDVOTEK • www.edvotek.com
14EDVO-Kit # 284 Plant Pigment Chromatography and Photosynthesis
Exp
erim
ent
Pro
ced
ure
Duplication of any part of this document is permitted for non-profi t educational purposes only. Copyright © 1991-2009 EDVOTEK, Inc., all rights reserved. 284.091017
% TRANSMITTANCE
TUBE TIME (in minutes)
0 5 10 15 20 2 (no chloroplasts)
3 (in light)
4 (in dark)
5 (in sarkosyl)
Part Two: Photosynthesis
14. Graph the percentage transmittance from tubes 2, 3, 4, 5.

The Biotechnology Education Company ® • 1-800-EDVOTEK • www.edvotek.com
15EDVO-Kit # 284 Plant Pigment Chromatography and Photosynthesis
Experim
ent Pro
cedu
re
Duplication of any part of this document is permitted for non-profi t educational purposes only. Copyright © 1991-2009 EDVOTEK, Inc., all rights reserved. 284.091017
1. Using Graph paper, graph the percent transmittance from Tubes 2, 3, 4, 5 for your lab group.
2. Title the Graph: Percent Transmittance for Chloroplasts Incubated with DPIP versus Time.
What is the independent variable? (x) axis?
What is the dependent variable? (y) axis?
3. What two hypotheses are being tested in this experiment?
Experiment Analysis

The Biotechnology Education Company ® • 1-800-EDVOTEK • www.edvotek.com
16EDVO-Kit # 284 Plant Pigment Chromatography and Photosynthesis
Exp
erim
ent
Pro
ced
ure
Duplication of any part of this document is permitted for non-profi t educational purposes only. Copyright © 1991-2009 EDVOTEK, Inc., all rights reserved. 284.091017
Study Questions
1. List and explain some of the factors involved in the separation of pigments?
2. Assuming that partition chromatography was primarily operating in the TLC experiment, which of the four pigments, ß-carotene, chlo-rophyll ‘a’, chlorophyll ‘b’ or xanthophyll, is the most soluble in the solvent system used? Which is the least soluble?
3. Which kind of solvent system would you expect to increase the mi-gration rate of ß-carotene, water : ethanol (1:1) or petroleum ether : acetone (9:1)? Why? Would you expect the Rf of the carotene to change with these different solvents?
4. If the TLC experiment were run on a longer plate for a longer time, the separation between chlorophyll ‘a’ and ‘b’ would become larger. Eventually, two completely resolved spots would be seen. Why? Would you expect the Rf values for the pigments to signifi cantly change between a shorter and a longer TLC run?
5. What is the function of DPIP in the experiment?
6. Explain the purpose of each tube you prepared for the photosyn-thesis experiment. Did you observe any signifi cant changes in the % transmittance with time in tubes 2-5? What would you expect to occur if tubes 3-5 were moved further away from the light source?
7. Does a decrease in the % transmittance for a colored liquid sample indicate an increase or a decrease in the absorption of the incident light when compared to a colorless reference? If a solution of pig-ment appears green, does this mean that the light absorbed by the pigment is primarily green? Chloroplasts are too large to go into solution. Aqueous preparations of chloroplasts form suspensions. Suspensions tend to scatter incident light which results in a decrease in the % transmittance. However, this is not the same as absorption of light. When the detergent sarkosyl is added to a suspension of chloroplasts, the % transmittance increases. Why?
8. NADPH absorbs light a 340 nm (ultraviolet region), while NADP+ does not absorb at this wavelength. If an ultraviolet spectropho-tometer was available, can you design a method to monitor the photosynthetic light reactions with a chloroplast preparation? As-sume light scattering will not be a problem.

The Biotechnology Education Company ® • 1-800-EDVOTEK • www.edvotek.com
Instructo
r's Guid
e17
EDVO-Kit # 284 Plant Pigment Chromatography and Photosynthesis
Duplication of any part of this document is permitted for non-profi t educational purposes only. Copyright © 1991-2009 EDVOTEK, Inc., all rights reserved. 284.091017
OVERVIEW OF LABORATORY INVESTIGATIONS
The "hands-on" laboratory experience is a very important component of the science courses. Laboratory experiment activities allow students to identify assumptions, use critical and logical thinking, and consider alternative expla-nations, as well as help apply themes and concepts to biological processes.
EDVOTEK® experiments have been designed to provide students the op-portunity to learn very important concepts and techniques used by scientists in laboratories conducting biotechnology research. Some of the experimen-tal procedures may have been modifi ed or adapted to minimize equipment requirements and to emphasize safety in the classroom, but do not com-promise the educational experience for the student. The experiments have been tested repeatedly to maximize a successful transition from the labora-tory to the classroom setting. Furthermore, the experiments allow teach-ers and students the fl exibility to further modify and adapt procedures for laboratory extensions or alternative inquiry-based investigations.
ORGANIZING AND IMPLEMENTING THE EXPERIMENT
Class size, length of laboratory sessions, and availability of equipment are factors which must be considered in the planning and the implementation of this experiment with your students. These guidelines can be adapted to fi t your specifi c set of circumstances.
If you do not fi nd the answers to your questions in this section, a variety of resources are continuously being added to the EDVOTEK® web site.
www. edvotek.com
In addition, Technical Service is available from 9:00 am to 6:00 pm, East-ern time zone. Call for help from our knowledgeable technical staff at 1-800-EDVOTEK (1-800-338-6835).
Safety Data Sheets can be found on our website:
www.edvotek.com/safety-data-sheets
Notes to the Instructor
The Biotechnology Education Company ® • 1-800-EDVOTEK • www.edvotek.com
Inst
ruc
tor's
Gui
de
18EDVO-Kit # 284 Plant Pigment Chromatography and Photosynthesis
Duplication of any part of this document is permitted for non-profi t educational purposes only. Copyright © 1991-2009 EDVOTEK, Inc., all rights reserved. 284.091017
Pre-Lab Preparations
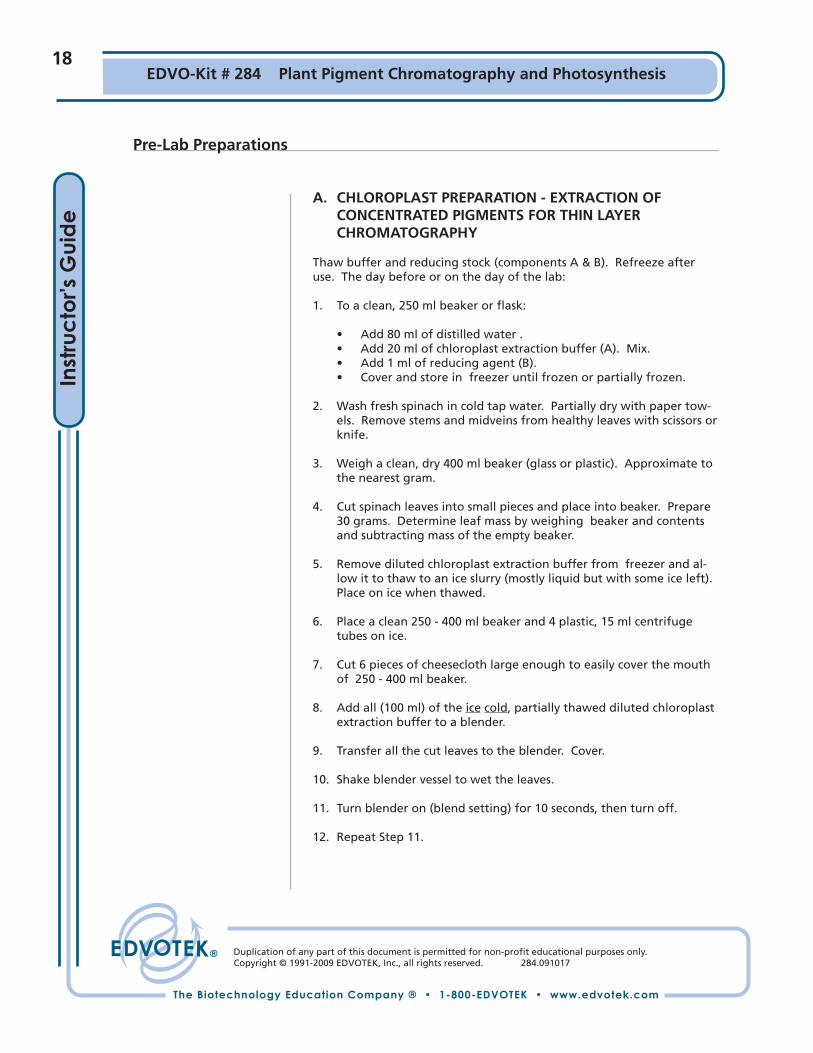
A. CHLOROPLAST PREPARATION - EXTRACTION OF CONCENTRATED PIGMENTS FOR THIN LAYER CHROMATOGRAPHY
Thaw buffer and reducing stock (components A & B). Refreeze after use. The day before or on the day of the lab:
1. To a clean, 250 ml beaker or fl ask:
• Add 80 ml of distilled water . • Add 20 ml of chloroplast extraction buffer (A). Mix. • Add 1 ml of reducing agent (B). • Cover and store in freezer until frozen or partially frozen.
2. Wash fresh spinach in cold tap water. Partially dry with paper tow-els. Remove stems and midveins from healthy leaves with scissors or knife.
3. Weigh a clean, dry 400 ml beaker (glass or plastic). Approximate to the nearest gram.
4. Cut spinach leaves into small pieces and place into beaker. Prepare 30 grams. Determine leaf mass by weighing beaker and contents and subtracting mass of the empty beaker.
5. Remove diluted chloroplast extraction buffer from freezer and al-low it to thaw to an ice slurry (mostly liquid but with some ice left). Place on ice when thawed.
6. Place a clean 250 - 400 ml beaker and 4 plastic, 15 ml centrifuge tubes on ice.
7. Cut 6 pieces of cheesecloth large enough to easily cover the mouth of 250 - 400 ml beaker.
8. Add all (100 ml) of the ice cold, partially thawed diluted chloroplast extraction buffer to a blender.
9. Transfer all the cut leaves to the blender. Cover.
10. Shake blender vessel to wet the leaves.
11. Turn blender on (blend setting) for 10 seconds, then turn off.
12. Repeat Step 11.
The Biotechnology Education Company ® • 1-800-EDVOTEK • www.edvotek.com
Instructo
r's Guid
e19
EDVO-Kit # 284 Plant Pigment Chromatography and Photosynthesis
Duplication of any part of this document is permitted for non-profi t educational purposes only. Copyright © 1991-2009 EDVOTEK, Inc., all rights reserved. 284.091017
Pre-Lab Preparations
13. Slowly pour spinach homogenate through cheesecloth into ice cold bea-ker. Periodically stop pouring and allow homogenate to fi lter through cheesecloth.
14. Occasionally fold up cheesecloth into a sack and squeeze out the residu-al liquid. Some of the debris may have to be removed from the cheese-cloth. Discard the cheesecloth and debris after fi ltering is complete.
15. Transfer 10 ml of crude extract in the beaker to each of 4 ice cold, plastic centrifuge tubes. Fill to the 10 ml graduation on the tubes. Cap.
16. Place the tubes into a clinical centrifuge. Arrange the tubes so they are properly counterbalanced. Centrifuge at highest speed (approximately 1000 - 2000 x g) for 5 minutes.
17. Pour off supernatant. Blot away residual buffer by keeping the tube inverted on a paper towel for a minute.
18. Using a 1 ml pipet, add 1 ml of 95-100% isopropanol to each tube. Cap.
19. Thoroughly and vigorously mix each tube until the precipitate is broken up and resuspended. Vortex, if possible or use a pipet or stirring rod to help break up precipitate. Liquid should become dark green and thicker.
20. Place the capped tubes in the centrifuge, correctly balanced, and centri-fuge at full speed for 10 minutes.
21. Using a plastic transfer pipet, carefully remove the supernatant from each tube and transfer to a plastic microtest tube. Try not to transfer any of the precipitate. You may centrifuge again if necessary.
22. Cap the microtest tubes and label them ‘Sample’. Store in the freezer, in the dark.
The Biotechnology Education Company ® • 1-800-EDVOTEK • www.edvotek.com
Inst
ruc
tor's
Gui
de
20EDVO-Kit # 284 Plant Pigment Chromatography and Photosynthesis
Duplication of any part of this document is permitted for non-profi t educational purposes only. Copyright © 1991-2009 EDVOTEK, Inc., all rights reserved. 284.091017
Pre-Lab Preparations
20 cm
2 cm
5 cm
5 cm
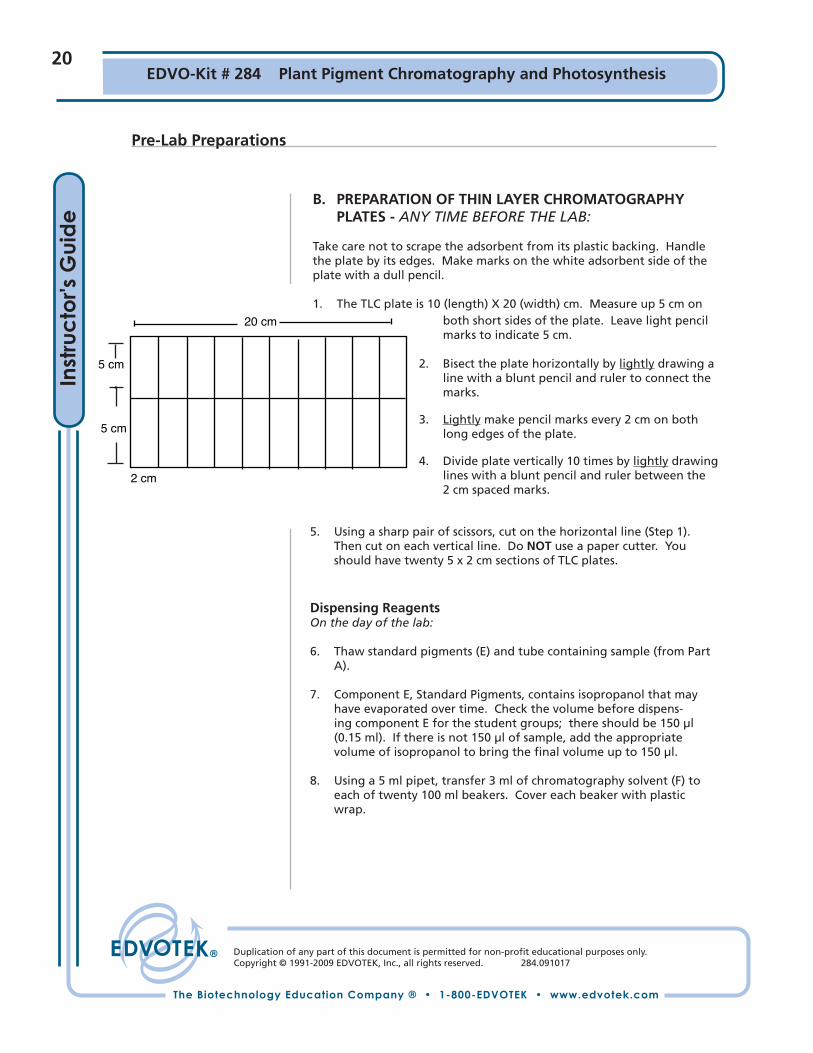
B. PREPARATION OF THIN LAYER CHROMATOGRAPHY PLATES - ANY TIME BEFORE THE LAB:
Take care not to scrape the adsorbent from its plastic backing. Handle the plate by its edges. Make marks on the white adsorbent side of the plate with a dull pencil.
1. The TLC plate is 10 (length) X 20 (width) cm. Measure up 5 cm on both short sides of the plate. Leave light pencil marks to indicate 5 cm.
2. Bisect the plate horizontally by lightly drawing a line with a blunt pencil and ruler to connect the marks.
3. Lightly make pencil marks every 2 cm on both long edges of the plate.
4. Divide plate vertically 10 times by lightly drawing lines with a blunt pencil and ruler between the
2 cm spaced marks.
5. Using a sharp pair of scissors, cut on the horizontal line (Step 1). Then cut on each vertical line. Do NOT use a paper cutter. You should have twenty 5 x 2 cm sections of TLC plates.
Dispensing ReagentsOn the day of the lab:
6. Thaw standard pigments (E) and tube containing sample (from Part A).
7. Component E, Standard Pigments, contains isopropanol that may have evaporated over time. Check the volume before dispens-ing component E for the student groups; there should be 150 µl (0.15 ml). If there is not 150 µl of sample, add the appropriate volume of isopropanol to bring the fi nal volume up to 150 µl.
8. Using a 5 ml pipet, transfer 3 ml of chromatography solvent (F) to each of twenty 100 ml beakers. Cover each beaker with plastic wrap.
The Biotechnology Education Company ® • 1-800-EDVOTEK • www.edvotek.com
Instructo
r's Guid
e21
EDVO-Kit # 284 Plant Pigment Chromatography and Photosynthesis
Duplication of any part of this document is permitted for non-profi t educational purposes only. Copyright © 1991-2009 EDVOTEK, Inc., all rights reserved. 284.091017
Pre-Lab Preparations
C. PREPARATION OF CHLOROPLASTS FOR PHOTOSYNTHESIS
It is important to keep the chloroplasts ice cold during all stages of prepara-tion and storage. Thaw all buffers.
On the day before or the day of the lab:
1. To a clean 250 ml beaker or fl ask:
• Add 120 ml of distilled water. • Add 30 ml of chloroplast extraction buffer (A). • Add 1.5 ml of reducing reagent (B). Mix. • Transfer 50 ml of diluted extraction buffer to a separate beaker or
fl ask. • Cover both vessels. Store the larger volume in the freezer (this is to
be used in the blender to homogenize spinach) and the smaller vol-ume in the refrigerator (this is to be used to resuspend chloroplasts).
Refer to pages 18 and 19 and repeat steps 2 - 15 in Pre-lab Preparations, Part A.
2. Place tubes in centrifuge, accurately balanced, and centrifuge at high speed, approximately 1000-2000 x g, for 5 minutes.
It is importantto keep the chloroplasts ice cold during all stages of preparation and storage. Thaw all buffers.
9. Using a plastic transfer pipet:
• Put 2 or 3 drops of sample pigment extract into each of 10 microtest tubes. Cap.
• Label “Sample”. • Each tube should be shared between 2 students.
10. Using a fresh plastic transfer pipet, put 1 drop of standard pigments (E) into 10 microtest tubes. Cap.
• Label “Standard”. • Each tube should be shared between 2 students
For TLC experiment, each student requires:
•Chromatography solvent (in covered beaker)•Pencil•One 5 x 2 cm TLC plate •Metric ruler•2 capillary pipets
For TLC experiment, every two students require:
•1 microtest tube of ‘sample’ pigment extract•1 microtest tube of ‘standard’ pigments

The Biotechnology Education Company ® • 1-800-EDVOTEK • www.edvotek.com
Inst
ruc
tor's
Gui
de
22EDVO-Kit # 284 Plant Pigment Chromatography and Photosynthesis
Duplication of any part of this document is permitted for non-profi t educational purposes only. Copyright © 1991-2009 EDVOTEK, Inc., all rights reserved. 284.091017
Pre-Lab Preparations
3. Pour off the supernatant, blot residual liquid at the mouths of the tubes with a paper towel or wipe. Put the tubes on ice. The pellet may be loose; take care it does not slip out.
4. Remove the vessel containing 50 ml of diluted extraction buffer from the refrigerator and put it on ice.
5. To each centrifuge tube, add 1 ml of diluted extraction buffer.
6. GENTLY resuspend the chloroplast pellets by repetitive pipeting and tapping of the tubes. Keep cold. A clean Pasteur pipet may help to resuspend the chloroplasts.
7. After resuspension, pool all the chloroplast suspensions into one centrifuge tube. Cap.
8. Label “Chloroplast Concentrate”. Store on ice in refrigerator.
Within one hour before the lab:
9. Chill a clean 15 ml centrifuge tube on ice.
• Add 7 ml of distilled water. • Add 2 ml of the chloroplast dilution buffer (C). • Mix and chill.
10. Chill 6-10 clean 10 ml (13 x 100 mm) test tubes.
• Gently mix the chloroplast concentrate (Step 9) by tapping. • Add 1 ml of the chloroplast concentrate to the tube of cold
diluted chloroplast dilution buffer. • Cap and gently mix the diluted chloroplasts by inversion. Keep
on ice. • Dispense 1 ml into each of the chilled test tubes for the student
groups. 11. To a clean 400 ml beaker or fl ask:
• Add 170 ml of distilled water. • Add 80 ml of chloroplast dilution buffer (C). Mix. • Label the vessel “Student Chloroplast Dilution Buffer”. Store on
ice. DIspense 20 ml per group.
12. Prepare an incubation area with several lights.

The Biotechnology Education Company ® • 1-800-EDVOTEK • www.edvotek.com
Instructo
r's Guid
e23
EDVO-Kit # 284 Plant Pigment Chromatography and Photosynthesis
Duplication of any part of this document is permitted for non-profi t educational purposes only. Copyright © 1991-2009 EDVOTEK, Inc., all rights reserved. 284.091017
Pre-Lab Preparations
D. SPECTROPHOTOMETER
On the day of the lab:
The photosynthesis assay is designed so test tubes can be placed directly into a Spectronic 20. If you have another type of instrument with cuvettes, students will need to transfer appropriate volumes for readings. Review operating instructions for spectrophotometer.
1. Warm up the spectrophotometer for one half hour before the lab. Set the wavelength to 605 nm.
2. If a working spectrophotometer is not available the experimental re-sults can be clearly observed after 10 minutes. Similarly, if there is not enough time for all the groups to take readings, visual inspection is suf-fi cient or the number of lab groups can be decreased. However, there are enough reagents for 10 groups.
You may want to time stagger your groups during the Experimental Procedures.
FOR THE PHOTOSYNTHESIS EXPERIMENT, EACH STUDENT GROUP REQUIRES:
• 6-10 clean 10 ml (13 x 100 mm) test tubes• 100 ml beaker containing approximately 80 ml of water• Two 5 or 10 ml pipet• Three 1 ml pipets• 20 ml of Cold chloroplast dilution buffer on ice • 5 ml of Distilled water• 1 ml of Diluted chloroplasts on ice • 5 ml of DPIP (D) • 1 ml of Sarkosyl (G)• Aluminum foil• Test tube rack• Pipet pumps

The Biotechnology Education Company ® • 1-800-EDVOTEK • www.edvotek.com
Inst
ruc
tor's
Gui
de
24EDVO-Kit # 284 Plant Pigment Chromatography and Photosynthesis
Duplication of any part of this document is permitted for non-profi t educational purposes only. Copyright © 1991-2009 EDVOTEK, Inc., all rights reserved. 284.091017
Expected Results - Part One
Analysis of Pigment Bands (millimeters) Band Distance Band Pigment Rf Number (mm) Color Name Value
1
2
3
4
5
6
Typical Rf values for the standard pigments:
EDVOTEK® solvent Acetone Solvent (not included in kit)β-carotene 0 β-carotene faint yellow 0.98chlorophyll a 0.29 xanthophyll reddish yellow 0.80chlorophyll b 0.44 xanthophyll yellow 0.50xanthophyll 0.65 chlorophyll a blue-green 0.46 chlorophyll b yellow-green 0.30 xanthophyll yellow 0.15
If using EDVOTEK® solvent, faint yellow spots with Rf values greater than xanthophyll may be observable in the pigment extract sample, Rfs of approximately 0.77 and 0.83. These are epoxide derivatives of xan-thophyll, such as lutein epoxide and neoxanthin. The ß-carotene may be diffi cult to detect in the pigment sample extract. When the plate is completely dry, this pigment may be observable as a faint orange-yel-low tinge at the origin.
If using acetone as a solvent, ß-carotene, a yellow band, should be close to the top of the plate. Several different xanthophylls follow, and range from a yellowish-red and red close to the top, to greys and fi nally to yellow at around and Rf of 0.50. Close behind this band is a blue-green band, representing an isomer of chlorophyll a, and a yel-low-green band at Rf 0.30, representing another isomer of chlorophyll b. The last band which is yellow in color and close to the origin has an Rf of 0.15, is xanthophylls.

The Biotechnology Education Company ® • 1-800-EDVOTEK • www.edvotek.com
Instructo
r's Guid
e25
EDVO-Kit # 284 Plant Pigment Chromatography and Photosynthesis
Duplication of any part of this document is permitted for non-profi t educational purposes only. Copyright © 1991-2009 EDVOTEK, Inc., all rights reserved. 284.091017
Expected Results - Part Two
ANALYSIS OF TUBES
Tube 1 of the photosynthesis experiment should appear green. This tube contains chlorophyll, but no DPIP and is used to calibrate the instrument be-fore and between readings. If all the DPIP was reduced in tubes 3-5, there would still be less than 100% transmittance of light.
Tube 2 should remain dark blue (approximately 1-2% transmittance).
Tube 3 should fade until the % transmittance approaches the value of Tube 2.
Tube 4 and Tube 5 should remain dark blue and give approximately the same % transmittance values as at 0 time (1-3% transmittance). Tube 5 may give somewhat higher initial transmittance readings than tubes 2-4. This is dis-cussed in questions and answers. Typically, Tube 3 gives fi nal transmittance values in the range of 50-60% after 12 to 15 minutes.
% TRANSMITTANCE
TUBE TIME (in minutes)
0 5 10 15 20 2 (no chloroplasts) 28.3 28.3 28.3 28.3 28.3
3 (in light) 28.3 50.1 58.5 60.3 60.5
4 (in dark) 28.3 29.5 31.5 31.0 29.5
5 (in sarkosyl) 29.5 29.6 29.7 29.6 29.0

The Biotechnology Education Company ® • 1-800-EDVOTEK • www.edvotek.com
Inst
ruc
tor's
Gui
de
26EDVO-Kit # 284 Plant Pigment Chromatography and Photosynthesis
Duplication of any part of this document is permitted for non-profi t educational purposes only. Copyright © 1991-2009 EDVOTEK, Inc., all rights reserved. 284.091017
Analysis of Results
1. Graph the percent transmittance from tubes 2, 3, 4, 5 for your lab group.
2. Title: Percent Transmittance for Chloroplasts Incubated with DPIP versus time.
What is the independent variable? (x) axis? Time in minutes
What is the dependent variable? (y) axis? Transmittance in percent
0 5 10 15 20
25
35
45
55
65
30
50
40
60
2
45
3
Time (in minutes)
Tran
smit
tan
ce (
%)
3. What two hypotheses are being tested in this experiment?
If intact chloroplasts exposed to light produce electrons that are ac-cepted by DPIP resulting in a decrease in color intensity as it is reduced, then the percentage of transmittance of light will increase with time.
If chloroplasts are absent, in the dark or exposed to sarkosyl, then no elec-trons will be produced and DPIP will not be reduced (the dark color will remain), then the percentage of transmit-tance of light will stay the same with time.
= no chloroplasts (2)
= in light (3)
= in dark (4)
= in sarkosyl (5)
KEY

The Biotechnology Education Company ® • 1-800-EDVOTEK • www.edvotek.com
Instructo
r's Guid
e27
EDVO-Kit # 284 Plant Pigment Chromatography and Photosynthesis
Duplication of any part of this document is permitted for non-profi t educational purposes only. Copyright © 1991-2009 EDVOTEK, Inc., all rights reserved. 284.091017
1. List and explain some of the factors involved in the separation of pigments? • The solvent mixture and the adsorptive surface chosen in order to provide
the best separation of the pigments. • The affi nity of the adsorptive surface and the solubility in the solvent. • The time allowed for separation. A short run will result in fewer bands
that are not clearly separated from each other.
2. Assuming that partition chromatography was primarily operating in the TLC experiment, which of the four pigments, ß-carotene, chlorophyll ‘a’, chlo-rophyll ‘b’ or xanthophyll, is the most soluble in the solvent system used? Which is the least soluble?
Xanthophyll and its derivatives are most soluble (carried furthest by the ED-VOTEK® solvent) and ß-carotene is the least soluble.
3. Which kind of solvent system would you expect to increase the migration rate of ß-carotene, water : ethanol (1:1) or petroleum ether : acetone (9:1)? Why? Would you expect the Rf of the carotene to change with these differ-ent solvents?
Petroleum ether-acetone will increase the migration rate because it is much less polar. The ß-carotene is not soluble in water and alcohol, but is very soluble in petroleum ether-acetone. The Rf values will be substantially dif-ferent in the two solvents (for the same adsorbent). Refer to the expected results section for a comparison of migration rates of the two solvents.
4. If the TLC experiment were run on a longer plate for a longer time, the separation between chlorophyll ‘a’ and ‘b’ would become larger. Eventually, two completely resolved spots would be seen. Why? Would you expect the Rf values for the pigments to signifi cantly change between a shorter and a longer TLC run?
Samples are able to pass through more adsorbent during longer runs. This in-creases the amount of fractionation and amplifi es small differences between sample components. The Rf values do not signifi cantly change with longer runs because they are constant ratios of sample and solvent front migration distances.
5. What is the function of DPIP in the experiment? DPIP is a substitute for NADP+ in chloroplast preparations. It accepts the
electrons removed from the splitting of water in the light dependent phase of photosynthesis. The deep blue color of DPIP will decrease in intensity to colorless as it accepts electrons and is reduced to NADPH.
6. Explain the purpose of each tube you prepared for the photosynthesis ex-
periment. Did you observe any signifi cant changes in the % transmittance with time in tubes 2-5? What would you expect to occur if tubes 3-5 were moved further away from the light source?
Tube 1 is a reference sample to zero the spectrophotometer. It contains chlo-roplasts, but no DPIP. Tube 2 shows the initial transmittance values due to the dye alone and is a control that can demonstrate whether factors OTHER than the chloroplasts contribute to the dye reduction, i.e., to make sure that only
Answers to Study Questions

Please refer to the kit insert for the Answers to
Study Questions