Educational Standard Assignment: Some Findings Working with CAT & SAT NSDL 2010 Annual Meeting René...
24
Educational Standard Assignment: Some Findings Working with CAT & SAT NSDL 2010 Annual Meeting René Reitsma 1 , Anne Diekema 2 Byron Marshall 1 , Trevor Chart 1 1 Oregon State University 2 Utah State University
-
date post
21-Dec-2015 -
Category
Documents
-
view
213 -
download
0
Transcript of Educational Standard Assignment: Some Findings Working with CAT & SAT NSDL 2010 Annual Meeting René...
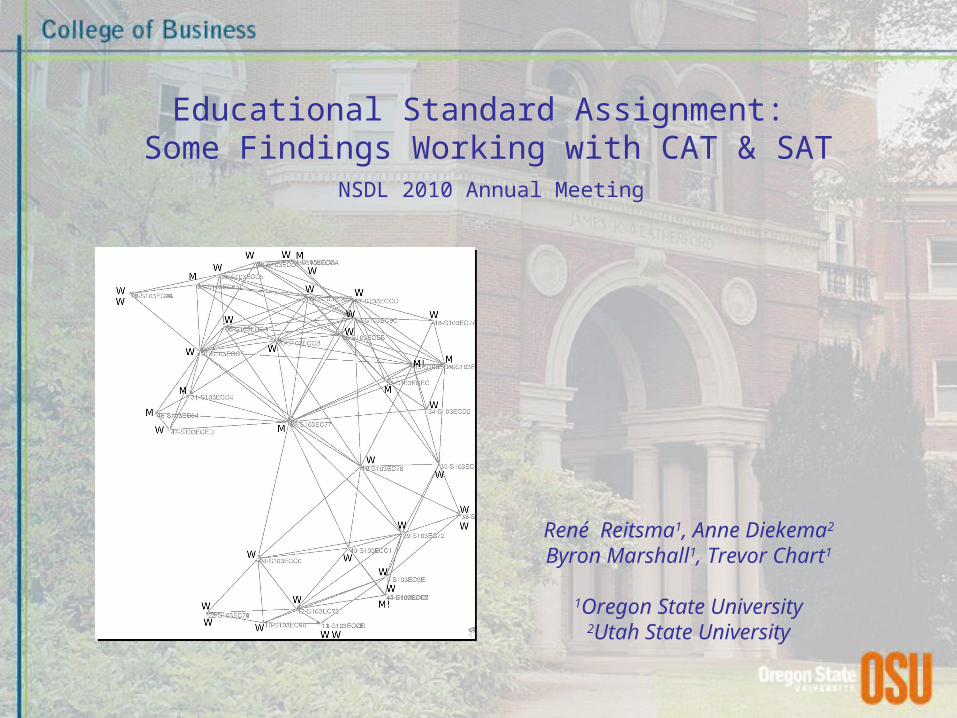
Educational Standard Assignment: Some Findings Working with CAT & SAT
NSDL 2010 Annual Meeting
René Reitsma1, Anne Diekema2
Byron Marshall1, Trevor Chart1
1Oregon State University2Utah State University

Educational Standard Assignment: Some Findings Working with CAT & SAT… Overview
• Need for automated educational standard assignment in TeachEngineering.org.
• Part 1: Comparative analysis of standard assignment by CAT and human catalogers (René & Anne).
• Part 2: What about standard crosswalking? Analysis of 4,790,801 Science SAT alignments (René, Byron and Trevor).

Automated Standard Alignment in TeachEngineering
• www.teachengineering.org:
– 578 hands-on science and math K-12 activities.
– 339 lessons
– 54 multi-lesson, curricular units
• Explicit alignments: by author, supervised by collection catalogers:
– cover only one state mean 4.5 stds./document.
• Similar coverage across all states: 917 * 4.5 * 50 = 200,000+ assignments.
– 200+ per document
– 917 * 4.5 * 10 = 40,000+ annual updates

TE, ASN, CAT, TD, NSDL ‘Ecosystem’
BIG!! thank you to CNLP and friends for CAT.
FYI, ‘new’ CAT (August 2010) is really fast and includesITEEA* & Common Core Math
*Intern. Techn. & Engr. Educators Association

Part 1: Content Assignment Tool (CAT) & Explicit Standard Assignment in TeachEngineering
• 4,165 explicit alignments in TE
• 400,000+ (unsupervised) CAT assignments (science, math, ITEEA, common core math).
• Q-1: How are CAT assignments different from human (explicit) assignments?
• Q-2: Do the differences tell us something about how humans assign these standards in the first place?
• Q-3: Do the differences inform CAT and/or human improvements?
• BTW: What do we really mean when we say that a standard and a curricular item ‘align?’ (Reitsma, Marshall, Zarske (IPM – 2010))

(Inductive) Method & Data
• Approach: build networks of standards; layout the networks, interpret their spatial arrangements:
– Networks are based on how standards have been assigned to curriculum.
– Any two jointly assigned standards are considered ‘linked.’
• Compare and contrast the networks for clues.
• Data:
– TeachEngineering collection – Jan. 2009.
– CAT & human standard assignments of CO 2007 Science standards.

CO 2007 Science Standard Assignments
Human Catalogers
(CO Curriculum)
CAT (CO curriculum
cataloged by humans)
Curricular items assigned
86 86
Assignments 324 139
Mean number of assignments per curricular item
3.78 1.61
Standards covered 63 47
Standard reuse rate 5.14 2.96

CO 2007 Science Standard Assignments... Cont.’d
CAT assignments (CO curriculum cataloged by humans)
Yes No Total
Human cataloger
assignments
Yes 25 299 324
No 114 NA
Total 139
– CAT recall = 25 / 324 = .077*
– CAT precision = 25 / 139 = .18*
*if the humans did it right (?)

‘Curricular units’
– Human network is denser and more clustered.
– Human clusters are curricular units
– Human clusters link through common standards.
– CAT: open structure; less clustering. Has no knowledge of curricular units.

Weighted or unweighted?
• FR diagrams consider the network unweighted; i.e., all links have equal value/weight.
• Two weights:
– TF/IDF-like: weigh a standard link inversely proportional to the size of its company.
– ‘Fidelity:’ weigh a link between standards proportional to their mutual fidelity across the collection.
• Compute the KK network layouts

• Resulting KK diagrams showed essentially the same properties as the FR diagrams (hierarchical cluster analysis of two-dimensional positions)

CO Standards: ‘Method’ vs. ‘World’
• World standards (W): express facts and principles about the empirical world.
– E.g., S103EC87: Light and sound waves have distinct properties: frequency, wavelength and amplitude.
• Method standards (M!): express ways and means of conducting science.
– E.g., S103ECE9: A controlled experiment must have comparable results when repeated.
• Some method standards ‘contaminated’ with world terms and/or examples (M):
– E.g., S103ECD4: Technology is needed to explore space (for example: telescopes, spectroscopes, spacecraft, life support systems).
• Question: How do CAT and human catalogers compare on World vs. Method?

Standards: ‘Method’ vs. ‘World…’ Cont.’d
Standards M & M!standards
M & M!standards %
M! standards
M! standards %
Humans 63 21 33.33 16 25.40
CAT 47 9 19.15 3 6.38

W = worldM! = (pure) methodM = method with world examples
– CAT under-assigned method.
– Humans: method standards as curricular hubs
– CAT central method hub: S103EC77:
“physical properties of solids, liquids, gases and the plasma state and their changes can be explained using the particulate nature of matter model“

Part 1: TeachEngineering & CAT Conclusions
• Once again, thanks for CAT! TeachEngineering needs it.
• Tools such as CAT can benefit from contextual knowledge; e.g., that certain lessons are part of a larger set of lessons or a curricular unit.
• TeachEngineering curriculum is organized around both world and method standards. Hence, it would be nice if tools such as CAT become better at recognizing method standards.
• Contrast in standard re-use rate sends a signal to human catalogers not to be ‘complacent.’

Part 2: TeachEngineering & SAT
• Standard crosswalking as a third source of standard alignment:
• Transitive logic:
– Learning object X aligns with standard P of state S
– Standard P of state S aligns with standard Q of state T
– Learning object X aligns with standard Q of state T
• CNLP’s Standard Alignment Tool (SAT)
– Send it an ASN PURL
– Send it the standard body to which to align
– Wait for the aligned standards

TeachEngineering & SAT Problem
• Number of science standards (ASN leaves only): about 35,000.
• Number of authors: about 50
• Mean number of standards per author: 700
• Number of author combinations: 50(50 - 1) / 2 = 1,225
• Total queries needed to collect a full set of SAT alignments: 700 * 1,125 = 787,500
• Total required time: 787,500 * 5 seconds / 3600 seconds / 24 hours = 45 days of querying (assumes no down time).
• If instead, each of the authors is only aligned with one or more intermediaries, the total amount of querying per intermediary would be reduced to 50 * 700 = 35,000 queries.
• Total required time per intermediary: 35,000 * 5 seconds / 3600 seconds / 24 hours = 2.02 days.
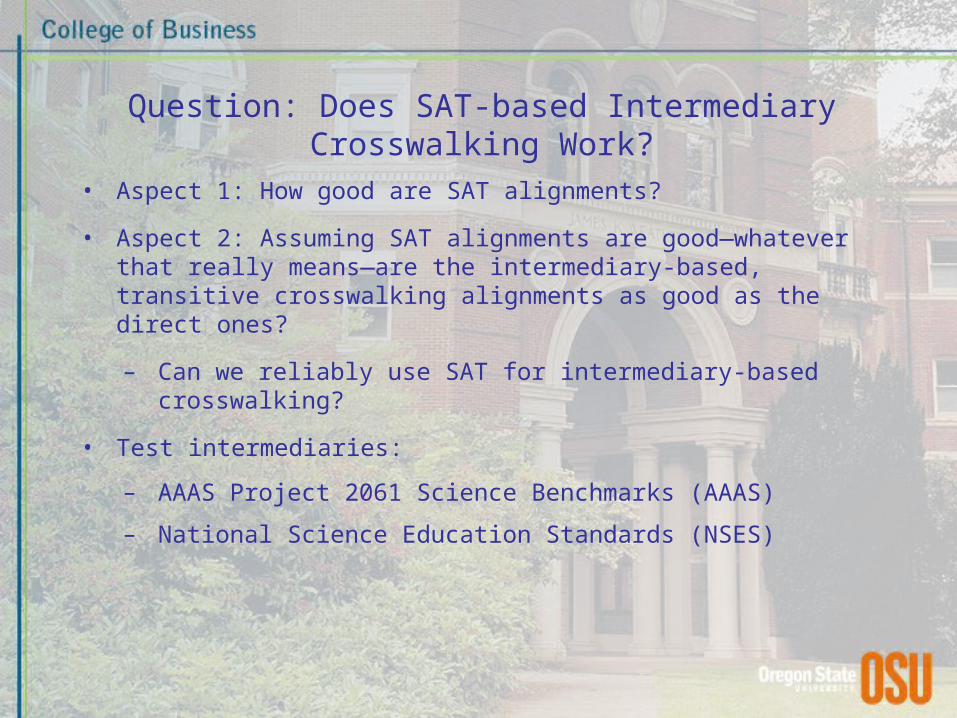
Question: Does SAT-based Intermediary Crosswalking Work?
• Aspect 1: How good are SAT alignments?
• Aspect 2: Assuming SAT alignments are good—whatever that really means—are the intermediary-based, transitive crosswalking alignments as good as the direct ones?
– Can we reliably use SAT for intermediary-based crosswalking?
• Test intermediaries:
– AAAS Project 2061 Science Benchmarks (AAAS)
– National Science Education Standards (NSES)
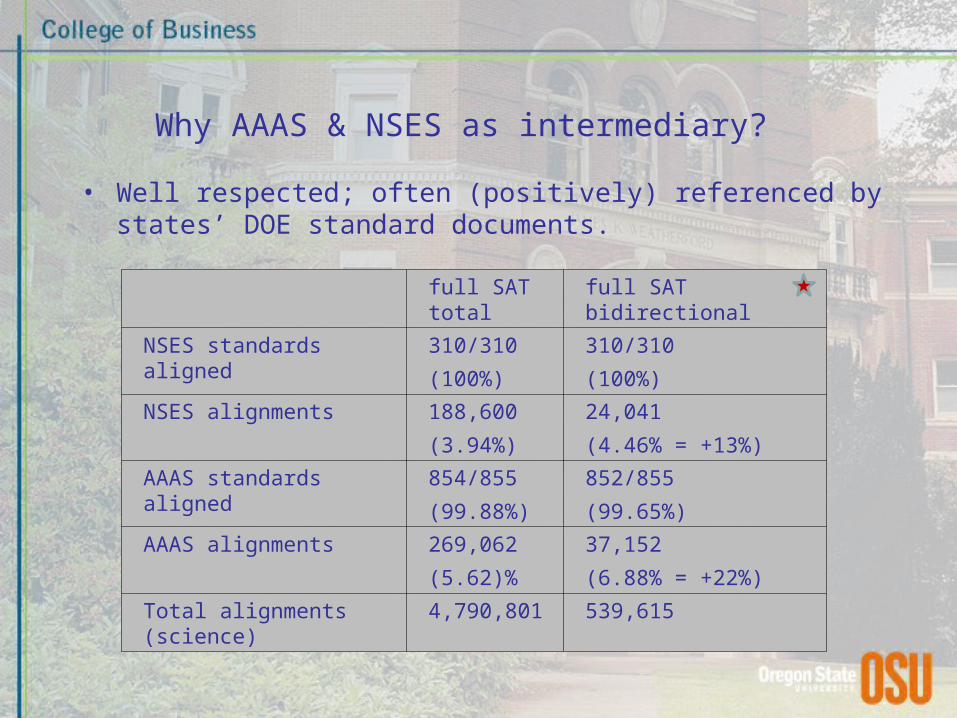
Why AAAS & NSES as intermediary?
• Well respected; often (positively) referenced by states’ DOE standard documents.
full SAT total full SAT bidirectional
NSES standards aligned 310/310
(100%)
310/310
(100%)
NSES alignments 188,600
(3.94%)
24,041
(4.46% = +13%)
AAAS standards aligned 854/855
(99.88%)
852/855
(99.65%)
AAAS alignments 269,062
(5.62)%
37,152
(6.88% = +22%)
Total alignments (science) 4,790,801 539,615

Aggregate Results (SAT alignment limit <= 5)
Crosswalks ~Crosswalks Recall
AAAS as intermediary
SAT bidirectional 313,184 762,538 .291
~SAT bidirectional 1,441,266 4,357,012
Precision .179
L2= 8.45; p < .01; λ11=λ22= .054; τ11=τ22= 1.056
Crosswalks ~Crosswalks Recall
NSES as intermediary
SAT bidirectional 291,326 784,396 .271
~SAT bidirectional 1,462,478 5,798,278
Precision .166
L2= 1.633; p < .20; λ11=λ22= .024; τ11=τ22= 1.024
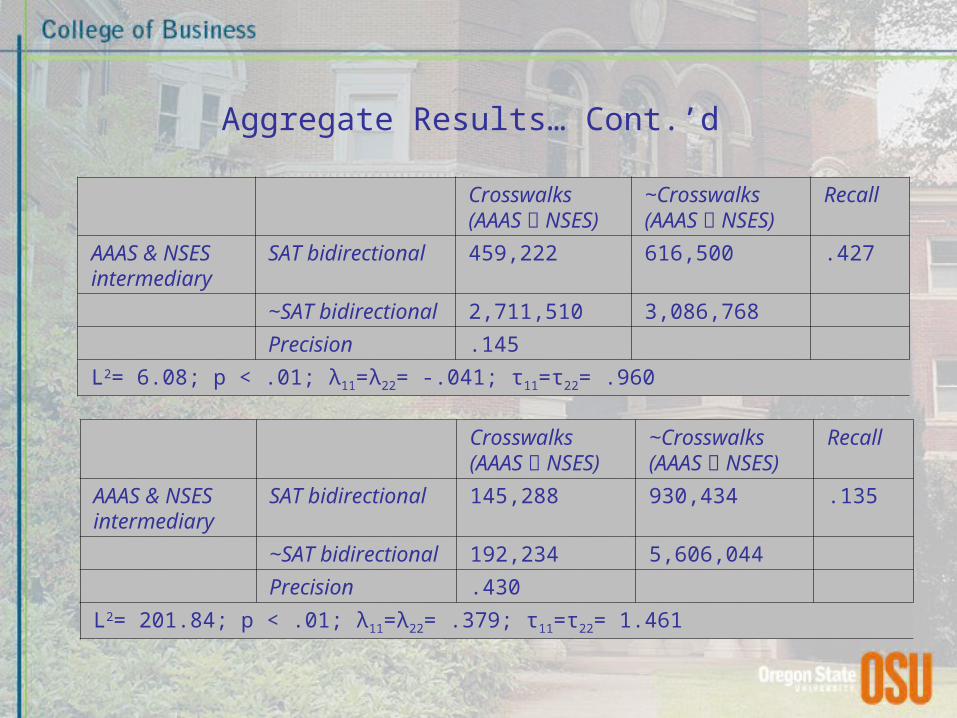
Aggregate Results… Cont.’d
Crosswalks(AAAS Ս NSES)
~Crosswalks(AAAS Ս NSES)
Recall
AAAS & NSES intermediary
SAT bidirectional 459,222 616,500 .427
~SAT bidirectional 2,711,510 3,086,768
Precision .145
L2= 6.08; p < .01; λ11=λ22= -.041; τ11=τ22= .960
Crosswalks(AAAS Ո NSES)
~Crosswalks(AAAS Ո NSES)
Recall
AAAS & NSES intermediary
SAT bidirectional 145,288 930,434 .135
~SAT bidirectional 192,234 5,606,044
Precision .430
L2= 201.84; p < .01; λ11=λ22= .379; τ11=τ22= 1.461

How About Different States?
Recall
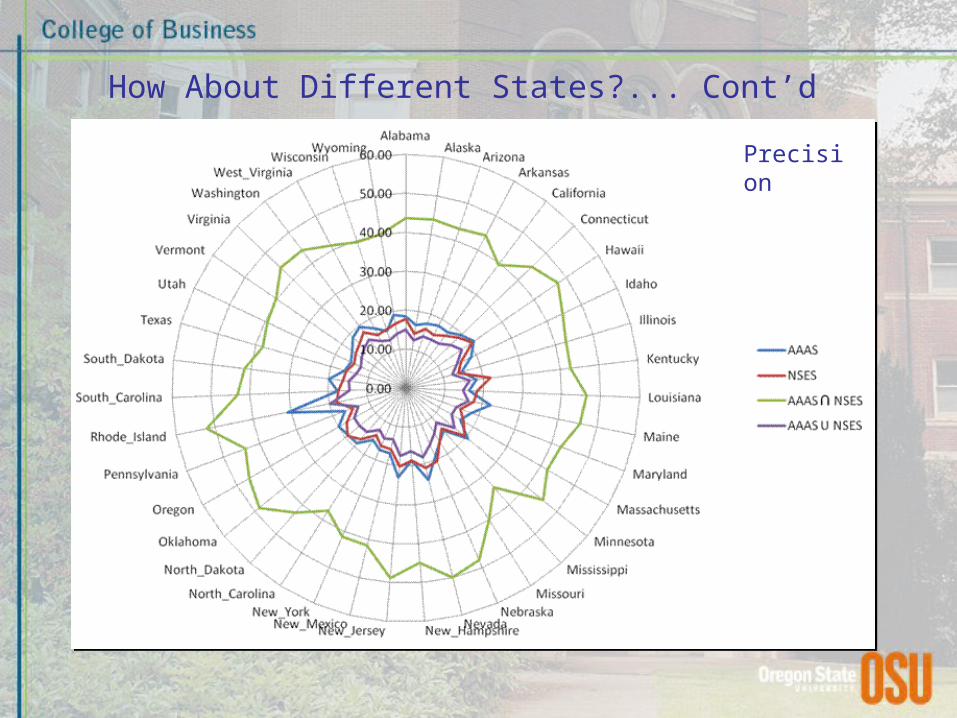
How About Different States?... Cont’d
Precision

Part 2: Does SAT-based Intermediary Crosswalking Work?
• Aggregate: …perhaps
– AAAS & NSES intermediary: AAAS U NSES recall ≈ 42%; precision ≈ 14%
– AAAS & NSES intermediary: AAAS ∩ NSES recall ≈ 14%; precision ≈ 43%
• Individual state: …perhaps
– Standards modeled to (one of the) intermediary; e.g., RI: recall ≈ 70%; precision ≈ 50%
– Size effects?