
Educational Mismatch: Are High-Skilled Immigrants Really …ftp.iza.org/dp4280.pdf · Price They...
55
DISCUSSION PAPER SERIES Forschungsinstitut zur Zukunft der Arbeit Institute for the Study of Labor Educational Mismatch: Are High-Skilled Immigrants Really Working at High- Skilled Jobs and the Price They Pay If They Aren’t? IZA DP No. 4280 July 2009 Barry R. Chiswick Paul W. Miller
Transcript of Educational Mismatch: Are High-Skilled Immigrants Really …ftp.iza.org/dp4280.pdf · Price They...

DI
SC
US
SI
ON
P
AP
ER
S
ER
IE
S
Forschungsinstitut zur Zukunft der ArbeitInstitute for the Study of Labor
Educational Mismatch:Are High-Skilled Immigrants Really Working at High-Skilled Jobs and the Price They Pay If They Aren’t?
IZA DP No. 4280
July 2009
Barry R. ChiswickPaul W. Miller

Educational Mismatch: Are High-Skilled Immigrants Really
Working at High-Skilled Jobs and the Price They Pay If They Aren’t?
Barry R. Chiswick University of Illinois at Chicago
and IZA
Paul W. Miller University of Western Australia
and IZA
Discussion Paper No. 4280 July 2009
IZA
P.O. Box 7240 53072 Bonn
Germany
Phone: +49-228-3894-0 Fax: +49-228-3894-180
E-mail: [email protected]
Any opinions expressed here are those of the author(s) and not those of IZA. Research published in this series may include views on policy, but the institute itself takes no institutional policy positions. The Institute for the Study of Labor (IZA) in Bonn is a local and virtual international research center and a place of communication between science, politics and business. IZA is an independent nonprofit organization supported by Deutsche Post Foundation. The center is associated with the University of Bonn and offers a stimulating research environment through its international network, workshops and conferences, data service, project support, research visits and doctoral program. IZA engages in (i) original and internationally competitive research in all fields of labor economics, (ii) development of policy concepts, and (iii) dissemination of research results and concepts to the interested public. IZA Discussion Papers often represent preliminary work and are circulated to encourage discussion. Citation of such a paper should account for its provisional character. A revised version may be available directly from the author.

IZA Discussion Paper No. 4280 July 2009
ABSTRACT
Educational Mismatch: Are High-Skilled Immigrants Really Working at
High-Skilled Jobs and the Price They Pay if They Aren’t?*
This paper examines the incidence of the mismatch of the educational attainment and the occupation of employment, and the impact of this mismatch on the earnings, of high-skilled adult male immigrants in the US labor market. Analyses for high-skilled adult male native-born workers are also presented for comparison purposes. The results show that over-education is widespread in the high-skilled US labor market, both for immigrants and the native born. The extent of over-education declines with duration in the US as high-skilled immigrants obtain jobs commensurate with their educational level. Years of schooling that are above that which is usual for a worker’s occupation are associated with very low increases in earnings. Indeed, in the first 10 to 20 years in the US years of over-education among high-skilled workers have a negative effect on earnings. This ineffective use of surplus education appears across all occupations and high-skilled education levels. Although schooling serves as a pathway to occupational attainment, earnings appear to be more closely linked to a worker’s occupation than to the individual’s level of schooling. JEL Classification: I21, J24, J31, J61, F22 Keywords: immigrants, skill, schooling, occupations, earnings, rates of return Corresponding author: Barry R. Chiswick Department of Economics College of Liberal Arts and Sciences 601 S. Morgan Street Chicago, IL 60607-7121 USA E-mail: [email protected]
* We thank Derby Voon for research assistance, and Charles Beach and other participants at the American Enterprise Institute Conference on High-Skilled Immigration in a Globalized Labor Market, held in Washington, DC, April 22-23 2009, as well as seminar participants at the University of Illinois at Chicago and the Australian National University, for helpful comments. Chiswick and Miller acknowledge research support from the American Enterprise Institute, and Miller acknowledges financial assistance from the Australian Research Council.
3
EDUCATIONAL MISMATCH: ARE HIGH-SKILLED IMMIGRANTS REALLY WORKING AT HIGH-SKILLED JOBS
AND THE PRICE THEY PAY IF THEY AREN’T?
I. INTRODUCTION
The United States is a home to millions of immigrants. Her “Golden Door” has
been open to many flows of immigrants that were “the wretched refuse of your teeming
shore”. At the same time, however, from Colonial times to the present, the US has
attracted many skilled immigrants.1 The high-skilled immigrants currently in the US are
the subject of this study.
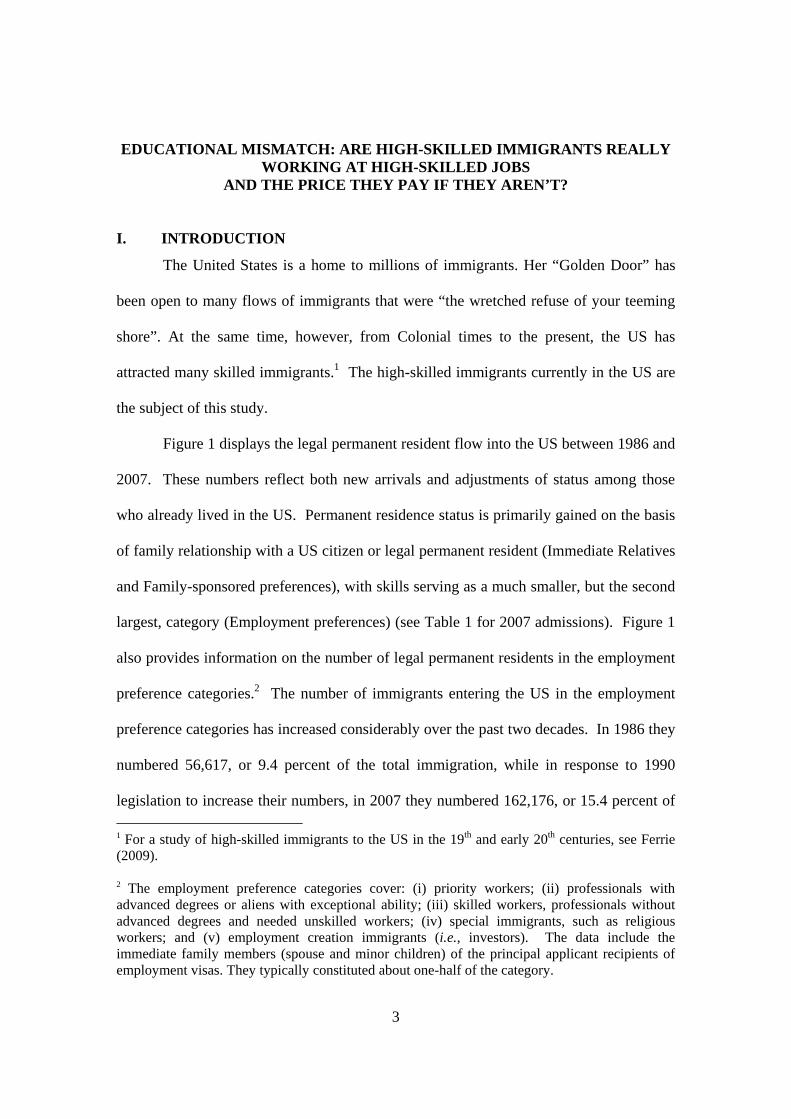
Figure 1 displays the legal permanent resident flow into the US between 1986 and
2007. These numbers reflect both new arrivals and adjustments of status among those
who already lived in the US. Permanent residence status is primarily gained on the basis
of family relationship with a US citizen or legal permanent resident (Immediate Relatives
and Family-sponsored preferences), with skills serving as a much smaller, but the second
largest, category (Employment preferences) (see Table 1 for 2007 admissions). Figure 1
also provides information on the number of legal permanent residents in the employment
preference categories.2 The number of immigrants entering the US in the employment
preference categories has increased considerably over the past two decades. In 1986 they
numbered 56,617, or 9.4 percent of the total immigration, while in response to 1990
legislation to increase their numbers, in 2007 they numbered 162,176, or 15.4 percent of 1 For a study of high-skilled immigrants to the US in the 19th and early 20th centuries, see Ferrie (2009). 2 The employment preference categories cover: (i) priority workers; (ii) professionals with advanced degrees or aliens with exceptional ability; (iii) skilled workers, professionals without advanced degrees and needed unskilled workers; (iv) special immigrants, such as religious workers; and (v) employment creation immigrants (i.e., investors). The data include the immediate family members (spouse and minor children) of the principal applicant recipients of employment visas. They typically constituted about one-half of the category.

4
the total immigration, although about half of these in both years were the spouses and
minor children of principal applicants.
Figure 1
Legal Permanent Resident and Employment Preference Visas, Fiscal Years 1987 to 2007, United States
0
200,000
400,000
600,000
800,000
1,000,000
1,200,000
1,400,000
1,600,000
1,800,000
2,000,000
1986
1987
1988
1989
1990
1991
1992
1993
1994
1995
1996
1997
1998
1999
2000
2001
2002
2003
2004
2005
2006
2007
Year
Num
ber o
f Im
mig
rant
s
Total Employment Preference
Note: The spike in permanent resident visas from 1989 to 1992 is related to the granting of amnesty to nearly 3 million illegal migrants under the 1986 Immigration Reform and Control Act. Source: 2004 and 2007 Yearbook of Immigration Statistics.
Table 1
Immigration by Type of Visa, United States, 2007
Category
Immigrants (in thousands)
Immediate Relatives of US Citizens 494 Family Sponsored Preferences 194 }688
Employment Based (and their families) 162 Diversity 42 Refugees, Asylees, Parolees 138 Other 20 Total 1,052
Note: Detail may not add to total due to rounding. Source: Immigration Statistics of the United States 2007, Department of Homeland Security, 2008.

5
Understanding how employment preference immigrants perform in the US labor
market is important from the perspective of guiding the mix of immigrants: whether there
are relatively more of “the wretched refuse of your teeming shore” or more high-skilled
employment preference immigrants. Unfortunately, visa category information is not
available in the data sets, such as from the Decennial Census, which are otherwise most
useful for labor market analyses of immigrants in the US. Instead, therefore, this paper
looks at all skilled foreign-born workers, regardless of their visa status, including those
on temporary work visas (e.g., H1-B visa recipients).
The study adopts perspectives from the over-education/under-education literature.
This literature proposes that there is a “usual” education level for each occupation. Some
workers will have this level of education, and will therefore be regarded as being
matched to the typical educational requirements of their job. Other workers will have a
higher level of education than that which is usual in their job. These workers with
“surplus” years of schooling are viewed as being over-educated.3 Still other workers will
have a lower level of education than that which is usual in their job. Such workers are
viewed as being under-educated. Chiswick and Miller (2008)(2009a) show that, for
analyses of the US and Australia, this framework yields important insights into the
international transferability of human capital for immigrant workers across all skill levels.
The focus here, however, is on high-skilled immigrant workers.
Section II presents a discussion of the determinants of the “mismatch” of
education and occupation in the labor market. While the factors that bring about this
3 In the immigration literature this is frequently referred to as the non-recognition of foreign educational credentials.

6
mismatch for the native born also apply for the immigrants, two additional factors (skill
transferability and selectivity in migration) also apply for immigrants.
Section III provides an overview of data on the education levels of the native born
and foreign born. A selection of previous studies in the over-education/under-education
literature is briefly reviewed in Section IV.4 The broad aim of this review is to highlight
methodological issues pertinent to a study of high-skilled immigrants. Section V outlines
the empirical framework adopted in this study, and provides information on the data
sources. The statistical analyses of the extent of the educational mismatch and the
earnings consequences of these mismatches are presented in Section VI. Section VII
concludes, with a summary and policy implications of the findings.
II. WHY WOULD THERE BE EDUCATIONAL MISMATCHES?
Consider the typical or usual level of education in an occupation. Why would there
be educational mismatches, that is, individuals whose educational attainment differs from
the “norm” in their occupation?
The usual level or norm is merely a measure of central tendency. Depending on the
particular technology that they employ, or the educational attainment of the labor market
from which they draw their labor supply, firms may have a different optimal level of
education for their workers in a particular occupation compared to the occupation as a whole
nationwide. Workers also differ by age and hence there are cohort differences in when they
received their formal schooling, when they joined the labor force, and the extent of their
labor market experience. Mismatches related to cohorts may arise if there has been an
upgrading of educational requirements for new hires, but longer term employees are retained 4 For a fuller review, see Chiswick and Miller (2008).

7
because of their seniority or for whom the greater on-the-job training (labor market
experience) compensates for their falling behind the educational norms for new hires. The
mismatches here would be over-educated new hires and under-educated established workers
compared to the average worker currently in place.
Workers clearly differ in characteristics that may be difficult, if not impossible, to
measure in survey or census data, but which may be revealed in the labor market. These
unmeasured characteristics include dimensions of worker and allocative (decision making
ability) efficiency, ambition, aggressiveness, energy, job dedication, favorable and
unfavorable personality traits, etc. Those with higher levels of desirable unmeasured
abilities can attain a higher level occupation for the same level of schooling, and thereby
appear to be under-educated. On the other hand, those who the market evaluates as being
deficient in beneficial unmeasured traits are more likely to be relegated to occupations that
are at a lower level compared to their schooling, and hence appear to be over-educated given
their occupation.
The reasons just discussed for educational mismatches would apply equally well to
native-born and foreign-born workers. There are, however, immigrant-specific factors that
may contribute to a greater mismatch of education and occupation among the foreign born
in the labor market – the limited international transferability of skills and selectivity in
migration.
For most immigrants to a destination, skills acquired in the country of origin are not
perfectly transferable. These skills include information about how labor markets operate, as
well as destination language skills. There may be occupation-specific skills that are not
readily transferable because of differences in type of technology (e.g., English measures vs.

8
metric system, legal systems based on English common law vs. Napoleonic code). There
may be differences in level of technology because of differences in capital/labor ratios or
relative factor prices (e.g., consider high-technology medicine in the US vs. low-technology
medicine in the former Soviet Union and LDCs). Moreover, there may be barriers to entry
into the destination occupations that immigrants trained for and practiced in their origin
(e.g., occupational licensing, union regulations, and governmental requirements, such as
citizenship). In addition, there may be cultural differences that make it difficult for
immigrants in certain occupations to “transfer” their skills to the destination labor market.5
A frequent concern expressed by immigrants, and those who assist their integration
into the destination labor market, is the non-recognition of the immigrants’ pre-migration
skills, whether acquired in school or on the job. In some instances this is due to
occupational licensing, but in other instances it may arise from understandably risk averse
employers and consumers not knowing how to evaluate foreign credentials compared to the
credentials of workers trained in the destination.6
Finally, one cannot rule out discrimination against immigrants reducing their ability
to transfer their skills in whole or in part to the destination.
The lesser the degree of transferability of skills from the origin to the destination the
greater would be the occupational downgrading of the immigrant, and hence the greater
5 For, example, Remennick (2008) found that primary and secondary school teachers from the former Soviet Union who immigrated to Israel generally could not make the adjustment from the rigid, highly disciplined, highly structured Soviet classroom to the informal, flexible, Israel classroom with little structure. It was not the teaching of the subject matter or the language issues that were so difficult to overcome, but the school and classroom cultural gap was too great for the teaching skills to be transferable. 6 The issue of the non-recognition of the skills of immigrant physicians in the US and Canada is the theme of McDonald, et al. (2009). For a study of the adjustment of high-skilled immigrants in Israel, see Cohen-Goldner and Weiss (2009).

9
would be the appearance of over-education of immigrants in their occupations. With the
passage of time in the destination, however, investments are made in destination human
capital, either to modify (increase the transferability of) pre-migration skills, or to acquire
new skills, occupational upgrading occurs and the extent of over-education would diminish.
A second immigrant-specific consideration is selectivity in immigration. For several
reasons, there is a tendency for economic migrants to be favorably selected for labor market
success in the destination (Chiswick 1999, 2008). Indeed, economic migrants by definition
have success in the destination as their primary goal (supply of immigrants). Moreover,
some immigrants are specifically granted visas (demand for immigrants) on the basis of
their high levels of skill, although the relative importance of employment-based visas varies
across destinations. Combining the self-selection (supply) and employment visas (demand
for high-skilled immigrants) considerations suggests that there is, in general, favorable
selectivity among immigrants.
Other measured variables the same, including educational attainment, this suggests
more favorable unmeasured dimensions of ability among immigrants compared to the others
in the origin who do not migrate. If these unmeasured dimensions of ability have a similar
distribution among the native-born population in the origin and the destination, by
implication the migrants have, on average, a higher level of unmeasured dimensions of
ability than do the native born in the destination. Then, if the usual educational attainment
in an occupation is based on the native-born population, the higher level of unmeasured
ability would enable the immigrants to attain a higher occupational level than the destination
native born with the same level of schooling, or alternatively gain employment in the same
occupation as more highly educated natives. Hence they would appear to be under-

10
educated.
In summary, in the labor market one would expect to observe workers who appear to
be over-educated and under-educated relative to the usual educational attainment in their
occupation. In addition to the factors relevant for the native born, immigrants have two
additional reasons for the education-occupation mismatch. The less than perfect
international transferability of skill will tend to result in the over-education of immigrants,
that is, a tendency for them to be in occupations in which the usual schooling level is less
than theirs. On the other hand, the favorable selectivity of immigrants will tend to result in
their being under-educated, that is, working in occupations in which the usual education
level is higher than theirs. The issue of skill transferability is more intense the higher the
level of skill, while the issue of selectivity is more intense the higher is the ratio of out-of
pocket or direct costs of immigration to the opportunity cost of time, that is, it is more
intense for lower-skilled workers (Chiswick 1999, 2008; Chiswick and Miller 2008). As a
result, in a study of high-skilled immigrants it is to be expected that the dominant
educational mismatch will be over-educated immigrants.
III. EDUCATION LEVELS OF THE NATIVE BORN AND FOREIGN BORN
Figure 2 presents information on the distribution of education levels of native-
born and foreign-born males, aged 25 years and over in 2000.7 This figure shows that
only around 14 percent of native-born males left school before completing high school,
while 33 percent are classified as high school graduates, 18 percent attended college but
did not receive a degree, seven percent attained an Associate degree, 18 percent a 7 See Appendix A for the definition of the various educational categories. Sensitivity tests were performed for alternate measures of years of schooling for those with Master’s, Professional, and Doctorate degrees as their highest level of schooling. The findings are essentially invariant with respect to these alternative values.

11
Bachelor’s degree, six percent a Master’s degree and four percent either Professional or
Doctorate degrees.
The data for foreign-born males show a much lower mean and a greater inequality
in the distribution of schooling. A major difference occurs among the very early school
leavers. Only 14 percent of native-born adults did not complete high school, whereas 34
percent of the foreign born are in this category. It is, therefore, this relatively high
representation in the early school leaver category that is responsible for the mean level of
education for the foreign born (11.76 years in 1999) being around 1.5 years less than the
mean level of education for the native born (13.13 years).
The foreign born and native born have similar proportions with higher education.
Among the foreign born, 15 percent have only a Bachelor’s degree, and for the native
born it is 18 percent. Seven percent of the foreign born have a Master’s degree, compared
to six percent among the native born. Finally, whereas four percent of the native born
have Professional degrees or Doctorates, five percent of the foreign born fall into this
category. Thus, the foreign born are more heavily represented at the lowest and, to a
smaller extent, the very highest, educational levels.
The skilled immigrant group that is the focus of this study can be defined in
various ways. There could be a focus on the approximately 28 percent of the population
of each birthplace group with Bachelor’s or higher degrees. Or a more restrictive
definition covering those with Master’s or higher degrees could be considered, 12 percent
of the immigrant population and 10 percent of the native-born population. Both
definitions are considered in the analyses that follow.8
8 See Ferrie (2009) for discussion of why the definition of skilled immigration is time and place specific.

12
Figure 2
Distribution of Education Levels of the Males Aged 25 Years and Over, by Nativity, 1999
Educational Attainment of Native Born 1999
0-11th grade High school graduate
Some college & Associate Degree Bachelor's degree
Master's degree Higher Degree
Educational Attainment of Foreign Born 1999
0-11th grade High school graduate
Some college & Associate Degree Bachelor's degree
Master's degree Higher Degree
Note: Higher degree includes those with degrees above the Master’s level, including Professional (e.g., MD, LLB) and Doctorate (PhD) degrees. Source: Current Population Survey, 1999.
6%
18%
25% 33%
14% 4% 7%
15%
15% 23%
5%
34%

13
IV. LITERATURE REVIEW ON THE ORU TECHNIQUE
The over-education/under-education literature has been used to examine the
allocation of workers across the over-educated, under-educated and correctly matched job
categories in the US. This literature has also examined the impacts on earnings of
educational mismatches. The latter research has been based on a variant of the human
capital earnings function that has been termed the ORU (Over-education/Required
education/Under-education) specification. In this model, the dependent variable is the
natural logarithm of earnings ( ln iY ) and the variable for actual years of education is
decomposed into three terms. That is,
(1) 0 1 2 3ln ver_Educ eq_Educ nder_Educ ...i i i i iY u= α +α + α +α + +O R U
where Over_Educ = years of surplus or over education,
Req_Educ = the usual or reference years of education,
Under_Educ = years of deficit or under education,
and the actual years of education equals Over_Educ + Req_Educ – Under_Educ. Note
that for each individual, “Over_Educ” and “Under_Educ” cannot both be positive.9
Either one or both must be zero. Equation (1) will also contain other variables generally
included in earnings functions, such as years of labor market experience, marital status,
location, veteran of the US Armed Forces, race/ethnicity, and variables specific to the
foreign born, such as duration of residence in the US and citizenship status.
All studies report that there is a high incidence of educational mismatches in the
US labor market. In most studies equation (1) is estimated on samples of all workers,
9 The standard equation, 0 1ln Actual Educ ...i i iY = β +β + + υ , forces 1α = 2α = | 3α |. As this condition does not hold, the ORU specification results in a higher R-squared and 2 1α β> .

14
though separate analyses are often undertaken for particular groups of interest. For
example, Rumberger (1987) reported findings from estimations undertaken on separate
samples of men and women. Duncan and Hoffman (1981) present results for four gender-
race groups (White men, Black men, White women, Black women). Chiswick and Miller
(2008) conduct separate analyses for foreign-born and native-born male workers, and
among the foreign born by country of origin.
Some analyses extend the disaggregation of the sample beyond that based on
nativity, gender or race to consider occupations (Rumberger (1987) and Verdugo and
Verdugo (1989)). Rumberger (1987, p.31), for example, argued that “we would expect
the estimated return to required and surplus schooling to vary across occupations just as
the estimated return to actual schooling varies across occupations”. Rubb (2003, p.54)
explains that “The theory behind the occupational analysis is that some occupational
groups may be better suited than others in using the surplus human capital of the over-
educated workers”. Rumberger’s (1987) study was based on only five broad categories of
occupations: (i) Professional/Managerial; (ii) Support; (iii) Craft; (iv) Operative; and (v)
Service. Verdugo and Verdugo (1989) expanded the occupation-specific analyses to nine
occupations. Other studies have focused only on particular skill segments of the labor
force. Rubb (2003) and Duncan and Hoffman (1981), for example, studied the links
between over-education and earnings among workers with post-college schooling.
In analyses of earnings, the return to years of education that are usual in an
occupation ( 2α ) is typically much higher than the return to actual years of education ( 1β )
(see Hartog, 2000). Years of education above those that are usual in a person’s job are
associated with a payoff that is much lower than the payoff to the education levels that

15
are usual for an occupation ( 2α > 1α ), whereas years of under-education are associated
with an earnings penalty compared to those correctly matched ( 2α > 3α ). These earnings
effects, however, have been shown to vary by nativity, occupation and skill level.
Chiswick and Miller (2008) report that the payoff to an actual year of education in
the US 2000 Census was 10.6 percent for native-born males, and only 5.2 percent for
foreign-born males. The payoff to a year of education that is usual in a person’s job did
not differ by nativity: it was 15.4 percent for the native born and 15.3 percent for the
foreign born. A year of surplus schooling was associated with a payoff of 5.6 percent for
the native born and of 4.4 percent for the foreign born. In comparison, the earnings
penalty associated with a year of under-education was -6.7 percent for the native born
and only -2.1 percent for the foreign born.
Vahey (2000) examined the incidence and returns to educational mismatch in
Canada with a modification to the ORU model. Thus, the estimating equation in Vahey
(2000) was:
(2) 0 1 2 3ln ver_Educ eq_Educ nder_Educ ...A A Ai i i i iY uγ γ γ γ= + + + + +O R U
where the superscript A on the ORU variables simply indicates an alternative definition.
In particular, Vahey (2000) defined eq_EducAiR as a vector of dichotomous variables for
each usual level of education. Because the usual level of education was rarely more than
one level from the attained level of education, in Vahey’s (2000) empirical analysis a
restricted specification was employed, where ver_EducAiO and nder_EducA
iU comprised,
for each usual level of schooling, single dichotomous variables for over-education and
under-education regardless of the number of years.

16
Thus, the analyses of over-education and under-education have shown that
knowledge of educational mismatch can enhance understanding of labor market
outcomes. The efforts to extend the analyses to consider variation across education levels
and across occupations revealed that this extension can be useful, although the limitations
of these earlier studies prevent strong conclusions from being drawn. The analyses
presented below, based on the large Public Use Microdata Sample from the 2000 Census,
overcome these limitations, and demonstrate the considerable potential of study
disaggregated by occupation and using more detailed information for the required level of
school and for schooling mismatches.
V. MEASUREMENT OF MISMATCHES AND DATA
A. Measurement
A method is needed to identify the “required” or “usual” level of education in an
occupation. For the purposes of this study, the Realized Matches (RM) technique is
used.10 This is based on the actual educational attainments of workers in each occupation,
and therefore reflects the outcome of the labor market matching process. Either the mean
of educational attainments within each occupation (e.g., Verdugo and Verdugo, 1989) or
the modal educational attainment (e.g., Cohn and Khan, 1995) may be used.
10 Two other techniques are the Worker Self-Assessment (WSA) and the Job Analyst (JA) techniques, where the latter is based on “objective” evaluations of experts. For a comparative analysis of the WSA and RM techniques, see the methodological note in Chiswick and Miller (2009b). This shows there is a high degree of correlation between the WSA and RM data series, with the simple correlation coefficient between these measures being around 0.8 for all skill-nativity groups considered in this study. Under each of the three assessment methods, the “typical” or “required” level of education is related to the technology employed, relative factor prices, and the educational distribution of the population under study. There is no fixed or unique required level of education in an occupation, across either time or space.

17
B. The Data
The analyses reported below are based on the 2000 US Census five percent Public
Use Microdata Sample, using the approximately 500 occupations that are separately
identified. This data set contains information on labor market outcomes (earnings,
occupation) and demographic characteristics (educational attainment, age, marital status,
veteran of US Armed Forces, English proficiency, location, and among the foreign born,
citizenship and duration of residence in the US). While this data source covers the entire
population, the analyses are based on men aged 25 to 64 years who worked in paid
employment in 1999.11 The analyses are restricted to those in non-military occupations,
as these are the most likely to respond to market forces. Separate analyses are conducted
for native-born workers and for foreign-born workers. Both wage and salary earners and
the self-employed are covered by the study. All foreign-born men, and a 0.15 random
sample of native-born men, meeting the sample restrictions are included in the analysis.
The modal level of education of native-born workers in the 2000 Census data is
used to determine the usual level of education in each of the approximately 500
occupations. The focus on native-born male workers is appropriate where the economic
majority group sets the norm for all workers in the occupation.12 This RM measure
ranges from 12 years of schooling to the Professional and Doctorate degree categories
(seven categories in total).
11 Conventionally, a 64-year upper threshold has been used to minimise any selection bias associated with retirement from the paid labor force. Using a lower threshold of 54 years has no material effect on the regression estimates presented in Tables 4 and 5. 12 Chiswick and Miller (2008) report that tests of robustness with respect to alternative definitions of the population for defining the modal education showed virtually no substantive differences.

18
VI. STATISTICAL ANALYSIS
The statistical analyses that follow have several main sections. Section VI.A
contains a brief overview of the incidence of educational mismatch in the US labor
market. Section VI.B presents the analyses of the determinants of earnings for high-
skilled workers: workers with a Bachelor’s or higher degree, and workers with a Master’s
or higher degree. The analyses of earnings for the skilled workers are conducted
separately by major occupation in Section VI.C. This will permit assessment of whether
some occupations are able to utilize more effectively any surplus educational attainments.
In VI.D the analysis of earnings is undertaken using the more flexible specification of the
ORU model introduced by Vahey (2000). This approach offers advantages in terms of
understanding whether the apparent inability of the labor market to effectively utilize
surplus schooling depends on the level of schooling. Finally, Section VI.E reports
findings from an analysis of the effects of education—actual years, usual years and
surplus years—on earnings by duration of residence in the US.
A. The Incidence of Skill Mismatch
Table 2 lists the incidence of correctly matched education and mismatched
education in the US labor market, based on the modal education in their occupation, by
nativity, skill level and occupation, using data on adult males from the 2000 Census. The
data for the native born are in standard font (first row) and the data for the foreign born
are in italics (second row) for each occupation. The first three columns of the table cover
all educational attainments, while the final two columns are for the two definitions of
high-skilled workers employed in this study. When all workers are considered
information is presented on under-education, correctly matched education and over-

19
education. When only high-skilled workers are considered, however, under-education is
not a material issue as very few workers are in this category, and so only the incidence of
over-education is presented, with the balance of the workforce being considered correctly
matched.
Across all occupations (see the first row of data in Table 2) the rate of correctly
matched education among the native born is around 40 percent, while the rates of under-
education and over-education are 26 percent and 33 percent, respectively. The rate of
being over-educated among the foreign born is similar to that of the native born (29
percent). The foreign born, however, are far more likely than the native born to be under-
educated (45 percent compared to 26 percent) and are far less likely than the native born
to be in the correctly matched group (26 percent compared to 40 percent).
The patterns in the incidence of educational match/mismatch across occupations
are affected by two sets of factors. First, the usual level of education varies by
occupation, from 12 years in some occupations (e.g., Sales and related) to a Doctorate in
other occupations (e.g., Life, Physical, and Social Science). Second, the proportion of
highly educated workers varies across occupations. Hence the mean actual years of
education by occupational group in Table 2 ranges from 12.19 years to 18.05 years
among the native born, and from 9.24 years to 17.77 among the foreign born.13
In the fourth column of Table 2 the analysis is restricted to workers with at least a
Bachelor’s degree. Thus these workers will have, by definition, a higher mean level of
actual years of education than the sample of all workers. This will tend to increase the
incidence of over-education. 13 These are based on imputed years of schooling where a Bachelor’s degree is assumed to require 16 years, a Master’s degree 17.5 years, a Professional degree 18.5 years, and a Doctorate degree 20 years.

20
Table 2
Incidence of Over-education, Correctly Matched Education and Under-education by Nativity, Skill Level and by Occupation, 25-64 Year Old Males, 2000 US Census
All Skill Levels
Bachelor’s Degree +
Master’s Degree +
Occupation
Under-educated
(i)
Correctly Matched
(ii)
Over-educated
(iii)
Over-educated
(iv)
Over-educated
(v) All Occupations
0.263 0.450
0.402 0.260
0.334 0.291
0.503 0.625
0.697 0.790
Management, Business and Financial Operations
0.323 0.369
0.361 0.281
0.315 0.350
0.452 0.578
0.867 0.965
Business and Financial Operations
0.239 0.335
0.452 0.404
0.309 0.261
0.353 0.460
1.000 1.000
Professional and Related
0.223 0.460
0.402 0.386
0.375 0.154
0.378 0.555
0.975 0.992
Architecture and Engineering
0.182 0.411
0.429 0.384
0.389 0.206
0.338 0.553
1.000 1.000
Life, Physical, and Social Science
0.393 0.414
0.438 0.406
0.169 0.180
0.424 0.434
0.694 0.507
Community and Social Services
0.176 0.209
0.387 0.332
0.437 0.459
0.240 0.296
0.428 0.510
Legal 0.116 0.237
0.790 0.572
0.094 0.191
0.122 0.266
0.073 0.181
Education, Training, and Library
0.460 0.520
0.411 0.329
0.129 0.151
0.488 0.552
0.804 0.716
Arts, Design, Entertain., Sports, and Media
0.160 0.222
0.383 0.302
0.458 0.475
0.301 0.433
1.000 1.000
Healthcare Practitioner and Technical
0.145 0.190
0.625 0.656
0.230 0.154
0.196 0.228
0.204 0.235
Healthcare Support
0.511 0.517
0.312 0.227
0.177 0.256
1.000 1.000
1.000 1.000
Protective Service
0.343 0.413
0.260 0.252
0.397 0.335
0.844 0.916
1.000 1.000
Food Preparation
0.395 0.205
0.343 0.208
0.262 0.587
1.000 1.000
1.000 1.000

21
Building and Grounds Cleaning and Maintenance
0.314 0.157
0.442 0.196
0.245 0.647
1.000 1.000
1.000 1.000
Personal Care and Service
0.442 0.353
0.323 0.254
0.235 0.393
0.784 0.914
1.000 1.000
Sales and Related
0.435 0.443
0.295 0.217
0.271 0.340
0.638 0.812
1.000 1.000
Office and Administrative Support
0.470 0.453
0.248 0.184
0.282 0.363
0.998 0.998
1.000 1.000
Farming, Fishing, and Forestry
0.263 0.051
0.407 0.092
0.330 0.857
1.000 1.000
1.000 1.000
Construction and Extraction
0.332 0.171
0.441 0.219
0.226 0.610
1.000 1.000
1.000 1.000
Installation, Maintenance, and Repair
0.336 0.302
0.406 0.246
0.258 0.453
1.000 1.000
1.000 1.000
Production, Transport, and Material Moving
0.376 0.259
0.460 0.228
0.164 0.513
1.000 1.000
1.000 1.000
Transportation and Material Moving
0.301 0.248
0.477 0.253
0.222 0.499
0.784 0.953
1.000 1.000
Note: For each occupation the data in the first row are for the native born and the data in the second row (italics) are for the foreign born. Based on realized matches (RM) procedure (mode). Source: US Census of Population, 2000, Public Use Microdata Sample, 5 percent sample of the population.
These Table 2 column (iv) results show that in about one-third of the occupational
groups all of the workers with at least a Bachelor’s degree are over-educated, regardless
of nativity group. The foreign born have a greater rate of over-education than the native
born in the remaining occupations. Furthermore, when the analysis focuses on the group
with a Master’s degree or higher (see Table 2 column (vi)), all the workers in each
nativity group are over-educated in over half of the occupational groups. The incidences
of over-education are similar for both the native born and the foreign born in the
remaining occupations, with the exception of the Legal occupation, where the rate of

22
over-education for the foreign born is only 18 percent and that for the native born is even
lower, at 7 percent.
Table 3
Incidence of Over-education, Correctly Matched Education and Under-education for 25-64 Year Old Foreign-Born Males by Duration of Residence and Skill Level,
2000 US Census
All Skill Levels Bachelor’s Degree +
Master’s Degree +
Duration
Under-educated
(i)
Correctly Matched
(ii)
Over-educated
(iii)
Over-educated
(iv)
Over-educated
(v) All Durations 0.450 0.260 0.291 0.625 0.790
0-9 0.426 0.272 0.302 0.627 0.800
10-19 0.485 0.240 0.275 0.671 0.837 20-29 0.465 0.253 0.281 0.594 0.755
30+ 0.383 0.295 0.322 0.578 0.734
Note: Based on realized matches (RM) procedure (mode). Source: US Census of Population, 2000, Public Use Microdata Sample, 5 percent sample of the population.
The incidence of educational mismatches can also be considered by duration in
the United States, as is done in Table 3. Among high-skilled workers in the US for 10 or
more years in 2000, the extent of over-education declines with duration of residence.
This suggests that with duration in the US labor market immigrants are more likely to
acquire the US-specific skills, credentials, and reputation that permit more workers to get
jobs in occupations commensurate with their educational attainment. Note, however, that
the degree of over-education is lower for those in the US fewer than 10 years in 2000
compared to those with a 10 to 19 years duration. The better occupational matching of
the foreign born who came to the US in the 1990’s may reflect cohort differences arising
from the 1990 Immigration Act. This legislation had two major effects on this issue.
One is that it increased the number of labor certification/employer sponsored visas, and

23
workers entering under these visas are more likely to be better matched than those
entering under other visas, such as the family based, diversity, or refugee visas. The
second is that the act created the H1-B (temporary worker) visas for employer sponsored
high-skilled workers, where again, there would be a better matching (fewer over-
educated workers).
Thus, educational mismatch, especially for over-educated workers, is a major
feature of the US labor market. Its importance increases when the focus is on the most
highly skilled workers. Indeed, in many occupations, all of the most highly educated
workers are categorized as over-educated. This would be expected to have major
implications for the earnings of these workers. These implications are explored in the
following sub-sections.
B. Analyses for High-Skilled Workers
Table 4 presents results from the estimation of the standard and ORU models of
earnings determination on a sample restricted to workers with at least a Bachelor’s
degree.

24
Table 4 Estimates of Standard and ORU Models of Earnings by Nativity, Skilled
(Bachelor’s or Higher Degree) 25-64 Year Old Males, 2000 US Census
Native Born Foreign Born Variable Standard ORU Standard ORU Constant 4.073
(52.08) 4.131
(54.16) 4.669* (71.98)
4.297 (67.29)
Educational Attainment
0.111 (42.49)
(a) 0.106 (49.52)
(a)
Usual Level of Education
(a) 0.122 (47.85)
(a) 0.140* (64.45)
Years of Over-education
(a) 0.020 (7.15)
(a) 0.019 (8.34)
Experience 0.057 (48.12)
0.059 (50.65)
0.031* (25.67)
0.039* (32.55)
Experience Squared/100
-0.122 (39.64)
-0.124 (41.38)
-0.074* (24.61)
-0.085* (29.17)
Log Weeks Worked 0.999 (59.77)
0.979 (59.75)
0.972 (73.07)
0.945 (72.22)
Married 0.302 (48.67)
0.271 (44.59)
0.232* (36.23)
0.215* (34.64)
South -0.031 (5.43)
-0.034 (6.01)
-0.061* (9.86)
-0.054* (9.12)
Metropolitan 0.333 (36.82)
0.308 (34.82)
0.147* (8.28)
0.154* (8.96)
Veteran of US Armed Forces
-0.056 (7.22)
-0.043 (5.68)
-0.128* (8.97)
-0.106* (7.70)
Black -0.188 (17.17)
-0.162 (14.98)
-0.296* (30.40)
-0.262* (27.70)
English Very Well -0.072 (5.37)
-0.064 (4.79)
-0.141* (18.76)
-0.110* (14.98)
English Well -0.068 (1.97)
-0.055 (1.64)
-0.403* (42.61)
-0.304* (32.84)
English Not Well/Not at All
-0.109 (2.57)
-0.099 (2.35)
-0.690* (49.40)
-0.492* (35.70)
Years Since Migration (YSM)
(a) (a) 0.009 (9.81)
0.011 (12.23)
YSM Squared/100 (a) (a) -0.005 (2.41)
-0.011 (6.07)
Citizen (a) (a) 0.035 (4.95)
0.024 (3.42)
Adjusted 2R 0.230 0.259 0.278 0.322 Sample Size 100,885 100,885 100,968 100,968
Notes: Heteroskedasticity-consistent ‘t’ statistics in parentheses; RM = Realized Matches, * = Estimated coefficient for the foreign born is significantly different from that for the native born. Source: US Census of Population, 2000, Public Use Microdata Sample, 5 percent sample of the population.

25
Table 5
Estimates of Standard and ORU Models of Earnings by Nativity, Highly-Skilled (Master’s or Higher Degree) 25-64 Year Old Males, 2000 US Census
Native Born Foreign Born Variable Standard ORU Standard ORU Constant 3.775
(26.57) 3.695
(26.72) 5.663* (49.87)
5.231* (46.52)
Educational Attainment
0.110 (19.37)
(a) 0.055* (13.43)
(a)
Usual Level of Education
(a) 0.132 (23.67)
(a) 0.091* (22.00)
Years of Over-education
(a) 0.027 (4.50)
(a) -0.018* (4.20)
Experience 0.069 (31.39)
0.069 (32.16)
0.034* (18.51)
0.041* (22.75)
Experience Squared/100
-0.154 (27.66)
-0.153 (28.14)
-0.076* (16.62)
-0.087* (19.51)
Log Weeks Worked
1.056 (39.25)
1.024 (38.85)
0.936* (45.18)
0.909* (44.64)
Married 0.326 (27.87)
0.295 (25.78)
0.268* (26.89)
0.245* (25.11)
South -0.030 (2.97)
-0.033 (3.27)
-0.054 (5.93)
-0.049 (5.53)
Metropolitan 0.336 (20.66)
0.331 (21.06)
0.097* (3.71)
0.133* (5.28)
Veteran of US Armed Forces
-0.020 (1.49)
0.000 (0.03)
-0.153* (5.91)
-0.132* (5.28)
Black -0.179 (7.81)
-0.143 (6.39)
-0.368* (24.02)
-0.334* (22.59)
English Very Well -0.072 (2.96)
-0.060 (2.51)
-0.094 (8.30)
-0.078 (6.97)
English Well -0.026 (0.44)
-0.011 (0.19)
-0.424* (29.36)
-0.336* (23.54)
English Not Well/Not at All
-0.191 (2.00)
-0.021 (2.17)
-0.816* (35.27)
-0.590* (25.38)
Years Since Migration (YSM)
(a) (a) 0.016 (11.51)
0.016 (12.21)
YSM Squared/100 (a) (a) -0.017 (6.22)
-0.021 (7.92)
Citizen (a) (a) 0.068 (6.08)
0.053 (4.86)
Adjusted 2R 0.221 0.251 0.269 0.307 Sample Size 36,572 36,572 47,539 47,539
Notes: Heteroskedasticity-consistent ‘t’ statistics in parentheses; RM = Realized Matches, * = Estimated coefficient for the foreign born is significantly different from that for the native born. Source: US Census of Population, 2000, Public Use Microdata Sample, 5 percent sample of the population.

26
The payoff to actual years of education is 11.1 percent for the native born and
10.6 percent for the foreign born. These estimates are greater than those for the full
sample of all male workers (of 10.3 and 5.3 percent, respectively), indicating a non-
linearity in the returns to education, particularly among the foreign born. At first glance
this might suggest that the limited international transferability of formal schooling is less
of an issue for high-skilled immigrants than for less-skilled immigrants. Chiswick and
Miller (2008), however, present a decomposition of the lower payoff to schooling for the
foreign born than for the native born into components due to the international
transferability of human capital skills and due to selection in migration. They suggest
that the latter factor, which is likely to be more prevalent among the less-well educated, is
of far greater importance than the former factor. The finding in Table 4, which excludes
those with less than a Bachelor’s degree, appears to reinforce the findings from the
Chiswick and Miller (2008) analyses.
The payoff to labor market experience is higher in the analyses for the high-
skilled group of workers than for all workers. It is 3.26 percent for native-born skilled
workers per year of experience (evaluated at 10 years) compared to 2.20 percent for all
native-born workers. The payoff to pre-immigration labor market experience is 1.62
percent for foreign-born skilled workers, compared to 0.86 percent for all foreign-born
workers. Thus, there appear to be complementarities between formal education and labor
market experience, particularly among the foreign born. This suggests that with
additional years of formal schooling, immigrants receive greater earnings for skills
acquired on the job prior to immigration.

27
The earnings payoff to an additional year of living in the US, holding constant
total labor market experience, among the high-skilled immigrants is 0.80 percent, which
is about the same as that (0.82 percent) received by all immigrants.
Finally, the earnings penalties associated with limited English skills are greater
when the focus is on skilled immigrants than when all immigrants are considered. For
example, among immigrants, skilled workers who self report that they speak English well
have earnings 40 percent less than the earnings of skilled immigrants who speak only
English at home. When all immigrants are used in the analysis, this earnings penalty was
only 25 percent. To put this another way, among the immigrants there is evidence of a
complementarity between English language skills and formal education, with there being
a greater earnings return to English proficiency among skilled immigrants. Among the
native born, almost all of whom speak only English at home, regardless of schooling
level, the change in sample from all workers to skilled workers (BA and above) is
associated with only minor changes to the estimated coefficients of the English language
variables.
The coefficients on the ORU variables in Table 4 differ by up to four percentage
points compared to those in a regression for all male workers (compared with Chiswick
and Miller, 2008). Thus, the payoff to years of usual education, as measured by the
realized matches (RM) procedure, falls by two to three percentage points when the focus
is shifted from all workers to workers with at least a Bachelor’s degree, whereas the
payoff to years of surplus schooling falls by up to four percentage points.14
14 Chiswick and Miller (2008) report estimated effects of the required level of education on earnings of 0.154 for all native-born workers and 0.153 for all foreign-born workers. Their estimates of the effects of surplus years of schooling on earnings were 0.056 for the native born and 0.044 for the foreign born.

28
Table 5 lists results for the more stringent definition of skilled workers, that is, of
workers with a Master’s, Professional, or Doctorate degree. These findings show that the
payoff to education is 11 percent for the native born and only 5.5 percent for the foreign
born. This difference in the payoff to education is comparable to that reported from the
analyses based on all workers, but contrasts with the findings for workers with a
Bachelor’s degree or higher (Table 4), where the payoffs for the native born and foreign
born are about the same, at 11 percent. This difference may be due to the relatively high
earnings among the native born with a Professional degree, which involves fewer years of
schooling than a Doctorate, compared to those with a Doctorate, and their greater
numerical importance when the more stringent definition of skilled workers is used.15
The payoff to a year of labor market experience (evaluated at 10 years) for native-
born workers with a Master’s or higher degree is 3.82 percent, about 17 percent higher
than the 3.26 percentage point effect for native-born workers with at least a Bachelor’s
degree. Among the foreign born, however, the payoffs to experience acquired in the
country of origin and in the US for the high-skilled group in Table 5 are slightly higher
than the payoffs established using the broader definition of skilled immigrants in Table
4.16 However, the earnings effects associated with very limited English language skills
are greater among immigrants with a Master’s or higher degree than were reported in
15 The mean earnings in 1999 for Bachelor’s degree, Master’s, Professional and Doctorate are $72,067, $88,168, $111,730, and $82,521 for the adult male native born, and $65,163, $78,393, $92,011, and $78,650 for the adult male foreign born. Especially for the native born, earnings are very high for those with a Professional degree. 16 The payoff to origin country experience (evaluated at 10 years) is 1.88 percent in the Table 5 estimates compared to 1.62 percent in the Table 4 estimates. The premium to experience (evaluated at 10 years) acquired in the US is 1.26 percent in the Table 5 results, compared to 0.80 in the Table 4 results.

29
Table 4. This further emphasizes the complementarity between formal schooling and
English language proficiency in the immigrant workforce.
C. Analyses by Occupation
Are there some occupations where surplus skills can be used more effectively
than elsewhere in the economy? This can be captured in the ORU model via a smaller
gap between the payoffs to the years of education that are usual for a worker’s occupation
and to years of education that are considered surplus in the occupation.17
The coefficients on the education variables (actual years of schooling, years of
usual schooling and years of over-education) for each skill-birthplace group are presented
in Appendix B. Sets of simple correlations between the estimated coefficients on the
various education variables are presented in Table 6 (Bachelor’s degree and above) and
Table 7 (Master’s degree and above). Figures below the diagonal in each of these tables
are for the foreign born, and these are shaded; figures above the diagonal are for the
native born. Correlations with the mean level of schooling in the occupation (computed
by birthplace) are also provided to illustrate how these payoffs vary with the educational
level of the occupation.
Consider the findings for the foreign born with a Bachelor’s or higher degree
(Table 6). The payoff to actual years of education within the broad occupational category
ranges from zero, and very small positive amounts, in a number of occupations to 17.4
percent (Healthcare Practitioners and Technical) (Appendix Table B.1). Education is
rewarded more highly in the more skilled occupations. Thus, there is a simple correlation
17 There are 22 Census major non-military occupations. Due to the absence of variation in the usual level of schooling within two of these occupations, the analyses in this sub-section are performed on 20 occupations.

30
coefficient of 0.72 between the payoff to actual years of education and the mean level of
education (as a measure of overall skill) in the occupation. The mean payoff to actual
years of education for the 20 occupations is 7.3 percent, which is 3.3 percentage points
less than the 10.6 percent reported in the pooled (across occupations) analyses in Table
4.18 This shows that about one-third of the payoff to schooling among skilled immigrants
is due to inter-occupational mobility across the Census major group occupations.
Table 6(a)
Correlation Coefficients among Payoffs of Education and Mean Level of Education from Analyses Disaggregated by Occupation, Skilled (Bachelor’s or Higher Degree)
25-64 Year Old Males, 2000 US Census FB\NB(b) EDUC USUAL OVER GAP MEAN EDUC - 0.49* 0.18 0.24 0.84* USUAL 0.52* - 0.41 0.46* 0.19 OVER 0.52* 0.15 - -0.63* 0.08 GAP 0.19 0.85* -0.40 - 0.08 MEAN 0.72* 0.11 0.31 -0.07 - Notes: (a) Based on Realized Matches procedure; Shaded cells are correlations for the foreign born.
(b) EDUC=payoff to actual years of schooling; USUAL=payoff to usual years of schooling; OVER=payoff to years of surplus schooling; UNDER=earnings penalty to years of under-education; MEAN=mean educational attainment of occupation; GAP=difference between payoff to usual and surplus years of schooling; * = significant at the 5 percent level.
Source: Appendix B.
The payoff to years of usual education within the broad occupational category are
listed in the second column (Appendix Table B.1). There is one negative payoff to usual
education—for the Community and Social Services occupation. This is due to the
combination of relatively low earnings and high usual level of education for the clergy.
Apart from this anomaly, the payoff to usual education ranges from zero (Arts, Design,
Entertainment, Sports and Media; Personal Care and Services and Construction and
Extraction) to 25.6 percent in Architecture and Engineering among those with a 18 All means in this section are weighted by the number of workers in the occupation.

31
Bachelor’s or higher level of schooling. The payoff to usual education is positively
correlated across occupations with the payoff to actual years of education (r = 0.52).
However, there is no association between the payoff to usual education and the mean
level of education in the occupation (r = 0.11). The mean payoff to usual years of
education across the 20 occupations is 14.9 percent, which is of the same order of
magnitude as the 14.0 percent reported in Table 4. The usual education variable takes into
account movements, within the sample analyzed, to occupations where the worker’s
schooling is at the usual level. Thus, the fact that there is little change in the payoffs to
usual schooling when the Census major group occupations are held constant suggests that
the payoff to matching mainly occurs within the Census major group occupations, rather
than across these occupations. Schooling may be used to qualify for a higher status
occupation, but there is a sorting/matching process within these occupations that is very
important to the earnings determination process.
The payoff to years of over-education range from zero (in eight occupations) to
over 15 percent (Education, Training and Library, and Healthcare Support). The mean
payoff to years of over-education is 5.2 percent, which compares favorably with the 4.6
percent for the analyses across occupations in Table 4.
The absence of a pattern to the ways the payoffs to years of surplus education and
usual education change across occupations shows up clearly when the gap between these
payoffs is linked to the mean level of schooling: the simple correlation coefficient is
0.07− . That is, surplus schooling is not used effectively in high-skilled occupations, as is
also the case in less-skilled occupations.

32
Similar patterns are evident for the native born, for the highly skilled groups, and
for when the Worker Self-Assessment (WSA) procedure is used to construct the usual
level of schooling for each occupation (Chiswick and Miller 2009b). This reinforces the
conclusion that there is minimal evidence that some sections of the economy are immune
from the ineffective use of surplus schooling. Whether this conclusion carries across to
all levels of schooling is considered in the next section.
Table 7(a)
Correlation Coefficients among Payoffs of Education and Mean Level of Education from Analyses Disaggregated by Occupation, Highly-Skilled (Master’s or Higher
Degree) 25-64 Year Old Males, 2000 US Census FB\NB(b) EDUC USUAL OVER GAP MEAN EDUC - 0.49* 0.77* -0.12 0.73* USUAL 0.54* - 0.18 0.73* 0.47* OVER 0.92* 0.46* - -0.54* 0.29 GAP -0.19 0.68* -0.34 - 0.20 MEAN 0.59* 0.07 0.33 -0.20 - Notes: (a) Based on Realized Matches procedure; Shaded cells are correlations for the foreign born.
(b) See Table 5. Source: Appendix B.
D. Analyses by Level of Education
Vahey’s (2000) theoretical estimating equation includes dichotomous variables
for each level of over-education and under-education for a given level of usual education.
In other words, for a usual level of education of a Bachelor’s degree, for example,
workers who hold a Master’s degree would be represented by one dichotomous over-
education variable, those who hold Professional degrees by a separate dichotomous over-
education variable, and workers who hold a Doctorate by a further separate dichotomous
over-education variable. Similarly for under-educated workers, and also for the other
usual levels of education. In some instances, however, this flexible approach would

33
result in very small samples in specific over-education and under-education groups.
Indeed, for this reason Vahey (2000) considered only one variable for over-education and
one for under-education at each usual level of education.
In the current analysis, however, the maximum detail on the extent of over-
education is incorporated into the estimating equation. This follows from the aim of the
section, which is to assess whether the difficulties in using surplus education are equally
prevalent across all levels of education. These analyses are undertaken only for the
sample of skilled workers with at least a Bachelor’s degree.
Given the array of findings from this approach, a graphical presentation of the
main results will be used. Figure 3 presents the relevant findings for the foreign born,
and Figure 4 provides comparable results for the native born using the realized matches
approach.
Figures 3 and 4 have the natural logarithm of earnings on the vertical axis, and the
usual level of education in the occupation on the horizontal axis.19 Earnings by usual
level of education profiles are presented for each of four actual levels of education:
Bachelor’s degree, Master’s degree, Professional qualifications and Doctorates. The first
line to consider is the short line for workers with a Bachelor’s degree that truncates at a
usual level of education in the occupation of a Bachelor’s degree, and which has the
letters A-B-C positioned on it.
19 In this presentation, Doctorates are ranked above Professional qualifications, based on the typical years of formal schooling. If post-qualification training as residents/interns by physicians is considered formal schooling rather than on-the-job training, Professional qualifications might be ranked above Doctorates. This alternative ranking would reduce or remove the anomaly associated with the comparison of points E and F.

34
Figure 3
Results from Flexible Specification of ORU Model in Equation 2 for Foreign Born, based on Realized Matches Procedure
9.810
10.210.410.610.8
1111.211.4
12 14 Bachelor's Master's Professional Doctorate
Usual Education in Occupation
Log
Earn
ings
Bachelor's Master's Professional Doctorate
Source: US Census of Population, 2000, Public Use Microdata Sample, 5 percent sample of the population.
B
C F
E
D
A

35
9.810
10.210.410.610.8
1111.211.4
12 14 Bachelor's Master's Professional Doctorate
Usual Education in Occupation
Log
Earn
ings
Bachelor's Master's Professional Doctorate
Figure 4 Results from Flexible Specification of ORU Model in Equation 2 for Native Born, based on Realized Matches Procedure
Source: US Census of Population, 2000, Public Use Microdata Sample, 5 percent sample of the population.
B
C
D
E
F
A

36
If workers with a Bachelor’s degree are employed in an occupation where the
usual level of education is a Bachelor’s degree, they will be correctly matched in terms of
educational attainment. There are represented in Figure 3 by the point C. If workers with
a Bachelor’s degree are employed in an occupation where the usual level of education is
12 or 14 years then they will be over-educated. Workers in these situations are
represented in Figure 3 by the points A and B, respectively. The highest earnings among
workers with a Bachelor’s degree occur when these workers are correctly matched, that
is, they are working in occupations in which the usual level of education is a Bachelor’s
degree (point C). The over-educated workers earn considerably less than the correctly
matched workers (21 percentage points lower earnings if working in an occupation where
the usual level of schooling is 14 years, at point B, and 45 percentage points less if
working in an occupation where the usual level of schooling is 12 years, at point A). The
fact that points A and B are lower than point C shows that, among holders of Bachelor’s
degree, years of surplus education are not used as effectively in the labor market as are
years of correctly matched education.
Now consider the earnings by usual level of education profile for individuals who
possess a Master’s degree. This is the dotted line that truncates at point D. Across the
usual education levels of 12 years to a Bachelor’s degree, where workers with a Master’s
degree would be over-educated, this profile is a little above the profile for workers who
possess a Bachelor’s degree, and is essentially parallel. There is thus some advantage to
having a Master’s degree rather than a Bachelor’s degree if over-educated. Note,
however, that the higher qualification does not greatly assist in overcoming the
difficulties degree-qualified workers have in getting adequate reward for their schooling

37
if they are working in an occupation that results in them being classified as over-
educated.
The foreign-born men with a Master’s degree who are correctly matched to the
usual educational requirements of their job earn less than workers who have Master’s
degrees and who work in jobs that require only a Bachelor’s degree. The Master’s degree
appears to offer access to a particular set of occupations that are relatively poorly paid
(school teachers, social workers, etc.). This may explain why only nine percent of the
foreign-born workers with a Master’s degree are correctly matched in terms of levels of
education.
Foreign-born workers with either Professional qualifications or Doctorates (the
lines truncating with the letters E and F, respectively) earn amounts similar to workers
with either a Bachelor’s degree or a Master’s degree when working in occupations where
the usual level of education is from 12 years of education to a Bachelor’s degree.
Compared to when working in occupations where a Bachelor’s degree is usual, if they
work in an occupation where a Master’s degree is usual they earn less. They earn more,
however, than workers with a Master’s degree who work in an occupation where the
usual level of education is a Master’s degree. These slightly higher earnings are the
modest rewards to the surplus years of education.
Workers with a Professional degree who are correctly matched to the usual
educational requirements of their jobs have very high earnings (point E) whereas
workers with a Doctorate who are correctly matched (point F) have much more modest
salaries. It is noted that those with Doctorates working in occupations where the usual
level of education is a Professional qualification actually earn more than their

38
counterparts who work in occupations where a Doctorate is the usual level of education.20
Again, this evidence shows that earnings follow the usual level of education in the
occupation rather than the actual years of education for the individual. It is where you
work that governs your relative success in the labor market rather than simply your years
of education, although it is years of education that, in part, influences where you work.
Thus, these analyses show that if a skilled worker works in an occupation that
requires between 12 years of education and a Bachelor’s degree, any surplus years of
schooling will be used ineffectively, and the extent of ineffectiveness is largely invariant
to the actual level of schooling. In the small group of occupations with usual levels of
schooling greater than a Bachelor’s degree, the pattern of earnings effects is irregular.
But they clearly support the view of earnings being more strongly related to the usual
level of education for the job than to the individual’s actual years of education.
For the native-born high-skilled workers, information on the earnings rewards to
over-education and correctly matched education by the level of schooling is presented in
Figure 4. The earnings by usual level of education profiles for each of the levels of
schooling, Bachelor’s, Master’s, Professional and Doctorates, for the native born are
largely the same as those discussed for the foreign born. Thus, the ineffective use of
surplus years of schooling that occurs at each level of schooling is not a foreign-born
phenomenon: it is a labor market phenomenon.
20 To ascertain if the relatively poor earnings outcome for Doctorates was simply linked to either low salaries in the education sector or misreporting of weeks worked in that sector, a dichotomous variable for employment in the education industry was included in the model. This variable was associated with coefficients of -0.154 among the native born, and -0.192 among the foreign born. This change in the specification was associated with a four (native born) to eight (foreign born) percentage point improvement in the ceteris paribus earnings of Doctorates compared to workers who hold Bachelor’s degrees, but little change in the relative standing of workers with Professional qualifications and Doctorates.

39
E. Analysis of Effect of Education by Duration of Residence
The analysis can be extended by asking whether the effect of education on
earnings varies systematically with duration of residence in the United States. To answer
this question, the education variables in the standard and ORU equations are interacted
with the variables for duration and duration squared. These interaction terms are highly
statistically significant (regression equations available on request). Based on these
regression equations, Figures 5 and 6, respectively, plot the partial effects of education on
earnings with respect to years since migration for immigrants with at least a Bachelor’s
degree and at least a Master’s degree. The effects of education on earnings for
educational attainment (standard analysis) and for usual level and years of over-education
(ORU analysis) show that the partial effects increase, but at a decreasing rate, with
duration in the US. That is, the effect of schooling on earnings becomes greater with a
longer residence.
Note, however, that the partial effects are systematically higher for the usual level
of education than for the respondent’s actual level of schooling. Most dramatic, however,
is the consistently very low effect on earnings of years of over-education throughout the
range of years since migration. Indeed, the effect of over-education on earnings is in fact
negative until about 9 years in the US for those with at least a Bachelor’s degree, and is
negative until about 20 years duration for those with at least a Master’s degree.

40
Figure 5
Partial Effects of Education on Earnings By Duration in the United States, Bachelor’s Degree and Higher Levels of Education,
Foreign-Born Adult Males
-0.1
-0.05
0
0.05
0.1
0.15
0.2
0.25
1 5 9 13 17 21 25 29
Years since Migration
Ret
urns
to E
duca
tion
Educational Attainment Usual Level of Education Years of Overeducation
Source: US Census of Population, 2000, Public Use Microdata Sample, 5 percent sample of the population.
Figure 6
Partial Effects of Education on Earnings By Duration in the United States, Master’s Degree and Higher Levels of Education,
Foreign-Born Adult Males
-0.1
-0.05
0
0.05
0.1
0.15
0.2
1 5 9 13 17 21 25 29
Years since Migration
Ret
urns
to E
duca
tion
Educational Attainment Usual Level of Education Years of Overeducation
Source: US Census of Population, 2000, Public Use Microdata Sample, 5 percent sample of the population.
41
VII. SUMMARY AND CONCLUSION
This paper is concerned with the extent and consequences for earnings of the
mismatch of the educational attainment (measured by formal schooling) and the
occupation of employment among high-skilled adult male immigrants in the United
States. The “Over-Required-Under” education decomposition methodology is employed
with mismatches identified based on a “realized matches” approach (modal educational
level in the occupation). The empirical analyses focus on the foreign born, but for
comparative purposes parallel analyses are conducted for the native born. The empirical
analysis is conducted using the 2000 US Census of Population, 5 percent microdata file.
High-skilled immigrants are identified as those with at least a Bachelor’s degree, and a
higher bar, at least a Master’s degree, is the threshold for parallel analyses.
While there has been a long history of high-skilled migration to the United States,
the provisions of the 1990 Immigration Act increased the number of permanent and
temporary visas to the United States for these workers. In 2007, of the nearly 1.1 legal
immigrants, 162,000 received a permanent resident visa under an employment-based
category, of whom about half were the spouses and minor children of the principal
applicants.
Educational mismatches refer to the difference in the educational attainment of a
worker and the usual or typical (modal) level of education of those working in the
occupation. These mismatches can arise from several causes, including occupational
skill upgrading for younger cohorts of workers, and unmeasured worker productivity
characteristics that may be positive or negative. In addition, among immigrants
mismatches may arise from the limited international transferability of skills and

42
selectivity in migration, in addition to labor market discrimination against immigrants. It
would be expected that among both the native born and the foreign born there would be
“mismatches,” that is both “over-educated” and “under-educated” workers.
The empirical analysis necessitates the identification of a required or usual level
of education in each occupation. A “realized matches” approach is used, where this
refers to what actually occurs in the labor market, as reflected by the modal level of
schooling in each of the approximately 500 occupations identified in the 2000 Census.
Over all educational levels, among adult men, there are greater mismatches
among the immigrants than among the native born. Among the immigrants, only 26
percent were correctly matched (compared to 40 percent for the native born), with 45
percent under-educated and 29 percent over-educated (in contrast to 26 percent and 33
percent, respectively, for the native born). Among the high-skilled workers, however, 63
percent of immigrants with a Bachelor’s degree or higher were over-educated (50 percent
for the native born), while among those with a Master’s degree or higher, fully 79 percent
were over-educated (70 percent for the native born). Nearly all of the rest were correctly
matched – their own education was equal to that of the modal education in their
occupation. Except for the immigrants who arrived in the 1990’s, the extent of correct
matching of education and occupation increases with the duration in the US. Thus,
among the highly educated, particularly among immigrants, there is a high degree of
“surplus” education. But is this surplus education wasted?
When the analysis of earnings is limited to those with a Bachelor’s degree or
more schooling, earnings increase by about 11 percent per year of schooling among the
foreign born and the native born. If years of education is divided into years of usual

43
(modal) education in the worker’s occupation and years of over-education, the effect on
earnings of usual education is about 13 percent for both nativity groups, whereas the
effect of years of over-education is about 2 percent per year for both groups. Thus,
whereas the return to years of required or usual schooling is high, the returns to education
in excess of what is needed for one’s occupation are extremely low.
When the high-skilled are limited to those with educational credentials beyond the
Bachelor’s degree (i.e., only those with Master’s, Professional, and Doctorate degrees),
the educational coefficients are less stable, but yet they tell a similar story – high rates of
return to years of usual education, with extremely low returns (negative for the
immigrants) for years of over-education.
When separate analyses are conducted by broad occupational categories, similar
patterns emerge – in general a high return to years of usual education and very little or no
returns to surplus or over-education. When analyses are performed by educational level,
the most striking feature is that perhaps the group with the greatest number of years in
school (those who receive a Doctorate) tend to have relatively low earnings compared to
those whose highest degree is a Professional degree. The return to surplus education is
actually negative in the first 10 to 20 years in the US among high-skilled immigrants.
After that it becomes positive but remains very small.
The very low return to years of over-education indicates that, among the highly
educated, educational attainments beyond what is required for the occupation in which
one works are not productive. This is true for the native born as well as for the foreign
born. It means that earnings are far more influenced by the educational norms in one’s
occupation, as distinct from one’s own educational level.

44
The private and social losses in economic welfare are substantial from workers
(whether native or foreign immigrant) not being employed in the higher level occupations
that might make better use of their educational credentials.
This has implications for immigration and absorption policy. It suggests that, in
general, employment-based immigrant visas are more likely to attract the high-skilled
immigrants who are more likely to be working in jobs better matched to their educational
attainment than would be the case for family or refugee visa recipients. An employer
sponsored targeted employment approach might result in a better matching than one that
does not require an employment sponsor. Even a point system for rationing visas, as
used in Canada and Australia, might be improved by adding a set of points for pre-
arranged employment, or for having a particular set of skills in high demand.21
Moreover, proactive efforts to facilitate the adjustment of high-skilled new
immigrants in the labor market might be most productive. These could include specific
programs for: English-language training, obtaining a US certification or occupational
license, or merely teaching new immigrants how to navigate the job search process in
one’s occupation in the US.
The analyses reported above focus on high-skilled male immigrants, and are
based on a single cross-section of data, the 2000 Census. They demonstrate that
including demand-side considerations (i.e., the usual level of education in the occupation)
in addition to the usual supply-side factors (the actual educational attainment of workers)
21 The points test used in Australia at present, for example, allocates points for “specific employment”, which is defined as employment, for at least three of the four years immediately before application for a visa, in an occupation on a government determined “skilled occupation list”. Further points are allocated for “Occupation in demand (and job offer)”, where the occupations in demand are from a government determined “Migration Occupations in Demand List”.

45
has considerable merit. Many extensions to this research are possible, including
undertaking separate analyses for high-skilled females, analysis of low- and medium-
skilled workers, and the use of data from earlier censuses in synthetic cohort models.
Disaggregating the analysis by age at migration could permit differences in the effects of
schooling acquired in the US and schooling acquired abroad to be assessed. Conducting
separate analyses for each of the major foreign-born groups in the US, and relating the
estimates of the realized matches specification to characteristics of the immigrants’
countries of origin, such as the internationally standardized scores from the Programme
for International Student Assessment (PISA), may provide a means of determining the
influence of the quality of schooling acquired abroad on the estimated effects of surplus
schooling. The sensitivity of the estimates to the specification of the empirical model
(e.g., more extensive controls for region of residence, race, birthplace, as well as
interaction effects between the more important regressors) might also be considered.
These extensions form the basis of our current research program.

46
REFERENCES
Chiswick, Barry R., (1999). “Are Immigrants Favorably Self-Selected?”, American Economic Review, Vol. 89, No. 2, pp.181-185.
Chiswick, Barry R., (2008). “Are Immigrants Favorably Self-Selected? An Economic
Analysis”, Chapter 3 in Caroline B. Brettell and James F. Hollifield, Migration Theory: Talking Across Disciplines, 2nd Edition, New York: Routledge, pp.63-82.
Chiswick, Barry R. and Miller, Paul W., (2008). “Why is the Payoff to Schooling Smaller
for Immigrants?”, Labour Economics, Vol. 15, No. 6, pp.1317-1340. Chiswick, Barry R. and Miller, Paul W., (2009a). “The International Transferability of
Immigrants’ Human Capital Skills”, Economics of Education Review, Vol. 28, No. 2, pp.162-169.
Chiswick, Barry R. and Miller, Paul W., (2009b). "Does the Choice of Reference Levels
of Education in the ORU Earnings Equation Matter?”, Xerox, University of Illinois at Chicago.
Cohen-Goldner, Sarit and Weiss, Yoram, (2009). “The Impact of High-Skilled Russian Immigrants on the Israeli Labor Market”, paper presented at the AEI Conference on High-Skilled Immigration in a Globalized Labor Market, Washington DC, April. Cohn, Elchanan and Khan, Shahina, P., (1995). “The Wage Effects of Overschooling
Revisited”, Labour Economics, Vol. 2, pp.67-76. Duncan, Greg J. and Hoffman, Saul D., (1981), “The Incidence of Wage Effects of
Overeducation”, Economics of Education Review, Vol. 1, No. 1, pp.75-86. Ferrie, Joseph, (2009). “A Historical Perspective on High-Skilled Immigrants in the US,
1820-1920”, paper presented at the AEI Conference on High-Skilled Immigration in a Globalized Labor Market, Washington DC, April.
Hartog, Joop, (2000). “Over-education and Earnings: Where Are We, Where Should We
Go?”, Economics of Education Review, Vol. 19, No. 2, pp.131-147. McDonald, James Ted, Warmon, Casey and Worswick, Christopher, (2009). “Earnings,
Occupation, and Schooling Decisions of Immigrants with Medical Degrees: Evidence for Canada and the United States”, paper presented at the AEI Conference on High-Skilled Immigration in a Globalized Labor Market, Washington DC, April.
Remennick, Larissa, (2008). “Survival of the Fittest: Russian Immigrant Teachers in
Israeli Schools”, Paper presented at “The Conference on Understanding

47
Contemporary Migration: Challenges to Society”, Kibbutz Tsuba, Israel, November 19, 2008.
Rubb, Stephen, (2003). “Post-College Schooling, Overeducation, and Hourly Earnings in
the United States”, Education Economics, Vol. 11, No. 1, pp.53-72. Rumberger, Russell W., (1987). “The Impact of Surplus Schooling on Productivity and
Earnings”, The Journal of Human Resources, Vol. 22, No. 1, pp.24-49. Vahey, Shaun P. (2000). “The Great Canadian Training Robbery: Evidence on the
Returns to Educational Mismatch”, Economics of Education Review, Vol. 19, pp. 219-227.
Verdugo, Richard R. and Verdugo, Naomi T., (1989), “The Impact of Surplus Schooling
on Earnings: Some Additional Findings”, The Journal of Human Resources, Vol. 26, No. 4, pp.629-643.

48
APPENDIX A DEFINITIONS OF VARIABLES
The variables used in the statistical analyses are defined below. Data Source: 2000 Census of Population, Public Use Microdata Sample, 5 percent sample of the foreign born, and 0.15 percent random sample of the native born. Definition of Population: Native-born and foreign-born employed men aged twenty-five to sixty-four years. Dependent Variables Income in 1999 Natural logarithm of earnings in 1999 (where earnings
are defined as gross earnings from all sources).
Explanatory Variables Years of Education This variable records the total years of full-time
equivalent education. It has been constructed from the Census data on educational attainment by assigning the following values to the Census categories: completed less than fifth grade (2 years); completed fifth or sixth grade (5.5); completed seventh or eighth grade (7.5); completed ninth grade (9); completed tenth grade (10); completed 11th grade (11); completed 12th grade, no diploma (11.5); completed high school (12); attended college for less than one year (12.5); attended college for more than one year or completed college (14); Bachelor’s degree (16); Master’s degree (17.5); Professional degree (18.5); Doctorate (20). Further discussion of these years-of-schooling equivalents is presented in the text. Note: (a) As with other census data, the values for educational attainment are self-reported responses. While academic degrees may have required different years of schooling for immigrants educated in some countries of origin, US values are used in the analysis. (b) Sensitivity tests were performed using 18, 20 and 21 years of schooling for the Master’s, Professional and Doctorate degrees, respectively. The findings are essentially invariant with respect to this alternative set of years of schooling. Vocational and technical training for a specific trade that does not require an advanced degree beyond the Bachelor’s are excluded from professional degrees.

49
Means and standard deviations for these variables are presented below.
Usual Level of Education
This variable records the required years of education. It is constructed using the modal level of education of the native-born workers in the respondent’s occupation of employment based on the Realized Matches procedure.
Years of Over-education
The over-education variable equals the difference between the person’s actual years of education and the years of education required for the person’s job where this computation is positive. Otherwise, it is set equal to zero.
Weeks worked in 1999 This is a continuous variable for the numbers of weeks the individual worked in 1999.
Experience Age – Years of Education – 6.
Location The two location variables record residence in a metropolitan area or in the Southern States. The states included in the latter are: Alabama, Arkansas, Delaware, District of Columbia, Florida, Georgia, Kentucky, Louisiana, Maryland, Mississippi, Missouri, North Carolina, Oklahoma, South Carolina, Tennessee, Texas, Virginia, West Virginia.
Marital Status This is a binary variable that distinguishes individuals who are married, spouse present (equal to 1) from all other marital states.
Veteran This is a binary variable set equal to one for someone who had served in the US Armed Forces, and set equal to zero otherwise.
Race This is a dichotomous variable that distinguishes between individuals who are Black and all other races.
English Language Proficiency
Three dichotomous variables (speaks English very well; well; not well or not at all) are used to record the English language proficiency of the respondents.
Years Since Migration This is computed from the year the foreign-born person came to the United States to stay.
Citizenship This is a dichotomous variable set equal to one for foreign born who hold an US citizenship.

50
Appendix Table A-1
Means and Standard Deviations of Variables in Earnings Equation, for Workers Aged 25-64 with a Bachelor’s or Higher Degree
Variable Native Born Foreign Born Log Income 10.800
(0.98) 10.650 (1.03)
Educational Attainment
16.744 (1.10)
17.046 (1.29)
Usual Level of Education
15.335 (1.93)
15.121 (2.10)
Years of Over-education
1.447 (1.72)
1.960 (1.93)
Experience 20.008 (10.07)
18.332 (9.94)
Experience Squared 501.808 (426.05)
434.95 (410.70)
Log Weeks Worked 3.855 (0.34)
3.812 (0.40)
Married 0.704 (0.46)
0.695 (0.46)
South 0.330 (0.47)
0.272 (0.45)
Metropolitan 0.890 (0.31)
0.971 (0.17)
Veteran of US Armed Forces
0.192 (0.39)
0.045 (0.21)
Black 0.053 (0.22)
0.076 (0.27)
English Very Well 0.046 (0.21)
0.537 (0.50)
English Well 0.005 (0.07)
0.196 (0.40)
English Not Well/Not at All
0.004 (0.06)
0.060 (0.24)
Years Since Migration (YSM)
(a) 16.683 (11.82)
YSM Squared (a) 418.13 (526.92)
Citizen (a) 0.514 (0.50)
Sample Size 100,885 100,968

51
APPENDIX B Table B.1(a)
Selected Estimates from Standard and ORU Models of Earnings by Occupation, Skilled (Bachelor’s or Higher Degree) 25-64 Year Old Foreign-Born Males, 2000 US
Census Occupation
Educational Attainment
Usual Education
Over-education
Mean of Education
Sample Size
Management, Business and Financial Operations
0.078 (11.93)
0.175 (21.56)
0.050 (7.64)
16.914 15,175
Business and Financial Operations
0.099 (8.81)
0.149 (7.15)
0.098 (8.69)
16.762 7,171
Professional and Related 0.038 (6.47)
0.146 (13.27)
0.028 (4.76)
16.925 11,360
Architecture and Engineering
0.074 (14.32)
0.256 (21.21)
0.064 (12.27)
16.992 9,231
Life, Physical, and Social Science
0.054 (7.07)
0.039 (4.92)
0.047 (5.17)
18.464 3,133
Community and Social Services
0.004 (0.40)
-0.129 (6.66)
0.020 (1.45)
17.200 2,097
Legal 0.132 (5.78)
0.173 (6.82)
0.079 (2.08)
18.095 1,360
Education, Training, and Library
0.157 (28.57)
0.140 (13.07)
0.169 (22.53)
18.095 6,769
Arts, Design, Entertain., Sports, and Media
0.031 (1.62)
0.047 (1.51)
0.031 (1.63)
16.724 3,071
Healthcare Practitioner and Technical
0.174 (22.92)
0.224 (30.99)
0.016 (1.52)
18.023 9,384
Healthcare Support 0.156 (5.14)
0.209 (3.63)
0.152 (4.99)
16.978 495
Protective Service 0.016 (0.56)
0.159 (5.28)
0.002 (0.06)
16.515 1,088
Food Preparation -0.011 (0.61)
0.109 (3.45)
-0.014 (0.75)
16.549 1,901
Personal Care and Service 0.004 (0.12)
0.064 (1.78)
0.001 (0.05)
16.541 730
Sales and Related 0.051 (4.42)
0.155 (12.19)
0.045 (3.96)
16.545 9,578
Office and Administrative Support
0.053 (5.06)
0.172 (11.81)
0.053 (4.99)
16.546 5,506
Construction and Extraction -0.010 (0.57)
-0.005 (0.14)
-0.010 (0.57)
16.622 2,413
Installation, Maintenance, and Repair
0.034 (1.82)
0.062 (2.34)
0.036 (1.93)
16.524 2,230
Production, Transport. and Material Moving
0.069 (5.57)
0.092 (2.07)
0.069 (5.55)
16.583 3,824
Transportation and Material Moving
-0.005 (0.32)
0.130 (5.95)
-0.005 (0.34)
16.583 3,123
Notes: Based on Realized Matches Procedure; heteroskedasticity-consistent ‘t’ statistics in parentheses. Source: US Census of Population, 2000, Public Use Microdata Sample, 5 percent sample of the population.

52
Table B.2(a)
Selected Estimates from Standard and ORU Models of Earnings by Occupation, Skilled (Bachelor’s or Higher Degree) 25-64 Year Old Native-Born Males, 2000 US
Census Occupation
Educational Attainment
Usual Education
Over-education
Mean of Education
Sample Size
Management, Business and Financial Operations
0.065 (9.27)
0.133 (16.51)
0.017 (2.34)
16.627 19,193
Business and Financial Operations
0.080 (6.69)
0.157 (9.40)
0.077 (6.42)
16.486
9,722
Professional and Related 0.058 (5.67)
0.132 (9.23)
0.045 (4.41)
16.461 5,182
Architecture and Engineering
0.044 (4.94)
0.233 (15.06)
0.378 (4.22)
16.497
6,060
Life, Physical, and Social Science
0.087 (9.57)
0.080 (8.50)
0.093 (8.64)
17.469 2,398
Community and Social Services
0.061 (6.43)
-0.043 (3.10)
0.068 (4.96)
17.061 3,439
Legal 0.155 (7.92)
0.148 (6.40)
0.020 (0.57)
18.312 4,498
Education, Training, and Library
0.100 (21.71)
0.071 (7.50)
0.098 (16.03)
17.295 9,878
Arts, Design, Entertain., Sports, and Media
-0.029 (1.12)
0.008 (0.19)
-0.030 (1.16)
16.438
3,635
Healthcare Practitioner and Technical
0.230 (25.71)
0.263 (30.56)
0.081 (5.95)
17.898 6,299
Healthcare Support 0.233 (3.90)
0.073 (0.76)
0.228 (3.87)
16.776 226
Protective Service 0.007 (0.34)
0.115 (4.64)
0.012 (0.58)
16.269 2,499
Food Preparation -0.018 (0.46)
0.121 (2.35)
-0.013 (0.34)
16.279 731
Personal Care and Service 0.074 (1.63)
0.083 (1.71)
0.074 (1.63)
16.423 742
Sales and Related 0.024 (1.49)
0.127 (7.80)
0.022 (1.36)
16.287 11,704
Office and Administrative Support
0.048 (3.19)
0.160 (9.08)
0.041 (2.74)
16.349 5,299
Construction and Extraction 0.013 (0.57)
-0.021 (0.34)
0.012 (0.53)
16.316 2,183
Installation, Maintenance, and Repair
-0.050 (1.43)
-0.073 (1.90)
-0.049 (1.42)
16.268 1,439
Production, Transport. and Material Moving
0.023 (0.97)
-0.079 (0.63)
0.024 (1.01)
16.341 2,307
Transportation and Material Moving
-0.008 (0.28)
0.178 (6.64)
-0.012 (0.47)
16.299 2,406
Notes: Based on Realized Matches Procedure; heteroskedasticity-consistent ‘t’ statistics in parentheses. Source: US Census of Population, 2000, Public Use Microdata Sample, 5 percent sample of the population.

53
Table B.3(a)
Selected Estimates from Standard and ORU Models of Earnings by Occupation, Highly Skilled (Master’s or Higher Degree) 25-64 Year Old Foreign-Born Males,
2000 US Census Occupation
Educational Attainment
Usual Education
Over-education
Mean of Education
Sample Size
Management, Business and Financial Operations
0.033 (2.63)
0.149 (8.90)
0.026 (2.09)
18.010 6,883
Business and Financial Operations
0.022 (0.81)
0.142 (3.16)
0.020 (0.75)
17.881 2,912
Professional and Related -0.012 (1.16)
0.079 (4.37)
-0.020 (1.80)
17.866 5,677
Architecture and Engineering
0.056 (6.14)
0.276 (9.79)
0.055 (6.07)
18.037
4,478
Life, Physical, and Social Science
0.044 (3.61)
0.005 (0.34)
0.019 (1.26)
19.122 2,461
Community and Social Services
-0.008 (0.44)
-0.156 (4.81)
0.002 (0.13)
18.064 1,242
Legal 0.093 (2.04)
0.153 (2.85)
0.068 (1.20)
18.547 1,115
Education, Training, and Library
0.209 (25.22)
0.207 (14.20)
0.209 (22.02)
18.777
5,065
Arts, Design, Entertain., Sports, and Media
-0.010 (0.26)
0.064 (0.99)
-0.011 (0.28)
17.942 1,150
Healthcare Practitioner and Technical
0.029 (1.42)
0.156 (7.63)
-0.051 (2.44)
18.605 7,310
Healthcare Support 0.089 (1.24)
0.127 (1.44)
0.091 (1.28)
18.419 201
Protective Service -0.104 (1.42)
0.116 (1.57)
-0.110 (1.64)
17.968 284
Food Preparation 0.011 (0.21)
0.196 (2.88)
0.004 (0.08)
18.067 487
Personal Care and Service 0.034 (0.50)
0.085 (1.16)
0.038 (0.57)
18.150 184
Sales and Related -0.028 (1.01)
0.106 (3.61)
-0.016 (0.60)
17.867 2,807
Office and Administrative Support
0.032 (1.20)
0.182 (5.17)
0.052 (1.95)
17.971 1,517
Construction and Extraction
-0.125 (2.33)
-0.223 (2.66)
-0.129 (2.38)
18.016 751
Installation, Maintenance, and Repair
-0.073 (1.42)
-0.040 (0.62)
-0.070 (1.36)
17.938 611
Production, Transport. and Material Moving
0.059 (1.98)
0.008 (0.10)
0.061 (2.06)
18.026 1,089
Transportation and Material Moving
0.076 (1.85)
0.281 (6.70)
0.073 (2.13)
17.980 911
Notes: Based on Realized Matches Procedure; heteroskedasticity-consistent ‘t’ statistics in parentheses. Source: US Census of Population, 2000, Public Use Microdata Sample, 5 percent sample of the population.

54
Table B.4(a)
Selected Estimates from Standard and ORU Models of Earnings by Occupation, Highly Skilled (Master’s or Higher Degree) 25-64 Year Old Native-Born Males
Occupation
Educational Attainment
Usual Education
Over-education
Mean of Education
Sample Size
Management, Business and Financial Operations
0.003 (0.19)
0.059 (3.24)
-0.001 (0.04)
17.810 6,680
Business and Financial Operations
-0.020 (0.60)
0.072 (1.41)
-0.021 (0.61)
17.737 2,735
Professional and Related 0.018 (0.75)
0.054 (1.79)
0.012 (0.52)
17.806 1,337
Architecture and Engineering -0.008 (0.34)
0.155 (3.76)
-0.006 (0.25)
17.761 1,691
Life, Physical, and Social Science
0.096 (6.16)
0.093 (6.04)
0.107 (5.98)
18.588 1,328
Community and Social Services
0.013 (0.74)
-0.068 (2.81)
0.022 (1.22)
17.890 1,976
Legal 0.058 (1.47)
0.093 (2.20)
-0.018 (0.43)
18.546 4,100
Education, Training, and Library
0.110 (15.16)
0.087 (7.84)
0.125 (13.62)
18.165 5,770
Arts, Design, Entertain., Sports, and Media
-0.109 (1.54)
-0.188 (1.92)
-0.111 (1.57)
17.808 902
Healthcare Practitioner and Technical
0.123 (4.26)
0.205 (7.27)
0.011 (0.37)
18.541 4,714
Healthcare Support 0.451 (2.61)
-0.130 (0.59)
0.365 (2.32)
18.241 78
Protective Service -0.001 (0.02)
0.074 (0.98)
-0.007 (0.11)
17.696 397
Food Preparation -0.278 (2.62)
-0.200 (1.35)
-0.272 (2.56)
17.926 102
Personal Care and Service 0.010 (0.08)
0.046 (0.34)
0.023 (0.18)
17.846 174
Sales and Related -0.071 (1.39)
0.094 (1.80)
-0.043 (0.87)
17.714 1,964
Office and Administrative Support
-0.009 (0.23)
0.106 (2.23)
-0.002 (0.05)
17.791 1,034
Construction and Extraction 0.127 (2.27)
-0.021 (0.07)
0.125 (2.18)
17.884 371
Installation, Maintenance, and Repair
-0.134 (1.42)
-0.085 (0.79)
-0.136 (1.43)
17.826 208
Production, Transport. and Material Moving
0.028 (0.42)
0.127 (1.50)
0.023 (0.35)
17.834 414
Transportation and Material Moving
-0.130 (1.50)
0.112 (1.28)
-0.062 (0.75)
17.744 414
Notes: Based on Realized Matches Procedure; heteroskedasticity-consistent ‘t’ statistics in parentheses. Source: US Census of Population, 2000, Public Use Microdata Sample, 5 percent sample of the Population.


